Embed Size (px)
DESCRIPTION
Presentation by Iain Murray to the Institution of Gas Engineers (Australia) Inc., May 2014
Citation preview

1

2

Natural Gas (mainly methane) is held in Coal Matrix under pressure. Different to Conventional Gas – Porous sandstone capped by impermeable rockCoal is like a sponge that absorbs the gas in the coal matrix. Absorbed in mono‐molecular layer on surface of coal particleThe coal cleats and fractures are filled with water. Conditions – porosity – void space between grains that give the coal the capacity to retain fluidPermeability – how the pores are interconnected – ability to transmit or allow gas flow.
Coal Seams range from typically 2m to 20 m thickDepth: 200 m to 1,000 m
3

Gas is held in Coal Matrix under pressure – normally water pressure at depth under ground is enough to “hold” gas in coal pores. Absorbed in mono‐molecular layer on surface of coal particleThe coal cleats and fractures are filled with waterPumping the water to the surface reduces the pressure in the surrounding area and the gas then is able to diffuse from the coal pores
4
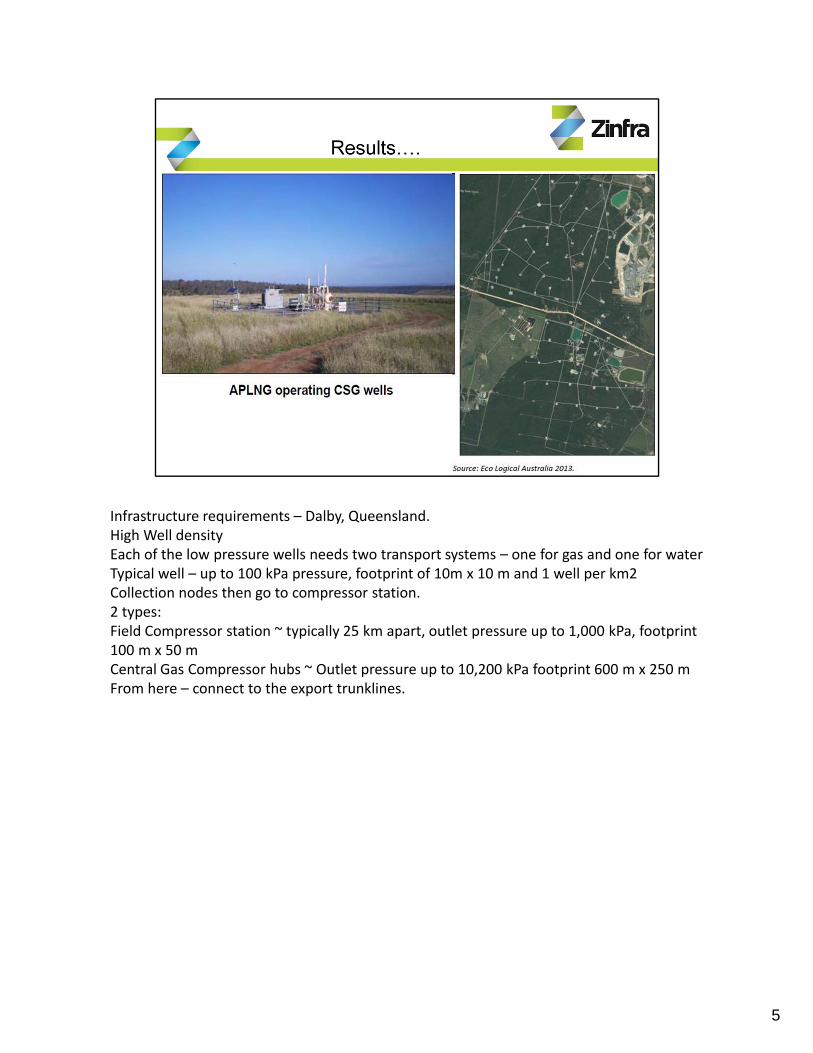
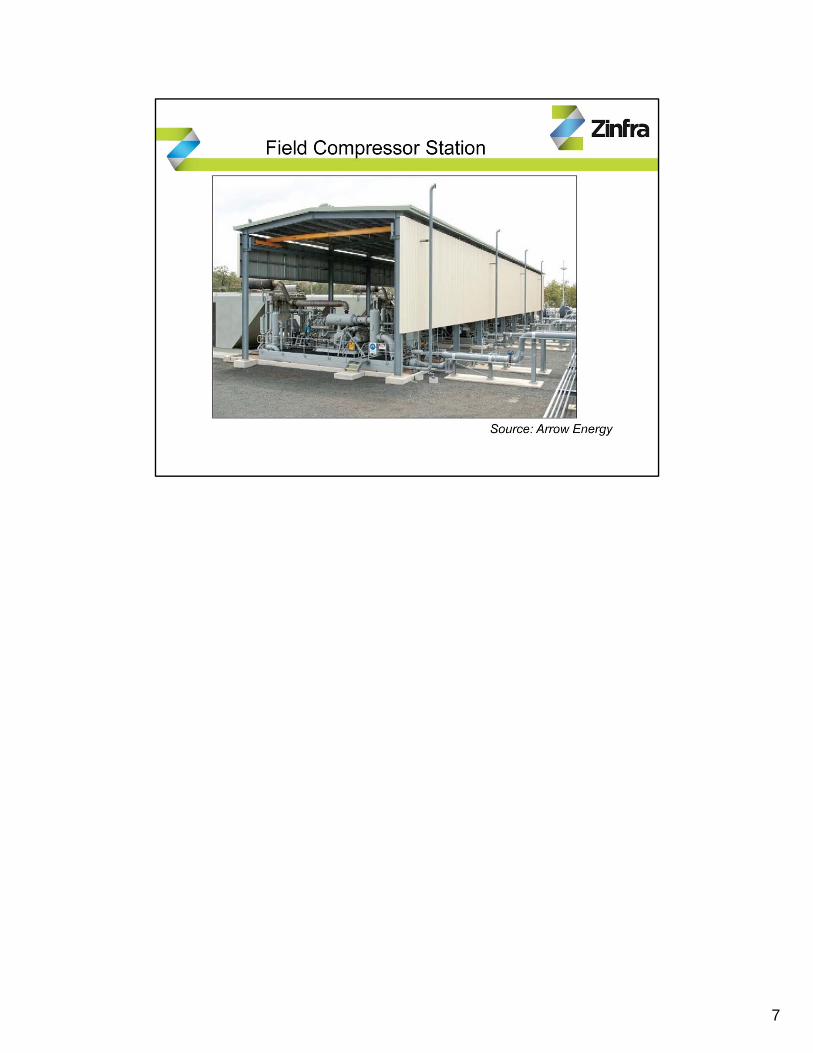
Infrastructure requirements – Dalby, Queensland.High Well densityEach of the low pressure wells needs two transport systems – one for gas and one for waterTypical well – up to 100 kPa pressure, footprint of 10m x 10 m and 1 well per km2Collection nodes then go to compressor station.2 types:Field Compressor station ~ typically 25 km apart, outlet pressure up to 1,000 kPa, footprint 100 m x 50 mCentral Gas Compressor hubs ~ Outlet pressure up to 10,200 kPa footprint 600 m x 250 mFrom here – connect to the export trunklines.
5

6
7
8
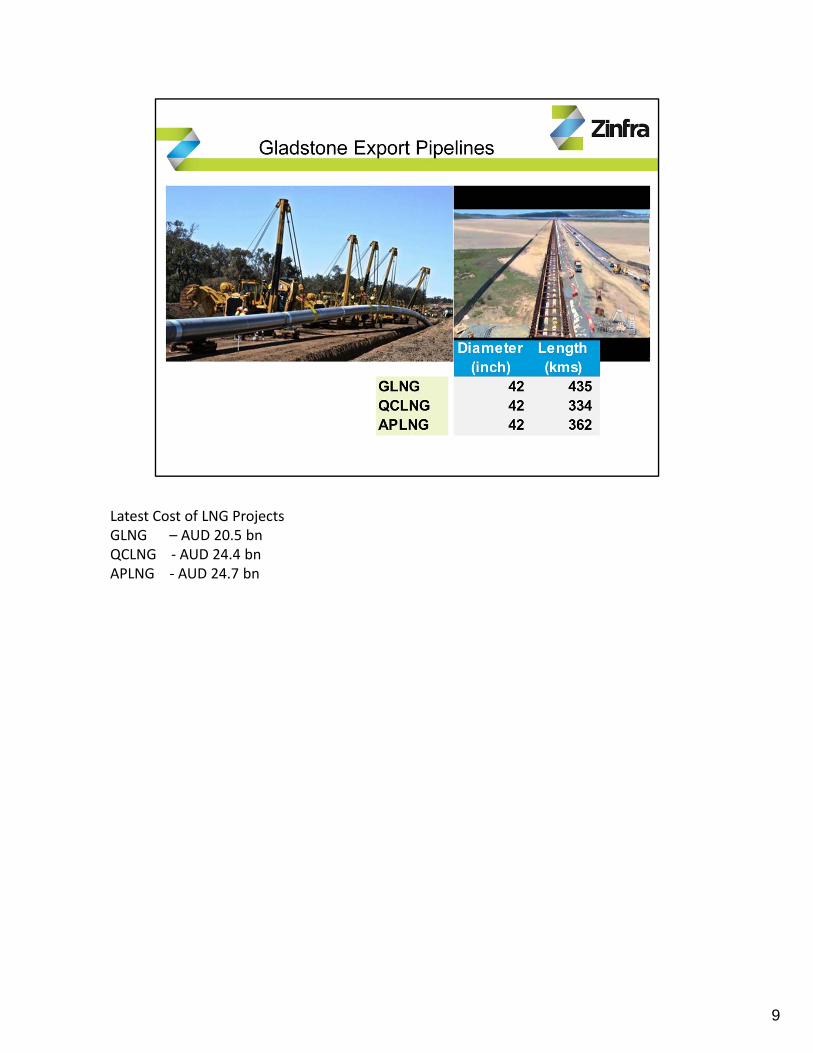
Latest Cost of LNG ProjectsGLNG – AUD 20.5 bnQCLNG ‐ AUD 24.4 bnAPLNG ‐ AUD 24.7 bn
9
10
11
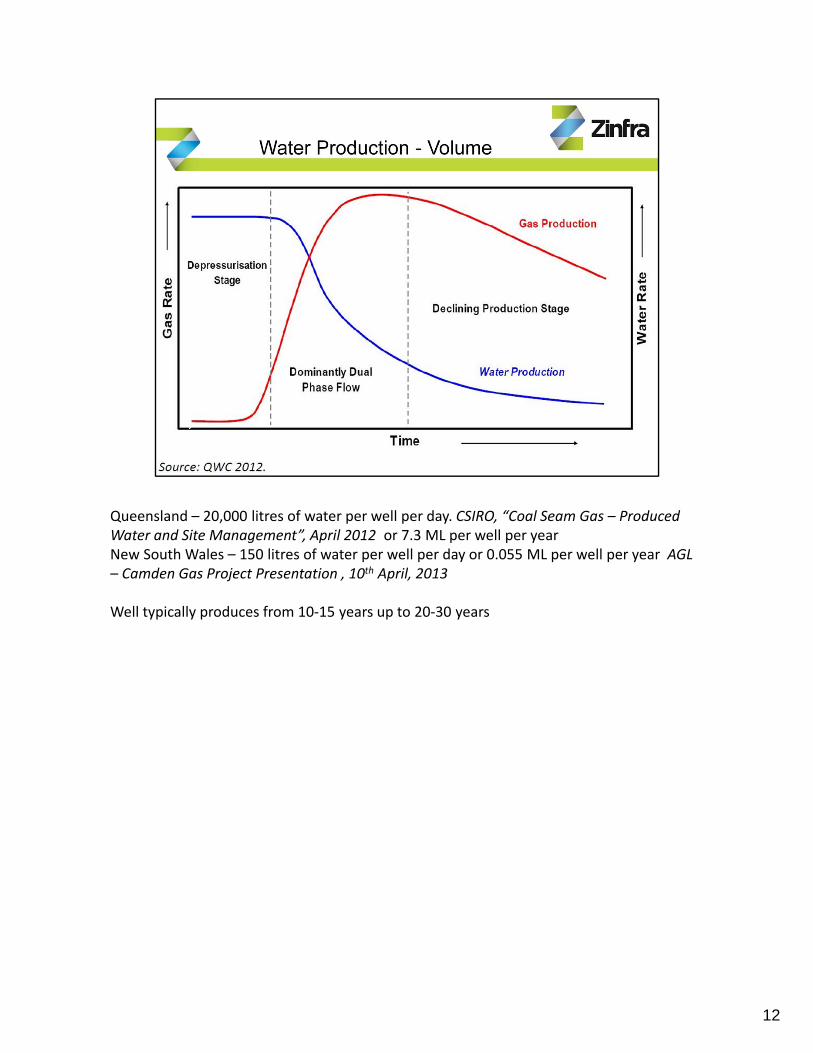
Queensland – 20,000 litres of water per well per day. CSIRO, “Coal Seam Gas – Produced Water and Site Management”, April 2012 or 7.3 ML per well per yearNew South Wales – 150 litres of water per well per day or 0.055 ML per well per year AGL – Camden Gas Project Presentation , 10th April, 2013
Well typically produces from 10‐15 years up to 20‐30 years
12
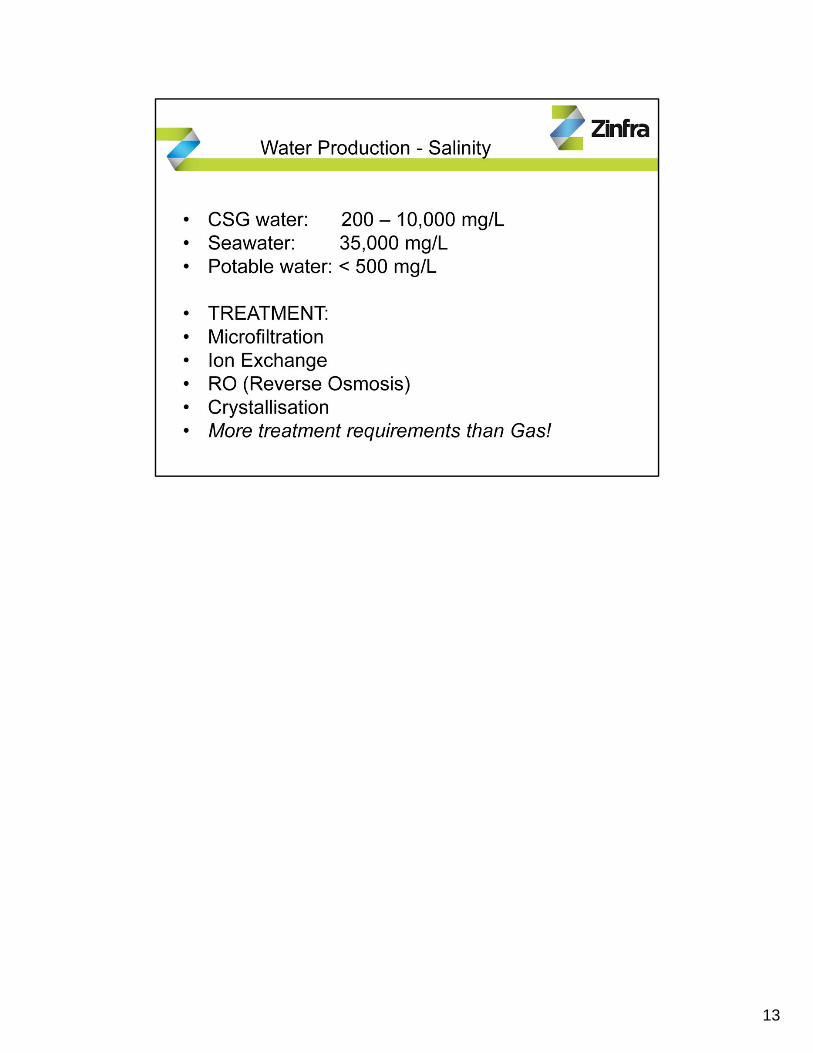
13
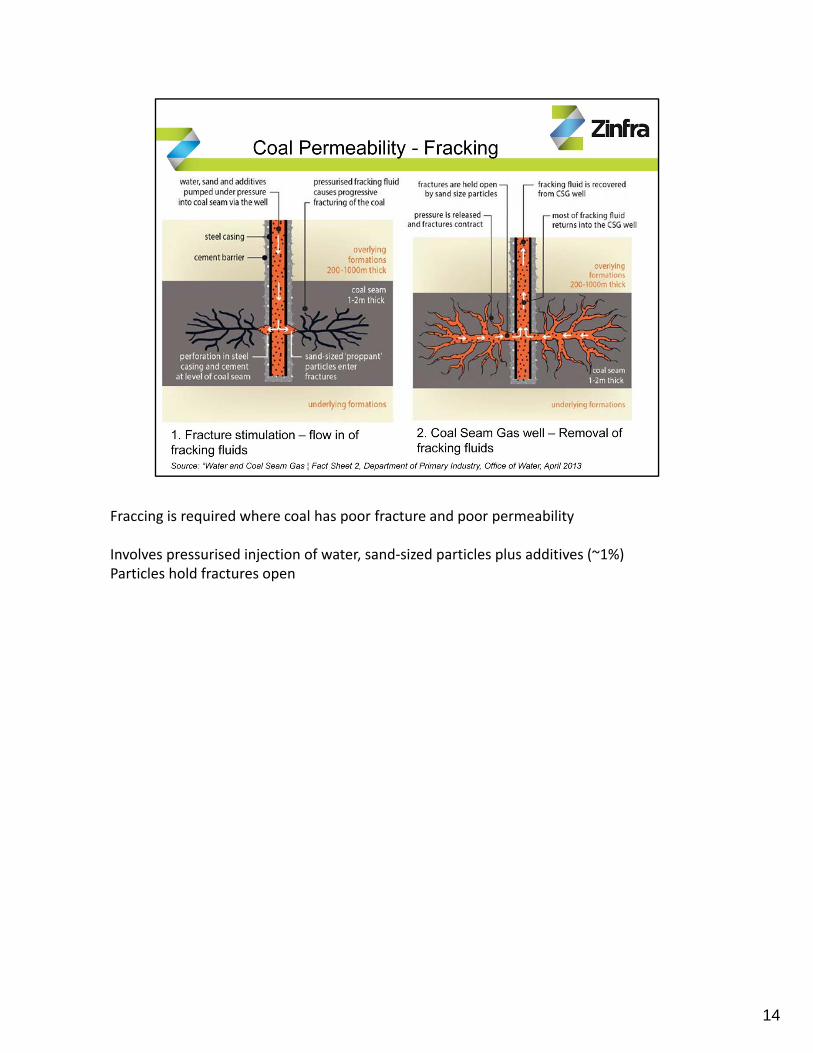
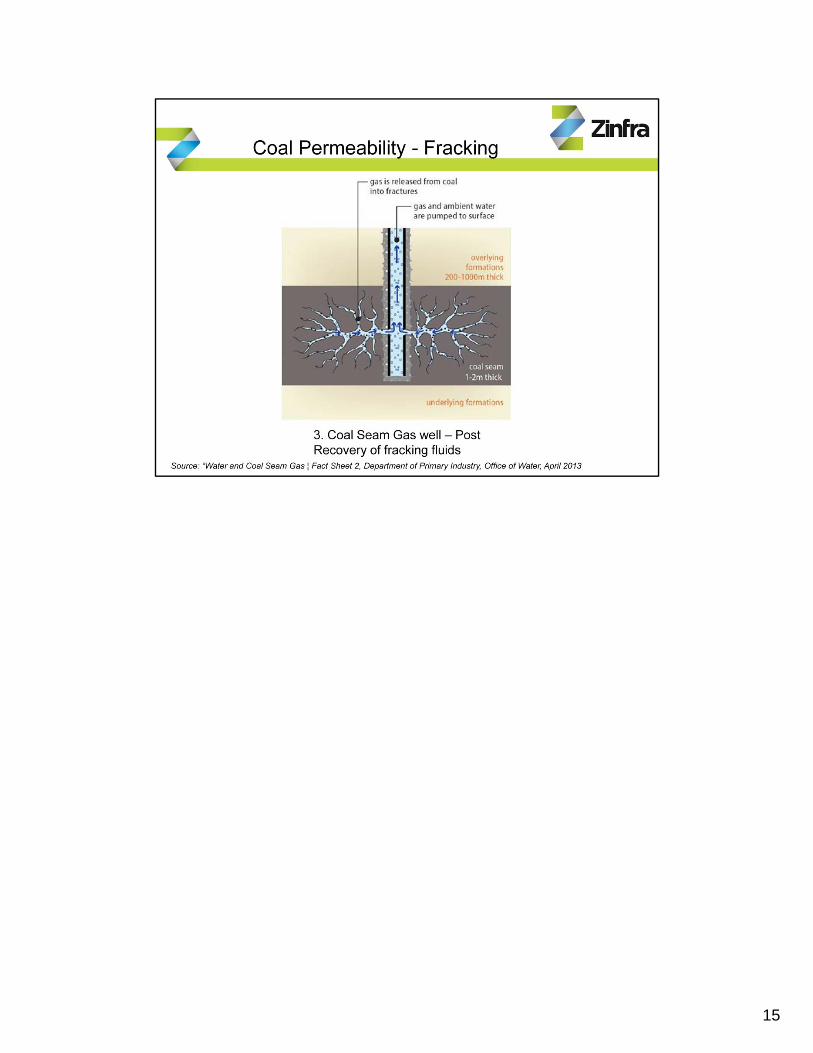
Fraccing is required where coal has poor fracture and poor permeability
Involves pressurised injection of water, sand‐sized particles plus additives (~1%)Particles hold fractures open
14
15

Points to noteBoth Queensland and New South Wales have significant reserves of Coal Seam Gas
16

Definition of Reserves1P means “Proven” – Confidence Level of better than 90% of being produced2P means “Proven and Probable” – Probable means Confidence Level of better than 50% of being produced3P means “Proven and Probable and Possible “ – Possible means Confidence Level of significant but less than 50% of being producedSource: UK Government Department of Energy and Climate Change
17
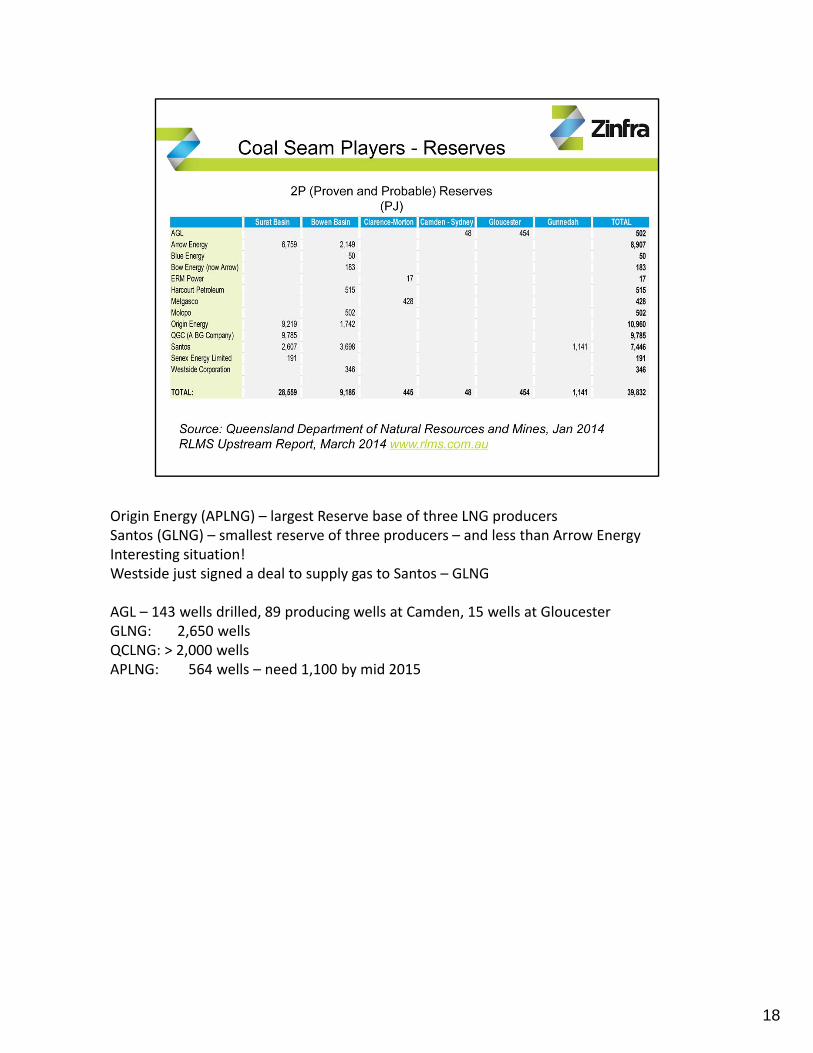
Origin Energy (APLNG) – largest Reserve base of three LNG producersSantos (GLNG) – smallest reserve of three producers – and less than Arrow EnergyInteresting situation!Westside just signed a deal to supply gas to Santos – GLNG
AGL – 143 wells drilled, 89 producing wells at Camden, 15 wells at GloucesterGLNG: 2,650 wellsQCLNG: > 2,000 wellsAPLNG: 564 wells – need 1,100 by mid 2015
18
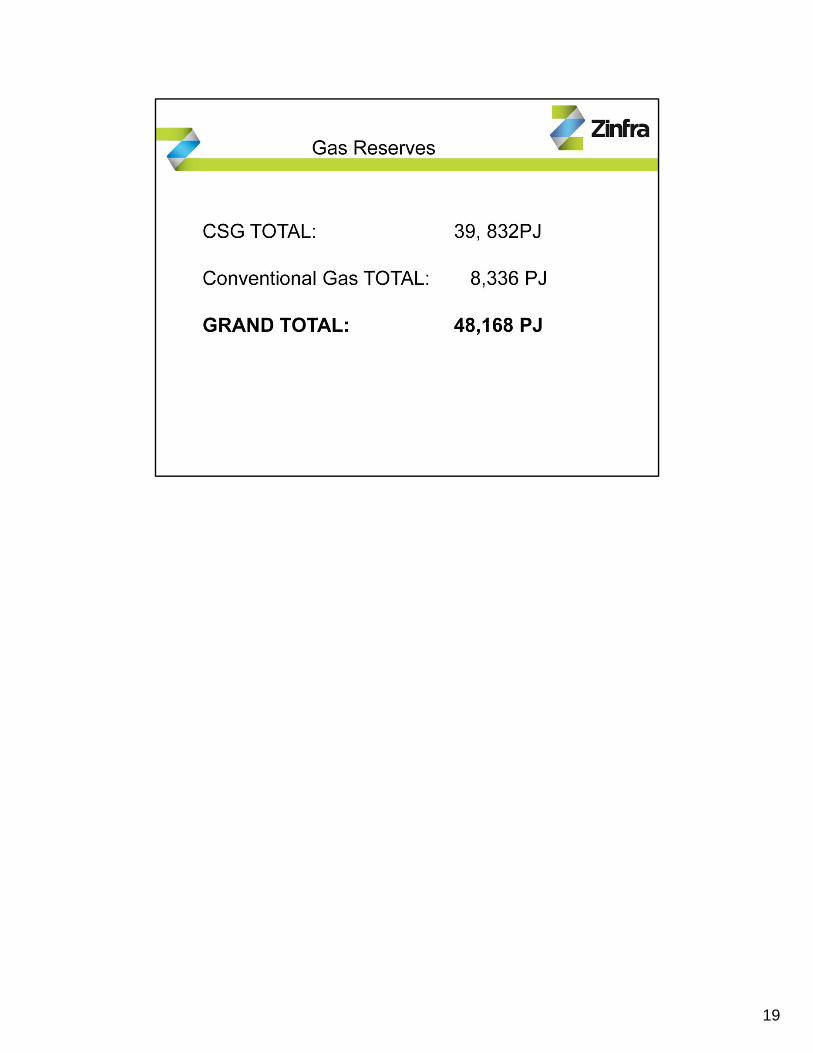
19

34% of Total East Coast Gas production from CSG.
Bass Strait – steadyCooper Basin – significant decline over last ten years
Current Total domestic demand for East Coast is 687 PJ/year (Qld, NSW, Victoria, Tasmania, and South Australia)
20
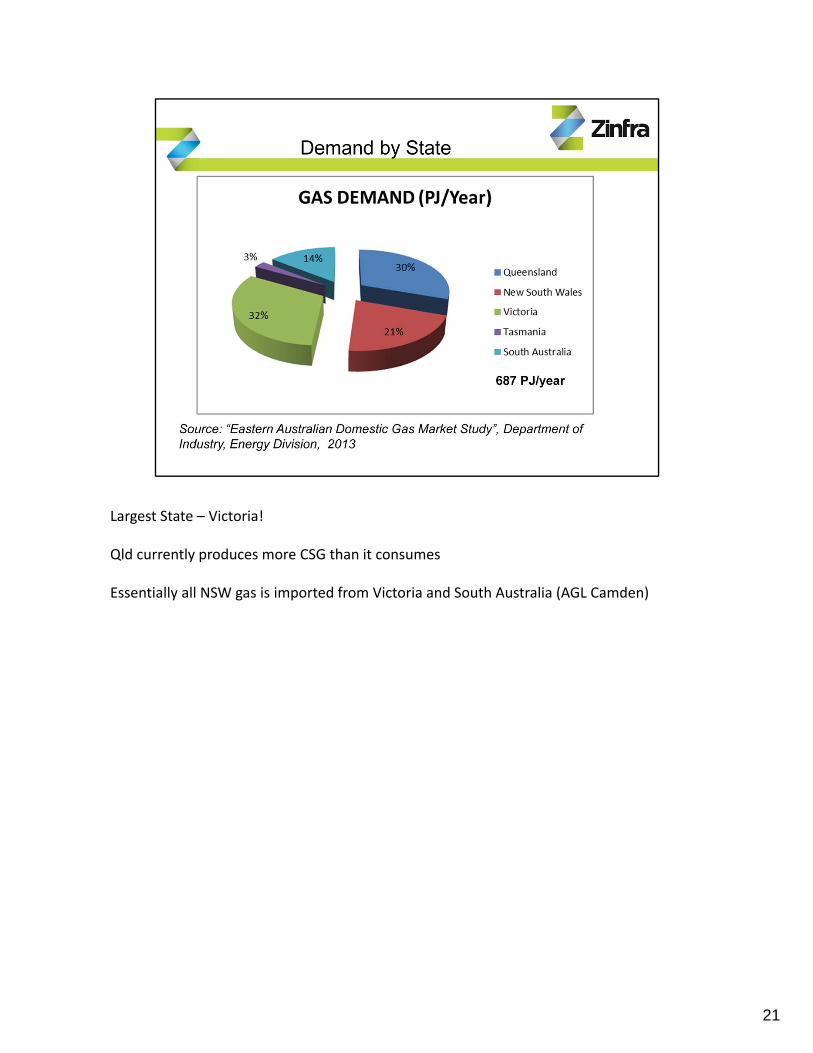
Largest State – Victoria!
Qld currently produces more CSG than it consumes
Essentially all NSW gas is imported from Victoria and South Australia (AGL Camden)
21

Interesting – Power Generation expected to fail annually by 9.8% from 2014 to 2022Driven by • consumers response to rising electricity prices• Renewables (solar and wind power generation)• Energy efficiency measures
22
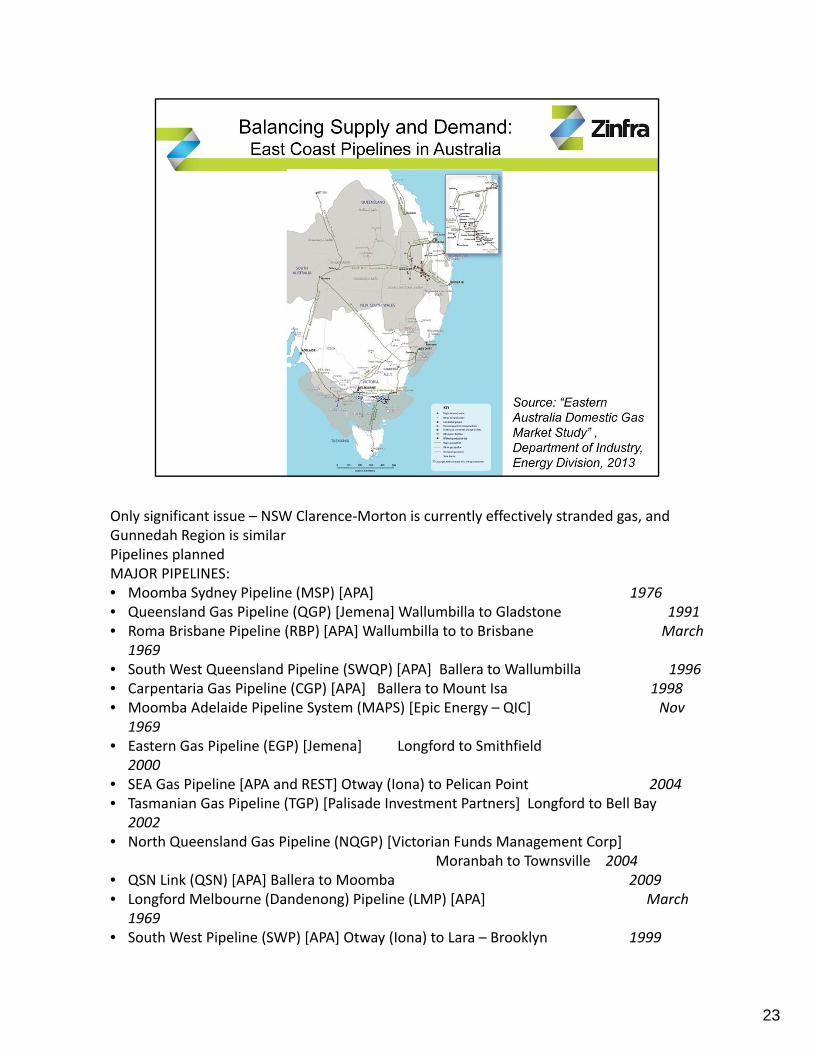
Only significant issue – NSW Clarence‐Morton is currently effectively stranded gas, and Gunnedah Region is similarPipelines plannedMAJOR PIPELINES:• Moomba Sydney Pipeline (MSP) [APA] 1976• Queensland Gas Pipeline (QGP) [Jemena] Wallumbilla to Gladstone 1991• Roma Brisbane Pipeline (RBP) [APA] Wallumbilla to to Brisbane March
1969• South West Queensland Pipeline (SWQP) [APA] Ballera to Wallumbilla 1996• Carpentaria Gas Pipeline (CGP) [APA] Ballera to Mount Isa 1998• Moomba Adelaide Pipeline System (MAPS) [Epic Energy – QIC] Nov
1969• Eastern Gas Pipeline (EGP) [Jemena] Longford to Smithfield
2000• SEA Gas Pipeline [APA and REST] Otway (Iona) to Pelican Point 2004• Tasmanian Gas Pipeline (TGP) [Palisade Investment Partners] Longford to Bell Bay
2002• North Queensland Gas Pipeline (NQGP) [Victorian Funds Management Corp]
Moranbah to Townsville 2004• QSN Link (QSN) [APA] Ballera to Moomba 2009• Longford Melbourne (Dandenong) Pipeline (LMP) [APA] March
1969• South West Pipeline (SWP) [APA] Otway (Iona) to Lara – Brooklyn 1999
23
• New South Wales – Victoria Interconnect (NVI) [APA] Barnawatha – Culcairn – Wagga Wagga 1998
23
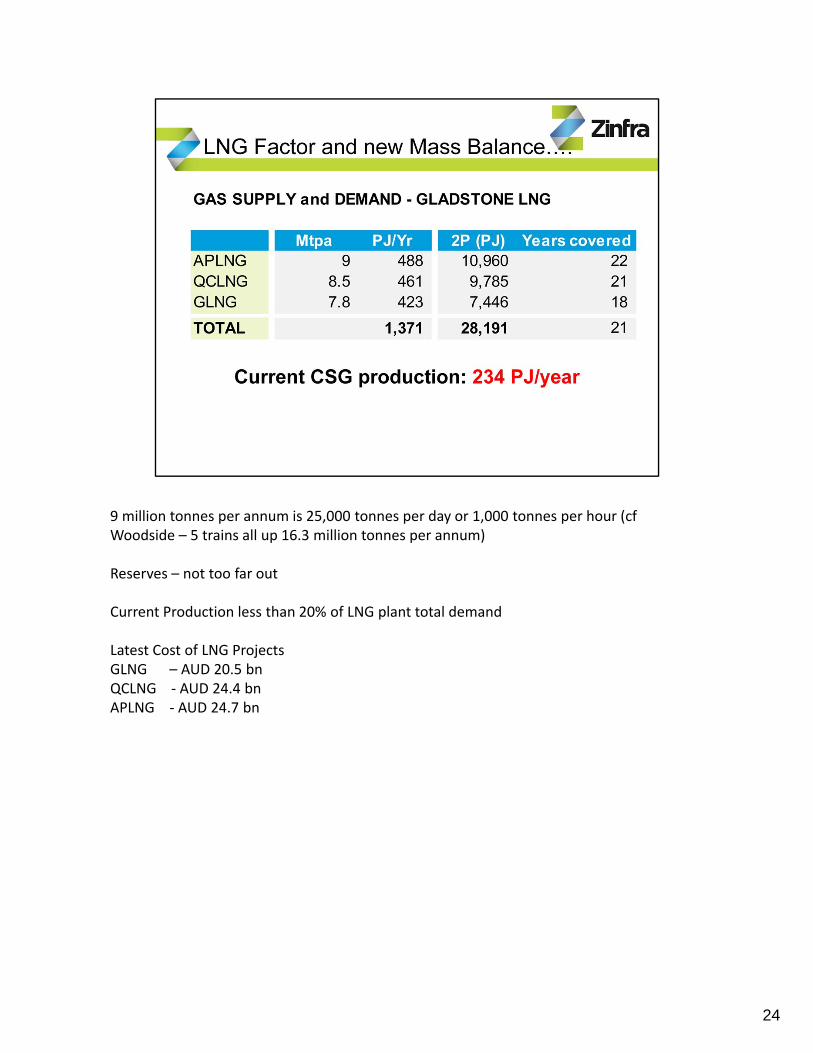
9 million tonnes per annum is 25,000 tonnes per day or 1,000 tonnes per hour (cfWoodside – 5 trains all up 16.3 million tonnes per annum)
Reserves – not too far out
Current Production less than 20% of LNG plant total demand
Latest Cost of LNG ProjectsGLNG – AUD 20.5 bnQCLNG ‐ AUD 24.4 bnAPLNG ‐ AUD 24.7 bn
24

25
26
27

Process Flow Diagram
Amine – removes CO2Dehydration – molecular sieves to remove water
Propane – Gets Gas to ‐35°CEthylene – Gets Gas to ‐95°CMethane– Gets Gas to ‐155°CFlash to ‐162°C
28
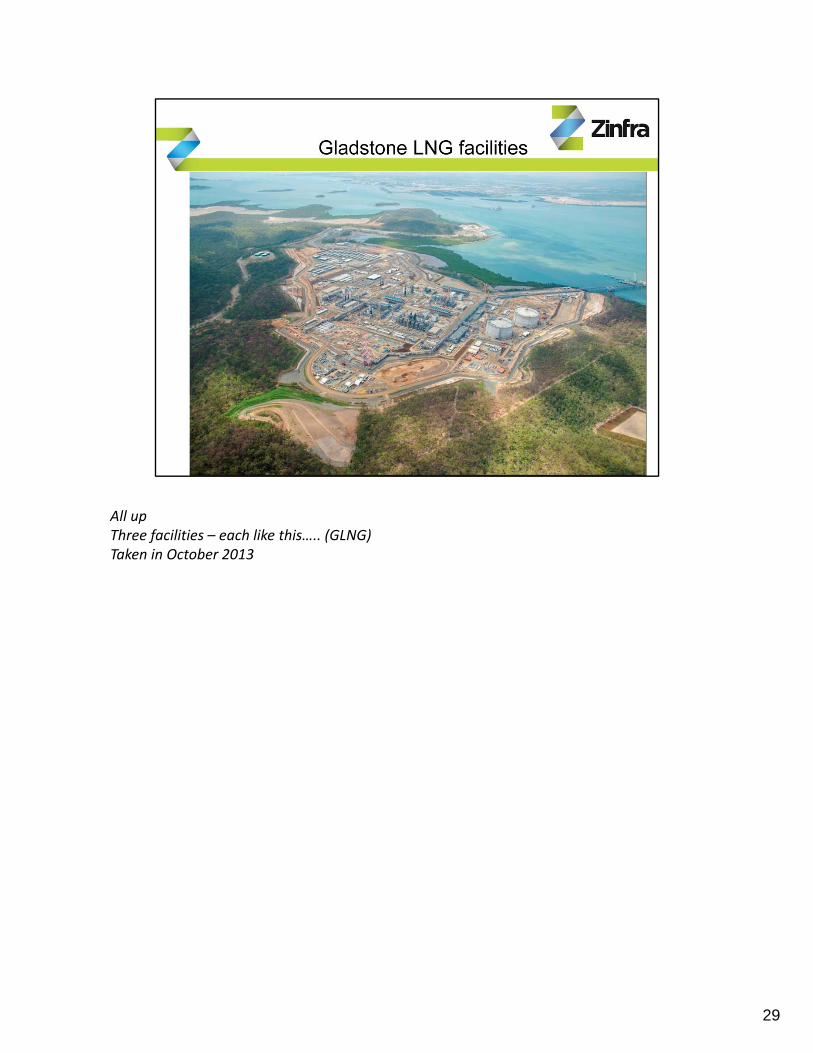
All upThree facilities – each like this….. (GLNG)Taken in October 2013
29
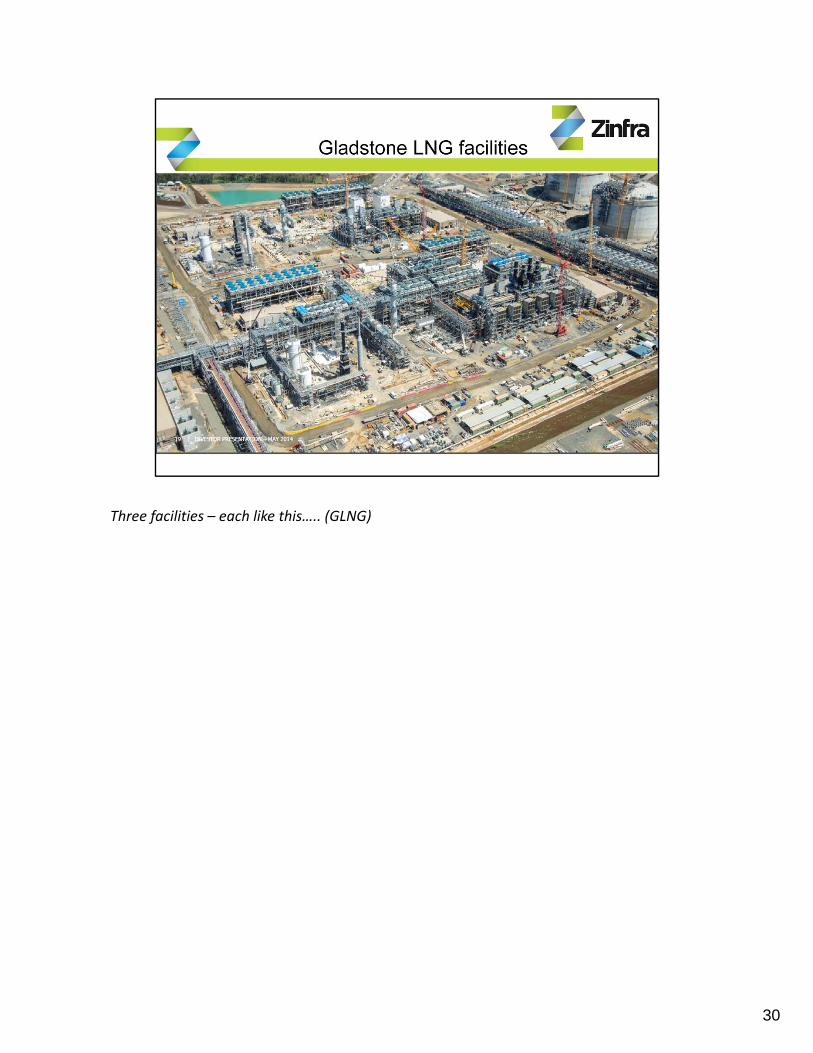
Three facilities – each like this….. (GLNG)
30
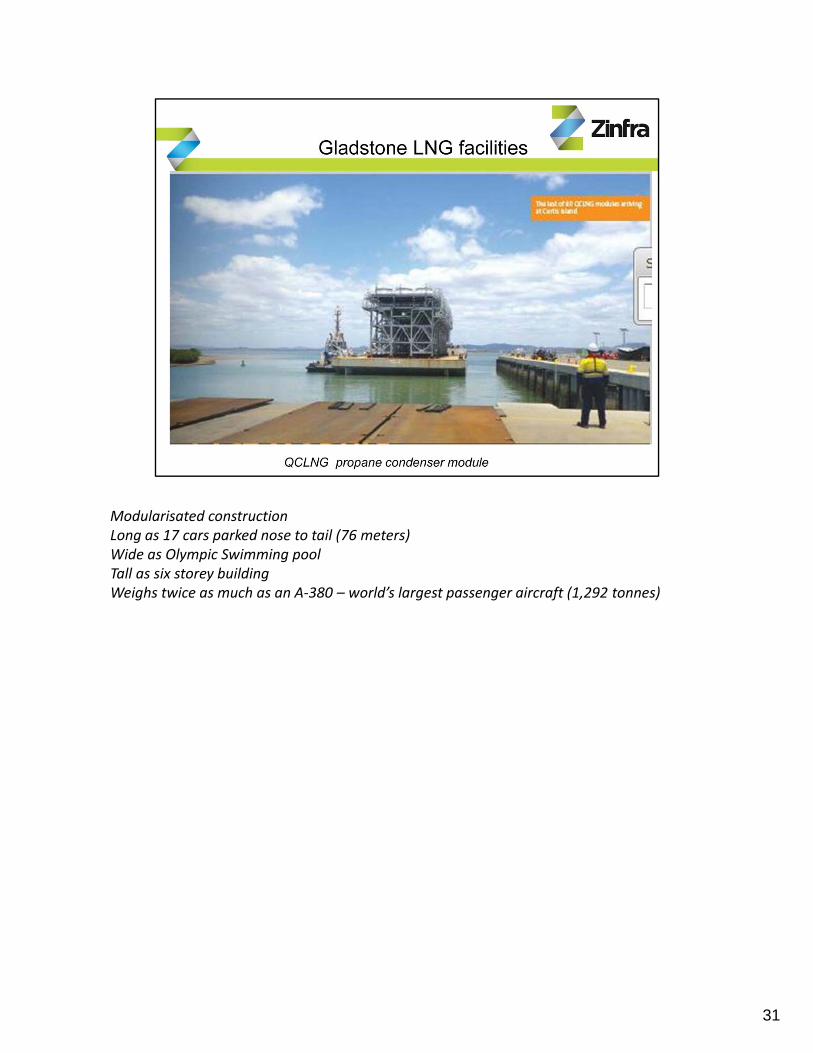
Modularisated constructionLong as 17 cars parked nose to tail (76 meters)Wide as Olympic Swimming poolTall as six storey buildingWeighs twice as much as an A‐380 – world’s largest passenger aircraft (1,292 tonnes)
31
All upSix Tanks 48 meters high, 79 meters in diameter
32
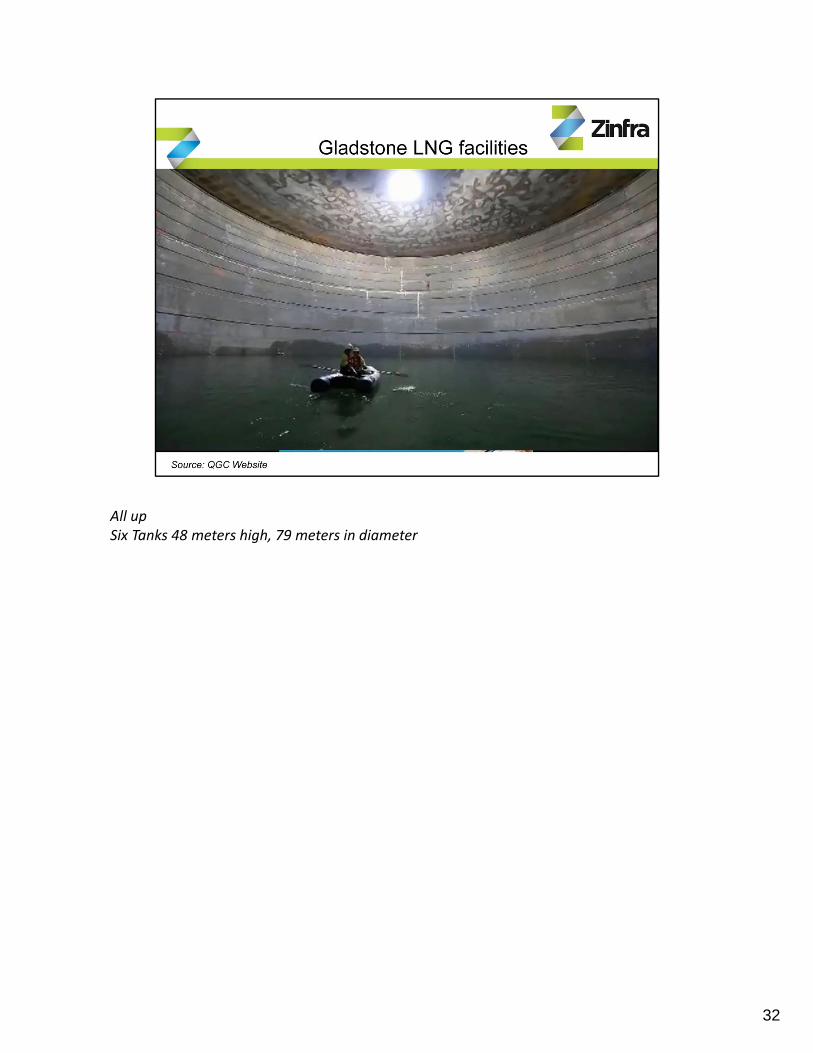
All upSix Tanks 48 meters high, 79 meters in diameter
33

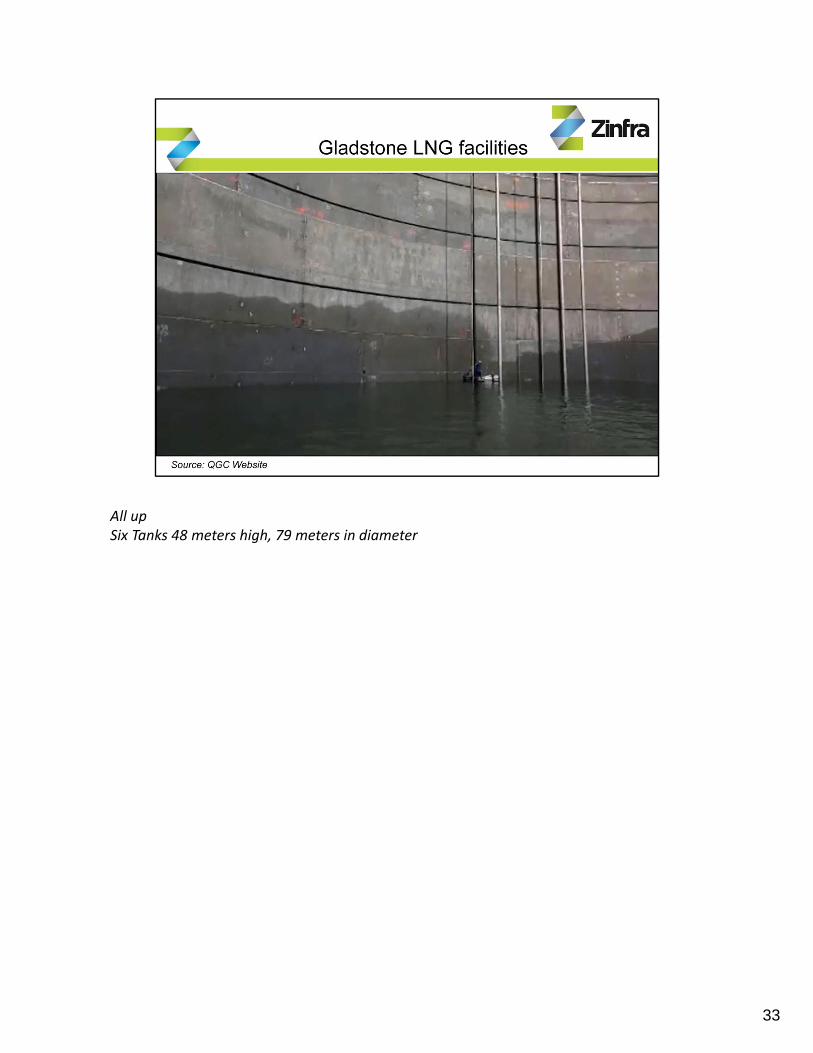
All upSix Tanks 48 meters high, 79 meters in diameter
34


![Coal seam fire and spontaneous heating [recovered]](https://img.pdfslide.us/doc/110x75/588ad8351a28ab89058b6f93/coal-seam-fire-and-spontaneous-heating-recovered.jpg)