Embed Size (px)
Citation preview
Cause-and-Effect Diagram
What is it?• An analysis tool that
provides a systematic way of looking at effects and
their respective causes• Developed by Dr. Kaoru Ishikawa of Japan in 1943 and is sometimes referred
to as an Ishikawa Diagram or a Fishbone Diagram
because of its shape
Why implement this?• It helps determine the root causes of a problem using a
structured approach.• It encourages group
participation and utilizes group knowledge of the
process.• It uses an orderly, easy-to-
read format to diagram cause-and-effect.
relationships• It indicates possible causes of
variation in a process.
• It increases knowledge of the process by helping everyone
to learn more about the factors at work and how they
relate.• It identifies areas where data should be collected for further
study.
Why implement this?
> EXAMPLE OF A BUSINESS PROCESS >
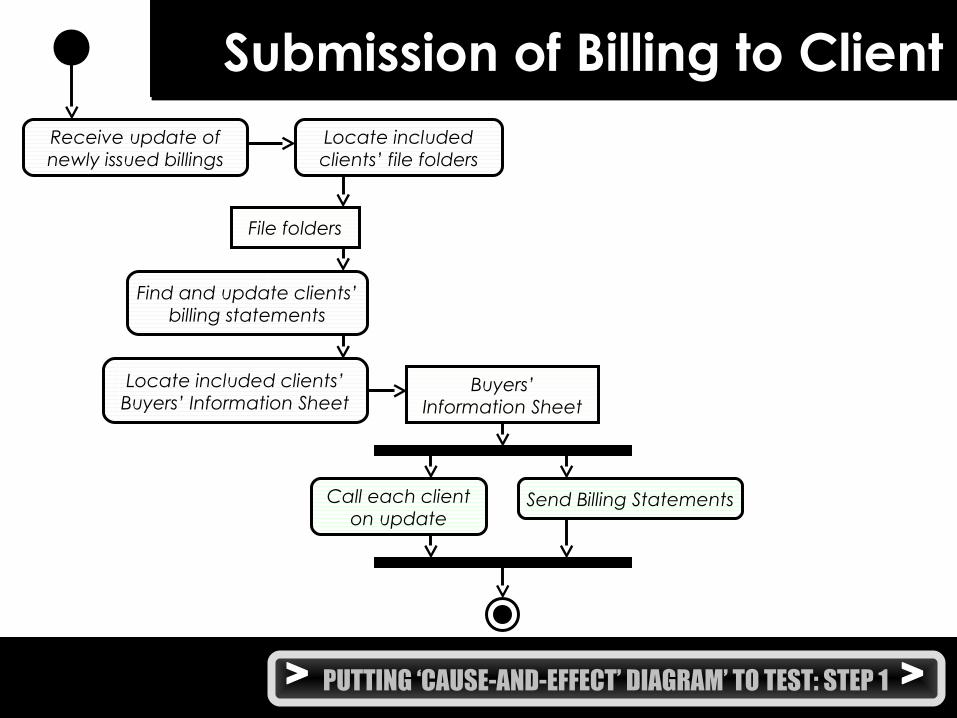
> PUTTING ‘CAUSE-AND-EFFECT’ DIAGRAM’ TO TEST: STEP 1 >
Submission of Billing to ClientReceive update ofnewly issued billings
Find and update clients’billing statements
Locate includedclients’ file folders
File folders
Call each clienton update
Buyers’Information Sheet
Send Billing Statements
Locate included clients’Buyers’ Information Sheet
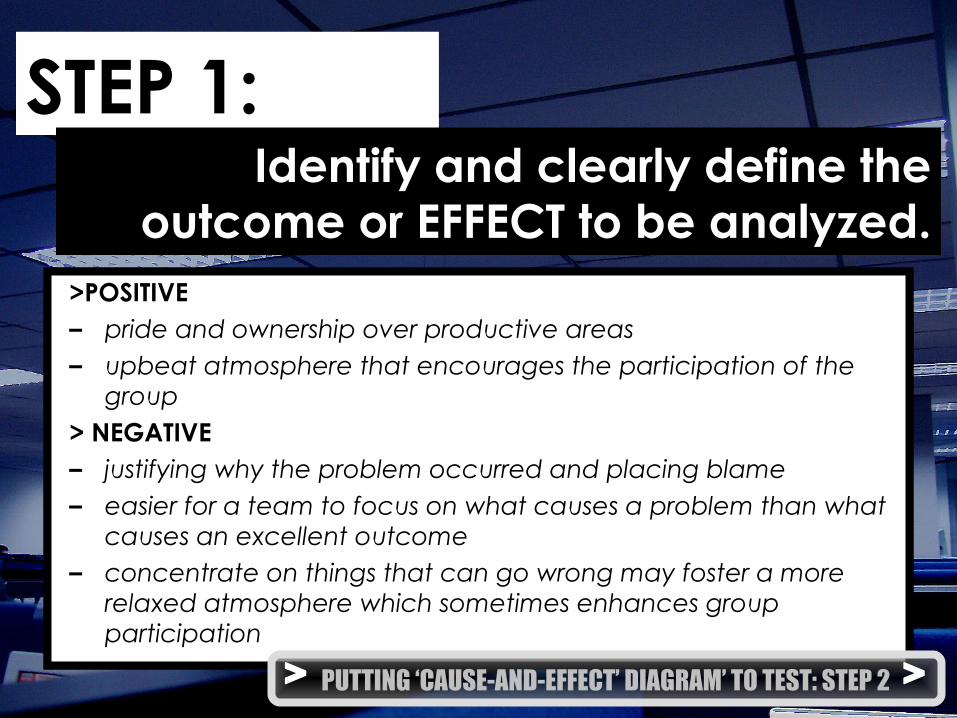
STEP 1:
• Decide on the effect to be examined.
• An effect may be positive (an objective) or negative (a problem), depending upon the issue that is being discussed.
Identify and clearly define the outcome or EFFECT to be analyzed.
>POSITIVE– pride and ownership over productive areas– upbeat atmosphere that encourages the participation of the
group> NEGATIVE– justifying why the problem occurred and placing blame– easier for a team to focus on what causes a problem than what
causes an excellent outcome– concentrate on things that can go wrong may foster a more
relaxed atmosphere which sometimes enhances group participation
> PUTTING ‘CAUSE-AND-EFFECT’ DIAGRAM’ TO TEST: STEP 2 >
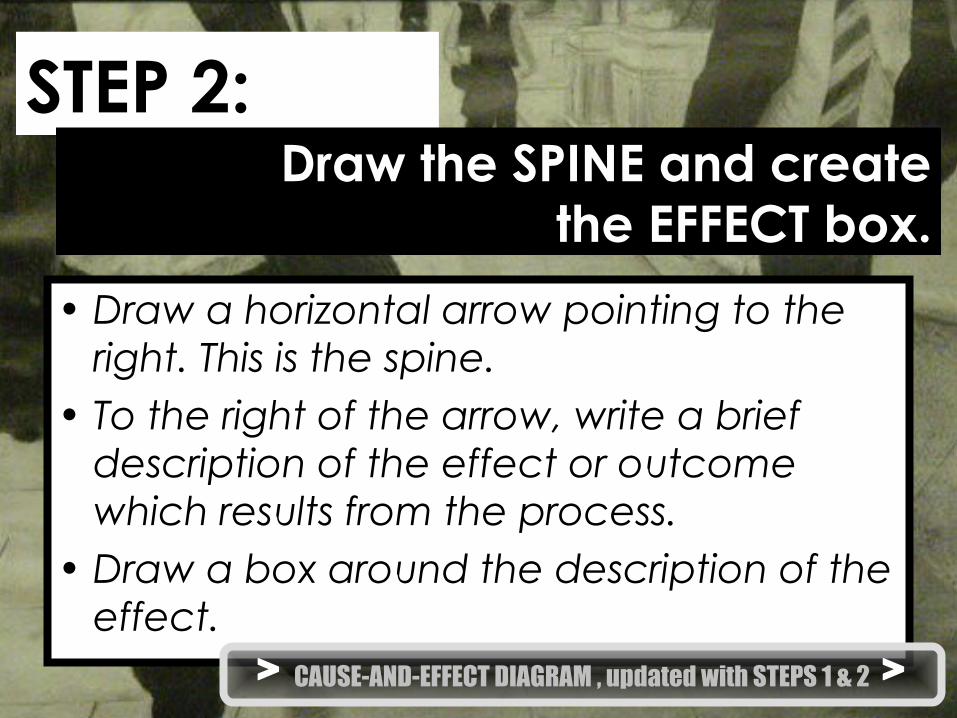
STEP 2:
• Draw a horizontal arrow pointing to the right. This is the spine.
• To the right of the arrow, write a brief description of the effect or outcome which results from the process.
• Draw a box around the description of the effect.
Draw the SPINE and createthe EFFECT box.
> CAUSE-AND-EFFECT DIAGRAM , updated with STEPS 1 & 2 >

> PUTTING ‘CAUSE-AND-EFFECT’ DIAGRAM’ TO TEST: STEP 3 >
InaccurateSubmission of
Billing to Client
Effect Box
Spine

STEP 3:
• Establish main causes, or categories, under which other possible causes will be listed. – 3Ms and P – Methods, Materials,
Machinery, and People– 4Ps – Policies, Procedures, People, and
Plant– Environment
Identify the main CAUSES contributing to the effect being studied.
• Write the main categories your team has selected to the left of the effect box. Draw some above and below the spine.
• Draw a box around each category label and use a diagonal line to form a branch from the box to the spine.
> CAUSE-AND-EFFECT DIAGRAM , updated with STEPS 1, 2 & 3 >
Materials
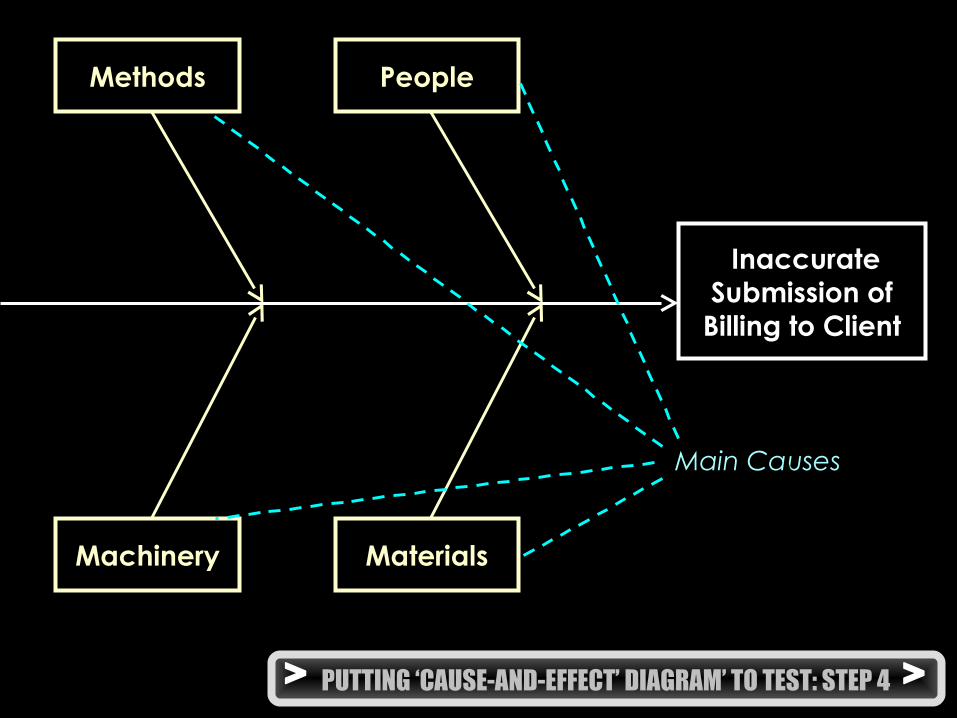
> PUTTING ‘CAUSE-AND-EFFECT’ DIAGRAM’ TO TEST: STEP 4 >
InaccurateSubmission of
Billing to Client
Methods People
Machinery
Main Causes
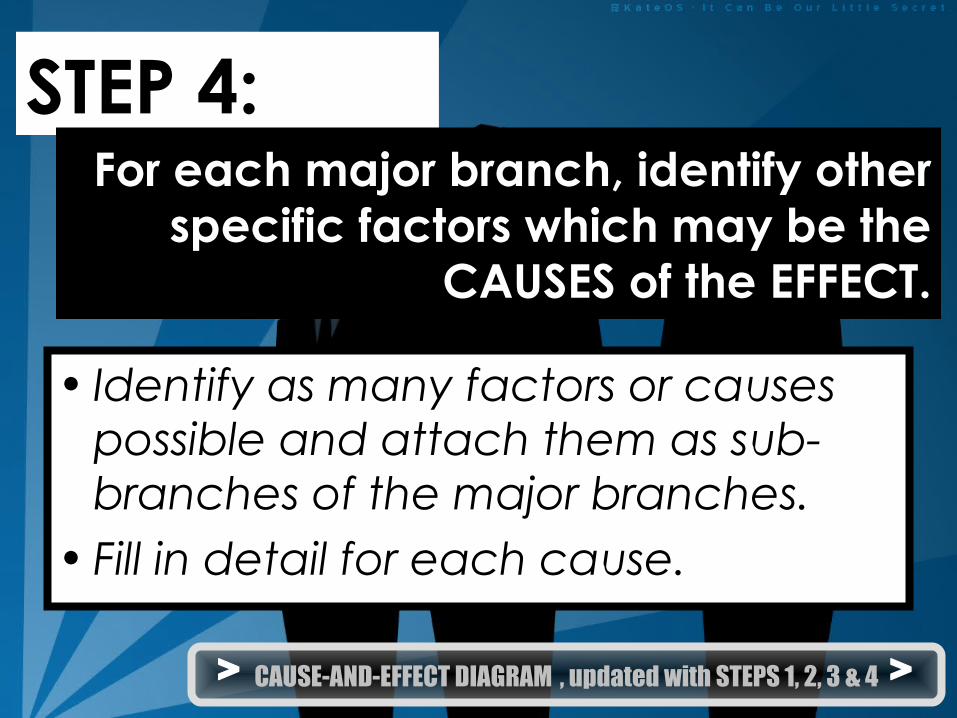
STEP 4:
• Identify as many factors or causes possible and attach them as sub-branches of the major branches.
• Fill in detail for each cause.
For each major branch, identify other specific factors which may be the
CAUSES of the EFFECT.
> CAUSE-AND-EFFECT DIAGRAM , updated with STEPS 1, 2, 3 & 4 >
> PUTTING ‘CAUSE-AND-EFFECT’ DIAGRAM’ TO TEST: STEP 5 >
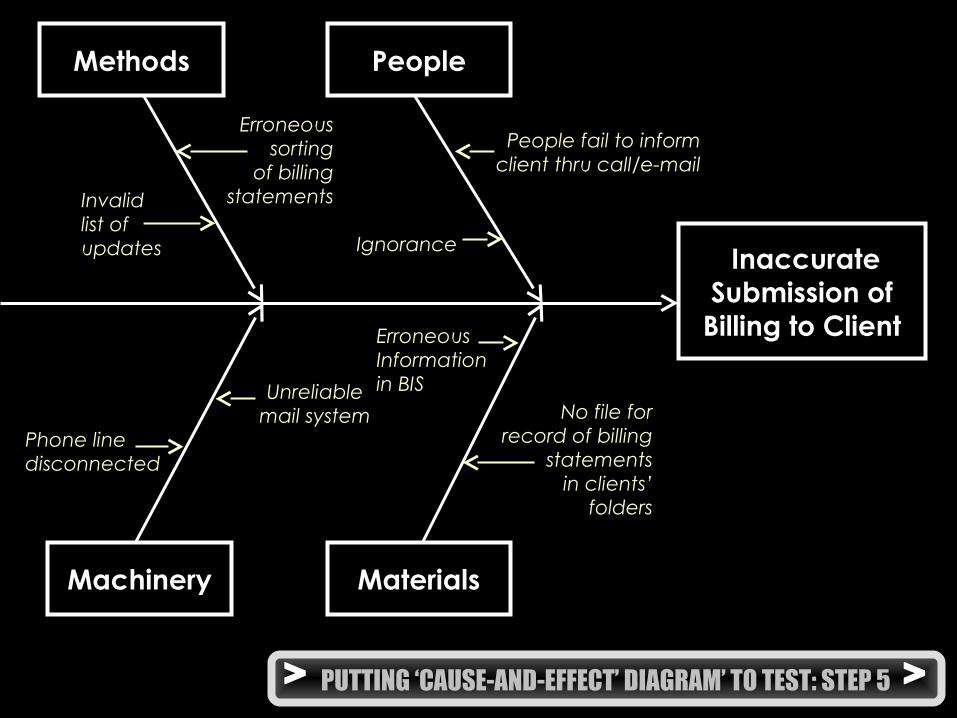
Materials
InaccurateSubmission of
Billing to Client
Methods People
Machinery
Ignorance
People fail to informclient thru call/e-mail
Unreliablemail system
Erroneoussorting
of billingstatementsInvalid
list ofupdates
Phone linedisconnected
ErroneousInformationin BIS
No file forrecord of billing
statementsin clients’
folders
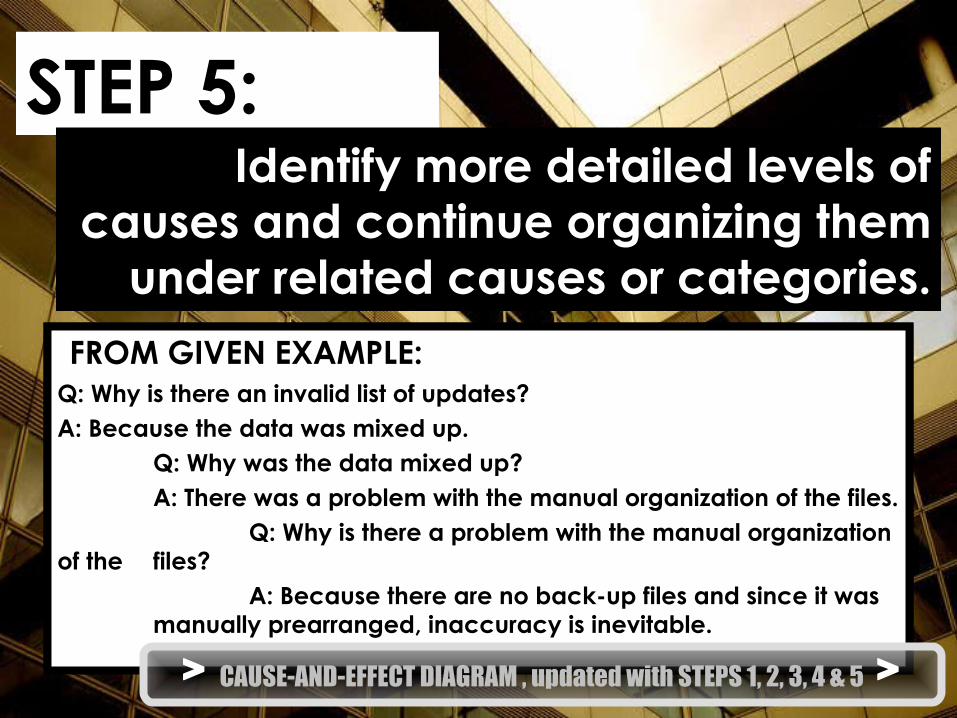
STEP 5:
•You can do this by asking a series of WHY questions.
Identify more detailed levels of causes and continue organizing them
under related causes or categories.FROM GIVEN EXAMPLE:
Q: Why is there an invalid list of updates?A: Because the data was mixed up.
Q: Why was the data mixed up?A: There was a problem with the manual organization of the files.
Q: Why is there a problem with the manual organization of the files?
A: Because there are no back-up files and since it was manually prearranged, inaccuracy is inevitable.
> CAUSE-AND-EFFECT DIAGRAM , updated with STEPS 1, 2, 3, 4 & 5 >
> PUTTING ‘CAUSE-AND-EFFECT’ DIAGRAM’ TO TEST: STEP 6 >
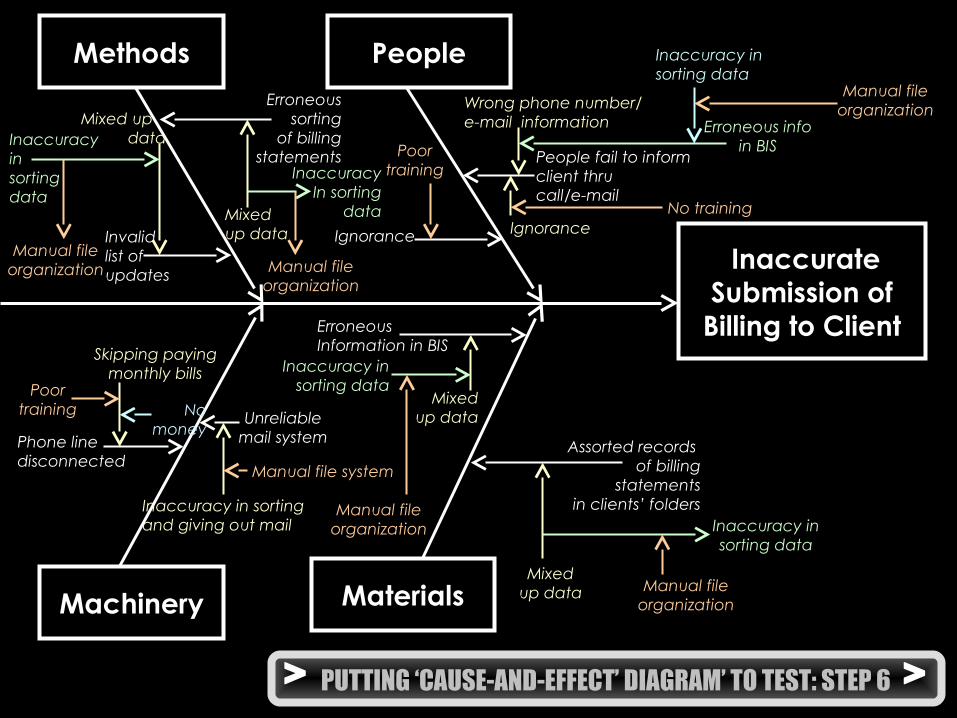
Materials
InaccurateSubmission of
Billing to Client
Methods People
Machinery
Ignorance
People fail to informclient thrucall/e-mail
Unreliablemail system
Erroneoussorting
of billingstatements
Invalidlist ofupdates
Phone linedisconnected
ErroneousInformation in BIS
Assorted records of billing
statementsin clients’ folders
Mixed up dataInaccuracy
insortingdata
Manual fileorganization
Poortraining
Mixedup data
InaccuracyIn sorting
dataIgnorance
Wrong phone number/e-mail information Erroneous info
in BIS
Inaccuracy insorting data
Manual fileorganization
No training
Manual fileorganization
Skipping payingmonthly bills
Poortraining No
money
Inaccuracy in sortingand giving out mail
Manual file system
Mixedup data
Inaccuracy insorting data
Manual fileorganization
Mixedup data
Inaccuracy insorting data
Manual fileorganization
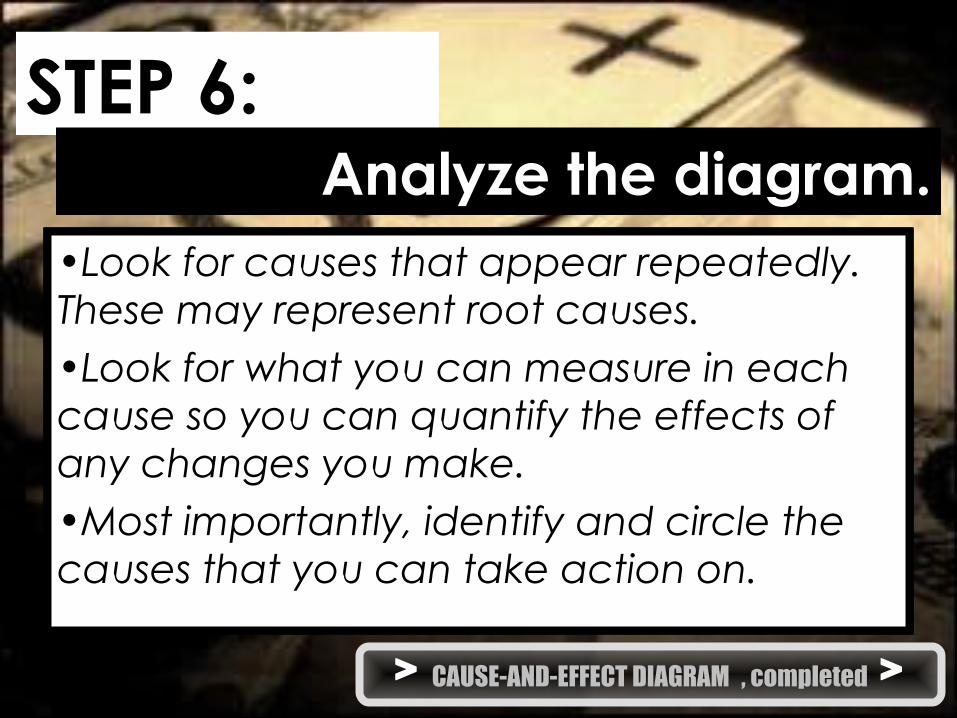
STEP 6:
• It helps identify causes that warrant further investigation.
• Use a pareto chart to determine the cause to focus on first.
• See the “balance” of your diagram, checking for comparable levels of detail for most of the categories.
Analyze the diagram.– A thick cluster of items in one area may
indicate a need for further study.– A main category having only a few specific
causes may indicate a need for further identification of causes.
– If several major branches have only a few sub-branches, you may need to combine them under a single category.
•Look for causes that appear repeatedly. These may represent root causes.•Look for what you can measure in each cause so you can quantify the effects of any changes you make.•Most importantly, identify and circle the causes that you can take action on.
> CAUSE-AND-EFFECT DIAGRAM , completed >

> RECOMMENDATIONS from completed CAUSE-AND-EFFECT DIAGRAM >
Poortraining
Manual fileorganization
Poortraining
Manual file system
Manual fileorganization
Manual fileorganizationMaterials
InaccurateSubmission of
Billing to Client
Methods People
Machinery
Ignorance
People fail to informclient thrucall/e-mail
Unreliablemail system
Erroneoussorting
of billingstatements
Invalidlist ofupdates
Phone linedisconnected
ErroneousInformation in BIS
Assorted records of billing
statementsin clients’ folders
Mixed up dataInaccuracy
insortingdata
Manual fileorganization
Poortraining
Mixedup data
InaccuracyIn sorting
dataIgnorance
Wrong phone number/e-mail information Erroneous info
in BIS
Inaccuracy insorting data
Manual fileorganization
No training
Manual fileorganization
Skipping payingmonthly bills
Poortraining No
money
Inaccuracy in sortingand giving out mail
Manual file system
Mixedup data
Inaccuracy insorting data
Manual fileorganization
Mixedup data
Inaccuracy insorting data
Manual fileorganization
No training
Manual fileorganization Manual file
organization
ANALYSIS
–The level of detail is well-balanced.–The causes poor/no training and manual file organization/system are repeated several times.
–These causes stated above are the ones that should be attended to and given action on ASAP.
RECOMMENDED SOLUTIONS:–Poor/No Training -> Give tutorials and seminars to new and old employees alike. Have people check employees’ performances every once in a while.
–Manual File System -> Have a computer-based information system to maintain the organization. It will not only give you back-up files but make the system work faster. Make sure it is maintained and updated at all times.
THANK YOU


![Qcl 14-v3 [cause-effect diagram]-[parinita dwivedi]_[banasthali university]](https://img.pdfslide.us/doc/110x75/55a773761a28abb2298b4792/qcl-14-v3-cause-effect-diagram-parinita-dwivedibanasthali-university.jpg)

![Qcl 14-v3 [cause-effect diagram]-[banasthali university]_[shreya gupta]](https://img.pdfslide.us/doc/110x75/55a58ed61a28ab636c8b4674/qcl-14-v3-cause-effect-diagram-banasthali-universityshreya-gupta.jpg)

![Qcl 14-v3 [cause-effect diagram ]-[banasthali university]_[dhanishtha paliwal]](https://img.pdfslide.us/doc/110x75/55c2900abb61eb522b8b456b/qcl-14-v3-cause-effect-diagram-banasthali-universitydhanishtha-paliwal.jpg)


![Qcl 14-v3 [cause-effect-diagram]-[banasthali university]_[devanshi agarwal] (1)](https://img.pdfslide.us/doc/110x75/55a58f261a28ab5d6c8b478b/qcl-14-v3-cause-effect-diagram-banasthali-universitydevanshi-agarwal-1.jpg)
![Qcl 14-v3 [cause effect diagram-[banasthali uni]_[anjali taneja].ppt](https://img.pdfslide.us/doc/110x75/55ade21f1a28ab73518b457d/qcl-14-v3-cause-effect-diagram-banasthali-unianjali-tanejappt.jpg)