Embed Size (px)
Citation preview

CeO2 nanocubes-graphene oxide as durable and highly active catalyst support for proton exchange mem-brane fuel cellWilliam

PEMFC DMFC SOFC MCFC AEM And etc
Fuel Cell
“An electrochemical cell that employs chemical reactions to generate elec-
tricity”

Using permeable polymer electrolyte Efficiency is about 40-50 % Operating temperature 80oC Power output: 50-250 kW Use Pt catalyst Requires purified fuel
Proton Exchange Membrane Fuel Cell
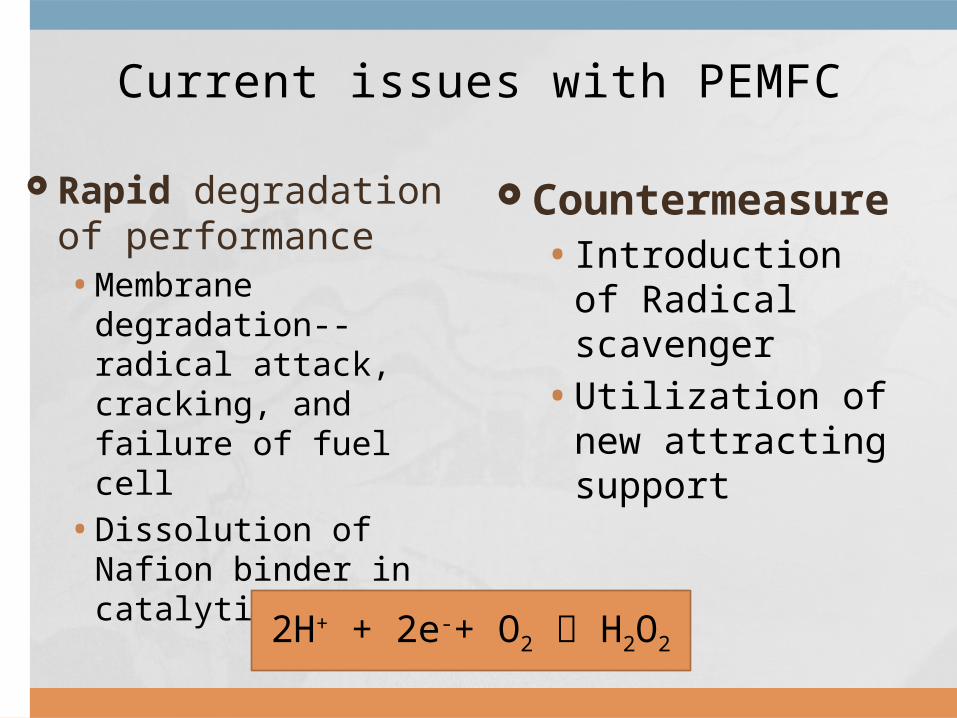
Rapid degrada-tion of perfor-mance• Membrane degra-
dation--radical at-tack, cracking, and failure of fuel cell• Dissolution of
Nafion binder in catalytic layer
Current issues with PEMFC
Countermea-sure• Introduction of
Radical scav-enger• Utilization of
new attracting support
2H+ + 2e-+ O2 H2O2
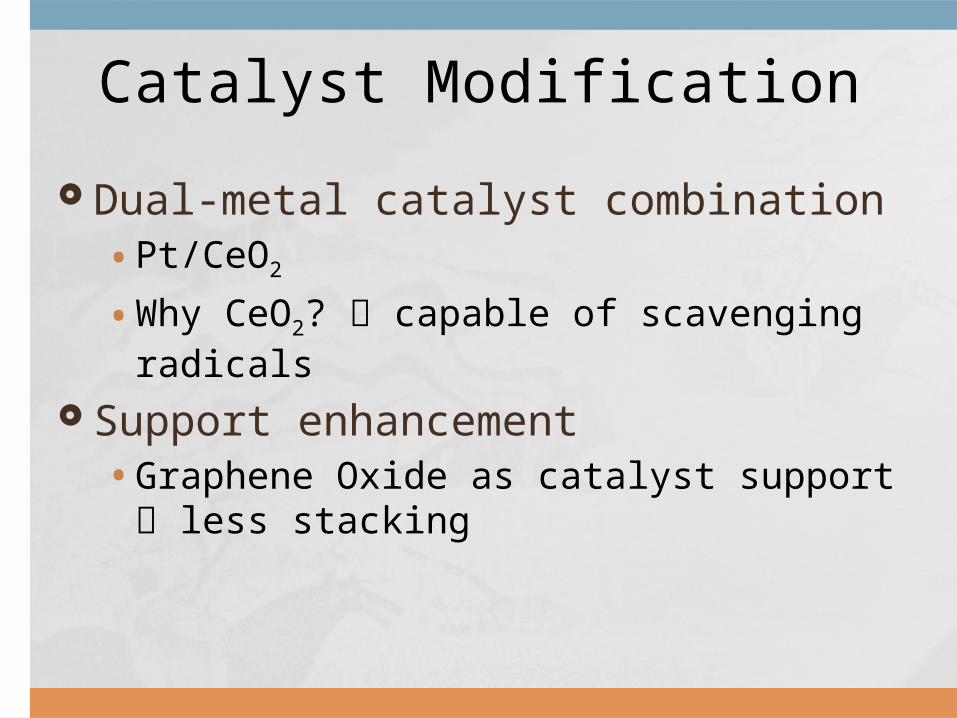
Dual-metal catalyst combination• Pt/CeO2
• Why CeO2? capable of scavenging rad-icals
Support enhancement• Graphene Oxide as catalyst support
less stacking
Catalyst Modification

Experimental- Preparation of GO
1 Gram
Graphene K2S2O8
0.8 Gram
P2O5
0.8 Gram
10 ml H2SO4
80oCRapidStir-ring

Experimental- Preparation of GO
250 ml, Dim
ixin
g
Aging, 12 H
Filtra-tion
Wash-ing
Drying
60 ml 5 g, KMNO4

Experimental- Preparation of GO
35oC, 2 H
Later
150 ml, Slowly
Another 2 H
10 ml, 30%
Washing ( HCl, DI H2O)
and drying

Experimental- Synthesis of CeO2 nanocubes-GO nanocomposite
100 mg 60 ml
2 hours
Cerium (III)
Nitrate
Toluene,Oleic acid,Ethylenedi-
amine
180oC, 24 hours

Experimental- Synthesis of Pt-GO- CeO2 catalyst
0.15 g H2PtCl6
1
Ethylene gly-col
2
0.38 g GO-CeO2
3
30 min
pH adjusted = 10
4
Another 30 minutes
Interminent Heating,
Pulse every 5 SThree times
pH adjust-ment= 2
0.1 M HCl

Experimental- MEA preparationWashing
InkIsoprophyl
Alcohol,Nafion,
Catalyst (1:6:1)
Printing
Hot Pressing
TEM Cyclic voltammogram to see the ac-
tive surface area Performance test, using stoichiomet-
ric ratio for H2 and air 1.5 and 2.5 respectively after the cell is acti-vated
Catalyst Characterization

XRD pattern
Result and Discussion
Peaks obtained fully consistent with XRD pattern of CeO2 and
GO
No impurities incor-porated in the
process

TEM image (5, 8, 12, 15% wt)
Result and Discussion
Layer of GO detected with CeO2 nanocubes distributed homoge-
nously
The number of nanocube increase as increases CeO2 load-
ing

Performance test on single cell (nafion & electrocatalyst) polariza-tion curve and power density
Result and Discussion
1 2 3
The results concludes that at lower CeO2 load-ing (5 & 8 % CeO2) the performance of the sin-
gle cell is way better
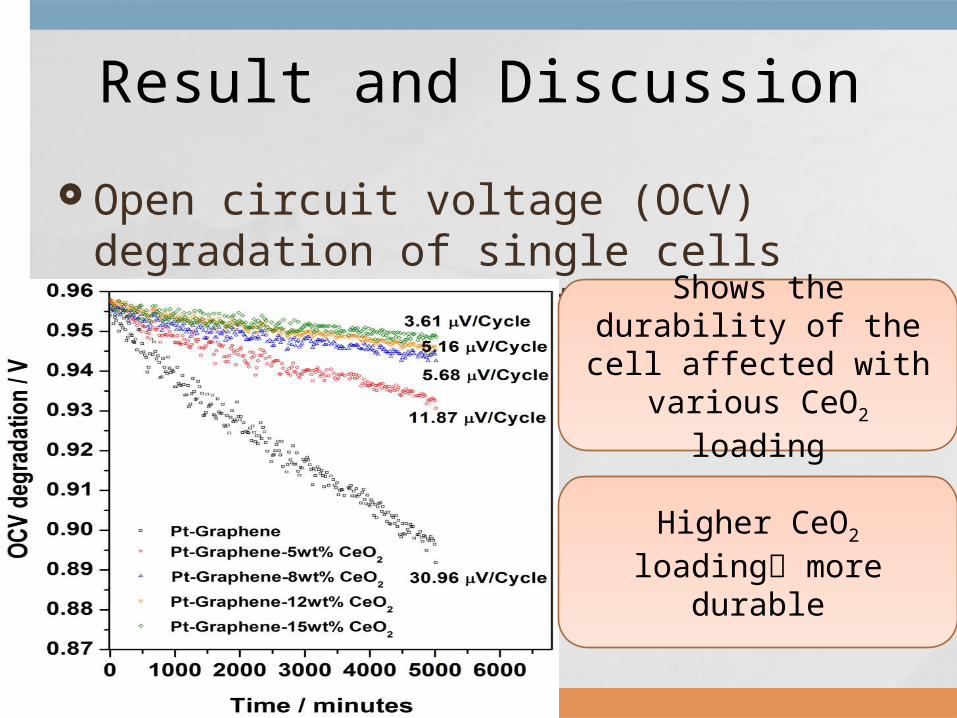
Open circuit voltage (OCV) degrada-tion of single cells during 0.6-1.2 voltage cycle
Result and Discussion
Shows the durability of the cell affected with various CeO2
loading
Higher CeO2 loading more durable
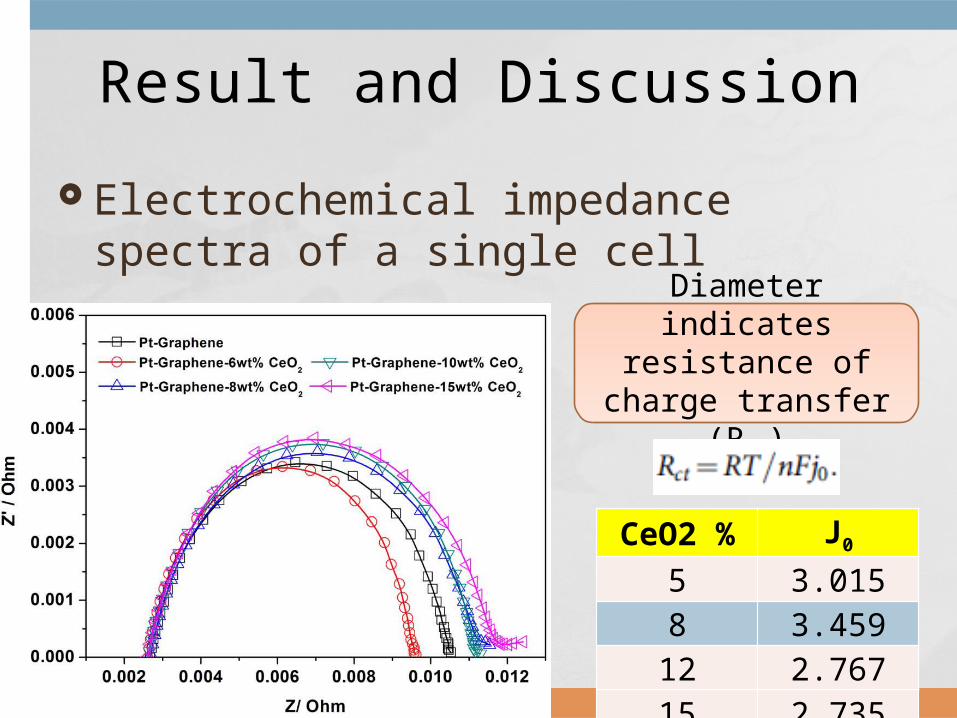
Electrochemical impedance spectra of a single cell
Result and Discussion
Diameter indicates resistance of
charge transfer (Rct)
CeO2 % J0
5 3.0158 3.45912 2.76715 2.735

Cyclic Voltammograms
Result and Discussion
Indicates a slight increase in surface
area by small amount doping of
CeO2
Maybe caused be-cause of spillover of proton on the sur-face of CeO2 in-creasing three
phase interface A

Result and Discussion
CeO2% ECSA Decrease
0 815 458 3112 3415 53
CV after 5000 cy-cles at high voltage
0.8-1.23 V
The electrocatalyst composed of Pt-GO and CeO2 doping successfully demonstrated scavenging ca-pability of radicals, thus durability enhanced.
XRD and TEM confirmed the nanocomposites are highly crystalline and well dispersed at the surface of GO
The CV indicates a small increase in surface area with CeO2 doping less than 8 %
Durability of electrocatalytic activity was mea-sured using CV-cycles at high voltage. The results indicate doping of CeO2 could significantly slowing down the dissolution rate of Nafion binder
Conclussion

Thank you for your atttention