Embed Size (px)
Citation preview
IOSR Journal of Electrical and Electronics Engineering (IOSR-JEEE)
e-ISSN: 2278-1676,p-ISSN: 2320-3331, Volume 7, Issue 6 (Sep. - Oct. 2013), PP 52-58 www.iosrjournals.org
www.iosrjournals.org 52 | Page
Artificial Neural Networks for ON Line Assessment of Voltage
Stability using FVSI in Power Transmission Systems
Mr.K.R.Vadivelu1,Dr.G.V.Marutheswar
2
(EEE,Annamacharya Institute of Technology and Sciences,JNTU University, Anantapr, India)
( EEE,S.V.University College of Engineering,S.V.University,Tirupati,India)
Abstract: This paper describes the expressions of Line Stability Factor (LQF) and Fast Voltage Stability Index
(FVSI), which may be measured as sign of voltage collapse under inhibited condition of an interconnected power system. Artificial Neural Network Technique has been useful to recognize the voltage collapse condition.
The Proposed method once the ANN model of the system is built-up, through on line checking of the load of the
weak bus, the present method can immediately calculate the FVSI,and LQF without going through the complex
classical calculations. The developed ANN technique has been experienced in IEEE 30 bus test system and ON-
Line monitoring of 72-bus Indian southern power grid parameters is found to be more effective than the
conventional method.
Key words:voltage stability, ANN, bus, LQP, FVSI.
I.Introduction The nonstop increase in demand for electric power has resulted in an ever more complex interrelated
system, forced to operate closer to the limit of stability. Voltage instability is characterized by the inability of
the system to retain its voltage near the nominal value, even with a change in joined susceptance at the load bus.
In a multibus interconnected system, if load (active and/or reactive) increases incessantly the voltage of each bus
decreases. From this condition, different voltage stability limits may be obtained. Researches are going for long
to study voltage instability of an interconnected power system [1],[2],[3].
A review of literature reveals that, researchers have been trying to investigate the static aspect of load
flow solutions by applying various methods for identifications of the point of split and to estimate the stability
margin of the system.[4],[5],[6] . ANNs have paying attention the great deal of consideration because of their
pattern recognition capability and their capability to handle corrupted data. They have been successfully applied
in certain power engineering problems. [7],[8]. ANN has the ability to solve the problems with high non-
linearity such as system security and stability assessment. [9],[10]. An ANN is programmed, by presenting it with a training set of input-output patterns from which, it learns the relationship between them. Its ability to
perform is well affected by the chosen training data as well as network topology and training scheme.
This paper focuses on two different methods of stability indices. Computer simulation has been
conducted to calculate the stability indices on IEEE 30 bus test system considering different loading conditions
after detecting the degree of weakness of load buses. The proposed [15]ANN model is then trained to correlate
the voltage stability status of the system with changing load pattern. A comparison of the results obtained by
ANN model with classical calculation, has been presented in the text to point out the efficiency of ANN based
technique in predicting of voltage collapse condition.
II.Index Formulation The voltage stability index or proximity is the device used to indicate the voltage stability condition
formulated based on a line or a bus. In this letter, the results of the proposed index (FVSI) are verified with the
existing techniques proposed by Moghavvemi et al. [12] and Mohamed et al. [11]. The characteristics are the
same, whether the quadratic equation discriminant is greater than or equal to zero. The maximum threshold is
set at unity beyond which this limit system bifurcation will be experienced.
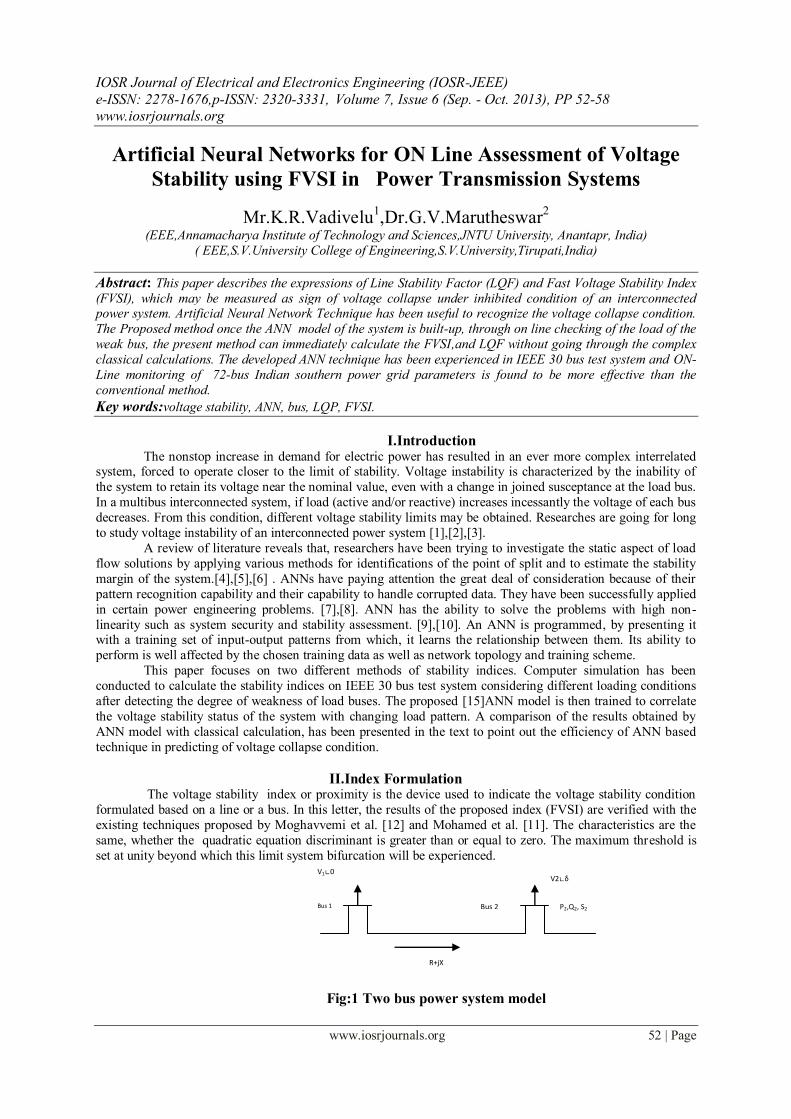
Fig:1 Two bus power system model
Bus 1 P2,Q2, S2 Bus 2
R+jX
V1∟0 V2∟δ
Artificial Neural Networks foron Line Assessment of VoltageStabilityusing FVSI in Power
www.iosrjournals.org 53 | Page
III.Fvsi Formulation The FVSI is derived from the voltage quadratic equation at the receiving bus on a two-bus system. The
general two-bus representation is illustrated in Figure 1.
The sending end bus voltage is actually the summation of line drop and receiving end voltage [11]
V2ے-𝜹 + 𝑃2−𝑗𝑄 2
𝑉2ے+𝛿
(R +j X)=V1(1) 0ے
from equation(1), after separating the real and imaginary part and eliminating S we can have the
following equation
V24V2
22Q2 X V12 X
2P22 Q2
20 (2)
To have real solutions for voltage equation (2) must have real roots. Thus the following conditions, which
can be used as stability criterion, need to be satisfied:
(2 Q2 X – V12)
2 – 4 X
2( P2
2 + Q2
2) ≥ 0
or, LQF =
4𝑋 𝑄2+
𝑋𝑃 22
𝑉12
𝑉12 (3)
from equation (1), the real and reactive parts are separated value of P2 is obtained from real part and
substituted in reactive part to get
V22+Q2X+V1V2[
sin 𝛿
tan 𝛿 − cos𝛿]= 0 (4)
For getting real solution of voltage, equation (4) should have real roots and at limiting condition the
following criterion must be satisfied:
FVSI 4 XQ2 1.00 (5)
sin2
V 2
1
The stability criteria equation (3) and (5) are used to find the stability index for each line connected between
two busbars in an interconnected power network. Based on the stability indices of the lines, voltage collapse
can be accurately predicted. As long as the stability indices are less than 1, the system is stable and when these
exceed the value 1, the whole system loses its stability and voltage collapse occurs
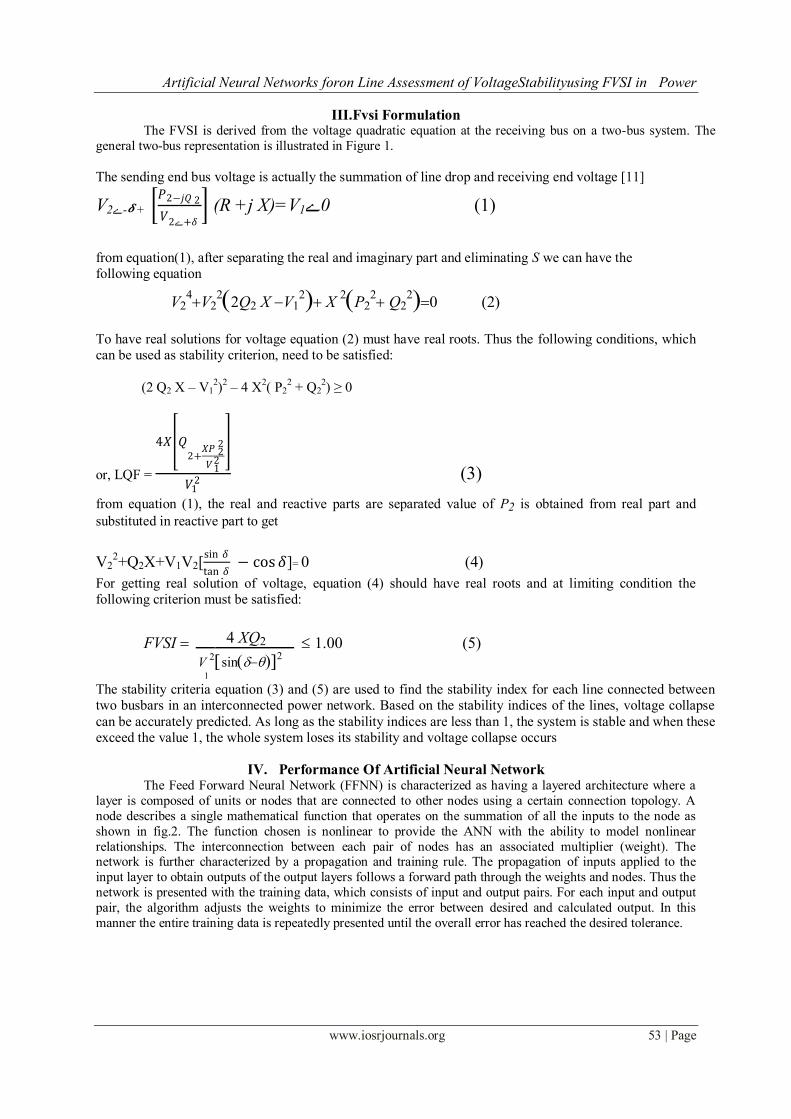
IV. Performance Of Artificial Neural Network The Feed Forward Neural Network (FFNN) is characterized as having a layered architecture where a
layer is composed of units or nodes that are connected to other nodes using a certain connection topology. A
node describes a single mathematical function that operates on the summation of all the inputs to the node as
shown in fig.2. The function chosen is nonlinear to provide the ANN with the ability to model nonlinear
relationships. The interconnection between each pair of nodes has an associated multiplier (weight). The network is further characterized by a propagation and training rule. The propagation of inputs applied to the
input layer to obtain outputs of the output layers follows a forward path through the weights and nodes. Thus the
network is presented with the training data, which consists of input and output pairs. For each input and output
pair, the algorithm adjusts the weights to minimize the error between desired and calculated output. In this
manner the entire training data is repeatedly presented until the overall error has reached the desired tolerance.
Artificial Neural Networks foron Line Assessment of VoltageStabilityusing FVSI in Power
www.iosrjournals.org 54 | Page
Figure 2: Characteristics of a node of ANN
V. A Mathematical Approach – Steps Of The Algorithm Units are connected to one another. Connections correspond to the edges of the underlying directed
graph. There is a real number associated with each connection, which is called the weight of the connection. We
denote by Wij the weight of the connection from unit ui to unit uj. It is then convenient to represent the pattern
of connectivity in the network by a weight matrix W whose elements are the weights Wij. Two types of connection are usually distinguished: excitatory and inhibitory. A positive weight represents an excitatory
connection whereas a negative weight represents an inhibitory connection. The pattern of connectivity
characterises the architecture of the network.
The algorithm consists of four steps:
Step 1. Compute how fast the error changes as the activity of an output unit is changed. This error derivative
(EA) is the difference between the actual and the desired activity.
𝐸𝐴𝑗 = 𝑑𝐸
𝑑𝑦 𝑗 = 𝑦𝑗 - 𝑑𝑗 (6)
Step 2. Compute how fast the error changes as the total input received by an output unit is changed. This
quantity (EI) is the answer from step 1 multiplied by the rate at which the output of a unit changes as its total
input is changed.
Ei𝑗 = 𝑑𝐸
𝑑𝑥 𝑗x𝑑𝑦 𝑗
𝑑𝑥 𝑗= 𝐸𝐴𝑗𝑦𝑗 1 − 𝑦𝑗 (7)
Step 3. Compute how fast the error changes as a weight on the connection into an output unit is changed. This
quantity (EW) is the answer from step 2 multiplied by the activity level of the unit from which the connection
emanates.
𝐸𝑊𝑖𝑗 = 𝑑𝐸
𝑑𝑊𝑖𝑗=
𝑑𝐸
𝑑𝑥 𝑗x
𝑑𝑥 𝑗
𝑑𝑊 𝑖𝑗 = 𝐸𝑖𝑗 𝑦𝑗 (8)
Step 4. Compute how fast the error changes as the activity of a unit in the previous layer is changed. This crucial
step allows back propagation to be applied to multilayer networks. When the activity of a unit in the previous
layer changes, it affects the activities of all the output units to which it is connected. So to compute the overall
effect on the error, we add together all these separate effects on output units. But each effect is simple to
calculate. It is the answer in step 2 multiplied by the weight on the connection to that output unit
𝐸𝐴𝑖=𝑑𝐸
𝑑𝑦 𝑖∑
𝑑𝐸
𝑑𝑥 𝑗 x
𝑑𝑥 𝑗
𝑑𝑦 𝑗 =∑𝐸𝑖𝑗 𝑊𝑖𝑗 (9)
j j
By using steps 2 and 4, we can convert the EAs of one layer of units into EAs for the previous layer. This
procedure can be repeated to get the EAs for as many previous layers as desired. Once we know the EA of a
unit, we can use steps 2 and 3 to compute the EWs on its incoming connections.
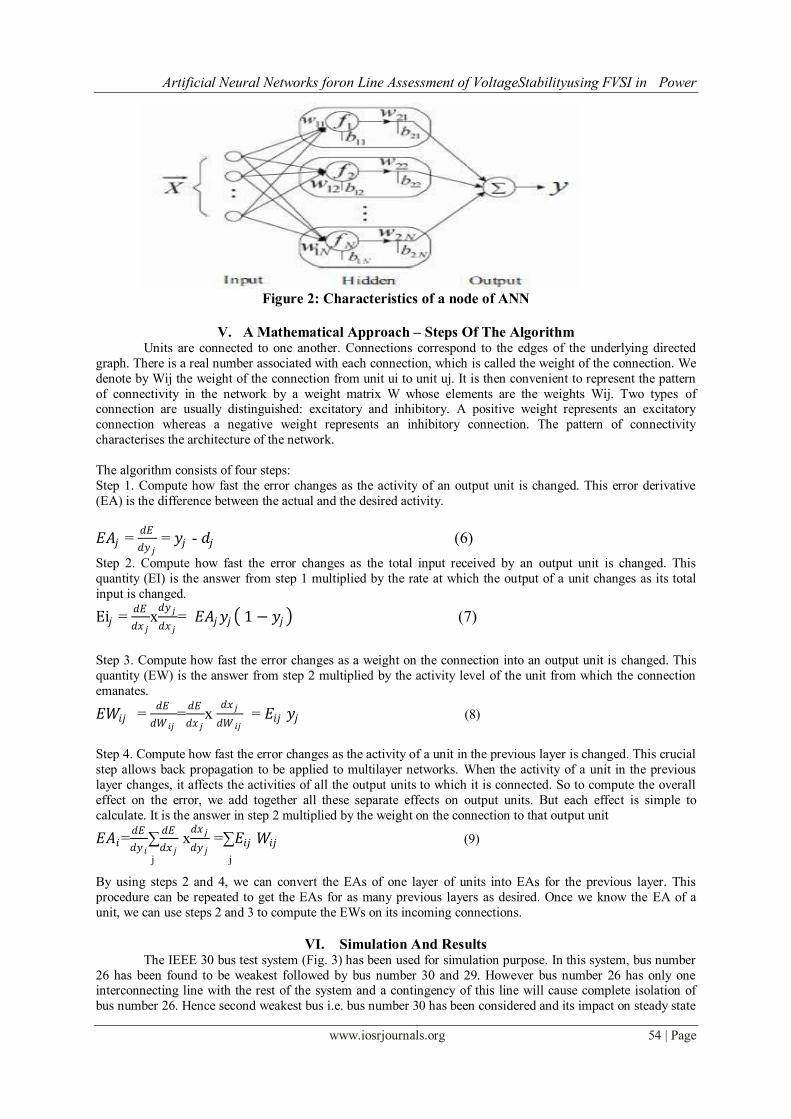
VI. Simulation And Results The IEEE 30 bus test system (Fig. 3) has been used for simulation purpose. In this system, bus number
26 has been found to be weakest followed by bus number 30 and 29. However bus number 26 has only one interconnecting line with the rest of the system and a contingency of this line will cause complete isolation of
bus number 26. Hence second weakest bus i.e. bus number 30 has been considered and its impact on steady state
Artificial Neural Networks foron Line Assessment of VoltageStabilityusing FVSI in Power
www.iosrjournals.org 55 | Page
voltage stability has been observed. For different load values at bus number 30, the developed ANN algorithm is
able to find out the stability limit for the system without any classical calculation
.
Figure 3: IEEE 30 bus system
The ANN model was trained with a number of input training vector set to meet convergence criterion. After the
training goal is achieved and the network is fully trained with the correlation between the changing load pattern
and the corresponding values of FVSI and LQP for the lines connected with the bus number 30, i.e. line
connected with bus 30 and 27 and line connected with bus number 30 and 29. The generalizing capability of the
trained ANN model is tested by a set of unknown test data. A few sample of the test results are in Table-I. The
agreement between computed and estimated results is good.
Table-I Comparison of Results obtained From Classical Calculation And ANN Algorithm FVSI LQF FVSI LQF
(27-30)
from
classical
(27-30)
from
ANN
(27-30)
from
classical
(27-30)
from
ANN
(29-30)
from
classical
(29-30)
from
ANN
(29-30)
from
classical
(29-30)
from
ANN
0.0872 0.0874 0.0473 0.0438 0.0653 0.0652 0.0381 0.0375
0.1296 0.1294 0.0719 0.0756 0.1017 0.097 0.0601 0.0614
0.1466 0.1465 0.0871 0.0862 0.1153 0.1154 0.0683 0.0694
0.1551 0.1559 0.0923 0.0924 0.1221 0.1228 0.0725 0.0746
0.1637 0.1641 0.0976 0.0986 0.1297 0.1297 0.0766 0.0796
0.1894 0.1896 0.1135 0.1132 0.1496 0.1488 0.0893 0.0903
0.1985 0.1974 0.1189 0.1185 0.1565 0.1562 0.0936 0.0952
0.2153 0.2168 0.1297 0.1302 0.1705 0.1706 0.1022 0.102
0.2413 0.2428 0.1462 0.1437 0.1916 0.1917 0.1155 0.1152
0.2588 0.2583 0.1574 0.1566 0.2058 0.2054 0.1244 0.1252
0.3295 0.329 0.2032 0.2024 0.2644 0.2634 0.1615 0.1634
0.4015 0.4018 0.2513 0.2518 0.3242 0.3243 0.2008 0.2002
0.4565 0.4552 0.3709 0.3695 0.2889 0.2874 0.2318 0.2319
0.5221 0.5217 0.4272 0.4269 0.3344 0.3338 0.2699 0.2683
0.5314 0.5317 0.4355 0.4345 0.3411 0.3408 0.2755 0.3008
0.5792 0.5791 0.4772 0.4771 0.3751 0.3746 0.3043 0.3033
0.5888 0.5878 0.4857 0.4848 0.3821 0.3809 0.3102 0.3105
0.6672 0.6677 0.5557 0.5552 0.4102 0.4112 0.3343 0.3347
0.7073 0.7072 0.5922 0.5912 0.4689 0.4685 0.3852 0.3869
Artificial Neural Networks foron Line Assessment of VoltageStabilityusing FVSI in Power
www.iosrjournals.org 56 | Page
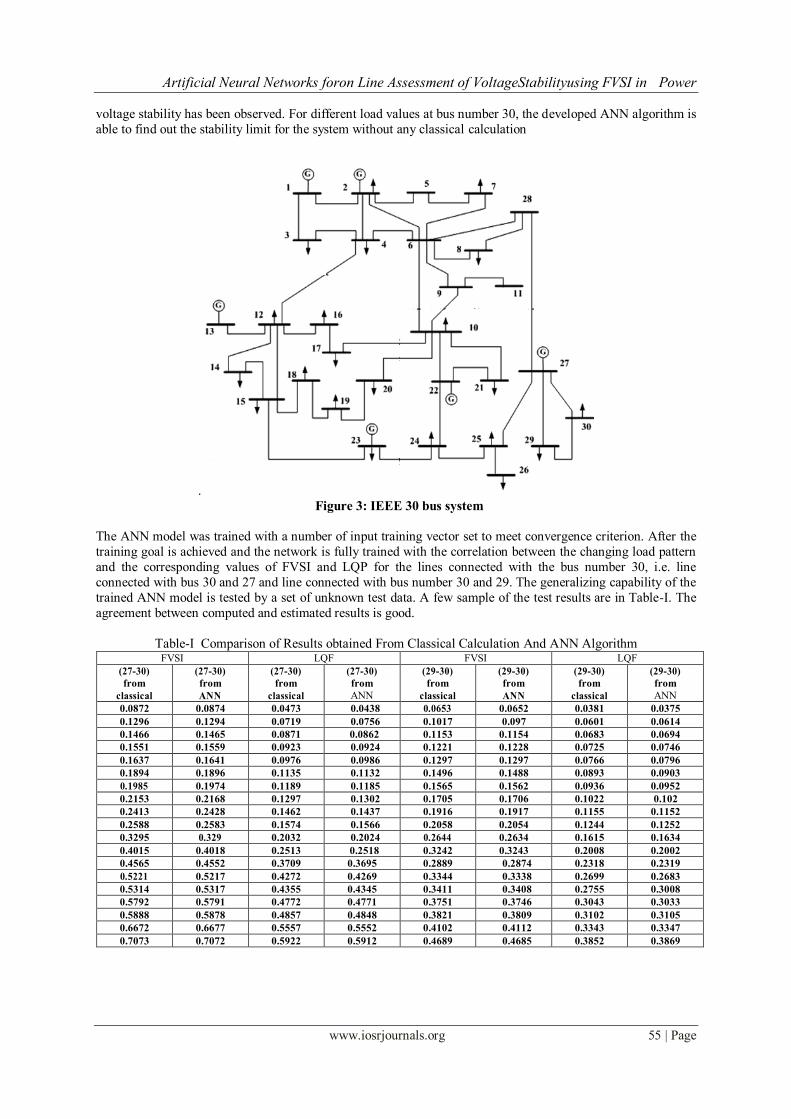
VII. Test Systems And Results G.Prasad, Dr.G.Vijyakumar et al. [14] suggested the proposed method can be efficiently used for on line
assessment of voltage on heavily loaded condition for voltage stability improvement. Based on this the Indian
Southern Region Extra High Voltage (SREHV) 72-Bus System is considered
The SREHV 72-bus power system is divided into three areas
ZONE-1, ZONE-2 and ZONE-3shown in figure,4
Buses 2,3,4,5,16,24,25,30,31,33,35,36,44,45,54,56,57,58 are in ZONE-1.
Buses1,6,7,8,17,18,19,20,21,22,23,26,27,32,46,47,52,55,59,60,61,62,63,66,69,70 are in ZONE-2.
Buses9,10,11,12,13,14,15,28,29,34,37,38,39,40,41,42,43,48,49,50,51,53,64,65,67,6871,72 are in ZONE-3.
Buses 1 to 15 are generator buses.
Bus16,17,18,19,20,21,22,23,25,28,29,30,31,32,33,34,35,36,37,38,39,40,41,42,43,48,49,52,53,54,55,64,65,66,68
, 69,71,72 are the load buses. The remaining buses are dummy buses and are used for interconnection
Fig.4 Single Line diagram of southern power grid 72 bus E.H.V System
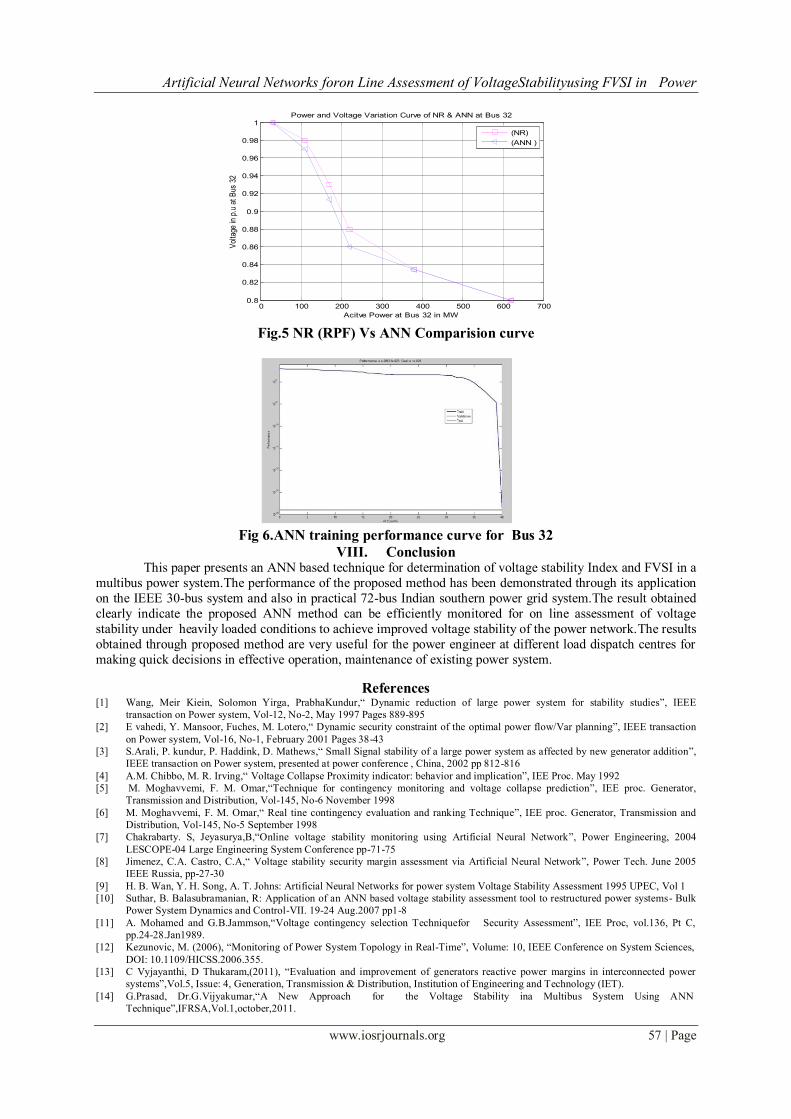
Case1: Varying the Load at Bus-32 using Repeted Power Flow (RPF) Using Newton Raphson method[12-14] in polar co-ordination and
intelligent technique using ANN are used on bus-32 of SREHV 72-bus system by increasing load in steps , with
constant power factor and the load at other buses are kept as constant in all steps. The corresponding voltage
magnitude and phase angles are shown in Table II.The RPF is involving iterations towards the convergent point
and it can be only useful in steady state conditions, so these drawbacks would be overcome by ANN. Hence the
ANN is said to be best suitable for on-line monitoring of power system parameters.
Table I1.Varying the load at Bus 32
Real
Powerat
Bus-32
(MW)
NR Method
(RPF)
ANN Method
Voltage
Magnitude
(pu)
Phase
Angle
Voltage
Magnitude
(pu)
Phase
Angle
30 0.9964 -4.5106 0.9962 -4.5093
110 0.9834 -6.4212 0.9834 -6.2098
170 0.9632 -8.4346 0.9638 -8.3182
220 0.9135 -13.8667 0.9121 -13.7963
380 0.8154 -23.3048 0.8142 -23.3060
620 0.9532 -11.7503 0.9596 -11.7503
Artificial Neural Networks foron Line Assessment of VoltageStabilityusing FVSI in Power
www.iosrjournals.org 57 | Page
Fig.5 NR (RPF) Vs ANN Comparision curve
Fig 6.ANN training performance curve for Bus 32
VIII. Conclusion This paper presents an ANN based technique for determination of voltage stability Index and FVSI in a
multibus power system.The performance of the proposed method has been demonstrated through its application
on the IEEE 30-bus system and also in practical 72-bus Indian southern power grid system.The result obtained
clearly indicate the proposed ANN method can be efficiently monitored for on line assessment of voltage
stability under heavily loaded conditions to achieve improved voltage stability of the power network.The results
obtained through proposed method are very useful for the power engineer at different load dispatch centres for
making quick decisions in effective operation, maintenance of existing power system.
References [1] Wang, Meir Kiein, Solomon Yirga, PrabhaKundur,“ Dynamic reduction of large power system for stability studies”, IEEE
transaction on Power system, Vol-12, No-2, May 1997 Pages 889-895
[2] E vahedi, Y. Mansoor, Fuches, M. Lotero,“ Dynamic security constraint of the optimal power flow/Var planning”, IEEE transaction
on Power system, Vol-16, No-1, February 2001 Pages 38-43
[3] S.Arali, P. kundur, P. Haddink, D. Mathews,“ Small Signal stability of a large power system as affected by new generator addition”,
IEEE transaction on Power system, presented at power conference , China, 2002 pp 812-816
[4] A.M. Chibbo, M. R. Irving,“ Voltage Collapse Proximity indicator: behavior and implication”, IEE Proc. May 1992
[5] M. Moghavvemi, F. M. Omar,“Technique for contingency monitoring and voltage collapse prediction”, IEE proc. Generator,
Transmission and Distribution, Vol-145, No-6 November 1998
[6] M. Moghavvemi, F. M. Omar,“ Real tine contingency evaluation and ranking Technique”, IEE proc. Generator, Transmission and
Distribution, Vol-145, No-5 September 1998
[7] Chakrabarty. S, Jeyasurya,B,“Online voltage stability monitoring using Artificial Neural Network”, Power Engineering, 2004
LESCOPE-04 Large Engineering System Conference pp-71-75
[8] Jimenez, C.A. Castro, C.A,“ Voltage stability security margin assessment via Artificial Neural Network”, Power Tech. June 2005
IEEE Russia, pp-27-30
[9] H. B. Wan, Y. H. Song, A. T. Johns: Artificial Neural Networks for power system Voltage Stability Assessment 1995 UPEC, Vol 1
[10] Suthar, B. Balasubramanian, R: Application of an ANN based voltage stability assessment tool to restructured power systems- Bulk
Power System Dynamics and Control-VII. 19-24 Aug.2007 pp1-8
[11] A. Mohamed and G.B.Jammson,“Voltage contingency selection Techniquefor Security Assessment”, IEE Proc, vol.136, Pt C,
pp.24-28.Jan1989.
[12] Kezunovic, M. (2006), “Monitoring of Power System Topology in Real-Time”, Volume: 10, IEEE Conference on System Sciences,
DOI: 10.1109/HICSS.2006.355.
[13] C Vyjayanthi, D Thukaram,(2011), “Evaluation and improvement of generators reactive power margins in interconnected power
systems”,Vol.5, Issue: 4, Generation, Transmission & Distribution, Institution of Engineering and Technology (IET).
[14] G.Prasad, Dr.G.Vijyakumar,“A New Approach for the Voltage Stability ina Multibus System Using ANN
Technique”,IFRSA,Vol.1,october,2011.
0 100 200 300 400 500 600 7000.8
0.82
0.84
0.86
0.88
0.9
0.92
0.94
0.96
0.98
1Power and Voltage Variation Curve of NR & ANN at Bus 32
Acitve Power at Bus 32 in MW
Vol
tage
in p
.u a
t B
us 3
2
(NR)
(ANN )

Artificial Neural Networks foron Line Assessment of VoltageStabilityusing FVSI in Power
www.iosrjournals.org 58 | Page
K.R.Vadivelu,received the B.E.Electrical and Electronics Degreefrom Bharathiyar University,Coimbatore in 1997and
the M.Tech Degree in Power Systems from SASTRA University Tanjore,Tamilnadu in 2006 and pursuing Ph.D. in
Electrical and Electronics Engineering at S.V.University College of Engineering,S.V.University,Tirupati,Andhra
Pradesh.Currently he is working as a Assistant Professor in Electrical and Electronics Engineering department at
Annamacharya Institute of Technology and sciences,Tirupati,Andhra Pradesh.
G.Venkata Marutheswar received B.Tech Degree in Electrical Engineering,the M.Tech (with Distinction) Degree in
Instrumentation and Control Engineering and Ph.D Degree in Electrical and Electronics Engineering from Sri
Venkateswara University College of Engineering,S.V.University,Tirupati,Andhra Pradesh in 1985,1990 and
2009,respectively.Currently,he is Working as a Professor in the department of Electrical and Electronics
Enginering,S.V.University College of Engineering,Tirupati,Andhra Pradesh.