Embed Size (px)
Citation preview
PRODUCTION PROCESS OF ANGLE
BARS AT CATHAY METAL
CORPORATION USING
EXPONENTIAL DISTRIBUTION
UNDER MONTE CARLO SIMULATION
ABSTRACT This paper focuses on optimization of the production process in
terms of differential equation. It deals with the maximization of the profit and minimization of cost and time production. The proposed method was test by using exponential distribution under Monte Carlo simulation to test the reliability of the given method. This paper includes the exponential distribution and simulation of the given or proposed method compare to the company way of doing to remove or reduce those unnecessary steps that add to the cost, production time and delays.
This research paper uses differential equation which is helpful in Industrial Engineering. Industrial Engineering is focuses on quantitative data that is widely used in improving the organization through the use of planning, designing, problem solving and quality control. This mathematical study has a great impact in making the company to be the best. It has a widely aspect that affect the industry and improving it.
As a whole this paper will help us in decision making and as a base for the next study. This paper will also help the company to choose between the actual method and the proposed method to have more productive way of making their product and control their production to meet the satisfaction of the customer.
Keywords: Monte Carlo, Simulation Model, Reliability, Optimization
INTRODUCTIONNowadays optimization is very important for different
companies. It is their ways to have a production system that will give them organize environment and high profit. They need to meet the numbers of product to be produce in a specific time considering the two main purpose of optimization which is reducing the delay in production and reducing the costs used by the whole process. They need to study the time and motion of the process to identify the maximum or best way of doing the product and the minimal cost of doing it.
To meet this goal we can use simulation and mathematical optimization based on the data of the production. In this process we propose a new sequence of process based on the mathematical formulation of the problem. We used Exponential Distribution under Monte Carlo Simulation to solve the result of the new propose. The obtained optimal solution it is validated through a simulation model. In order to evaluate the performance related to the production, simulation is the best solution.
In this paper, we suggest an integrated optimization and simulation. This integrated optimization and simulation consist of minimizing the time and cost of the process while maintaining the quality of the product.
EXPERIMENTAL DETAILS, COMPUTATION
PROCEDURES,
OR THEORETICAL ANALYSIS
In probability theory and statistics, the exponential
distribution (a.k.a. negative exponential
distribution) is the probability distribution that
describes the time between events in a Poisson
process, i.e. a process in which events occur
continuously and independently at a constant
average rate. It is the continuous analogue of the
geometric distribution, and it has the key property of
being memory less. In addition to being used for the
analysis of Poisson processes, it is found in various
other contexts.
MONTE CARLO SIMULATION
Monte Carlo Simulation refers to the use of random sampling to estimate the output of an experiment. It is regarded as the forerunner to present-day simulation.
This section uses an example to demonstrate the procedure. The objective of the example is to stress the statistical nature of the simulation experiment.
The estimation of the area of the circle is based on the assumption that all the points in the square are equally likely to occur. Thus, if out of a random sample of n points in the square, m are found to fall within the circle, then
(Area of the circle) ≈ m/n (Area of the square) ≈ m/n (10x10)
The idea is implemented by representing the coordinates x and y of a points in the square by the following uniform distribution.
f (x) = 1/10, -4 ≤ x ≤ 6 f (y) = 1/10, -3 ≤ x ≤ 7
Let R1 and R2 be two distinct random numbers between 0 and 1. Then an equally likely random point (x, y) in the square is determined as
x = - 4 + (6 – (-4)) R1 = - 4 + 10 R1
x = - 3 + (7 – (-3)) R2 = - 3 + 10 R2
TYPES OF SIMULATION
The execution of present-day simulation is based generally on the sampling idea of the Monte Carlo method. It differs in that it is concerned with the study of the behavior of real systems as a function of time. Two distinct types of simulation model exist.
Continuous models deal with systems whose behavior changes continuously with time. A typical example of continuous simulation is the study of world population dynamics. Continuous simulation models usually are represented in terms of difference- differential equations that describe the interactions among the different elements of the system.
Discrete models deal with systems whose behavior changes only at given instants. A typical example occurs in waiting lines where we are interested in estimating such measures as the average waiting time or the length of the waiting line. Such measures change only when a customer enters or leaves the system. At all other instants, nothing from the standpoint of collecting statics occurs in the system.
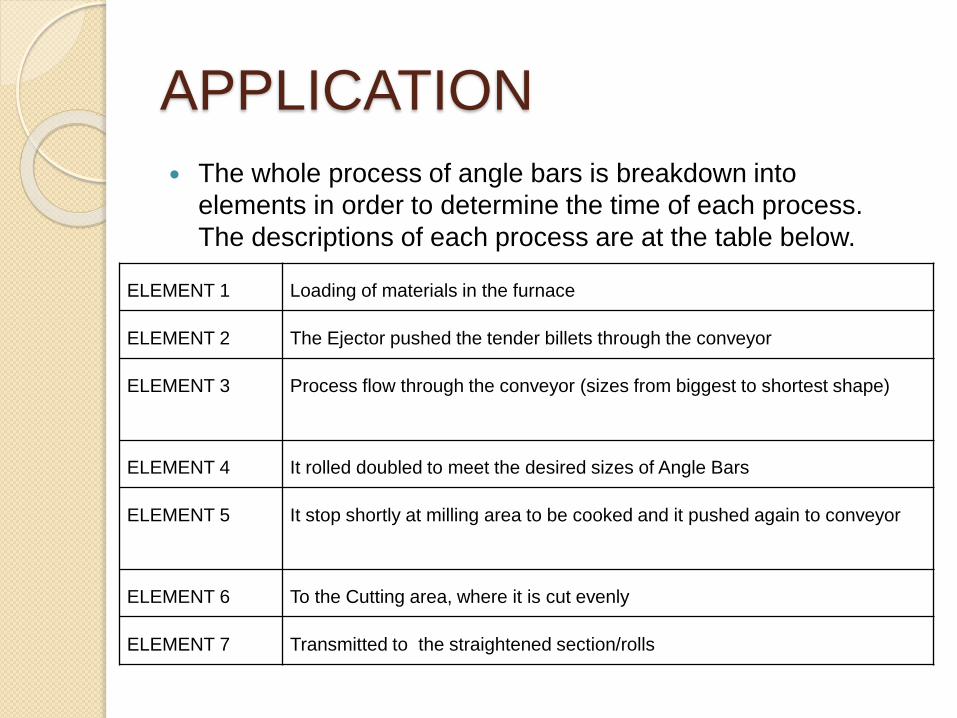
APPLICATION
The whole process of angle bars is breakdown into
elements in order to determine the time of each process.
The descriptions of each process are at the table below.
ELEMENT 1 Loading of materials in the furnace
ELEMENT 2 The Ejector pushed the tender billets through the conveyor
ELEMENT 3 Process flow through the conveyor (sizes from biggest to shortest shape)
ELEMENT 4 It rolled doubled to meet the desired sizes of Angle Bars
ELEMENT 5 It stop shortly at milling area to be cooked and it pushed again to conveyor
ELEMENT 6 To the Cutting area, where it is cut evenly
ELEMENT 7 Transmitted to the straightened section/rolls
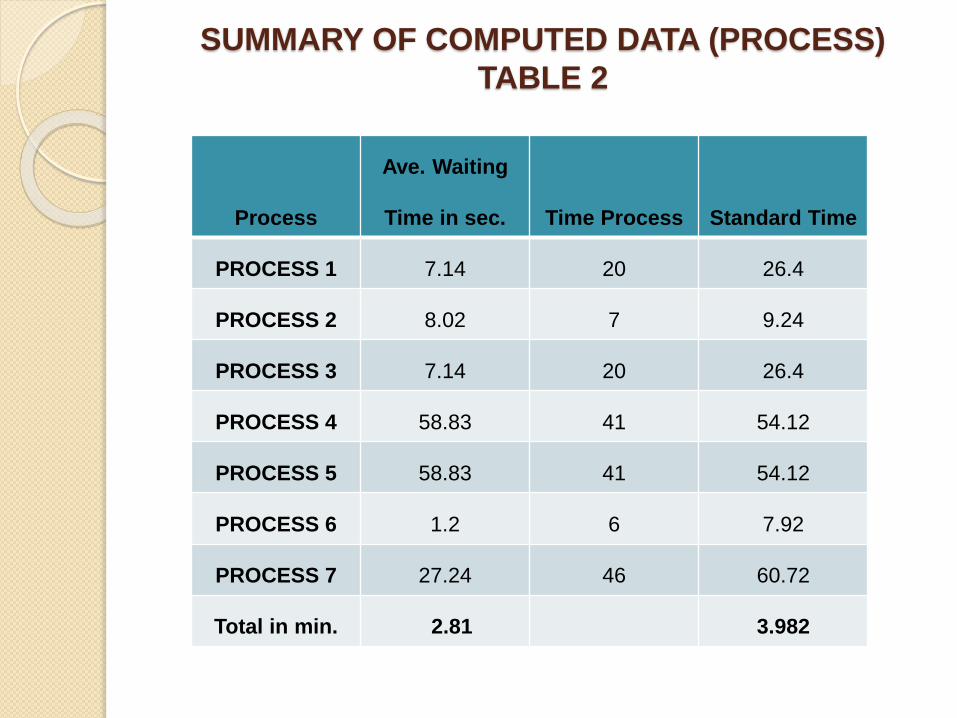
SUMMARY OF COMPUTED DATA (PROCESS)
TABLE 2
Process
Ave. Waiting
Time in sec. Time Process Standard Time
PROCESS 1 7.14 20 26.4
PROCESS 2 8.02 7 9.24
PROCESS 3 7.14 20 26.4
PROCESS 4 58.83 41 54.12
PROCESS 5 58.83 41 54.12
PROCESS 6 1.2 6 7.92
PROCESS 7 27.24 46 60.72
Total in min. 2.81 3.982
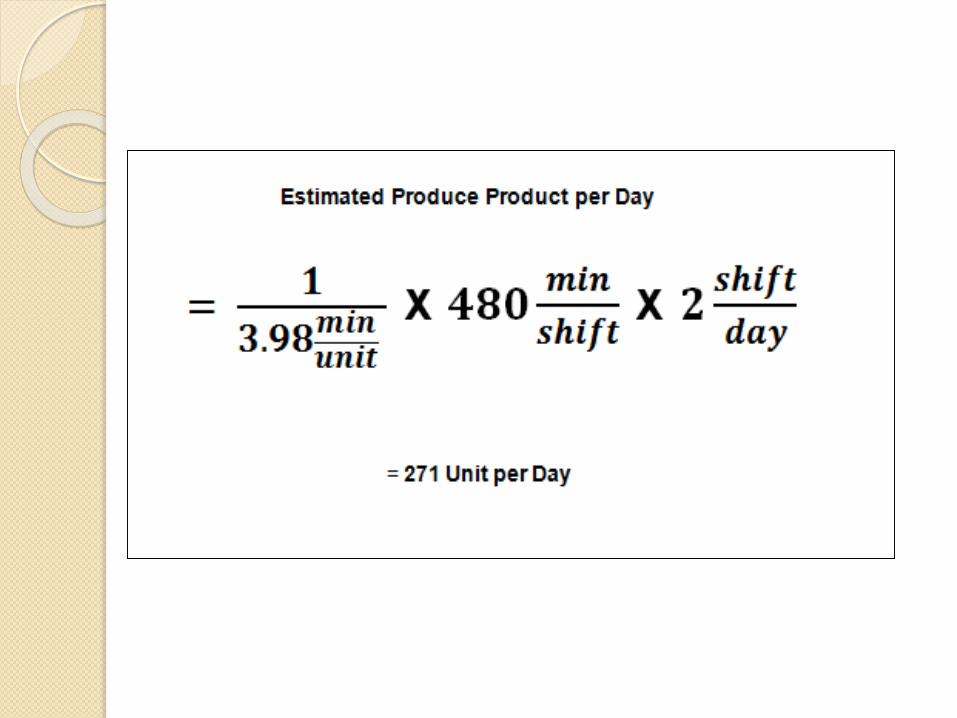
RESULT
By using this technique, we can now estimate the Future events of the process. We compared the different situation of the event like variation in arriving unit and departing unit. The idle time is determined and the production process with continuous arriving and departing of the unit. The unit per day is now forecasted. Using exponential distribution under Monte Carlo Simulation we can quickly find the Standard time by using only the two given values (the idle time and allowance time). We only used the first trial to calculate the Standard time compared long method observation. By using this, we can less the time required for the observation of each process.
This application is very useful to determine the allowance time in each process to maximize profit and minimize the cost in time production.
DISCUSSIONS
Monte Carlo Simulation refers to the use of random sampling to estimate the output of an experiment. It is regarded as the forerunner to present day simulation. We used the Exponential Distribution under Monte Carlo Simulation to determine the arrival time and the departure period of time. To know the estimated value of idle time in the process that affect the long period of production. It help us to determine possible events in the future in better decision making.
Production Process of Angle Bars are already given in the Table1 (Processing, Cutting and Transmitting of Angle Bars) and it break down into elements to compute the time in each process, there are 10 trials that observed to compute the Average time of each elements.
By using Exponential Distribution under Monte Carlo Simulation, we can compute the new Average time as well as the Standard Time to find the idle time in each element and to compare it to the existing Standard time.
CONCLUSIONS AND SUMMARY
Simulation is a highly flexible tool that can be used effectively for analyzing complex systems. It also has the drawback that its output is subject to statistical error and hence must be interpreted by appropriate statistical tests. The special nature of the simulation experiment makes it difficult to gather observations that are both independent and representative of the steady- state conditions. However, by using special method for collecting data, these difficulties may be alleviated. Simulation is not an optimization technique. Rather, it is a technique for estimating the measures of performance of the modeled system.
All simulation languages use events to drive the simulation model. Discrete languages are more flexible but are also more difficult to use than process oriented languages.

END