Embed Size (px)
Citation preview

WEEK 7 HOMEWORK HELPNUMBERS 13,15 & 19
B HeardNot to be copied, posted, shared without my permission. Students can download one copy for their personal use.
WEEK 7 HOMEWORK HELP (MORE)
.
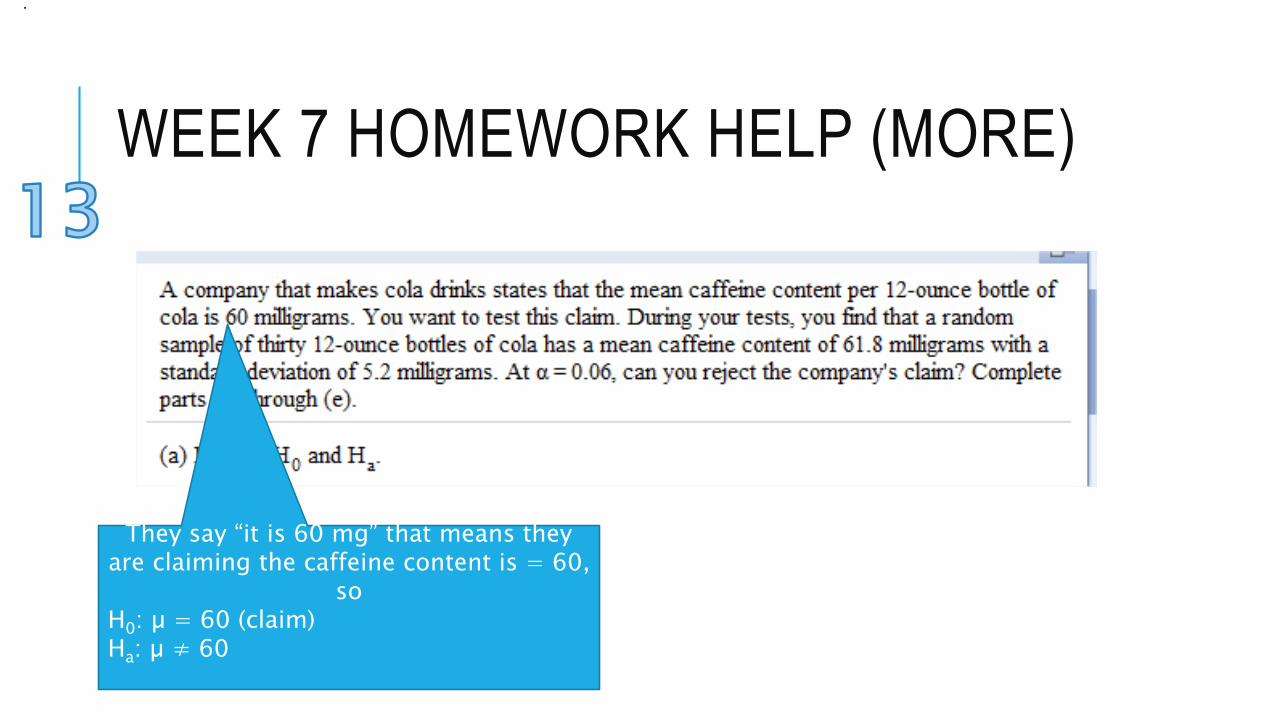
They say “it is 60 mg” that means they are claiming the caffeine content is = 60,
soH0: µ = 60 (claim)Ha: µ ≠ 60
WEEK 7 HOMEWORK HELP (MORE)
.
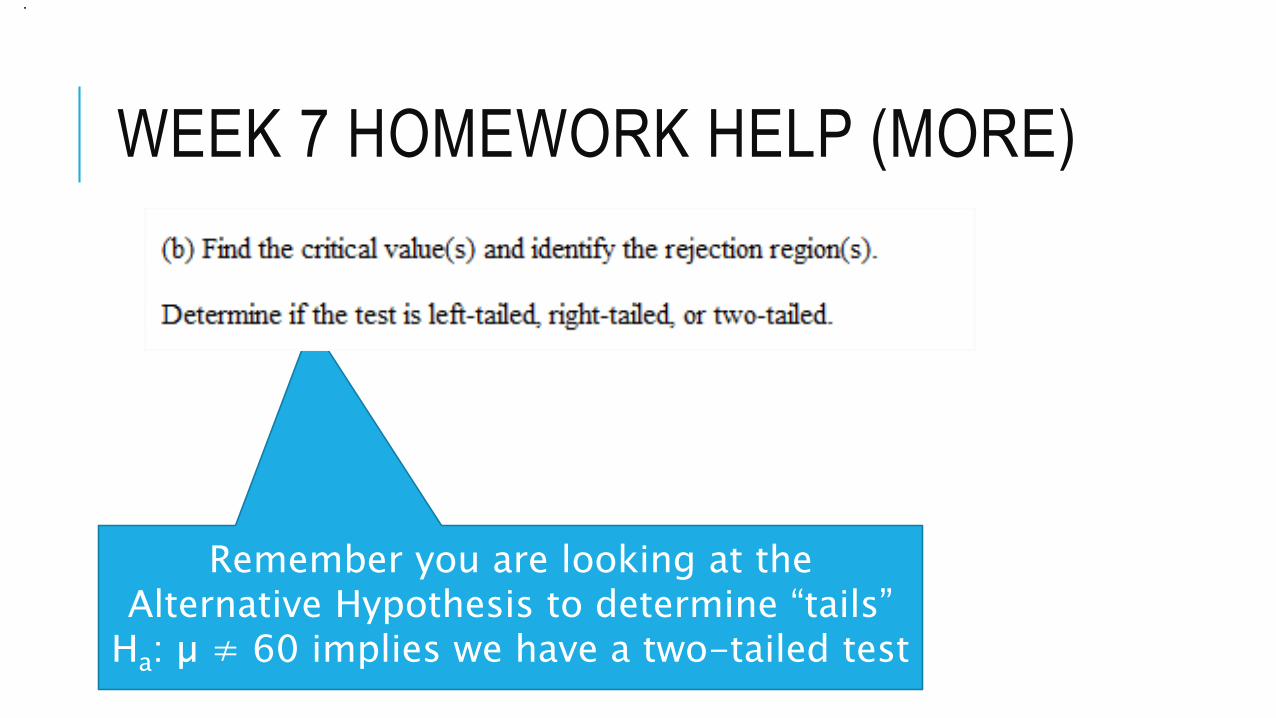
Remember you are looking at the Alternative Hypothesis to determine “tails”
Ha: µ ≠ 60 implies we have a two-tailed test

WEEK 7 HOMEWORK HELP (MORE)
.
As noted in the problem, our alpha is 0.06Use Minitab to find the critical valuesGraph >> Probability Distribution Plots >> Click View Probability
WEEK 7 HOMEWORK HELP (MORE)
.
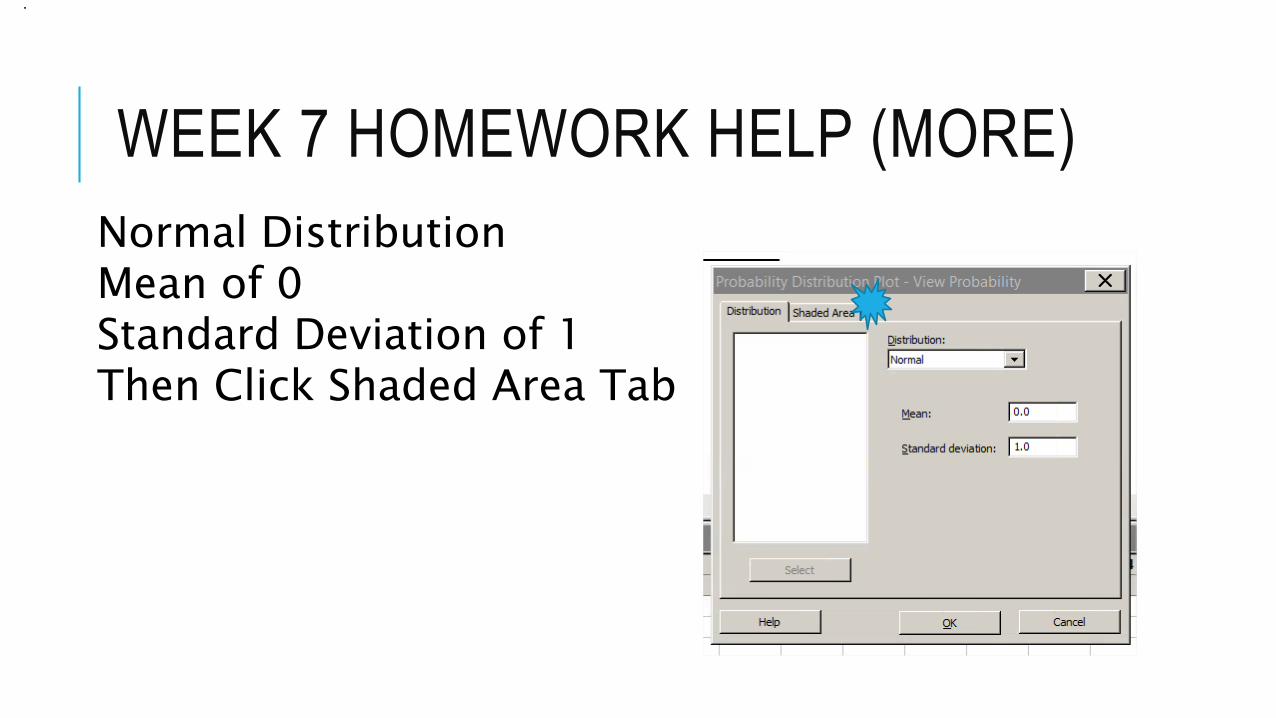
Normal DistributionMean of 0Standard Deviation of 1Then Click Shaded Area Tab
WEEK 7 HOMEWORK HELP (MORE)
.
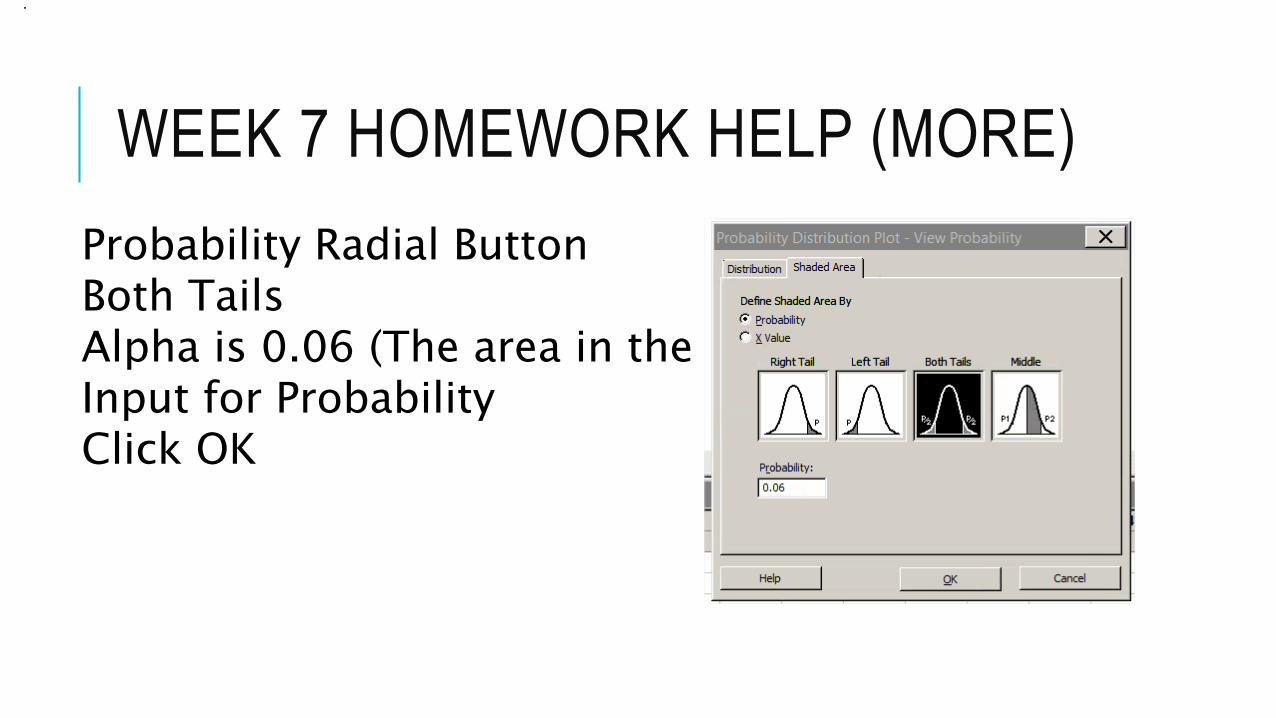
Probability Radial ButtonBoth TailsAlpha is 0.06 (The area in the tails)Input for ProbabilityClick OK
WEEK 7 HOMEWORK HELP (MORE)
.
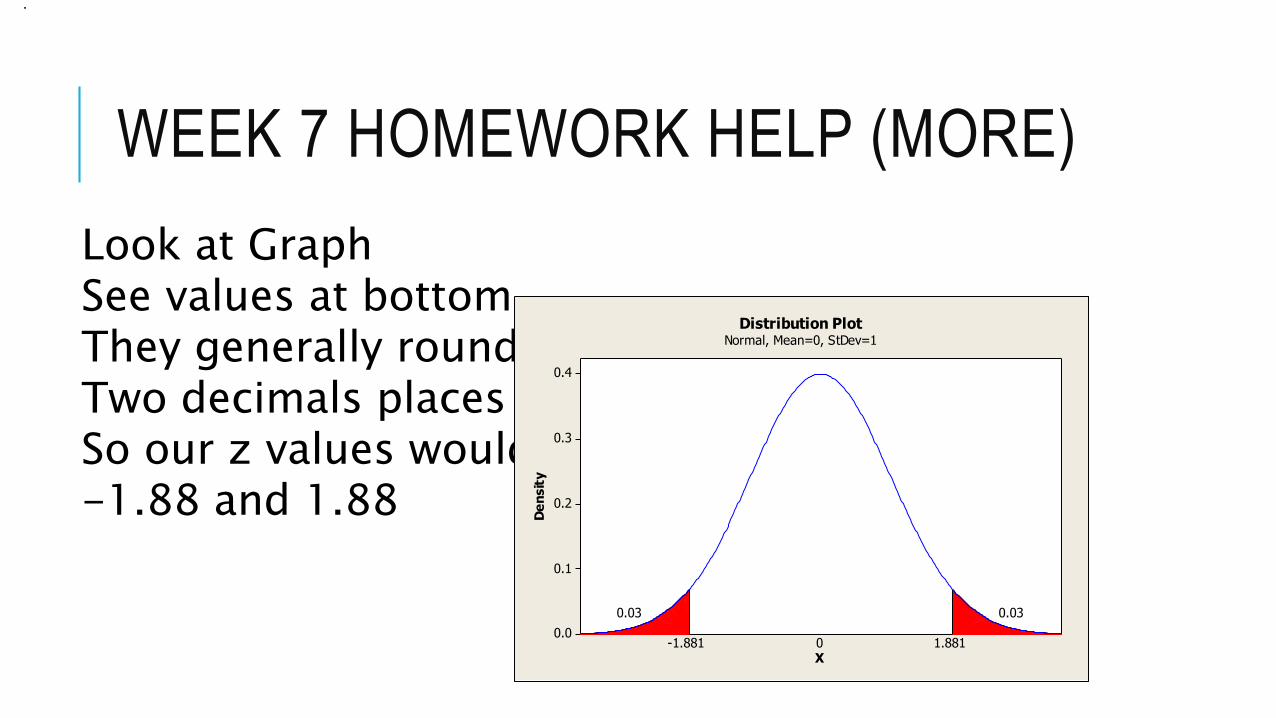
Look at GraphSee values at bottomThey generally round toTwo decimals placesSo our z values would be-1.88 and 1.88
0.4
0.3
0.2
0.1
0.0
X
De
nsit
y
-1.881
0.03
1.881
0.03
0
Distribution PlotNormal, Mean=0, StDev=1
WEEK 7 HOMEWORK HELP (MORE)
.
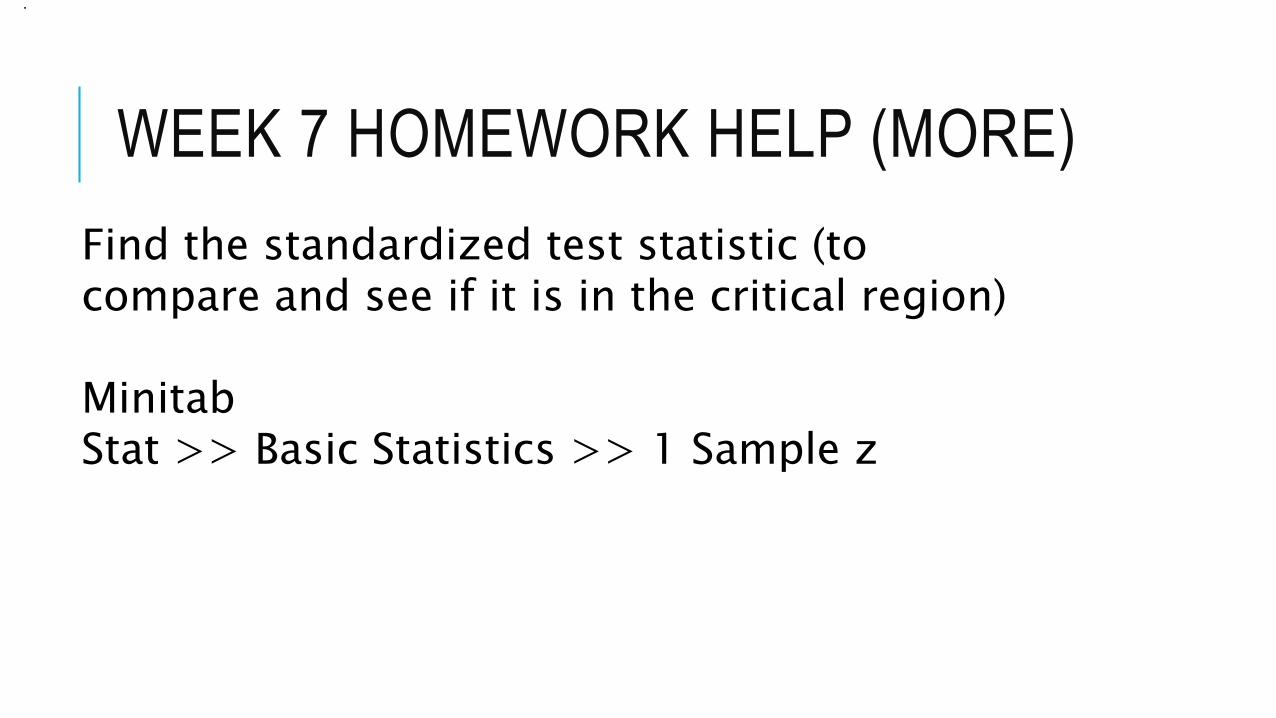
Find the standardized test statistic (to compare and see if it is in the critical region)
MinitabStat >> Basic Statistics >> 1 Sample z
WEEK 7 HOMEWORK HELP (MORE)
.
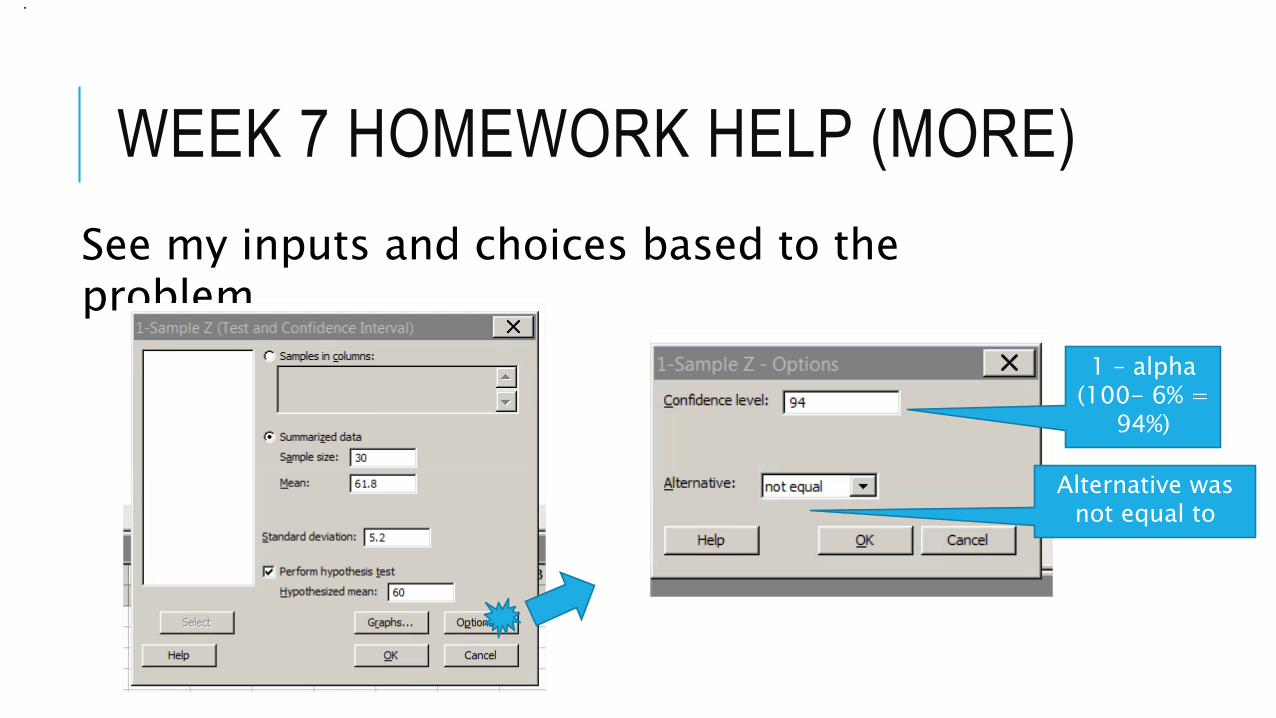
See my inputs and choices based to the problem
1 – alpha(100- 6% =
94%)
Alternative was not equal to
WEEK 7 HOMEWORK HELP (MORE)
.
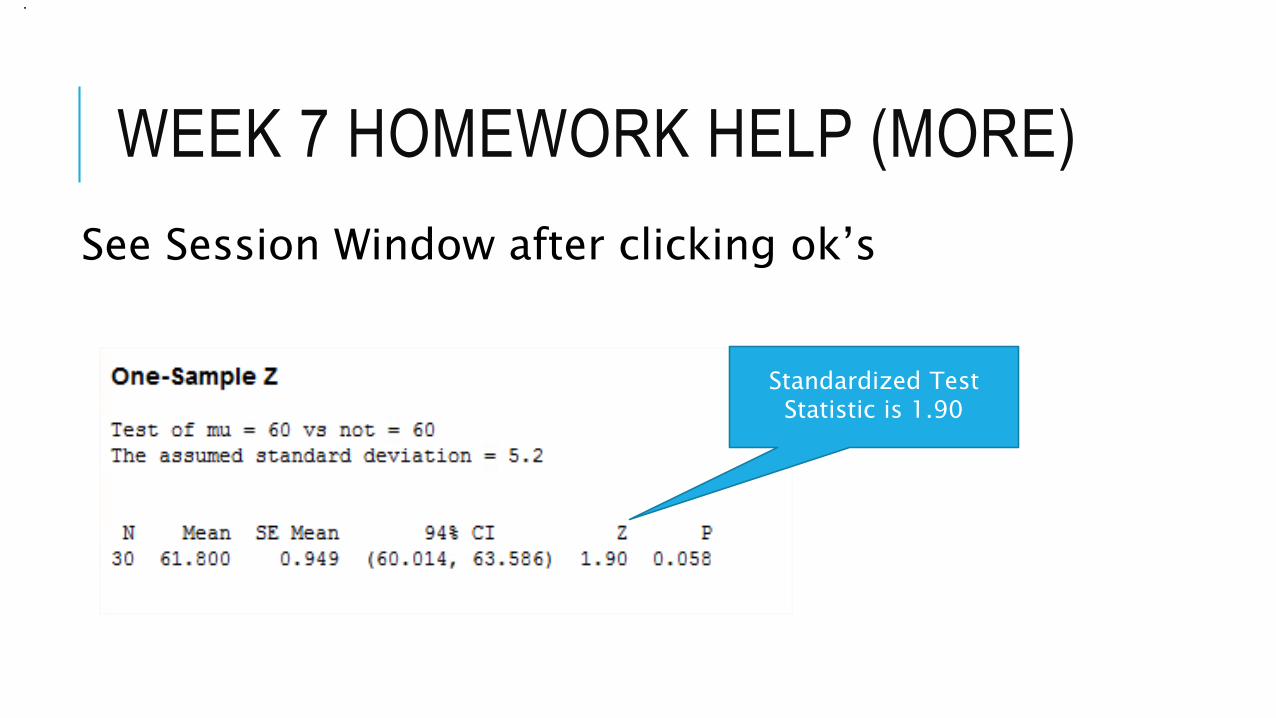
See Session Window after clicking ok’s
Standardized Test Statistic is 1.90
WEEK 7 HOMEWORK HELP (MORE)
.
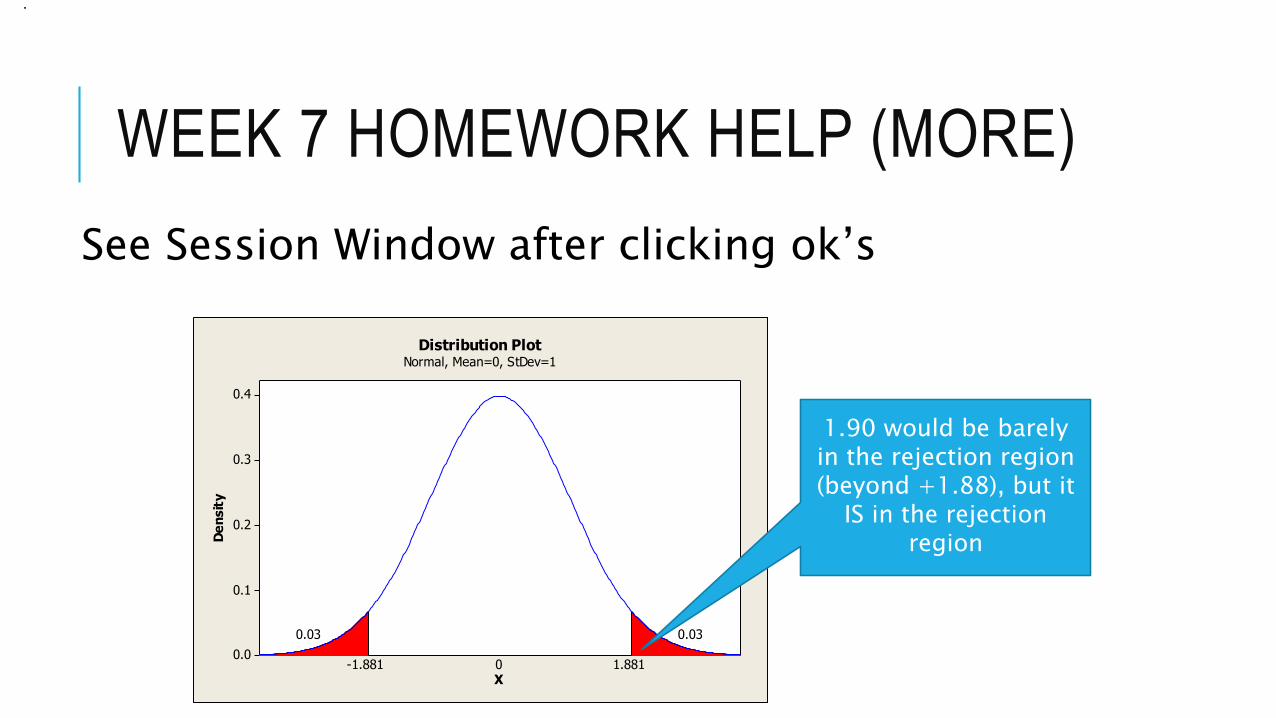
See Session Window after clicking ok’s
0.4
0.3
0.2
0.1
0.0
X
De
nsit
y
-1.881
0.03
1.881
0.03
0
Distribution PlotNormal, Mean=0, StDev=1
1.90 would be barely in the rejection region (beyond +1.88), but it
IS in the rejection region

What do we have?
Remember what we hadH0: µ = 60 (claim)Ha: µ ≠ 60Therefore we must REJECT the null that the caffeine content is 60 and say there is evidence that it is not 60, so we rejected the null (and the claim in this one) So we could say that there is enough evidence to reject the claim.
WEEK 7 HOMEWORK HELP (MORE)
.
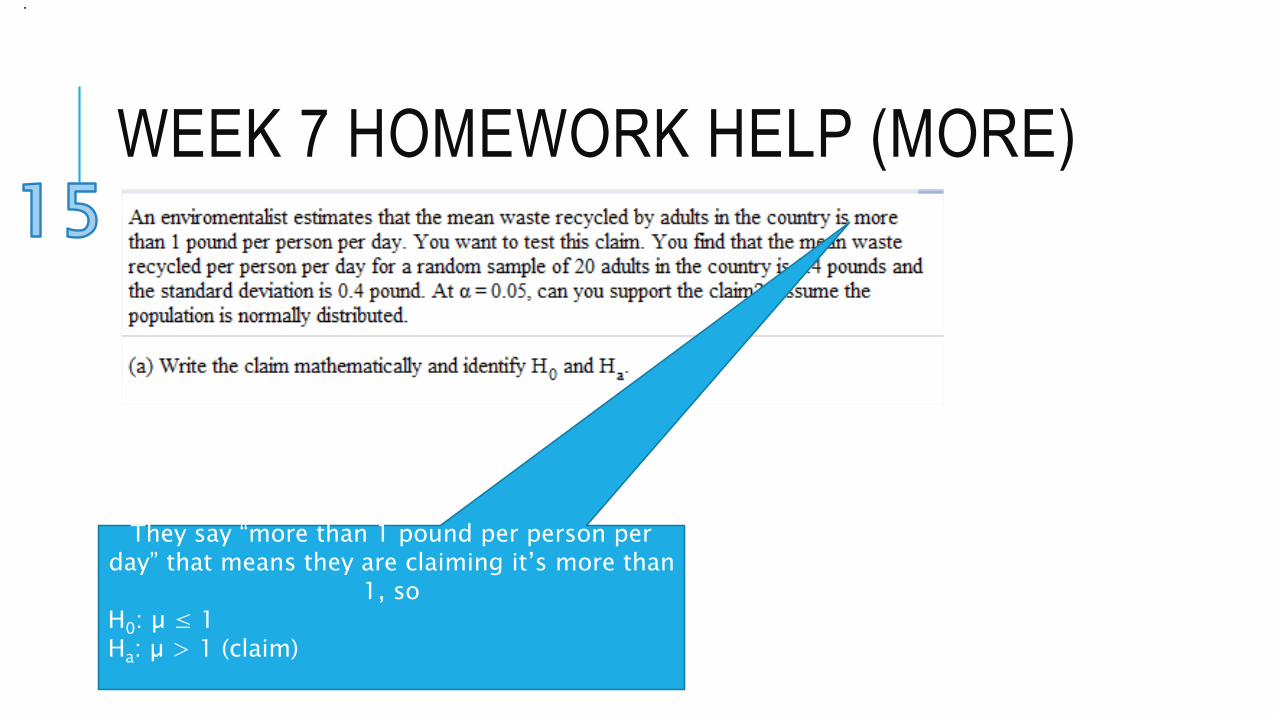
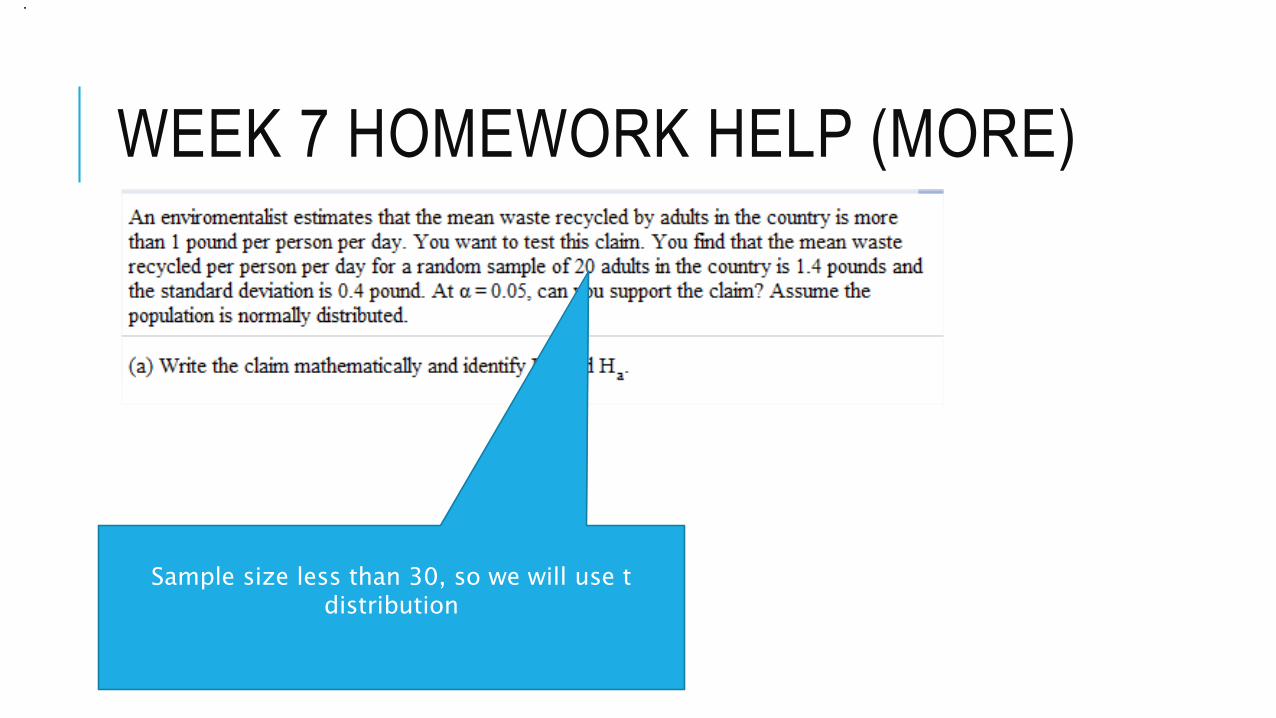
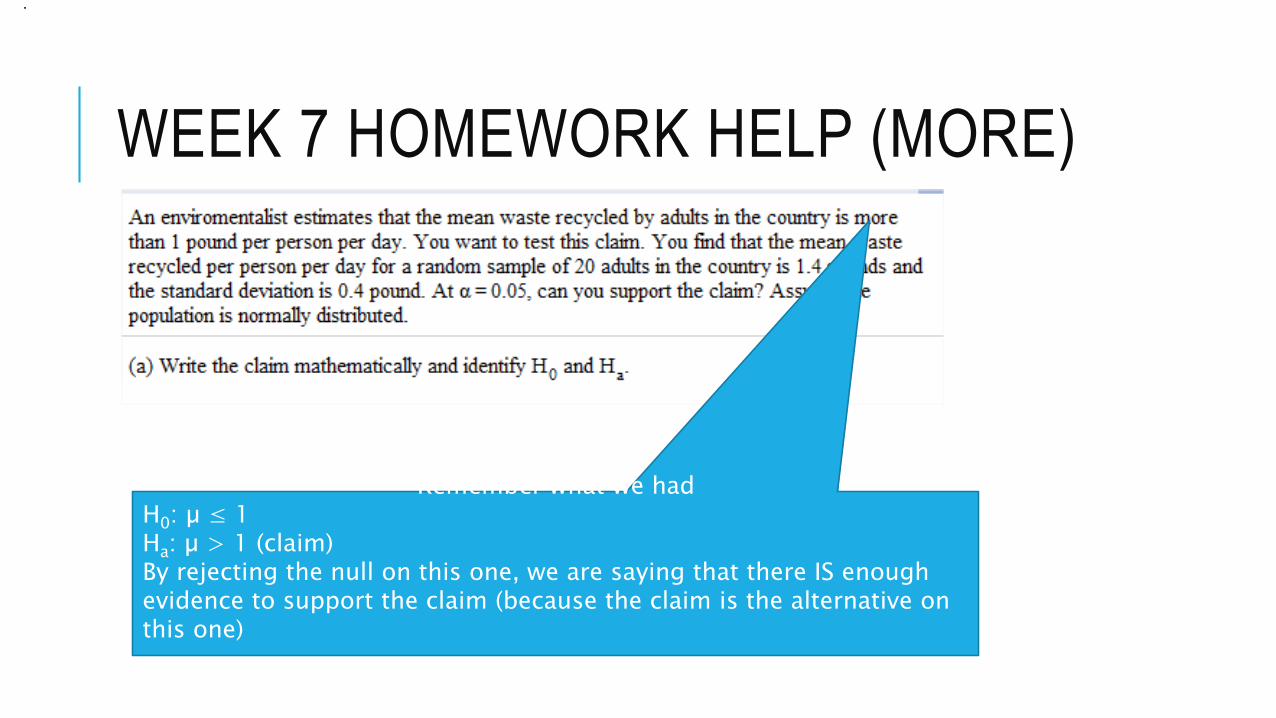
They say “more than 1 pound per person per day” that means they are claiming it’s more than
1, soH0: µ ≤ 1 Ha: µ > 1 (claim)
WEEK 7 HOMEWORK HELP (MORE)
.
Sample size less than 30, so we will use t distribution
WEEK 7 HOMEWORK HELP (MORE)
.
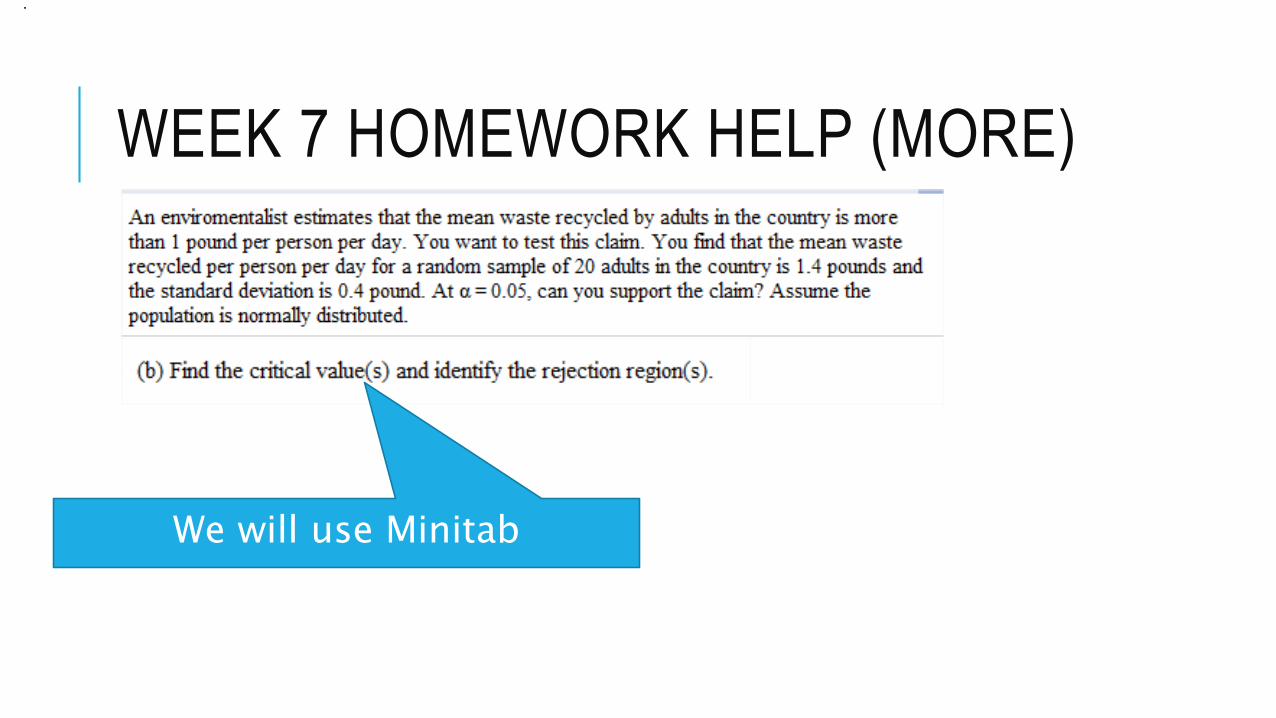
We will use Minitab
WEEK 7 HOMEWORK HELP (MORE)
.
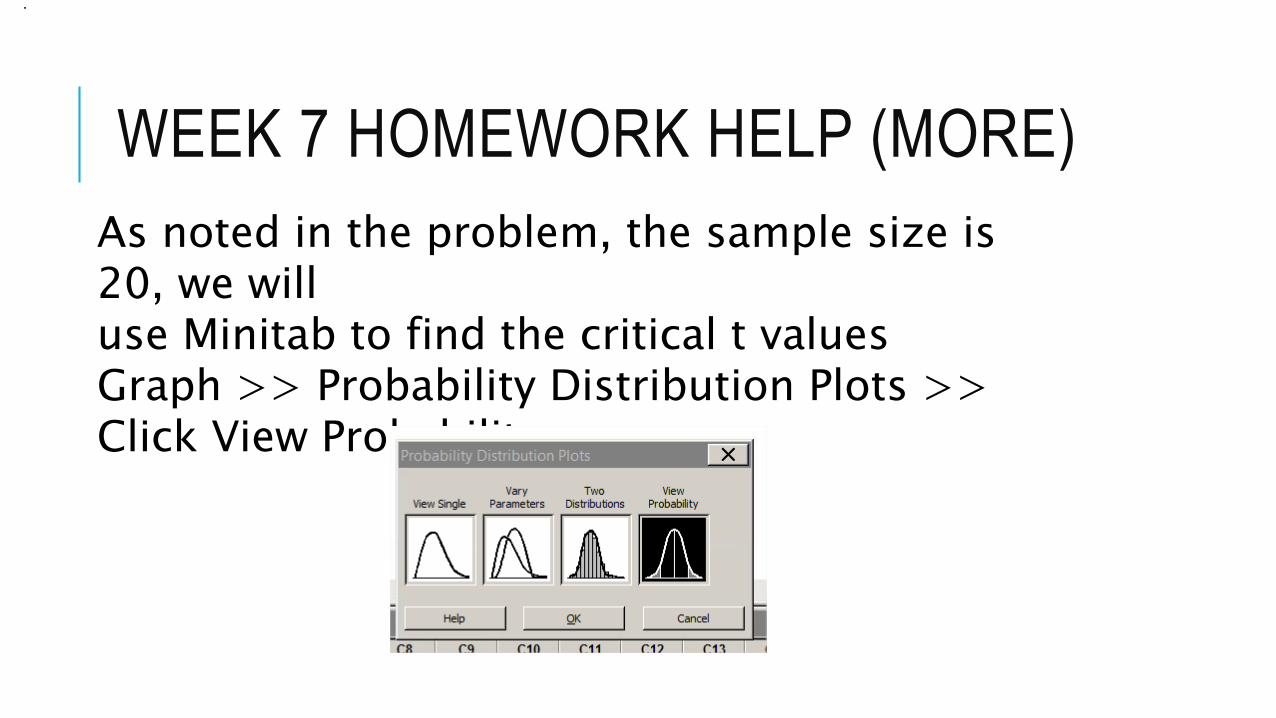
As noted in the problem, the sample size is 20, we willuse Minitab to find the critical t valuesGraph >> Probability Distribution Plots >> Click View Probability
WEEK 7 HOMEWORK HELP (MORE)
.
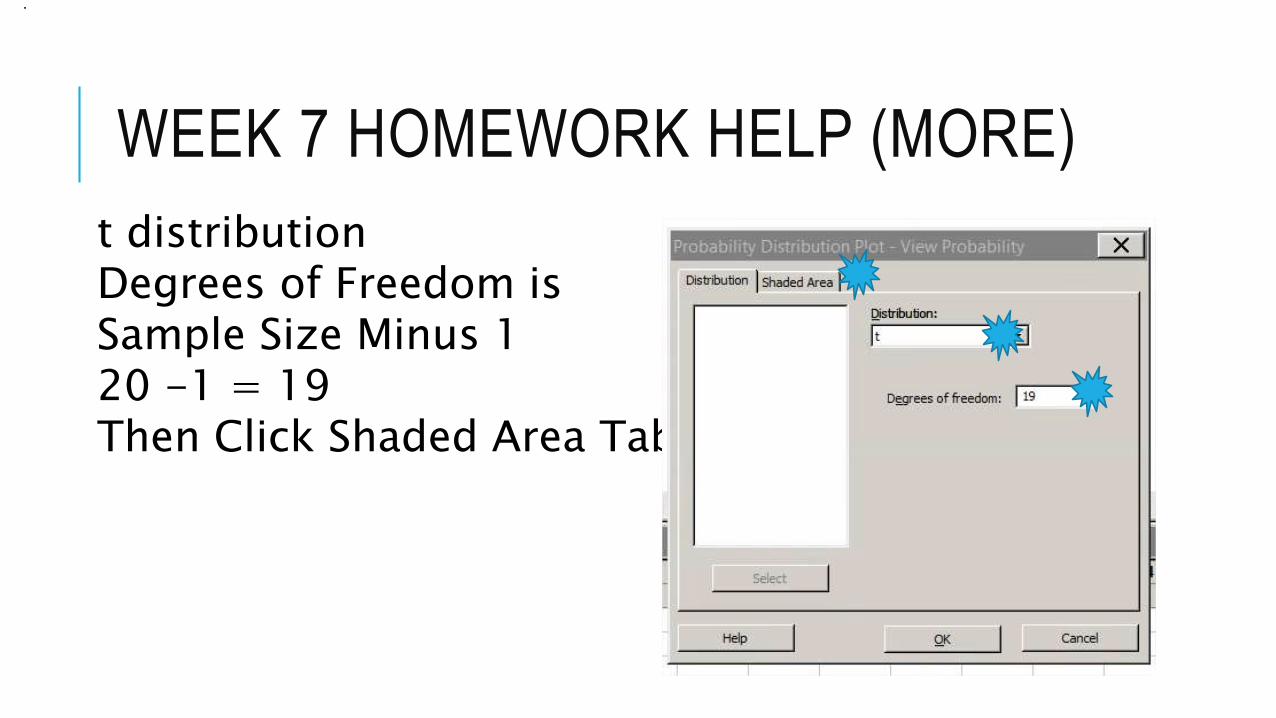
t distributionDegrees of Freedom isSample Size Minus 120 -1 = 19Then Click Shaded Area Tab
WEEK 7 HOMEWORK HELP (MORE)
.
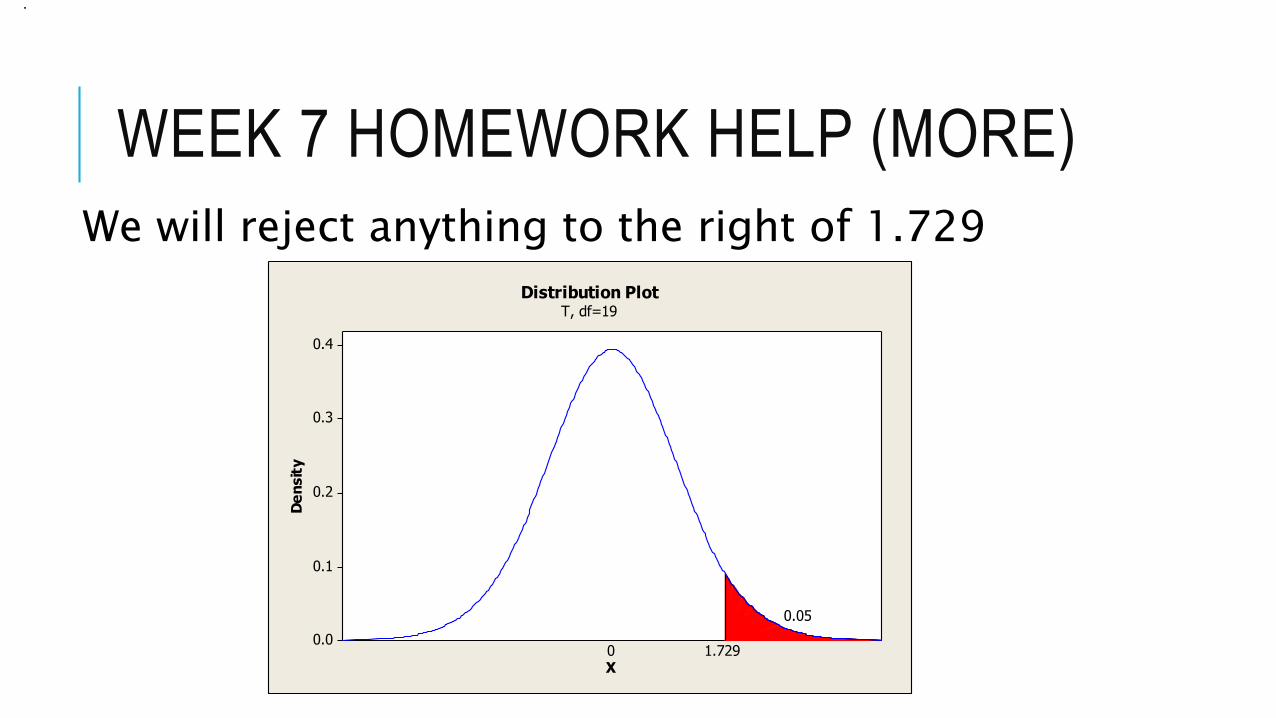
We will reject anything to the right of 1.729
0.4
0.3
0.2
0.1
0.0
X
De
nsit
y
1.729
0.05
0
Distribution PlotT, df=19

WEEK 7 HOMEWORK HELP (MORE)
.
We will use Minitab

WEEK 7 HOMEWORK HELP (MORE)
.
Find the standardized test statistic (to compare and see if it is in the critical region)
MinitabStat >> Basic Statistics >> 1 Sample t
WEEK 7 HOMEWORK HELP (MORE)
.
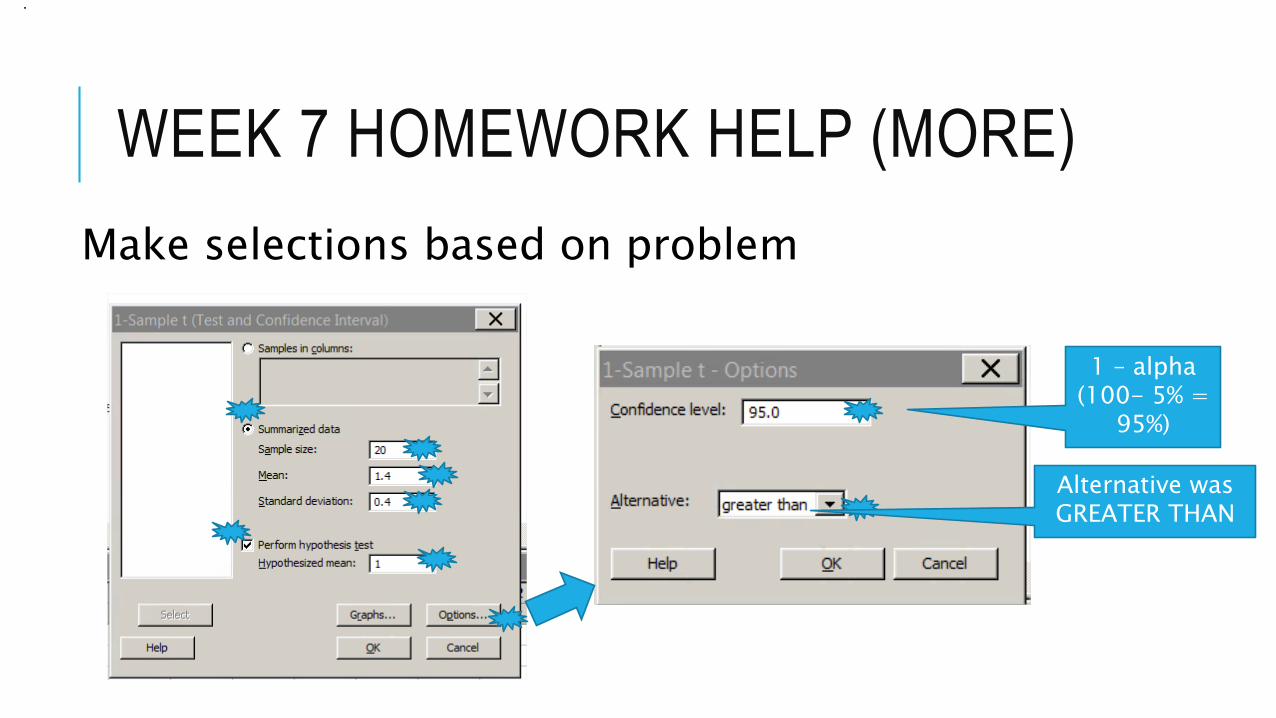
Make selections based on problem
1 – alpha(100- 5% =
95%)
Alternative was GREATER THAN
WEEK 7 HOMEWORK HELP (MORE)
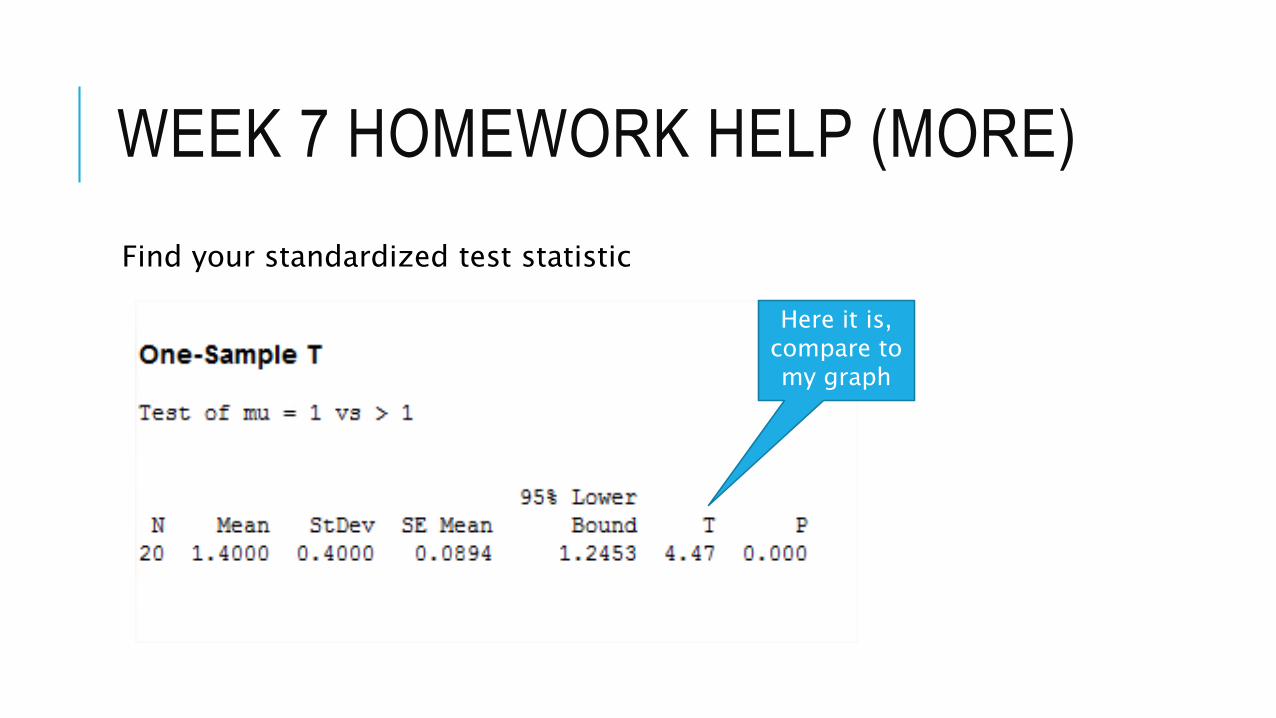
Find your standardized test statistic
Here it is, compare to my graph
WEEK 7 HOMEWORK HELP (MORE)
.
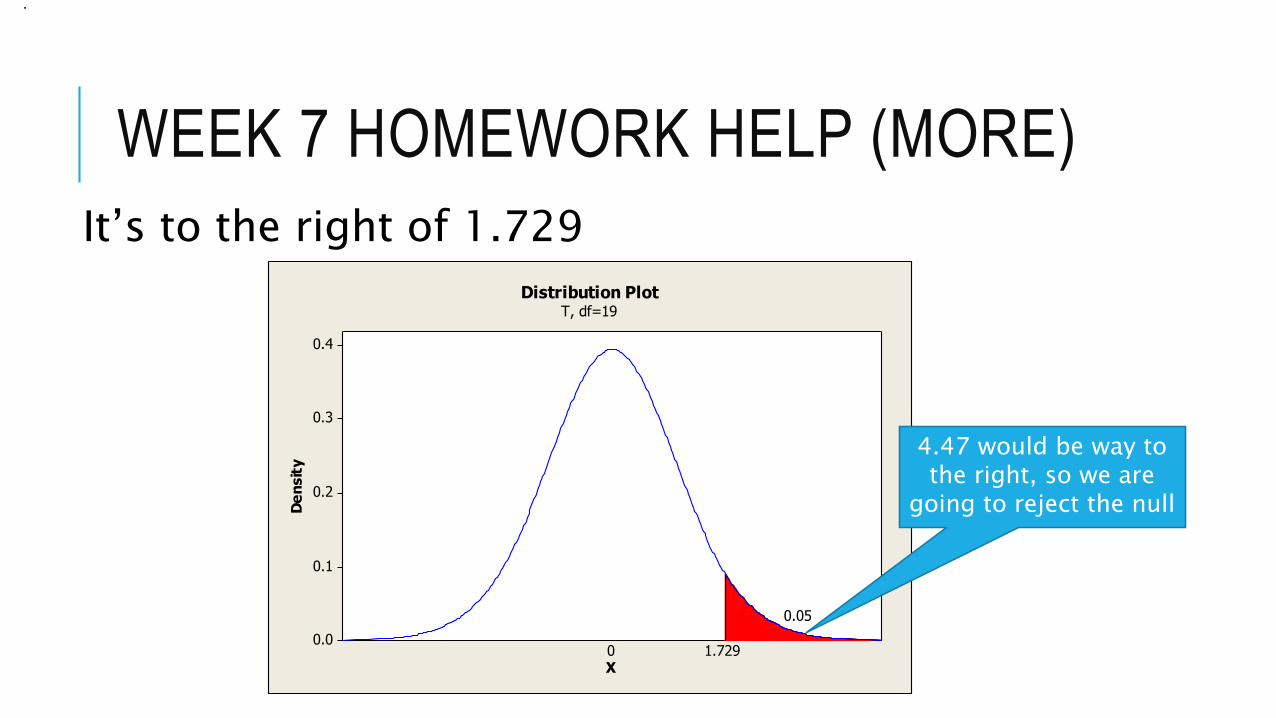
It’s to the right of 1.729
0.4
0.3
0.2
0.1
0.0
X
De
nsit
y
1.729
0.05
0
Distribution PlotT, df=19
4.47 would be way to the right, so we are
going to reject the null
WEEK 7 HOMEWORK HELP (MORE)
.
Remember what we hadH0: µ ≤ 1 Ha: µ > 1 (claim)By rejecting the null on this one, we are saying that there IS enough evidence to support the claim (because the claim is the alternative on this one)
WEEK 7 HOMEWORK HELP (MORE)
.
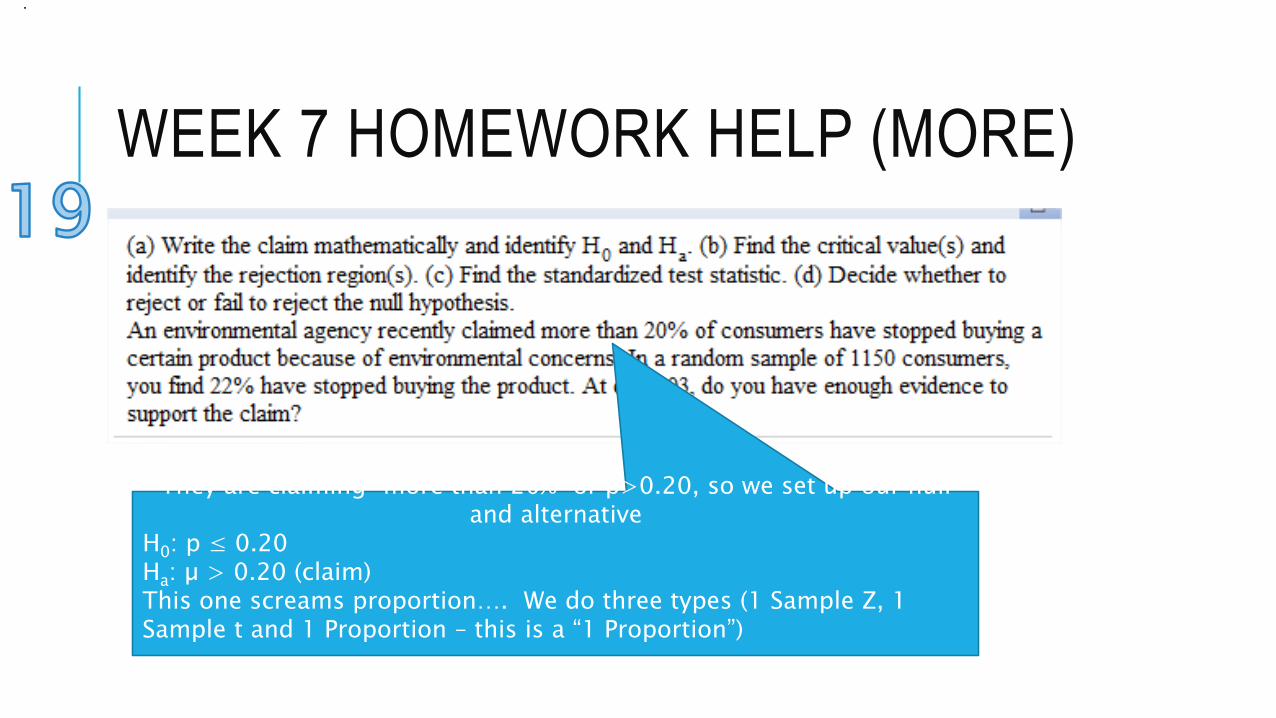
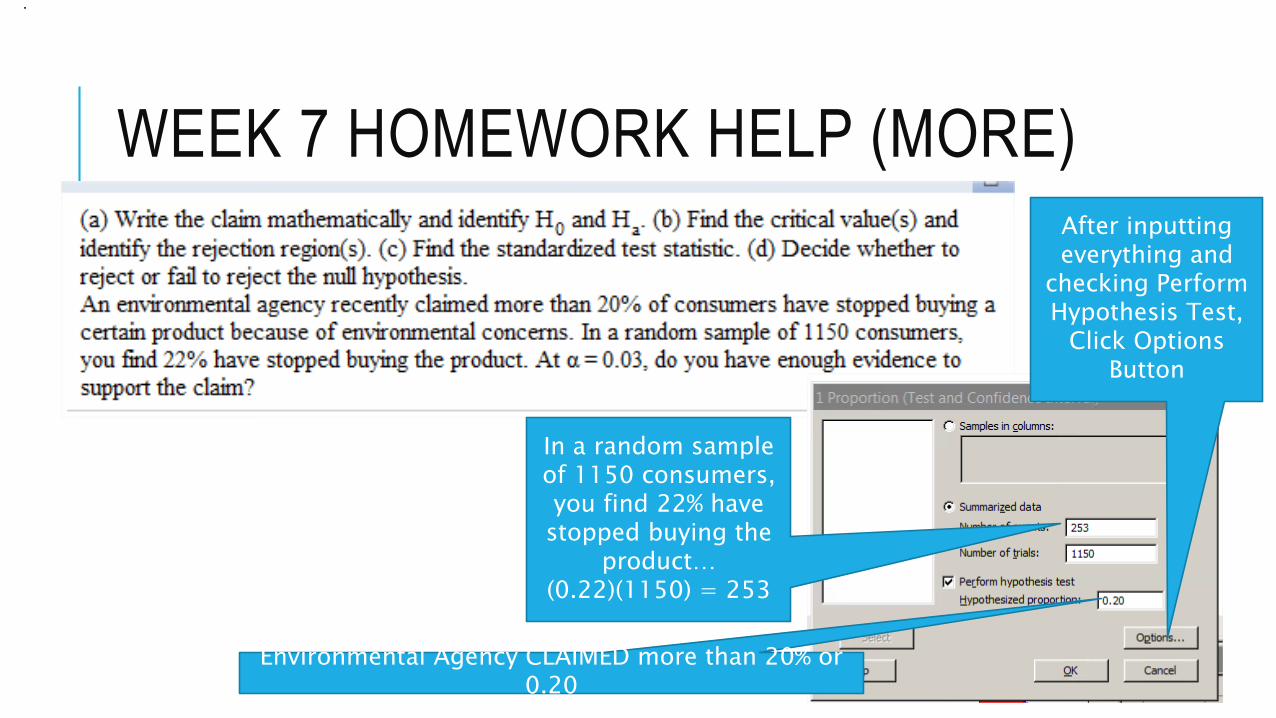
They are claiming “more than 20%” or p>0.20, so we set up our null and alternative
H0: p ≤ 0.20Ha: µ > 0.20 (claim)This one screams proportion…. We do three types (1 Sample Z, 1 Sample t and 1 Proportion – this is a “1 Proportion”)
WEEK 7 HOMEWORK HELP (MORE)
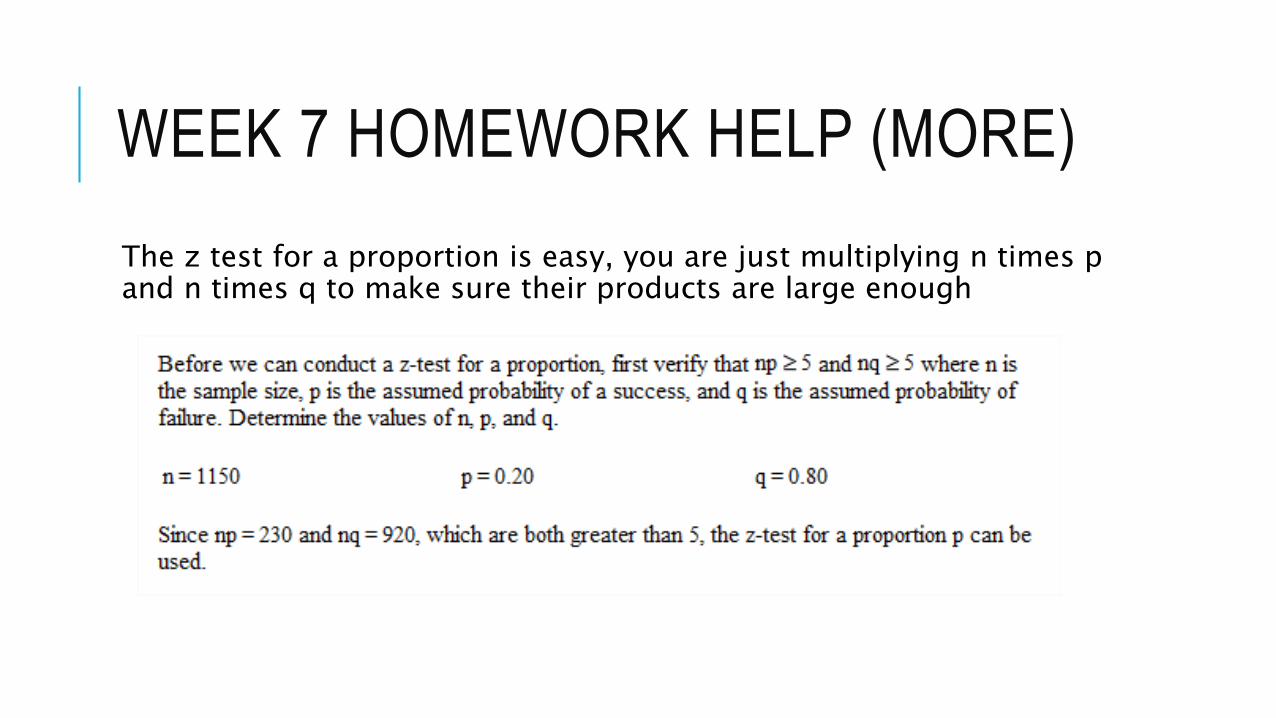
The z test for a proportion is easy, you are just multiplying n times p and n times q to make sure their products are large enough
WEEK 7 HOMEWORK HELP (MORE)
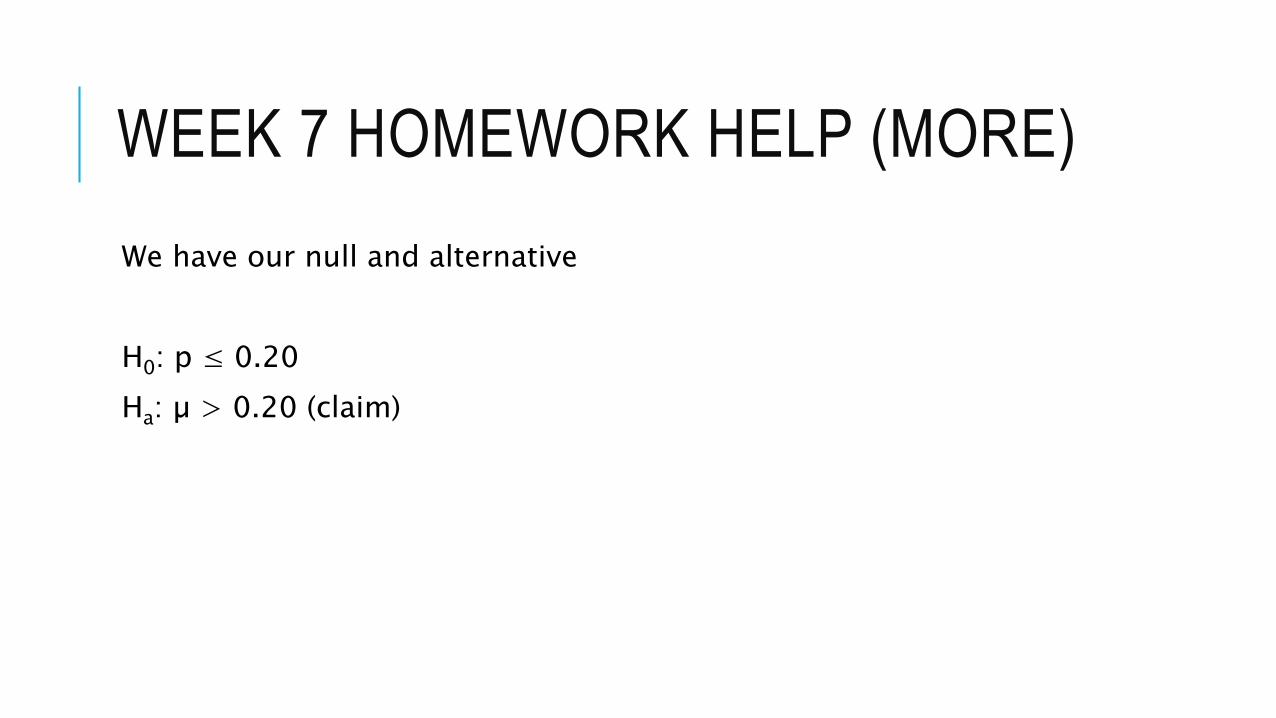
We have our null and alternative
H0: p ≤ 0.20
Ha: µ > 0.20 (claim)
WEEK 7 HOMEWORK HELP (MORE)
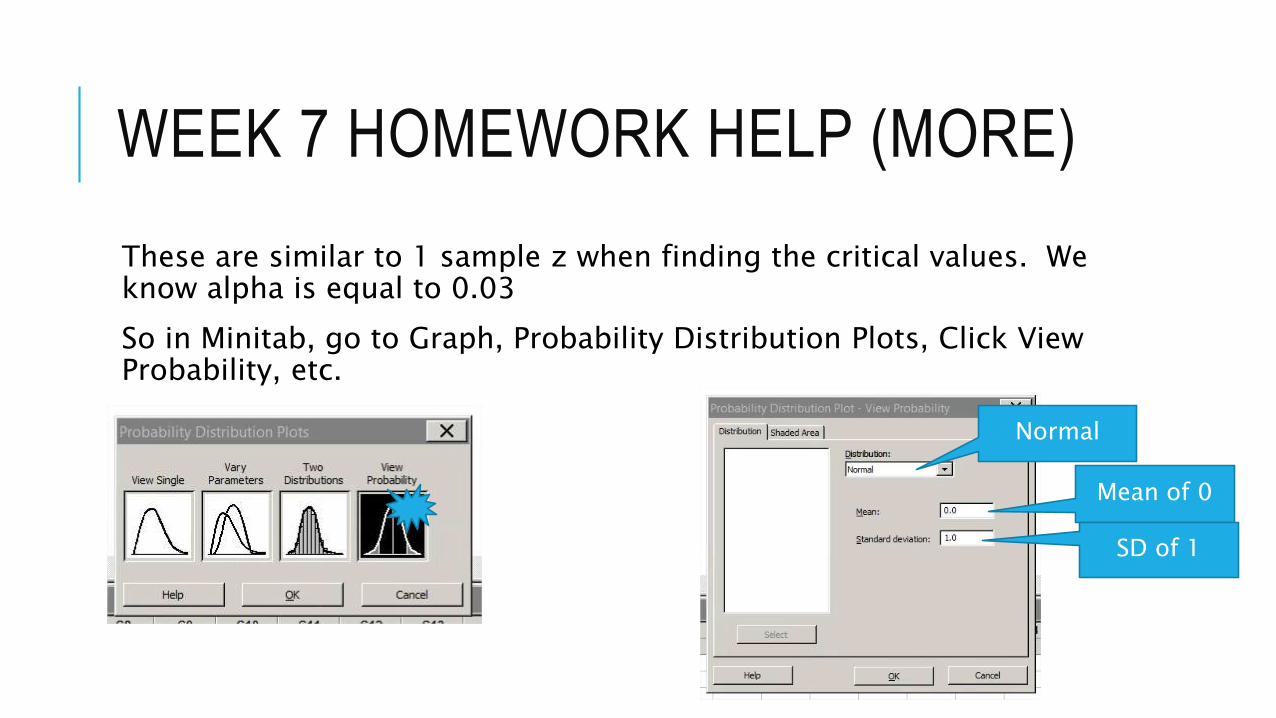
These are similar to 1 sample z when finding the critical values. We know alpha is equal to 0.03
So in Minitab, go to Graph, Probability Distribution Plots, Click View Probability, etc.
Normal
Mean of 0
SD of 1
WEEK 7 HOMEWORK HELP (MORE)
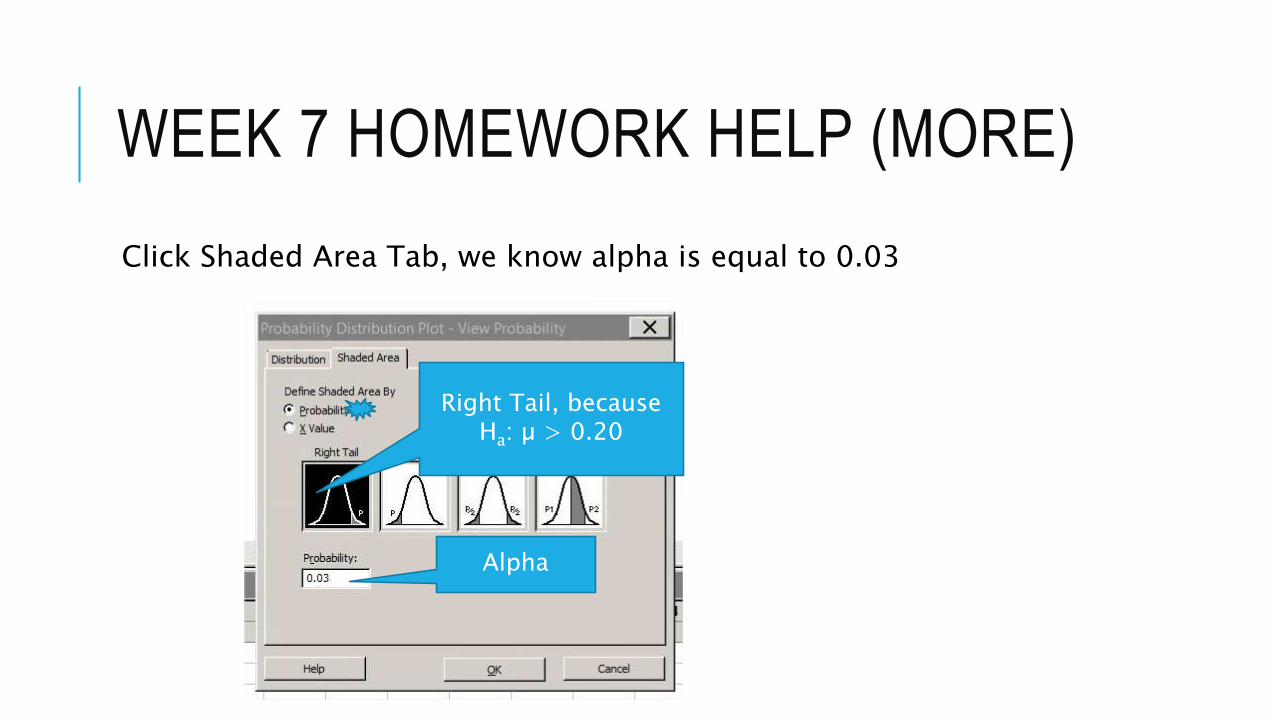
Click Shaded Area Tab, we know alpha is equal to 0.03
Right Tail, becauseHa: µ > 0.20
Alpha
WEEK 7 HOMEWORK HELP (MORE)
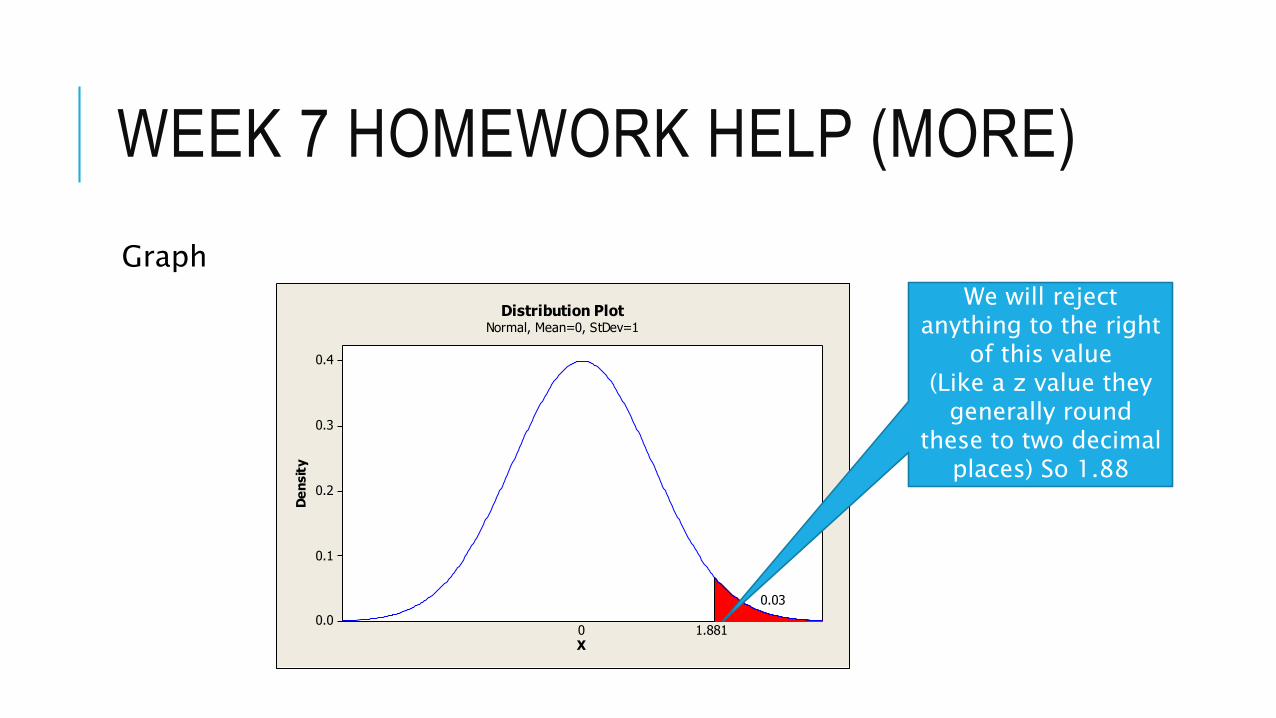
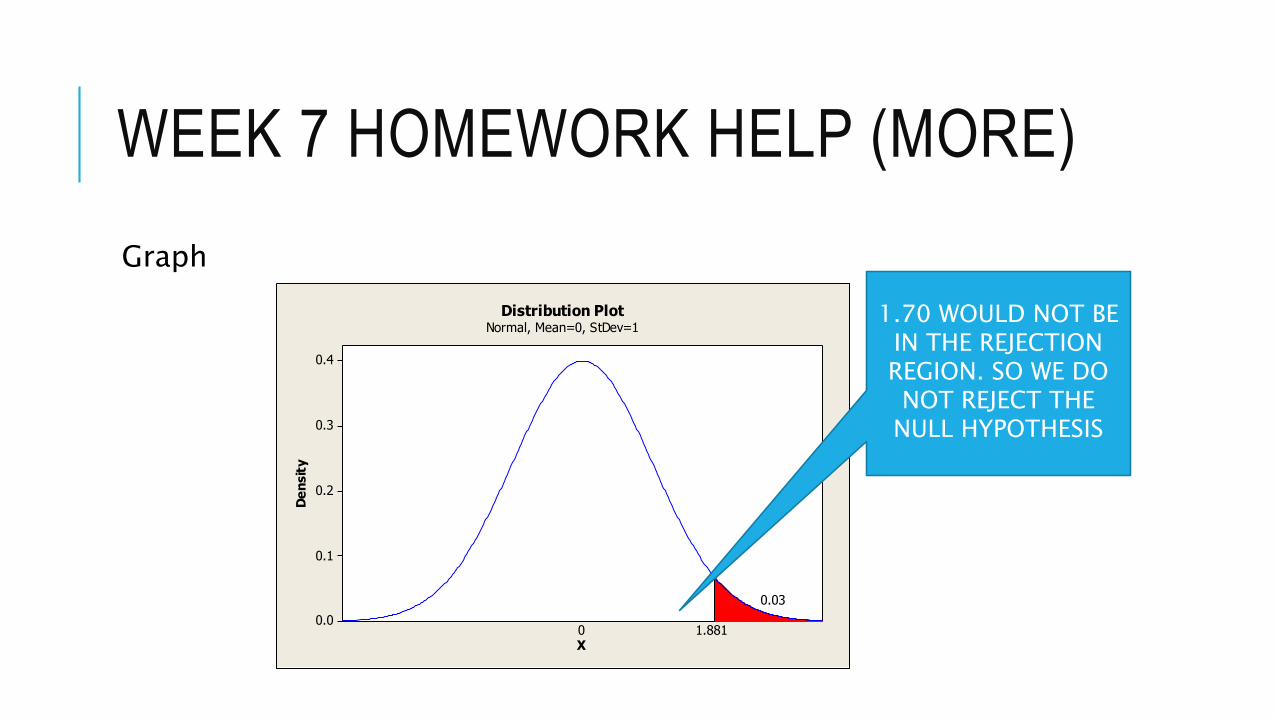
Graph
0.4
0.3
0.2
0.1
0.0
X
De
nsit
y
1.881
0.03
0
Distribution PlotNormal, Mean=0, StDev=1
We will reject anything to the right
of this value(Like a z value they
generally round these to two decimal
places) So 1.88
WEEK 7 HOMEWORK HELP (MORE)
Now get your standardized test statistic to compare.
Minitab
Stat >> Basic Statistics >> 1 Proportion
WEEK 7 HOMEWORK HELP (MORE)
.
In a random sample of 1150 consumers, you find 22% have
stopped buying the product…
(0.22)(1150) = 253
Environmental Agency CLAIMED more than 20% or 0.20
After inputting everything and
checking Perform Hypothesis Test,
Click Options Button

WEEK 7 HOMEWORK HELP (MORE)
After clicking the options button, change confidence to 97% (1-alpha) and Alternative to Greater Than AND YOU MUST CHECK BOX THAT SAYS USE TEST AND INTERVAL BASED ON NORMAL DISTRIBUTION
Greater Than, because
Ha: µ > 0.20
Alpha = 0.031 – 0.03 = .97 or
97%
You MUST Check this Box

Here is our result including our standardized test statistic
Here it is … 1.70, now compare to
graph
WEEK 7 HOMEWORK HELP (MORE)
Graph
0.4
0.3
0.2
0.1
0.0
X
De
nsit
y
1.881
0.03
0
Distribution PlotNormal, Mean=0, StDev=1
1.70 WOULD NOT BE IN THE REJECTION REGION. SO WE DO NOT REJECT THE
NULL HYPOTHESIS
WEEK 7 HOMEWORK HELP (MORE)
.
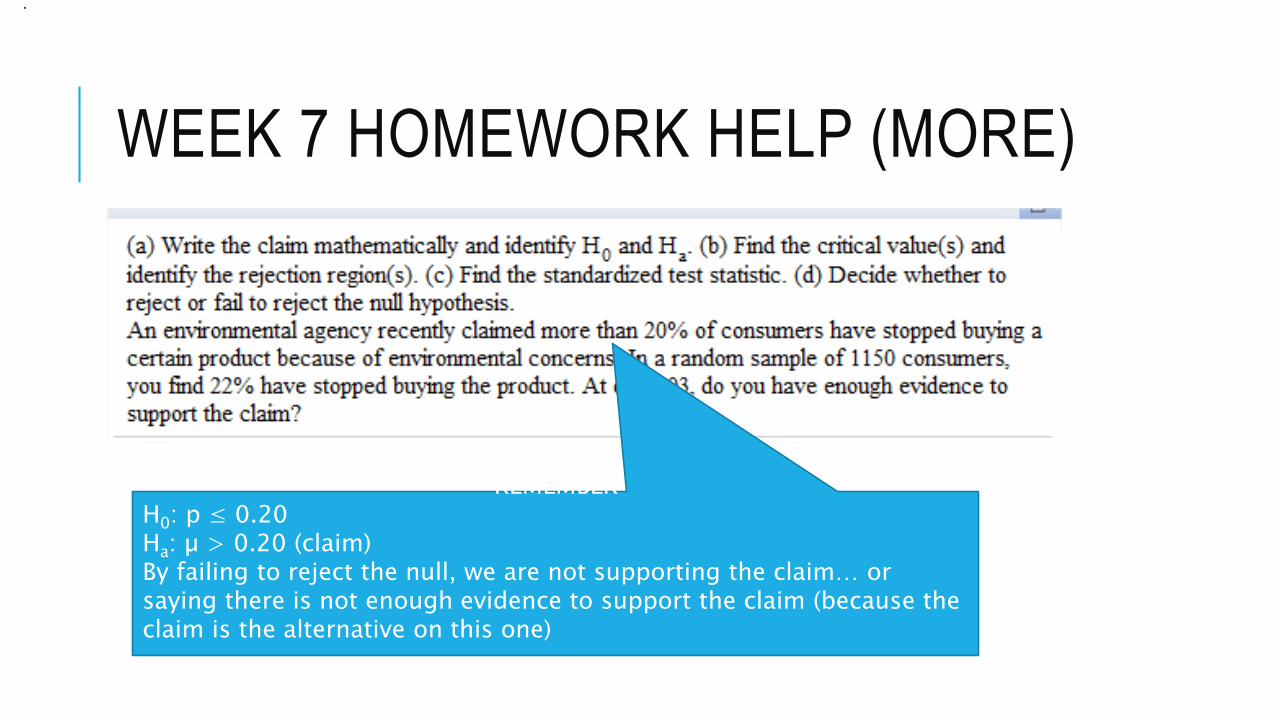
REMEMBERH0: p ≤ 0.20Ha: µ > 0.20 (claim)By failing to reject the null, we are not supporting the claim… or saying there is not enough evidence to support the claim (because the claim is the alternative on this one)
WEEK 7 HOMEWORK HELP (MORE)
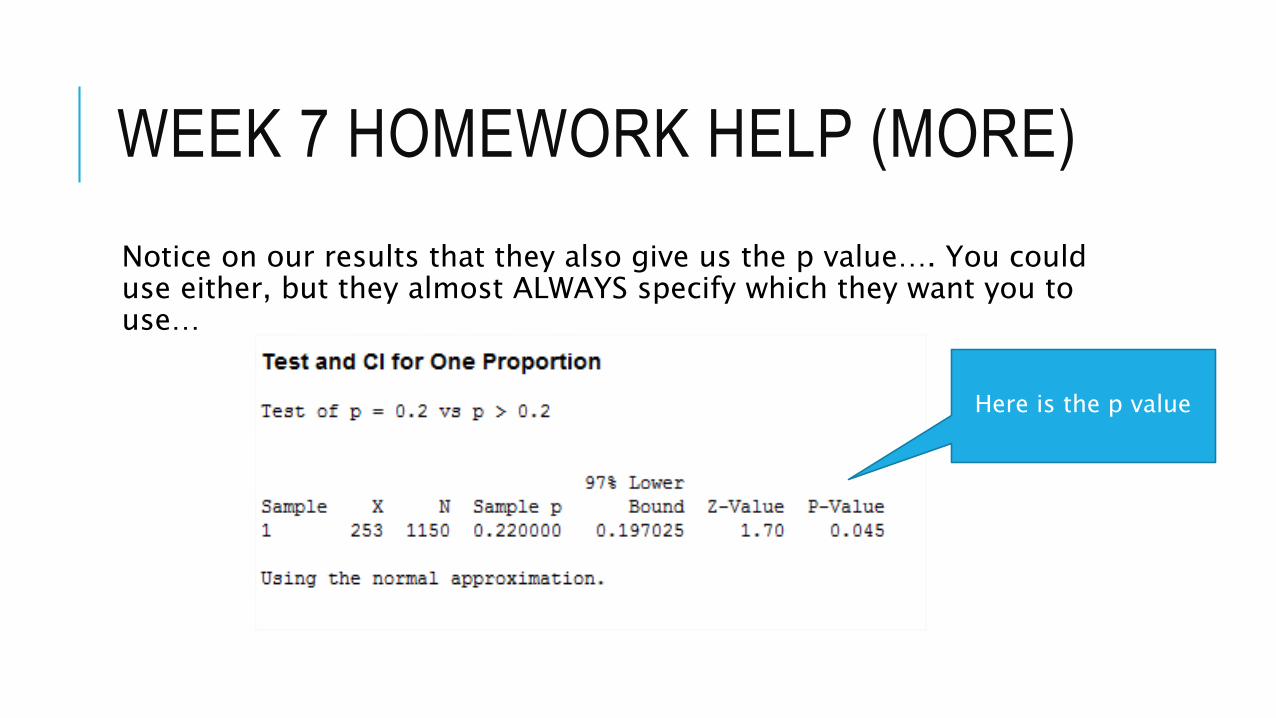
Notice on our results that they also give us the p value…. You could use either, but they almost ALWAYS specify which they want you to use…
Here is the p value

WEEK 7 HOMEWORK HELP (MORE)
This extra stuff was “extra”… Best to you…