Embed Size (px)
Citation preview
Unit 5 Research Project
Talia MatharuWorthing College Sport and Exercise Science
2015
To investigate if a relationship exists between the BMI of college students aged 16 to 19 and the sugar content in the drinks they
purchase.

Abstract
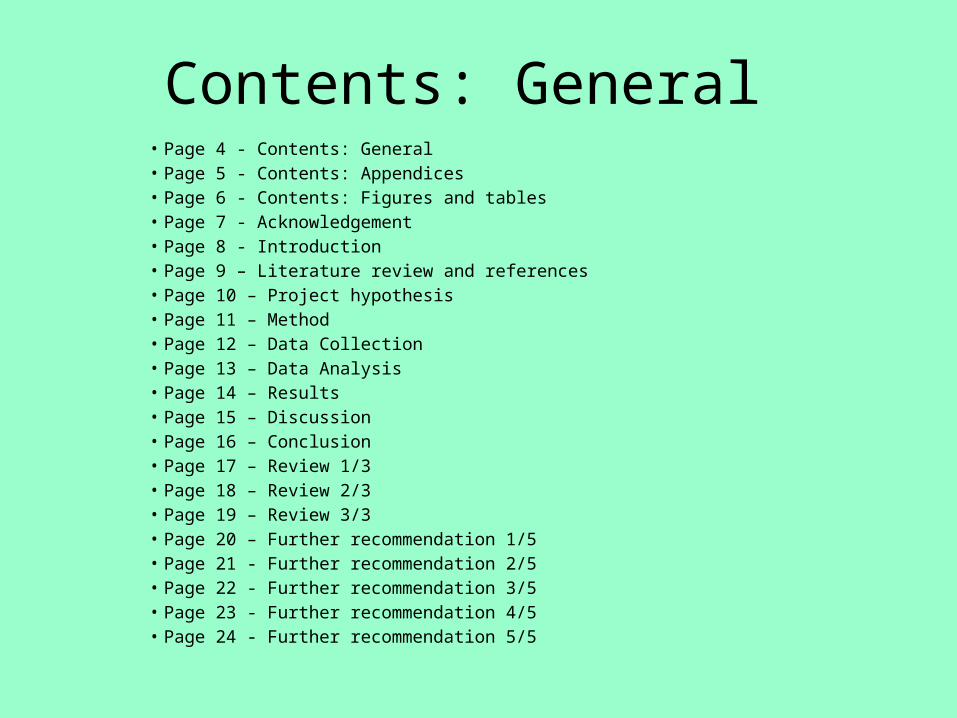
Contents: General • Page 4 - Contents: General • Page 5 - Contents: Appendices • Page 6 - Contents: Figures and tables • Page 7 - Acknowledgement • Page 8 - Introduction • Page 9 – Literature review and references• Page 10 – Project hypothesis • Page 11 – Method • Page 12 – Data Collection • Page 13 – Data Analysis • Page 14 – Results • Page 15 – Discussion • Page 16 – Conclusion • Page 17 – Review 1/3 • Page 18 – Review 2/3 • Page 19 – Review 3/3 • Page 20 – Further recommendation 1/5 • Page 21 - Further recommendation 2/5 • Page 22 - Further recommendation 3/5 • Page 23 - Further recommendation 4/5 • Page 24 - Further recommendation 5/5
Contents: Appendices
• Page 24 – Appendices 1• Page 25 – Appendices 2• Page 26 – Appendices 3
Contents: Figures and tables• Page 30 – Figures and tables 1• Page 31 - Figures and tables 2• Page 32 - Figures and tables 3• Page 33 - Figures and tables 4• Page 34 - Figures and tables 5• Page 35 - Figures and tables 6• Page 36 - Figures and tables 7• Page 37 - Figures and tables 8• Page 38 - Figures and tables 9• Page 39 - Figures and tables 10• Page 40 - Figures and tables 11• Page 41 - Figures and tables 12• Page 42 – Figures and tables 13
Acknowledgements
Thank you to the 50 participants how participated in my study. Whom without my
study wouldn’t have existed. Also my teacher Paul Cox for imparting his wisdom with me,
enabling me to design and carry out this investigation.
Introduction
The aim of my project was to investigate if there was a relationship between college students aged 16-19 consuming high sugar content drinks and their BMI.I chose this as my project aim as at college I studied nutrition in sport and science and developed a real interest in the subject. Weight and obesity is also a rising issue among society today, especially in young children and teenagers, it has also be present in the media and on television. There was a personal interest as well; as a person who doesn’t drink high sugar content drink themselves, I wanted to see if it made a difference to BMI.The time scale of my project was…
Literature review and references
https://worthingsportscience.wordpress.com/2015/03/05/unit-5-literacy-review-talia-matharu/
Project hypothesis
If college students purchase high sugar content drinks then they will have an increased BMI compared to a person purchases water.If the participant who purchase high sugar content drinks regularly exercise (according to government recommendation or more) then this will have a negative effect of consumption of high sugar content drinks and may be mitigated.
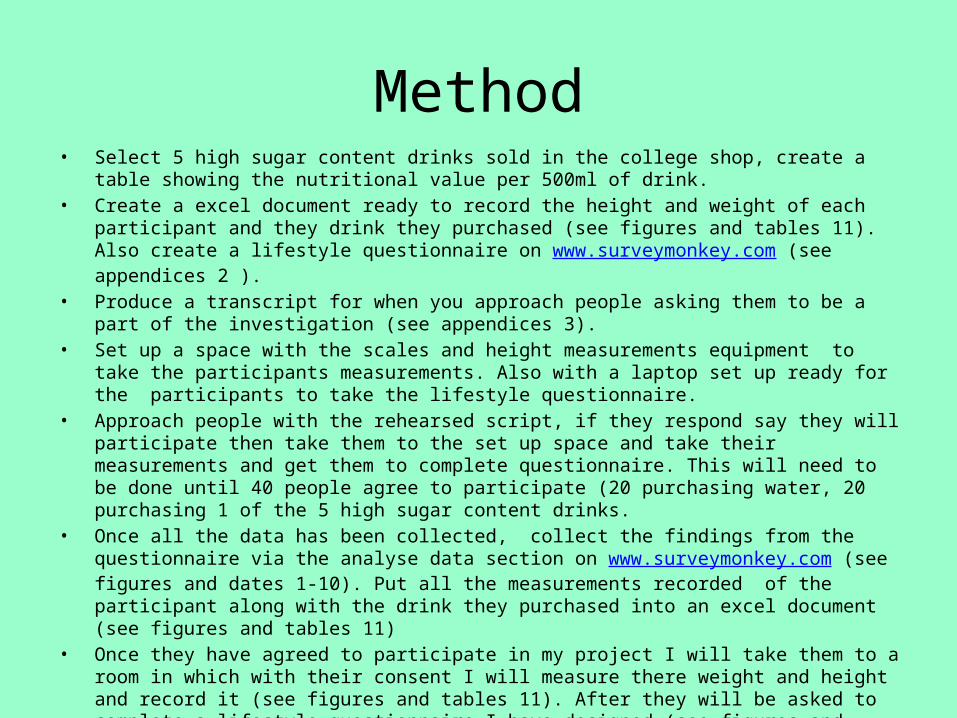
Method• Select 5 high sugar content drinks sold in the college shop, create a table showing the nutritional value per
500ml of drink.• Create a excel document ready to record the height and weight of each participant and they drink they
purchased (see figures and tables 11). Also create a lifestyle questionnaire on www.surveymonkey.com (see appendices 2 ).
• Produce a transcript for when you approach people asking them to be a part of the investigation (see appendices 3).
• Set up a space with the scales and height measurements equipment to take the participants measurements. Also with a laptop set up ready for the participants to take the lifestyle questionnaire.
• Approach people with the rehearsed script, if they respond say they will participate then take them to the set up space and take their measurements and get them to complete questionnaire. This will need to be done until 40 people agree to participate (20 purchasing water, 20 purchasing 1 of the 5 high sugar content drinks.
• Once all the data has been collected, collect the findings from the questionnaire via the analyse data section on www.surveymonkey.com (see figures and dates 1-10). Put all the measurements recorded of the participant along with the drink they purchased into an excel document (see figures and tables 11)
• Once they have agreed to participate in my project I will take them to a room in which with their consent I will measure there weight and height and record it (see figures and tables 11). After they will be asked to complete a lifestyle questionnaire I have designed (see figures and tables 1-10).
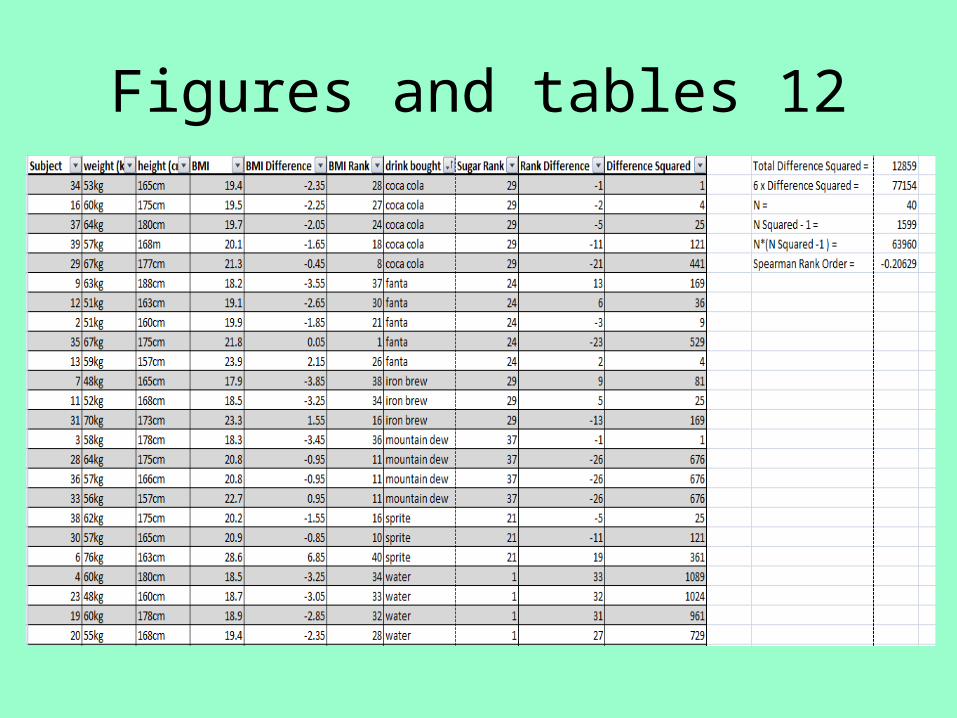
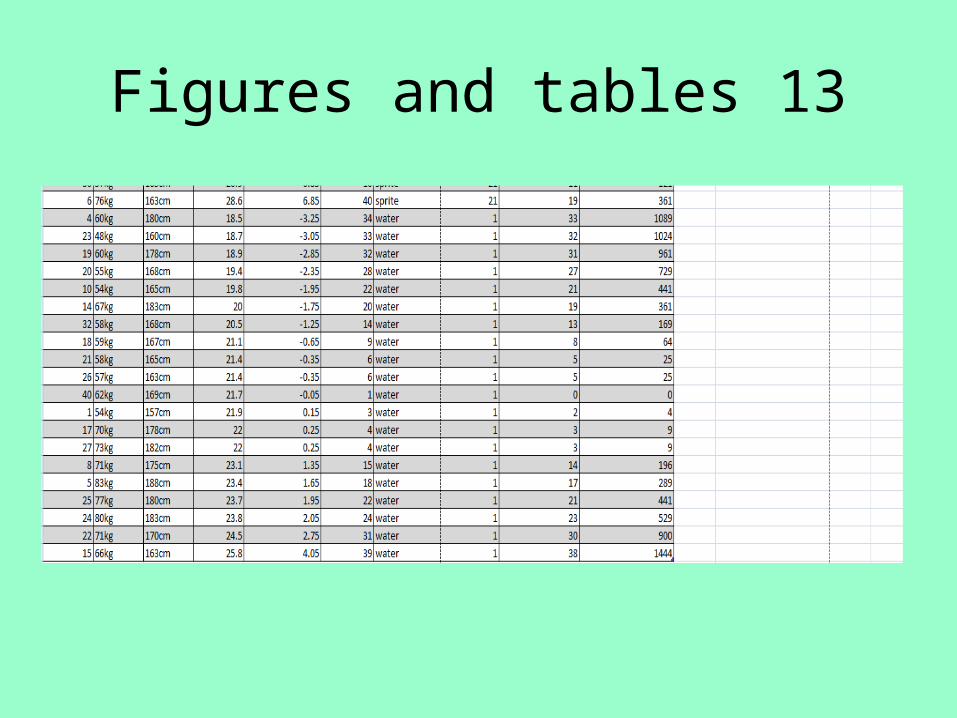
• Using the excel document with measurements, create another excel document input data and work out the spearman rank order correlation to see fit there is a relationship between the variables I am investigating (BMI and consuming high sugar content drinks). (see figures and tables 12 and 13)
Data collection
• My data collection is of primary data, of which I am collecting two types; quantitative and qualitative.
• The quantitative data obtained is the measurements of 40 participants height (cm) and weight (kg), which will be used to calculate each participants BMI. The quantitative data is collected to discover if a relationship exists between BMI and consumption of sugared drinks.
• The qualitative data obtained is in the form of a lifestyle questionnaire, in which there are 10 closed questions for the participants to answer. The questionnaire is to help support or explore the results of the quantitative data.
Data analysis
• To analyse my primary quantitative data I will be using excel to investigate if a relationship between BMI and consumption of high sugar content drinks by using spearman rank order correlation. The spearman's rank order will give me a correlation number which will let me if I have a Very Weak, Weak, Moderate, Strong or Very Strong correlation.
• After this I will use my qualitative data to attempt to explain the correlation or any anomalies with the results.
Results
• The results from my investigation according to spearman's rank order show there is a very weak correlation between the BMI of participants and the drinks they consume (see figure and tables 12 and 13).
Discussion
• The results of my investigation should there was a very weak correlation between BMI and consumption of sugared drinks. These findings were not what I was expecting to uncover. I believe this could be down to the sample size of my investigation, 40 subject isn't fully representative of the 16-19 population.
Conclusion
• My aim was to investigate if a relationship exists between the BMI of college students aged 16 to 19 and the sugar content in the drinks they purchase. The results is received where in complete contrast to what I hypothesised at the onset of my investigation. One reason it may not have resulted as I expected is because I didn’t use an appropriate sample size, to collect enough information to identify a trend within the data. Also in hindsight, this type of investigation should be longitudinal; sugar and diet are things that do not have an immediate effect on a person, their effects are seen over time.
Review 1/3
• My project aim was to identify if a relationship existed, I believe my research did this as it highlighted in the case of my investigation there was a very weak relationship between the two variables, although this wasn’t what I had hypothesised. My aim also stated this was to be investigated of college aged students aged 16-19 which was the population group I used.
Review 2/3
• I believe a strength of my research project was the organisation of my data and how it was presented.
• Another strength was learning and using excel properly as a key part of data analyses (see figures and tables 11 and 12).
Review 3/3
• I believe the population of my study was to wide, as it included people who exercise regularly, play sports and others how lived a fairly sedentary life style. I think this may have an impact as to why the results of the relationship between BMI and consumption of sugared drinks should a very weak correlation. An improvement I would have made is to make my population for specific; look into the relationship between BMI and the drinks a sports person at Worthing college aged 16-19 or the drinks a Worthing college student who doesn’t participate in regular sports/exercise
Future recommendations 1/5
• If my project was to be completed again I would change the population; making it more specific to either college students aged 16-19 that play sport or college students that don’t engage in a sport. I would do this because I fell my population scope was to large and varied and this had some input as to why the correlation between the two variables was very weak.
Future recommendations 2/5
• The benefit of the proposal stated on the pervious slide, to make the population sample size larger and more specific and prosiest. This would be a benefits as it would increase the specificity of my findings.
Future recommendations 3/5
• My proposal for further research would be carry out the method of the investigation I created but then retake the BMI of the subjects over a year period. If feel by doing a longitudinal study it’s a better way of measuring the on going affects of consuming sugared drinks on BMI.
Future recommendations 4/5
• Another proposal would be to measure the use
Future recommendations 5/5
• Carry out the study to the teachers on the college
Research Project Appendices
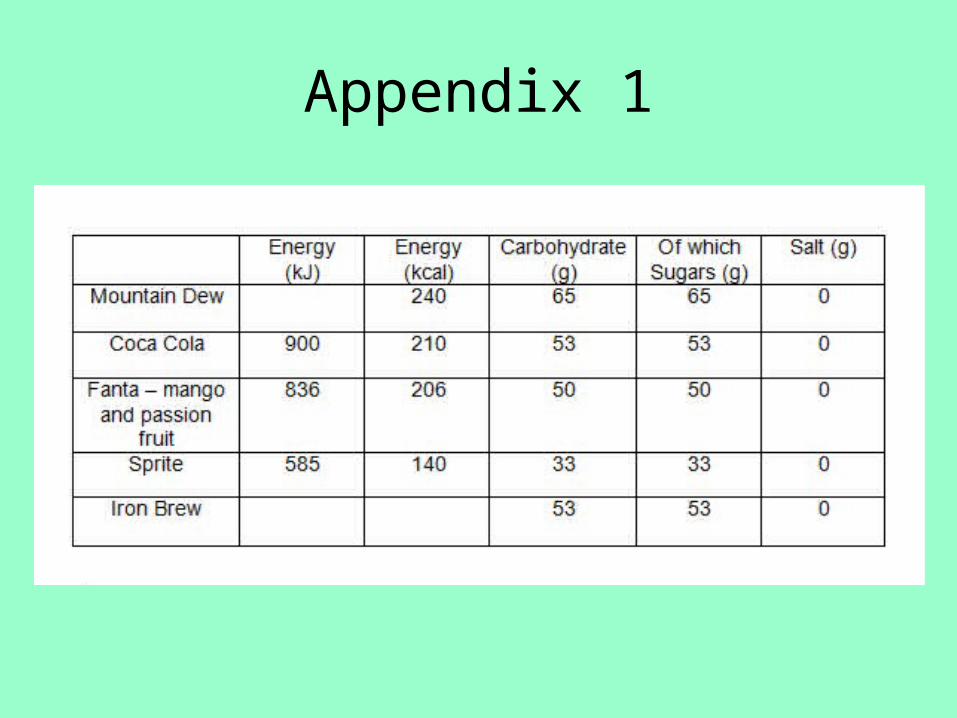
Appendix 1
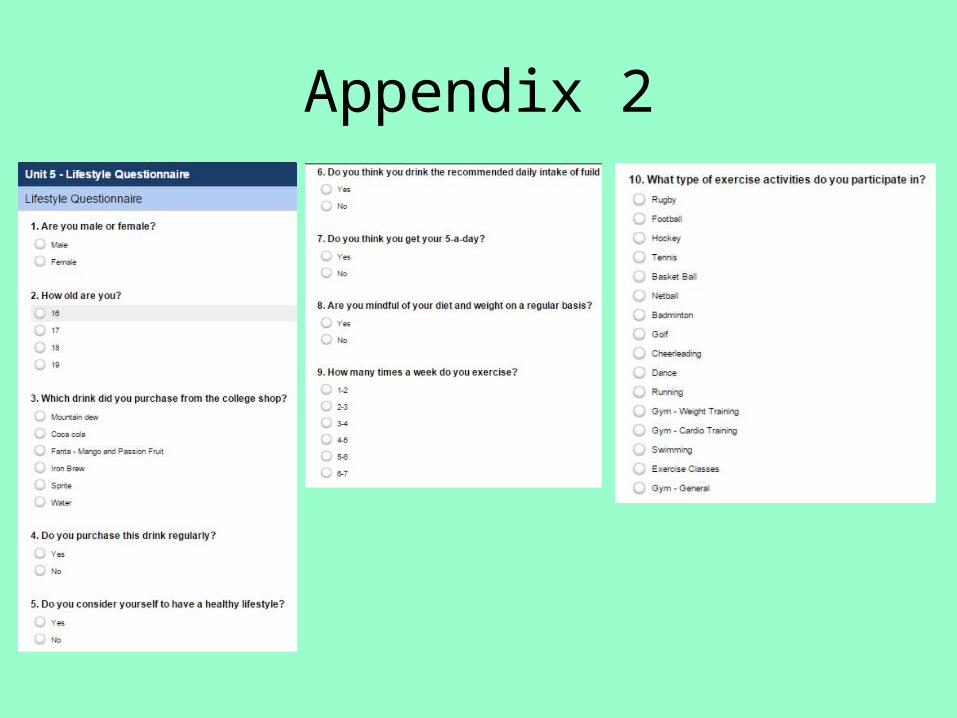
Appendix 2

Appendix 3

Research Project Figures and Tables
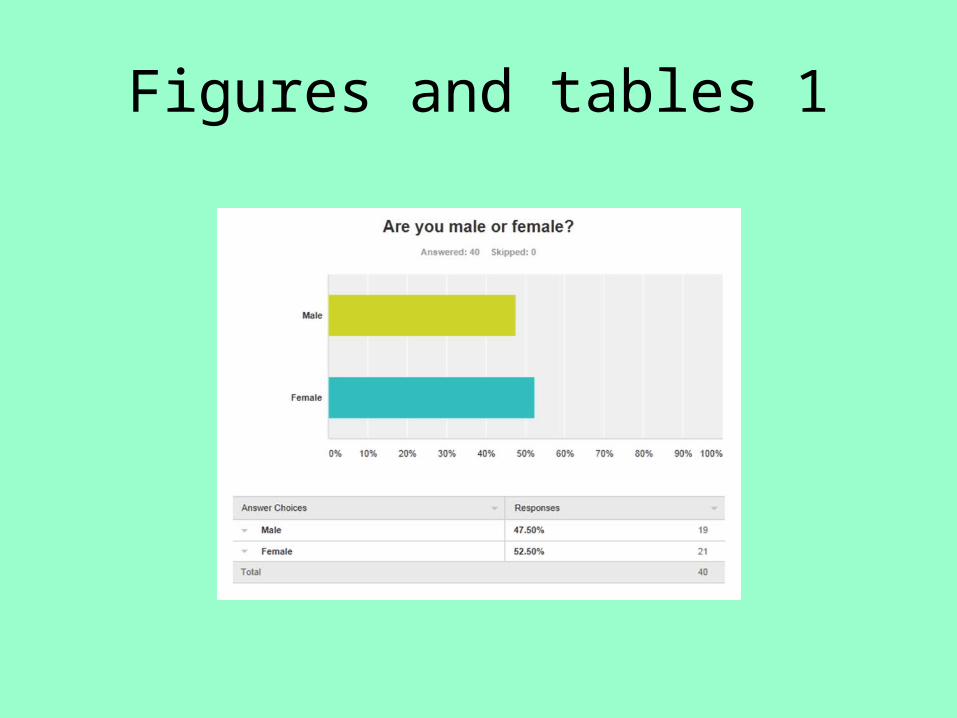
Figures and tables 1
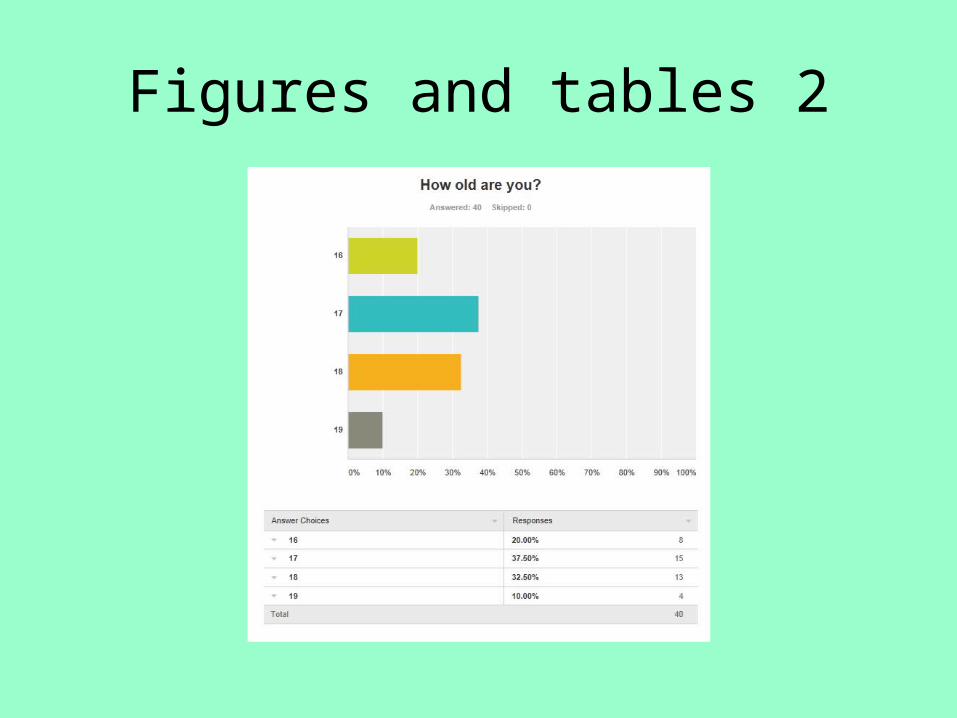
Figures and tables 2
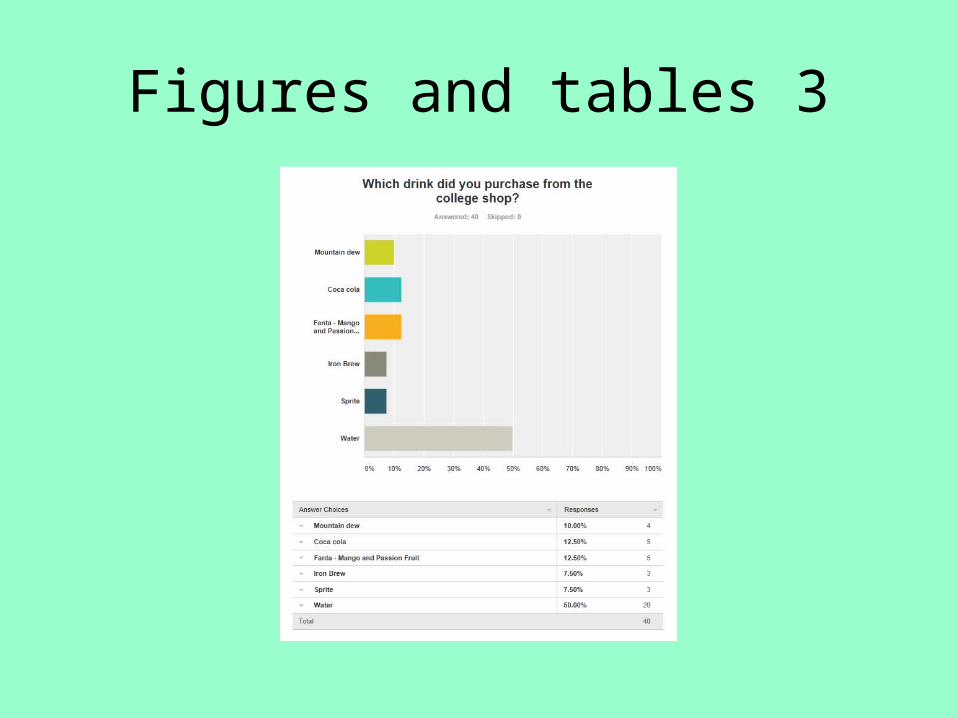
Figures and tables 3
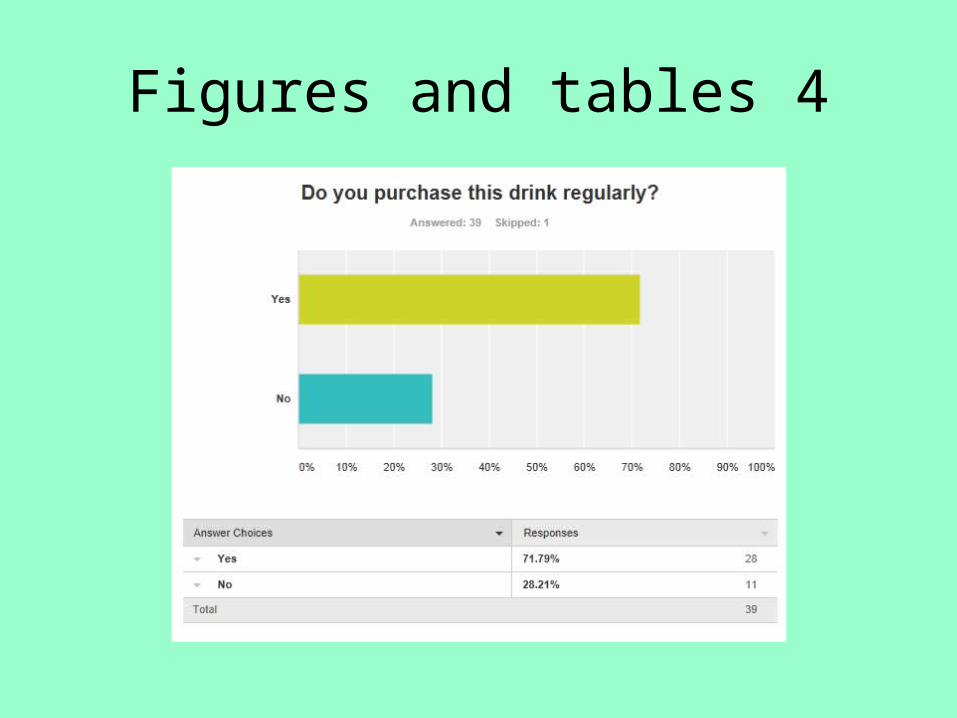
Figures and tables 4
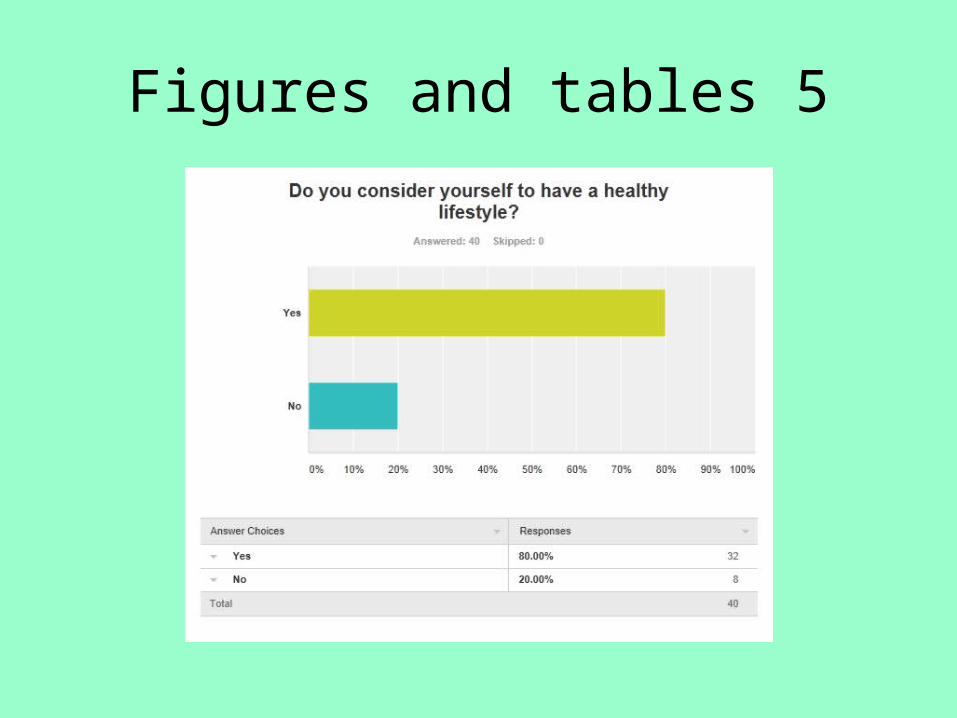
Figures and tables 5
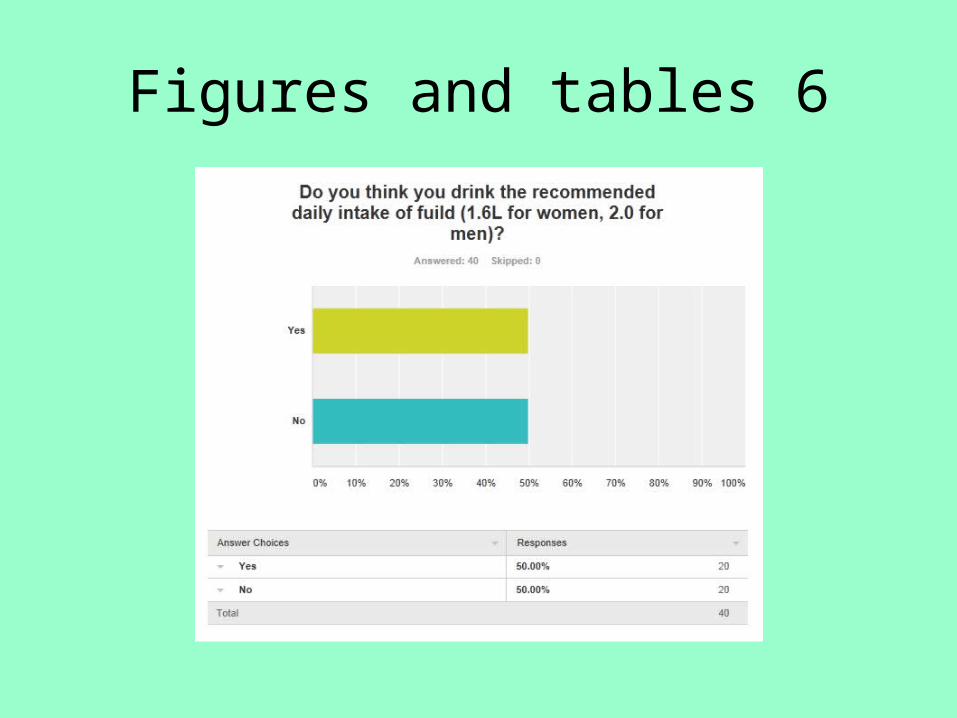
Figures and tables 6
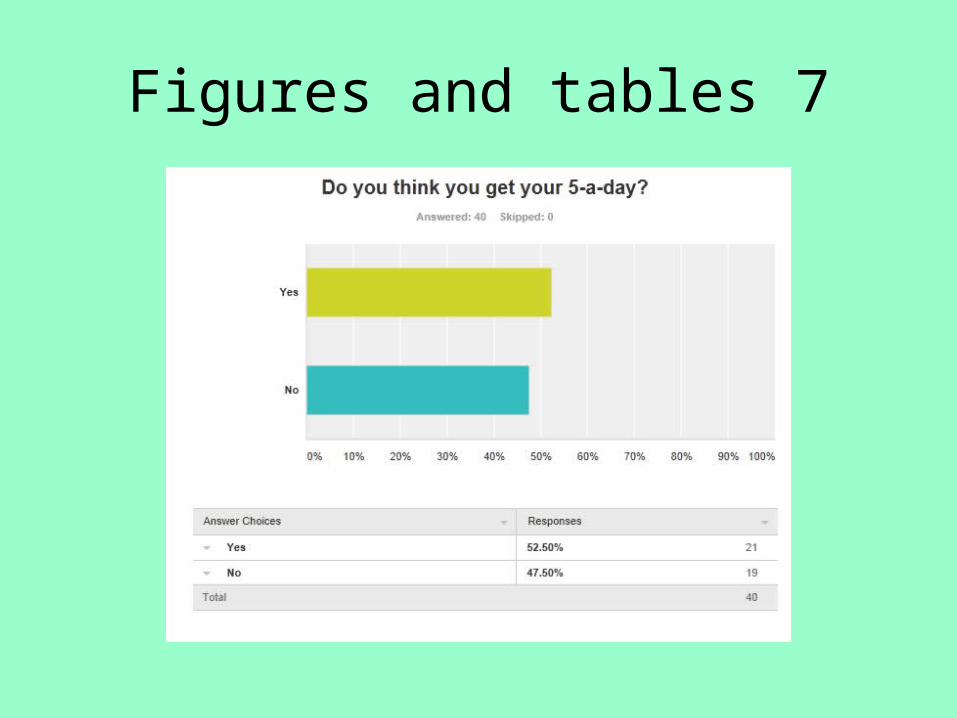
Figures and tables 7
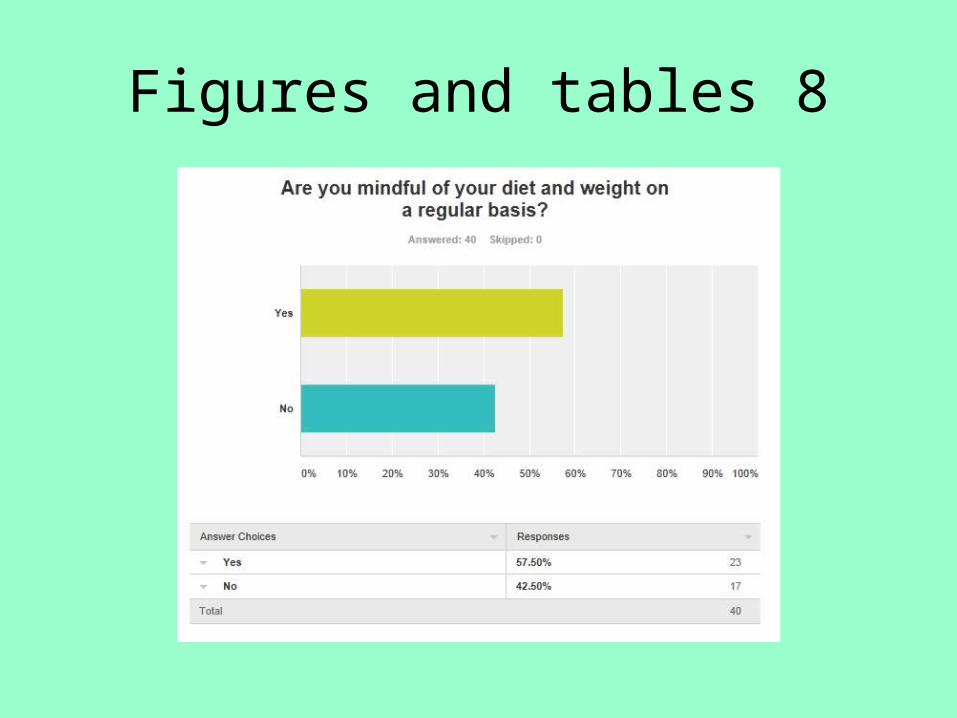
Figures and tables 8
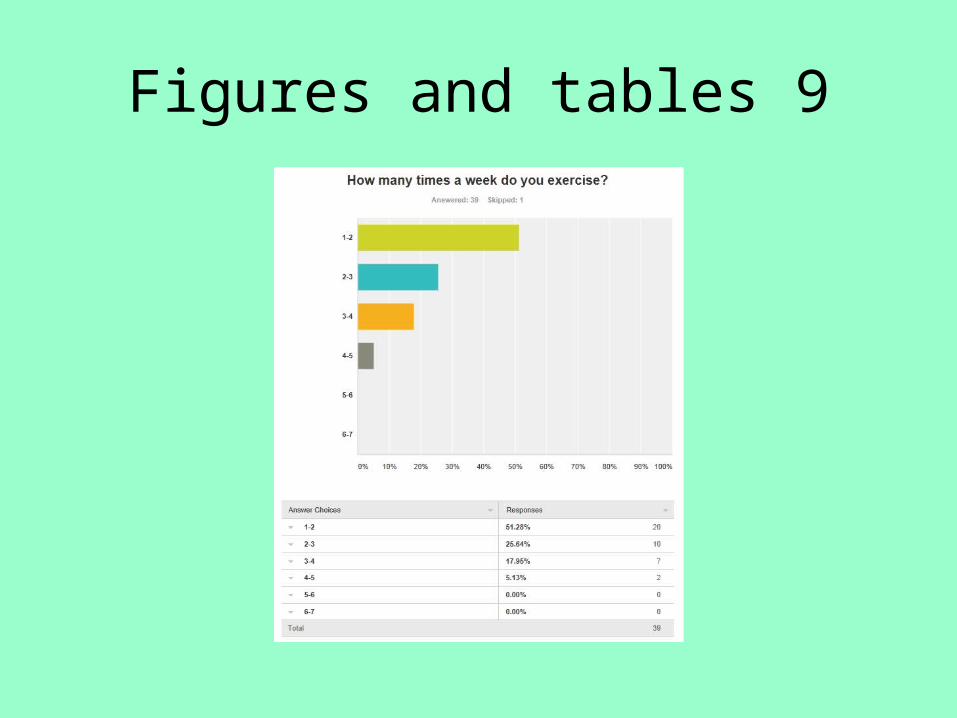
Figures and tables 9
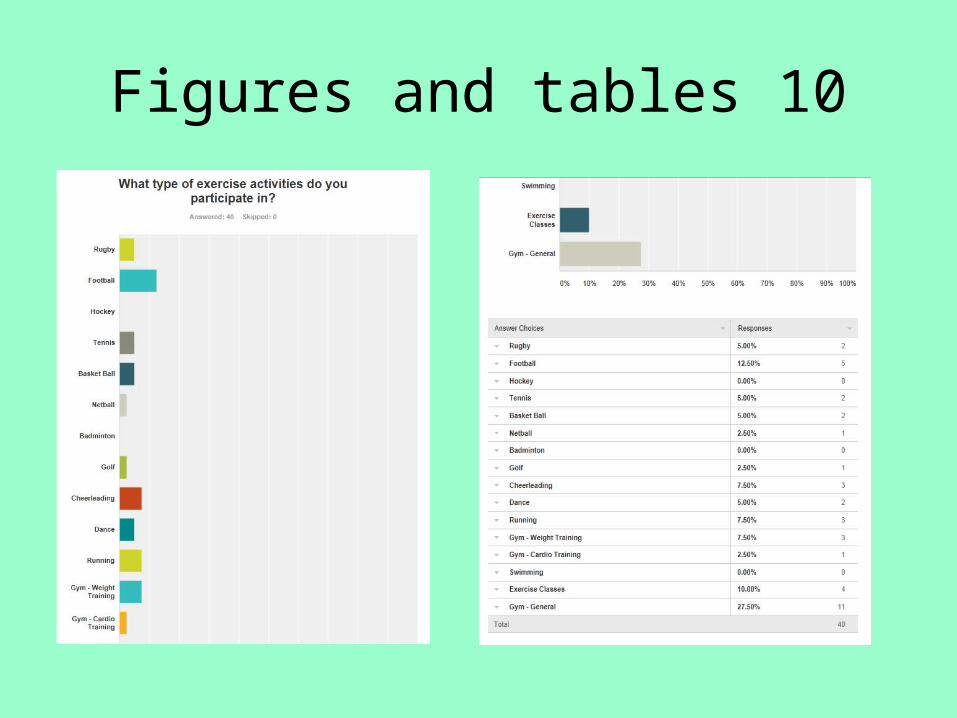
Figures and tables 10
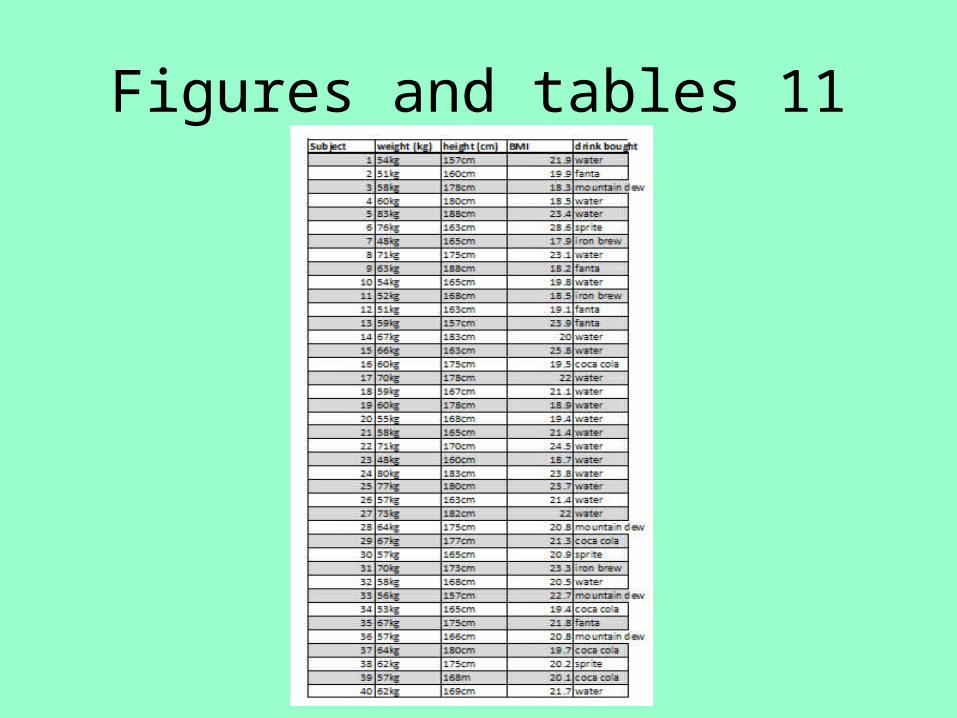
Figures and tables 11
Figures and tables 12
Figures and tables 13