Embed Size (px)
Citation preview
TRADITIONAL WATER HARVESTING METHODS – THEIR ROLE AND SCOPE IN CORRECTING INDIAN WATER SECTOR Part I
Vivek P. KapadiaEmail : [email protected]
Presented at One Day Woirkshop on Water Conservation organised by
The Institution of Engineers (India), Gujarat State Center, Ahmedabad

DEDICATED TO
WATER MANAGEMENT FORUM
THE INSTITUTION OF ENGINEERS (INDIA)
2

FRESH WATER IS REALLY SCARCE
3

4
HYDROLOGY : AN OVERVIEW
Distribution of Type of Water on Earth
Sea Water97%
Non-salty Water
3%
4

5
Distribution of Non-salty Water
Snow at Poles79%
Surface Water
1%
Ground Water20%
5

6
Distribution of Surface waterMoisture
in Air (Humidity)
8%
Tanks and Reservoirs
53%
Rivers1% Moisture
in Soil38%
6
7
INDIA IS A WATER STRESSED COUNTRY
7

8
• Against estimated annual precipitation of about 4,000 Billion
Cubic Meters (BCM) including snow fall, India’s total annual
renewable fresh water resources are estimated at 1953 BCM.
• In 1901 India’s per capita water availability was 4555 cubic
meters per year - decreasing from 3008 cu.m. in 1951 to 1981
cu.m. in 1971 to 1283 cu.m. by the year 1991 - with India’s
projected population of 1146 millions, 1333 millions and 1581
millions by the year 2010, 2025 and 2050, the per capital water
availability (AWR) will be 943 cu.m., 814 cu.m. and 686 cu.m.
respectively.
WATER RESOURCES OF INDIA
8

9
• According to the leading Swedish expert, Dr. Malin
Falkenmark, the ‘annual water resources per capita’ (AWR) of
1,700 m3 means that only occasional and local stress may be
experienced; an AWR of less than 1000 m3 indicates a condition
of stress and the AWR of 500 m3 or less means a serious
constraint and a threat to life
• Although, India’s population is about 17% of global population,
its rivers possess just 4% of the total average annual run-off in
the rivers of the world. China has 22% of the global population
but has 8% of world’s water resource.
WATER RESOURCES OF INDIA
9

10
WATER RESOURCES OF INDIA
10

11
WATER RESOURCES OF INDIASl. No.
Name of the River Basin Average annual availability in Cubic
Km per Year
1. Indus (up to Border) 73.312. a) Ganga 525.02
b) Brahmaputra, Barak & Others 585.60
3. Godavari 110.54
4. Krishna 78.125. Cauvery 21.366. Pennar 6.327. East Flowing Rivers Between Mahanadi & Pennar 22.52
8. East Flowing Rivers Between Pennar and Kanyakumari 16.46
9. Mahanadi 66.8810. Brahmani & Baitarni 28.4811. Subernarekha 12.3712. Sabarmati 3.8113. Mahi 11.0214. West Flowing Rivers of Kutch, Sabarmati including Luni 15.1015. Narmada 45.6416. Tapi 14.8817. West Flowing Rivers from Tapi to Tadri 87.41
18. West Flowing Rivers from Tadri to Kanyakumari 113.5319. Area of Inland drainage in Rajasthan desert NEG.20. Minor River Basins Draining into & 31.00
Total 1869.3511

12
LAND RESOURCES OF INDIA
Geographical Area 328.73
Forest 67.8
Not available for cultivation 41.56
Other uncultivated land 28.36
Fallow Land 24.10
Net area sown 142.02
Million hectare
It is estimated that about 174 million hectares of land (53%) suffers from different types and varying degrees of degradation. About 800 hectare of arable land are lost annually due to ingress of ravines.
12

13
IRRIGATION POTENTIAL Plan-wise irrigation potential through various irrigation projects
Plan Period Potential (cumulative)
created (Mha) Potential (cumulative)
utilised (Mha)
Pre-Plan period 22.60 22.60
First Plan (1951-56) 26.26 25.04
Second Plan (1956-61) 29.08 27.80
Third Plan (1961-66) 33.57 32.17
Annual Plans (1966-69) 37.10 35.75
Fourth Plan (1969-74) 44.20 42.19
Fifth Plan (1974-78) 52.02 48.46
Annual Plans (1978-80) 56.61 52.64
Sixth Plan (1980-85) 65.22 58.82
Seventh Plan (1985-90) 76.53 68.59
Annual Plans (1990-92) 81.09 72.86
Eighth Plan (1992-97) 86.26 77.24
Ninth Plan (1997-2002) 93.95 80.06
Tenth Plan (upto 2004-05) 98.84 83.5613

14
NATURAL VARIATIONS
14

15
NATURAL VARIATIONS
15
16
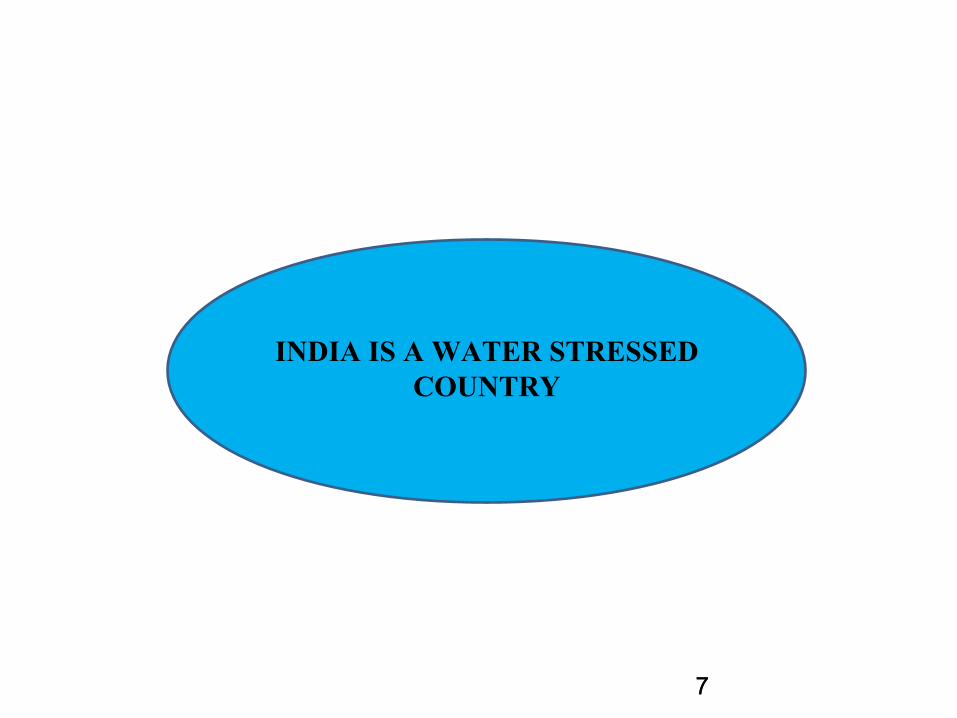
NATURAL VARIATIONS
16

17
NATURAL VARIATIONS
17

18
NATURAL VARIATIONS
18

19
Concentrated approach – large reservoir based – can address needs of only a part of agriculturable land – the remaining land needs to be addressed which is larger than the irrigated by large reservoirs
Usable water is really scarce – diverting river water can not address the needs – dams constructed on all rivers but all agriculturable land can not be irrigated
19
Other issues of large reservoir based irrigation systems – waterlogging, riparian rights, environmental aspects, etc. worth considering
Need to understand the need of addressing the need of agriculturable land not served by large reservoirs – depending only on groundwater not sufficient