Embed Size (px)
Citation preview
Towards greater transparency in digital literary analysis
John Lavagnino, King‟s College London
8 May 2014
http://www.slideshare.net/jlavagnino/tgt
The plan
1 General reasons for doing digital analysis, and some present-day trends
2 A recent study that went badly wrong
3 Open and closed techniques
4 Open and closed data
Things not in the plan
Lots of things that aren‟t analysis are valuable:
1 publication and rediscovery (as by the Women Writers Project, Northeastern University)
2 discussion, argument, interaction
3 studies of digital culture
4 …
Why people do this
Above all, because you can: a byproduct of the web and the widespread use of computers is a wealth of textual data. Without books in transcribed form much less would happen.
Yes, you can always transcribe some new stuff yourself, but then you immediately need time and money before doing anything at all.
You can also work with small amounts of text, but it tends to get less notice.
What‟s harder to do
Texts not in English are less widely available in digital form and so get analyzed less.
Texts much later than the nineteenth century are in copyright.
Texts before the nineteenth century pose OCR problems and have more variable spelling.
It‟s not an accident that there are so many digital studies of nineteenth-century novels.
Why it‟s worth doing
When there‟s too much to read
When a different kind of attention is valuable (more systematic? or just very different from normal reading?)
When it can locate or arrange material as the basis for more traditional approaches
A recent study that wentbadly wrong
The study
Matjaž Perc, “Evolution of the most common English words and phrases over the centuries”, Journal of the Royal Society Interface, 7 December 2012: see:
http://goo.gl/7S0RT
Based on Google ngram data: see www.culturomics.org
A surprising claim about English
Perc, in his abstract: “We find that the most common words and phrases in any given year had a much shorter popularity lifespan in the sixteenth century than they had in the twentieth century.”
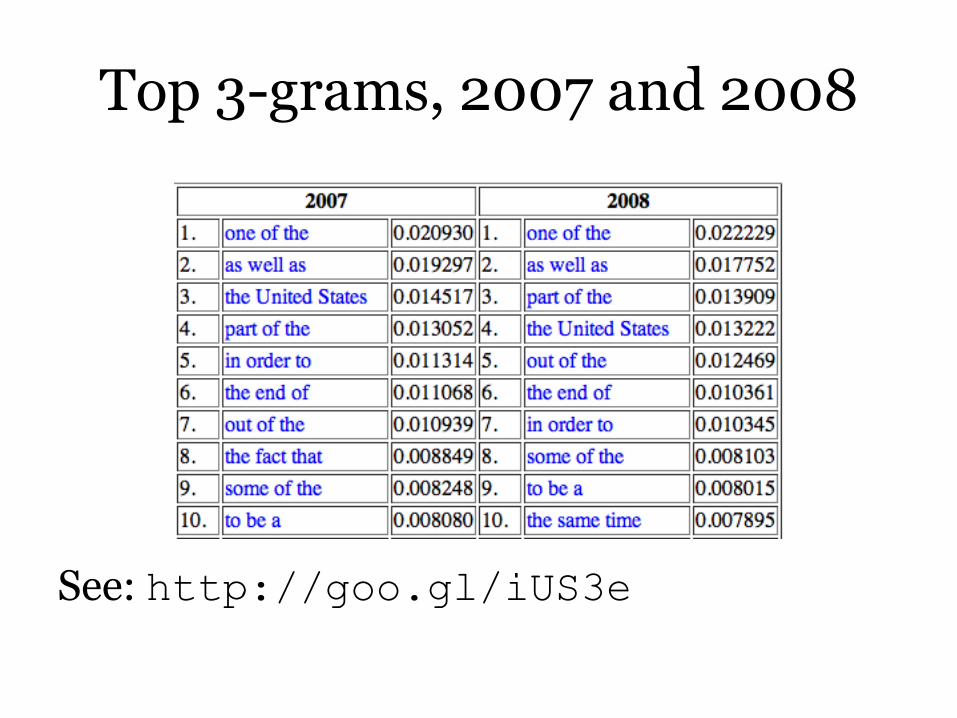
Top 3-grams, 2007 and 2008
See: http://goo.gl/iUS3e
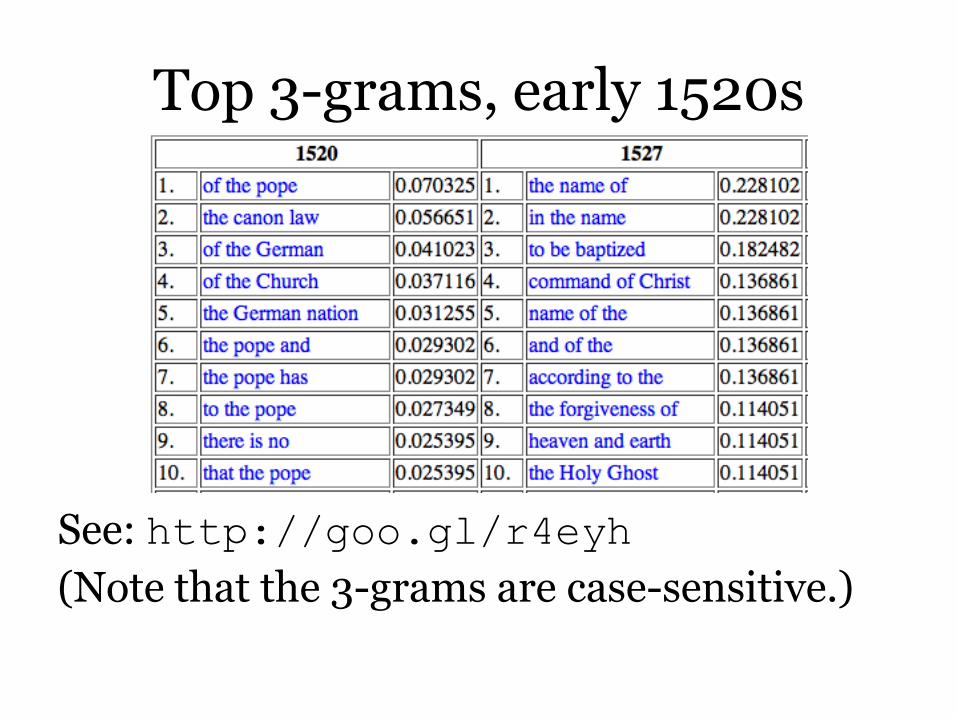
Top 3-grams, early 1520s
See: http://goo.gl/r4eyh
(Note that the 3-grams are case-sensitive.)
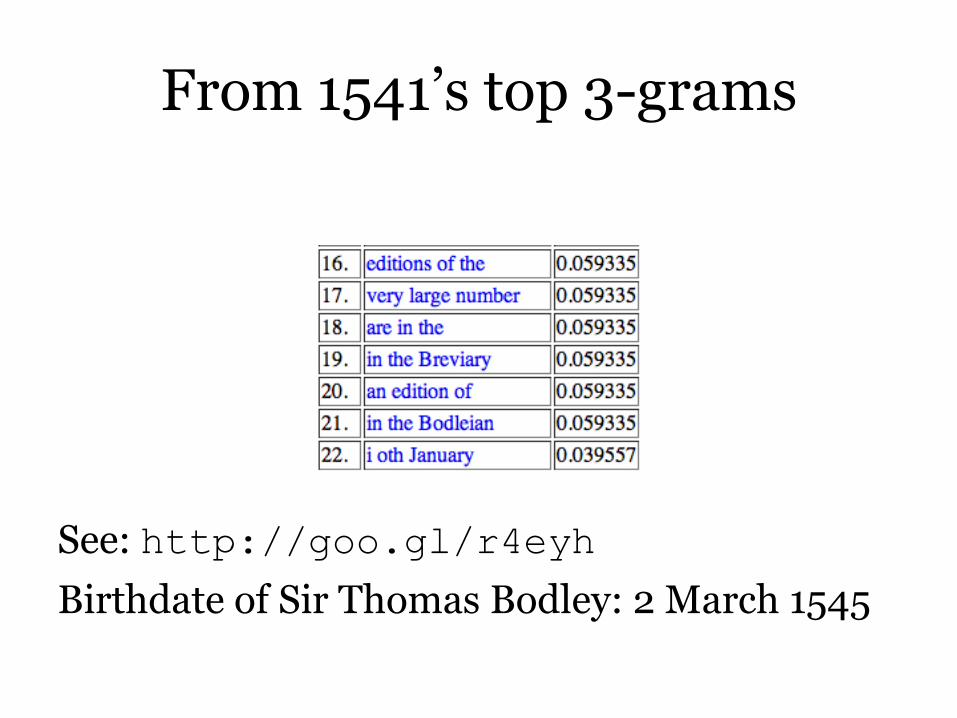
From 1541‟s top 3-grams
See: http://goo.gl/r4eyh
Birthdate of Sir Thomas Bodley: 2 March 1545
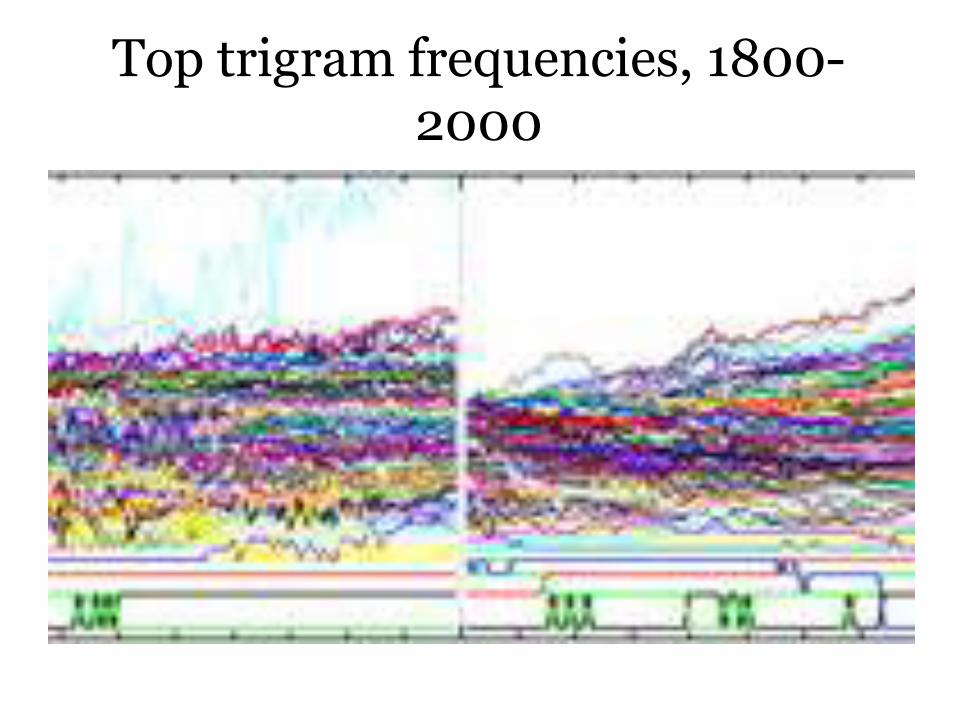
Top trigram frequencies, 1800-2000
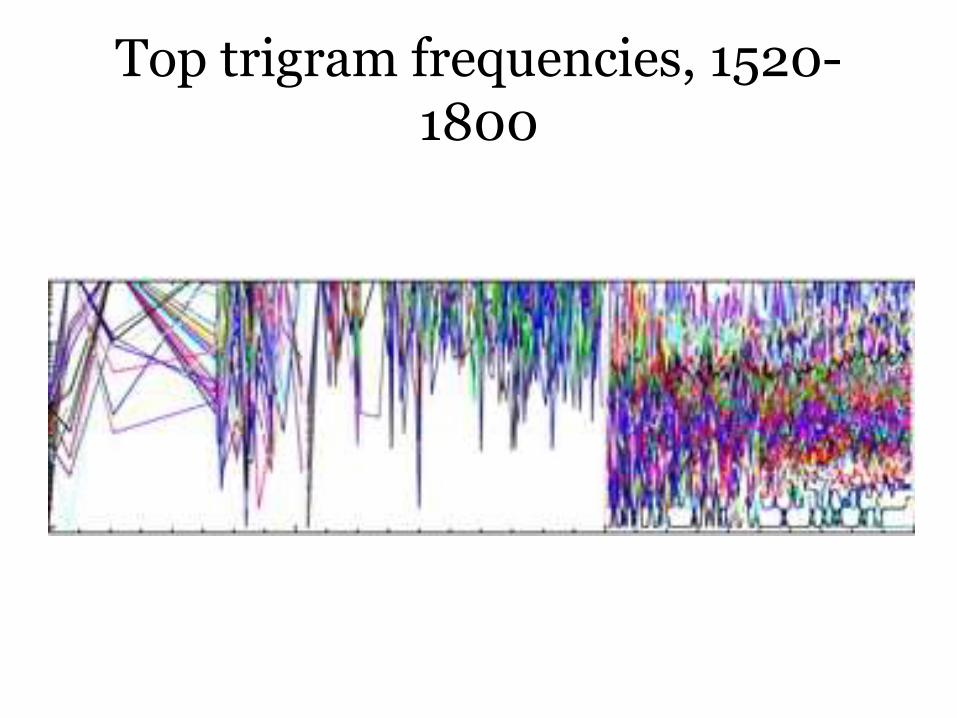
Top trigram frequencies, 1520-1800
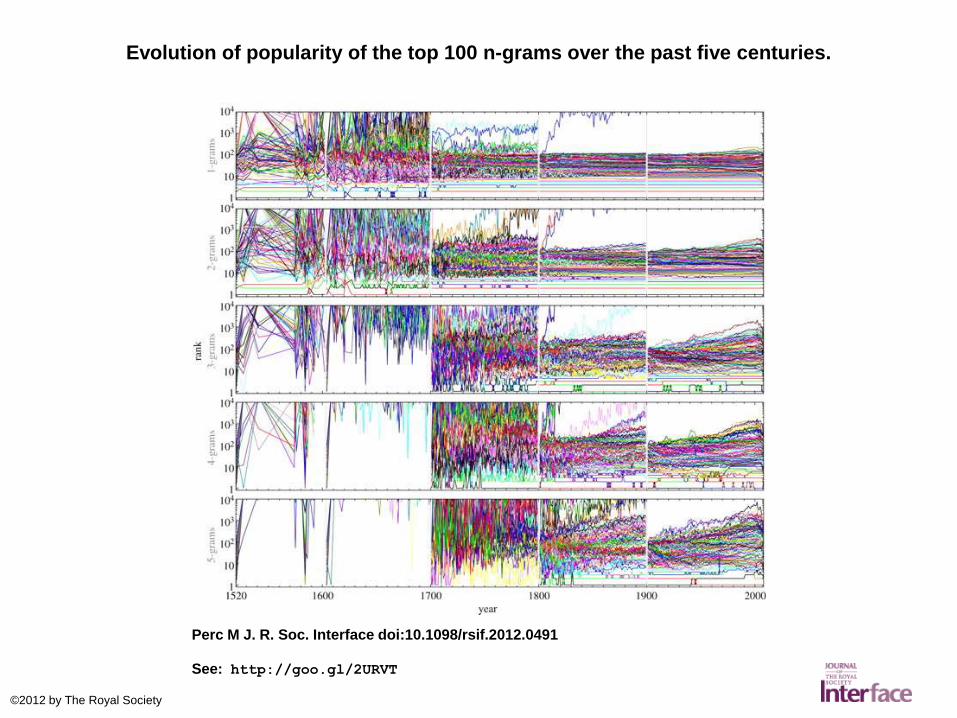
Evolution of popularity of the top 100 n-grams over the past five centuries.
Perc M J. R. Soc. Interface doi:10.1098/rsif.2012.0491
See: http://goo.gl/2URVT
©2012 by The Royal Society
Some alternative conclusions about this research
The world‟s best mass OCR is bad for books before 1800
You should read what the providers of your data say about it: Steven Levitt does
Interdisciplinary journals need to have reviewers from many fields
Real 1520 trigrams
Perc‟s data set contains no true 1520 imprints: his 1520 book is An Open Letter to the Christian Nobility of the German Nation, an early-twentieth-century translation of a book by Martin Luther published in German in 1520.
Another conclusion
Perc‟s publication of his data and an interface for exploring it is praiseworthy: this study is very transparent. It‟s not just that the Google data is readily available: Perc constructed his own tables of the top ngrams year-by-year and published them online.
Some very rough numbers for 1520
STC titles published in 1520: 114
In English: 47
(And figures for both 1519 and 1521 are considerably smaller, because 1520 includes many items dated c.1520.)
Limitations of knowledge
The kind of naïve statistical study Percperformed assumes an entirely reliable and consistent data set. The Google ngramdata isn‟t like that, but while it can be done far better, a data set for early-sixteenth-century English of that kind is not even possible.
Open and closed techniques
When is language unusual?
A man fires an arrow at a Neanderthal in William Golding‟s novel The Inheritors:
A stick rose upright and there was a lump of bone in the middle. Lok peered at the stick and the lump of bone and the small eyes in the bone things over the face. Suddenly Lok understood that the man was holding the stick out to him but neither he nor Lok could reach across the river. He would have laughed if it were not for the echo of the screaming in his head. The stick began to grow shorter at both ends. Then it shot out to full length again.

An obvious but useful method
David Hoover, “The End of the Irrelevant Text: Electronic Texts, Linguistics, and Literary Theory”, Digital Humanities Quarterly 1:2 (2007), used Google to find other instances of the oxymoronic phrase “grew shorter”.
When referring to physical objects (and not lectures, distances, patience, …) it‟s not about sticks, it‟s about fuses, candles, cigarettes… (in use), and articles of clothing, hair... (over time).
Literary significance
Hoover: “Part of the power of „the stick began to grow shorter at both ends‟ is in the shape of Lok‟s incomprehension. For Lok, the whole world is alive, so that a stick that changes length is perfectly comprehensible.”
Problems of technique
What forms do you look for? Hoover‟s investigation looked both at the words Golding used and at the concept of objects growing shorter.
Searches can give very different results with slight differences in query.
It really is true
Geoffrey Pullum, “The sparseness of linguistic data”, Language Log, 7 April 2014: “it really is true that the probability for most grammatical sequences of words actually having turned up on the web really is approximately zero, so grammaticality cannot possibly be reduced to probability of having actually occurred.”

Complex techniques: PCA
Larry L. Stewart, “Charles Brockden Brown: Quantitative Analysis and Literary Interpretation”, Literary and Linguistic Computing, June 2003: among other things, a study of Brown‟s novels Wielandand Carwin, and the distinctiveness of the narrating voices of Clara and Carwin.

Clara and Wieland as narrators

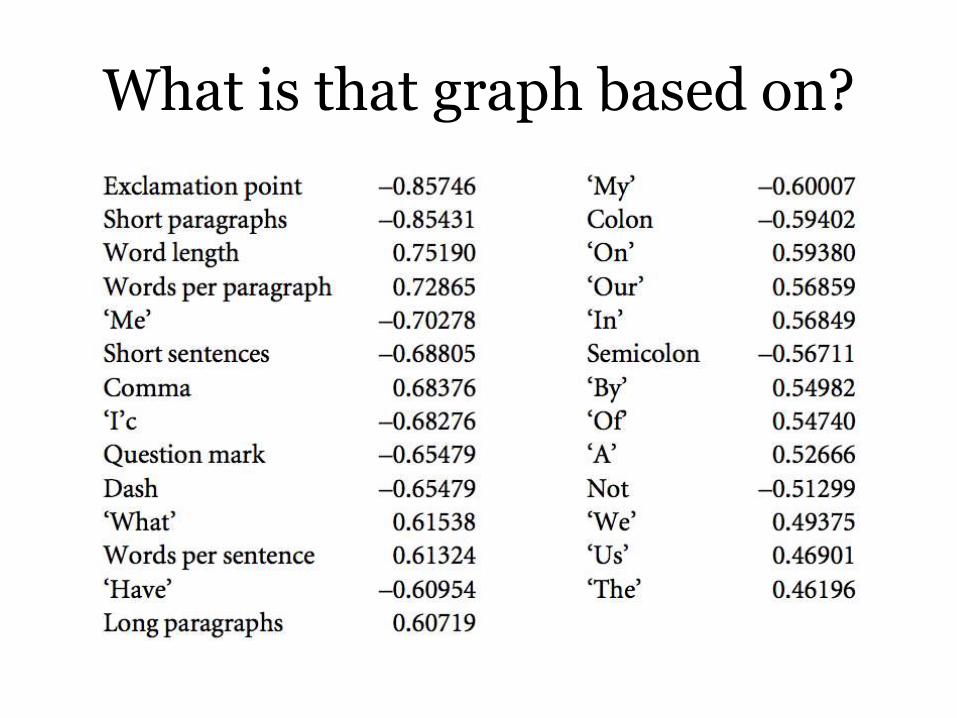
What is that graph based on?
PCA, or Principal Component Analysis, takes as input numerous textual features you choose, and tries to create “components” that capture as much of the variation in the texts as possible: reducing the dozens of dimensions needed to show all these things down to two that roll together a lot of what‟s going on (about half of it, in this case).
Principal components
This reduction is automatic: and is not really a statistical analysis, only a rearrangement of the data. But it does show us groupings of the chapters based on part of the actual data, with Clara‟s narration in Wielandhaving more exclamation points and dashes and fewer instances of “our”; combining these into one feature makes it easier to see.
What is that graph based on?
Can we get back to the text?
Yes, in that Stewart tells us what goes into the first principal component (though not the others).
No, in that he doesn‟t show any passages and analyze them in these terms.
And no, in that a component is a complex weighted combination of parts of features.
Graphs need analysis
It is still common to treat graphs and other visualizations as results, not as texts that themselves need interpretation. Yet they‟re only of interest if they support substantial discussion and analysis, and that ought to appear in the article. Stewart has a literary-critical discussion of the novels in light of this analysis: but why not a few pages first on the graph?
Graphs need interaction
You publish one or two or six graphs in an article, not two hundred, because they take up a lot of space. But if a graph‟s worth doing at all it‟s worth doing differently, and the best way to explore this kind of study is to try out variations yourself.
For all its flaws, this is one thing the Google ngrams resource got right.
Open and closed data
Big uncurated data
Ted Underwood, Michael L. Black, Loretta Auvil, and Boris Capitanu, “Mapping Mutable Genres in Structurally Complex Volumes” (2013), at http://arxiv.org/abs/1309.3323: the study analyzes “a collection of 469,200 volumes drawn from HathiTrust Digital Library”. That‟s an open data collection provided by libraries involved in Google Books.
How do you read 469,200 books?
You start by figuring out how to find the textin them, by skipping things like bookplates and tables of contents. (The bookplates are a reason why Google Books and Google ngrams studies of the word “library” run into problems.) Without doing that first you can‟t go on to study (as they are) the percentage of first-person novels over time.

But it‟s not really transparent now
If you need to do that much to the books before you can analyze them, others either need to duplicate all of that preliminary work or get the results of your preliminary work.
Much work on big data elsewhere is based on data that is simpler in form than books are, or has been prepared for use first (at someone‟s expense).
Curated rather than raw texts
These exist in the humanities, but not necessarily where you want to work or in the numbers you desire. Another C19-novel study by Matthew Wilkens used texts fixed up at Indiana University, with fewer textual errors and clearly-defined structure; but that meant he also had a lot fewer of them.
Specially prepared data
Once it was more common for digital-humanities work to involve creation of new data for analysis: not just basic texts, but also analysis or extraction of features by hand as a basis for analysis.
For example, Brad Pasanek and D. Sculley, “Mining millions of metaphors”, Literary and Linguistic Computing, September 2008.
Pasanek‟s collection
See http://metaphors.lib.virginia.edu/ for his Mind is a Metaphor collection, assembled to support a study of C18 thinking on the subject; a collection based in the first instance on doing lots of searches, extended over the course of many years by several hands.
A little on how it‟s done
Pasanek: “At present I still spend a fair amount of time conducting proximity searches for two character strings. I search one term from a set list ("mind," "heart," "soul," "thought," "idea," "imagination," "fancy," "reason," "passion," "head," "breast," "bosom," or "brain") against another word that I hope will prove metaphorical. For example, I search for "mind" within one hundred characters of "mint" and find the following couplet in William Cowper's poetry:
“The mind and conduct mutually imprintAnd stamp their image in each other's mint.””
Creating data as a scholarly activity
The collection itself is a major effort (and not everyone would have made it public in this way prior to publishing their monograph). Creation of this kind of resource is not yet widely recognized as valuable scholarship: the usual focus is on “uninterpreted” transcription.
And some data comes from sources that cannot be made generally available (copyright again).
Are we satisfied?
Over half the metaphors come from searching Chadwyck-Healey collections of texts; about a third from reading.
There‟s transparency in that Pasanekexplains in detail how he assembled his collection; but it would be a challenge to assemble a rival corpus to compare with this one. Such an effort shouldn‟t really be an individual one, but usually will be.
Conclusions
There‟s a potential for openness in new approaches but some challenges: new forms of publication appropriate for new kinds of work, balancing openness and scholarly recognition, copyright.
We need to find out interesting things to motivate the changes greater transparency requires.
Thank you!
Please contact me at [email protected]
Slides: at http://www.slideshare.net/jlavagnino/tgt