Embed Size (px)
Citation preview
The “nomenclature of multidimensionality” in the digital libraries evaluation domain
Leonidas Papachristopoulos1,2, Giannis Tsakonas3, Michalis Sfakakis1, Nikos Kleidis4, and Christos Papatheodorou1,2
1 Dept. of Archives, Library Science and Museology, Ionian University, Corfu, Greece
2 Digital Curation Unit, Institute for the Management of Information Systems, ‘Athena’ Research Centre, Athens, Greece
3 Library and Information Center University of Patras, Patras, Greece
4 Dept. of Informatics, Athens University of Economics and Business, Greece

“nomenclature”a system for naming things,
especially in a particular area of science
/ 2 /
Introduction / aim / scope
1. We aimed to detect important topics and key persons of the Digital Library evaluation domain by applying the Latent Dirichlet Allocation (LDA) modelling technique on a corpus of conference papers:
• Source: JCDL, ECDL/TPDL & ICADL
• Period: 2001–2013
• Topics: 13 topics
2. We used network analysis centrality metrics to gain awareness of the relationships between these topics.
/ 3 /

Research questions
1. What is the importance of these topics?
1a Which are the most prominent topics emerged in DL evaluation?
1b How they interact each other?
2. Which are the most important research groups or individuals in the DL evaluation domain?
3. How ‘multidimensional’ is the behavior of the researchers in the field?
/ 4 /
Selection stage
• 395 papers (both full and short) from a pool of 2001 were classified as DL evaluation papers by a Naïve Bayes classifier.
• The classifier was assessed by three domain experts, having achieved a high inter-raters’ agreement score.
/ 5 /

Topic extraction stage
• The documents were converted to text.
• The texts were tokenized to construct a ‘bag of words’.
• The ‘bag of words’ was crosschecked to exclude stop words and remove all frequent (>2,100) and rare words (<5).
• A vocabulary of 38,298 unique terms and 742,224 tokens was formed.
• Each paper contributes on average 1,879 tokens
/ 6 /
Topic modelling stage 1/2
• Topic modeling analyzes large quantities of unlabeled data.
• A topic is a probability distribution over a collection of words.
• Each document is a random composition of a number of topics.
/ 7 /
Topic modelling stage 2/2
• Our texts were imported to Mimno’s jsLDA (javascriptLDA) tool.
• 1,000 training iterations were run to achieve a stable structure of topics.
• Several tests were executed to specify the optimal interpretable number of topics.
• Three domain experts examined the word structure of each topic.
• The optimal interpretable number of topics was found to be thirteen (13).
/ 8 /
Topics correlation
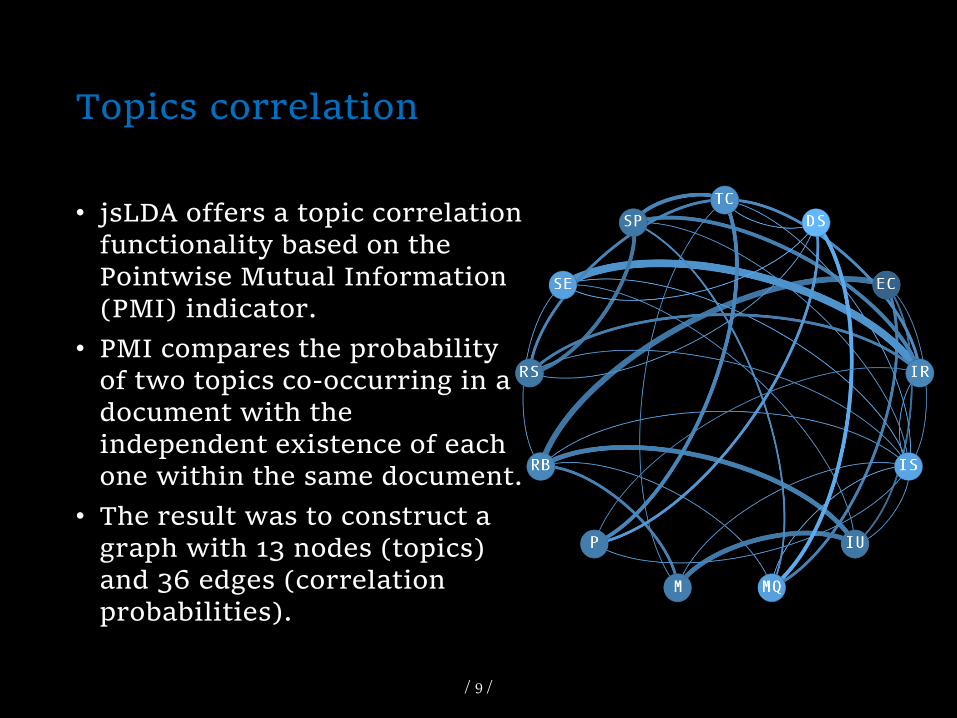
• jsLDA offers a topic correlation functionality based on the Pointwise Mutual Information (PMI) indicator.
• PMI compares the probability of two topics co-occurring in a document with the independent existence of each one within the same document.
• The result was to construct a graph with 13 nodes (topics) and 36 edges (correlation probabilities).
/ 9 /

RQ 1a: Topics significance - metrics
• Degree centrality: the ability of one topic to communicate on a semantic level with others
• Closeness centrality: the ability of one topic to directly connect with others
• Betweenness centrality: the ability of a topic to stand in a central position and bridge other topics
• Clustering Coefficient: localization of topics clusters
/ 10 /
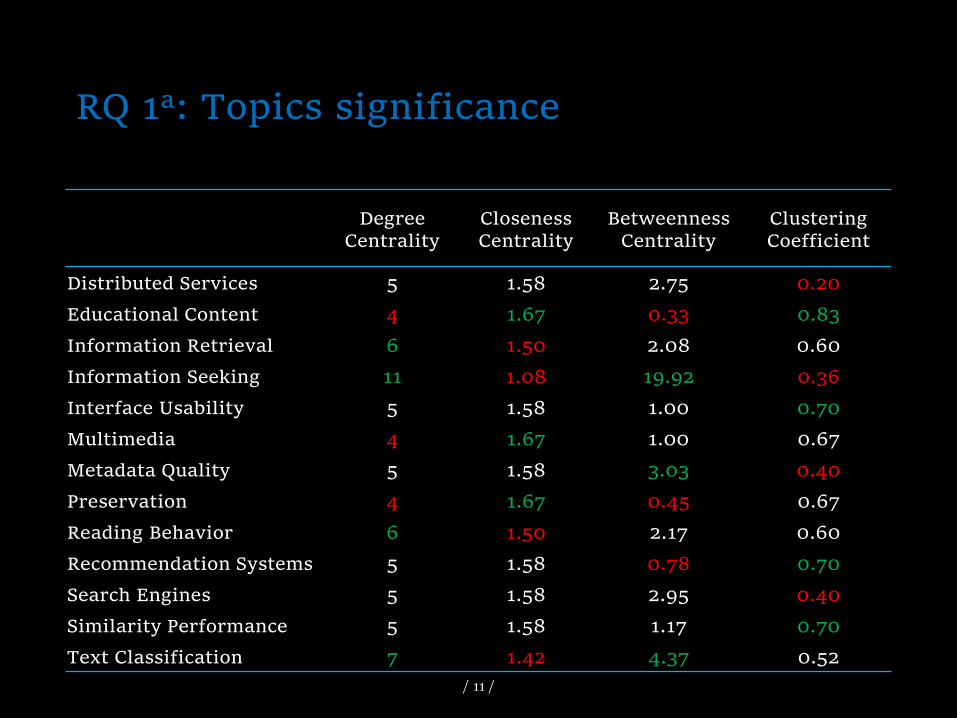
RQ 1a: Topics significance
DegreeCentrality
Closeness Centrality
BetweennessCentrality
Clustering Coefficient
Distributed Services 5 1.58 2.75 0.20
Educational Content 4 1.67 0.33 0.83
Information Retrieval 6 1.50 2.08 0.60
Information Seeking 11 1.08 19.92 0.36
Interface Usability 5 1.58 1.00 0.70
Multimedia 4 1.67 1.00 0.67
Metadata Quality 5 1.58 3.03 0.40
Preservation 4 1.67 0.45 0.67
Reading Behavior 6 1.50 2.17 0.60
Recommendation Systems 5 1.58 0.78 0.70
Search Engines 5 1.58 2.95 0.40
Similarity Performance 5 1.58 1.17 0.70
Text Classification 7 1.42 4.37 0.52
/ 11 /
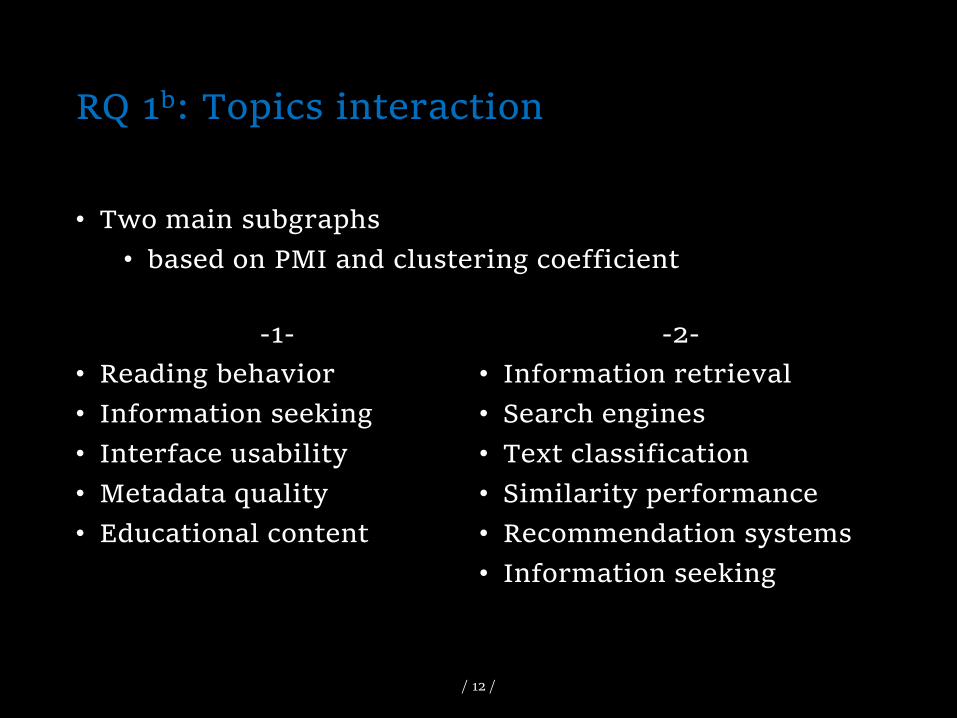
RQ 1b: Topics interaction
-1-
• Reading behavior
• Information seeking
• Interface usability
• Metadata quality
• Educational content
-2-
• Information retrieval
• Search engines
• Text classification
• Similarity performance
• Recommendation systems
• Information seeking
• Two main subgraphs
• based on PMI and clustering coefficient
/ 12 /
RQ 2: authors contribution
• Our corpus consists of 395 papers by 905 unique authors.
• An author participates to more than one paper; thus, the total number of author participations equals to 1,335.
• a paper has an average of 3.38 of author participations
• an author participates on average 1.47 times in the papers.
/ 13 /
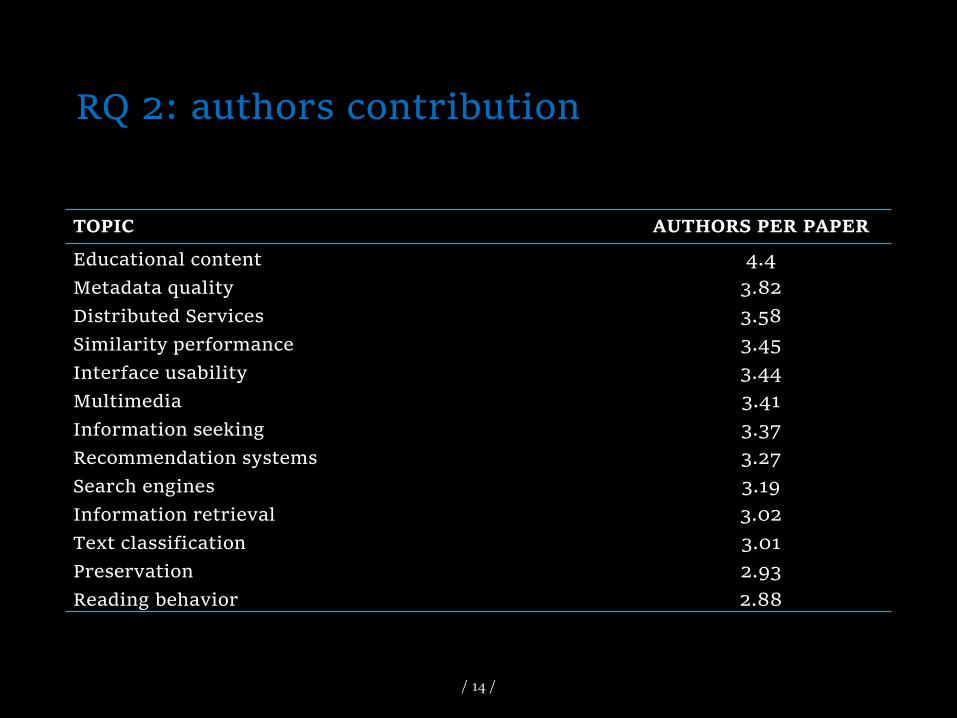
RQ 2: authors contribution
TOPIC AUTHORS PER PAPER
Educational content 4.4
Metadata quality 3.82
Distributed Services 3.58
Similarity performance 3.45
Interface usability 3.44
Multimedia 3.41
Information seeking 3.37
Recommendation systems 3.27
Search engines 3.19
Information retrieval 3.02
Text classification 3.01
Preservation 2.93
Reading behavior 2.88
/ 14 /
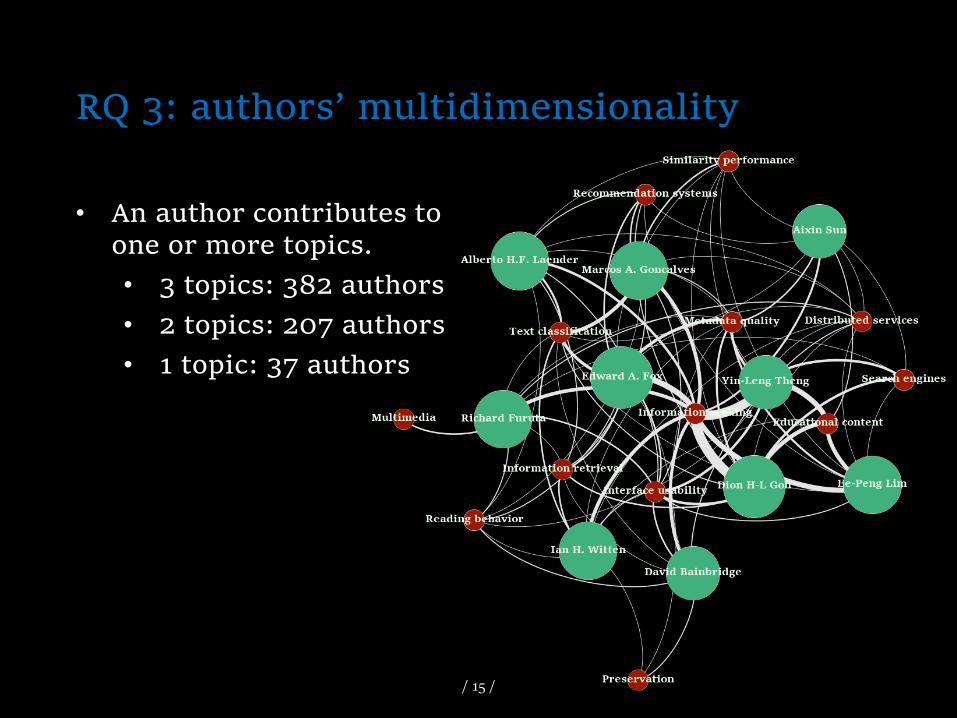
RQ 3: authors’ multidimensionality
/ 15 /
• An author contributes to one or more topics.
• 3 topics: 382 authors
• 2 topics: 207 authors
• 1 topic: 37 authors

Summary
1. We applied Latent Dirichlet Allocation (LDA) on a corpus of papers to identify key topics of the DL evaluation domain.
• We created a topic map of the domain and helped to discover groups of authors that have impact on several topics.
2. We used Network Analysis centrality metrics to gain awareness of the structure, relationships and information flows.
• We revealed bipartite relationships between key topics and key authors/groups of the DL evaluation domain.
/ 16 /

Thank you for your attention
Questions?
Full text at: dx.doi.org/10.1007/978-3-319-43997-6_19
Session: Digital Library Evaluation
Time: Thursday, 08/Sep/2016, 9:00am - 10:30am
Chair: Claus-Peter Klas
Location: Blauer Saal, Hannover Congress Centrum
10.1007/978-3-319-43997-6_19