Embed Size (px)
Citation preview

INTERNATIONAL FOOD POLICY RESEARCH INSTITUTE
The Food Security-Energy-Water Nexus in
Mozambique – Insights from analyzing
improved cook stoves and small-scale
irrigation
Stefan Meyer
November 20, 2014
Maputo, Mozambique

INTERNATIONAL FOOD POLICY RESEARCH INSTITUTE Page 2
Overview
I. Concept of the Food Security-Energy-Water
(FEW) Nexus
II. Details of the HH Survey
III. Overview of the study area – Food, Water and
Energy
IV.Analyzing the drivers of WTP for improved
cook stoves and WTC for small-scale
irrigation

INTERNATIONAL FOOD POLICY RESEARCH INSTITUTE
Concept of the FEW Nexus I
Page 3

INTERNATIONAL FOOD POLICY RESEARCH INSTITUTE
Concept of the FEW Nexus II
The FEW nexus encompasses synergies and trade-offs between food, energy, and water security which are impacted by endogenous and exogenous drivers and cannot be captured if these sectors are analyzed in isolation.
Page 4
Definition of the FEW Nexus:

INTERNATIONAL FOOD POLICY RESEARCH INSTITUTE
Details of the HH survey
• June to July 2014
• Angonia, Tete
• 507 Households (30 villages)
• Main Agricultural Decision Maker and Spouse
• WTP for improved cook stoves and WTC for
small-scale irrigation
Page 5

INTERNATIONAL FOOD POLICY RESEARCH INSTITUTE
Food – Agricultural Production
0.1
.2.3
.4
Den
sity
0 5 10 15PTAREA
Page 6
Average farmsize: 2.75 ha; Median: 2.01
Histogram of the farmsizes within the
sample

INTERNATIONAL FOOD POLICY RESEARCH INSTITUTE
Food - Shortages
Food Shortages Experienced in Previous
Year
Page 7
Frequency Percentage of HH
Not at all 55%
A few days a year 19%Several days per year 17%Several days per month 6%Several days per week 4%

INTERNATIONAL FOOD POLICY RESEARCH INSTITUTE
Food – Food consumption
Food group Frequency
Cereals 98%
White tubers, roots 35%
Vegetables 75%
Fruit 19%
Meat 11%
Eggs 9%
Fish, seafood 16%
Legumes, nuts, seeds 31%
Milk, dairy products 2%
Oils, fats 45%
Sugar, sweets 16%
Spices, condiments, beverages 15%Page 8
Consumption Rates of Food Groups Among
Households (last 24 hours)

INTERNATIONAL FOOD POLICY RESEARCH INSTITUTE
Water – Irrigation practices
Page 9
Percent
Bucket 84%
Treadle pump 5%
Motorized pump 1%
Canal irrigation (gravity fed) 9%
Bound basin flooding (paddy) 2%
• 99 of the 507 HHs use irrigation
• Improved irrigation may:
• increase yields (food security)
• allow for consecutive harvests in one year
Irrigation technologies applied

INTERNATIONAL FOOD POLICY RESEARCH INSTITUTE
Water – Irrigation practices II
Page 10
Too
expensive
Not enough
water
Do not need
irrigation
Not
sufficient
organization
Lack of
knowledge
Bucket x x x
Treadle Pump x x x
Motorized
pump x x x
Canel/gravity
fed x x x x
Drip irrigation x x x x
Bound basin
flooding x x
Main reasons for not using an irrigation technology

INTERNATIONAL FOOD POLICY RESEARCH INSTITUTE
Water - Willingness to contribute to hypothetical
irrigation schemes
Page 11
Percentage on histogram indicates energy/time
saving compared to traditional cookstove
• Farmers become the main stakeholders,
take ownership over schemes: construct,
maintain, manage
• Some difficulties in management transfer:
what exactly are farmers willing to
contribute?

INTERNATIONAL FOOD POLICY RESEARCH INSTITUTE
Water - Willingness to contribute to
hypothetical irrigation schemes
Page 12
Technology Frequency
Bucket/Watering can 76
Treadle pump 172
Motorized pump 242
Canal irrigation 13
Drip irrigation 11
Bound basin flooding 4
Preferred Technologies for Hypothetical Irrigation
Scheme

INTERNATIONAL FOOD POLICY RESEARCH INSTITUTE
Water - Willingness to contribute to
hypothetical irrigation schemes
Page 13
Construction/Set-up Maintenance Management
Temporal Monetary Temporal Monetary Temporal Monetary
Technology
Unpaid
labor
hours per
week
Total
(MZN)
Unpaid
labor
hours per
year
Annual
(MZN)
Unpaid
labor
hours per
year
Annual
(MZN)
Bucket 60 94.5 60 50 50
Treadle pump 200 156 200 104 200Motorized pump 6 250 160 300 144 200Canal/gravity fed 6 100 104.5 150 96 100
Drip irrigation 6 100 104 100 96 100Bound basin/paddy 6 100 195.25 100 208 112.5
Willingness to Contribute (Median) to Hypothetical Irrigation
Scheme
INTERNATIONAL FOOD POLICY RESEARCH INSTITUTE
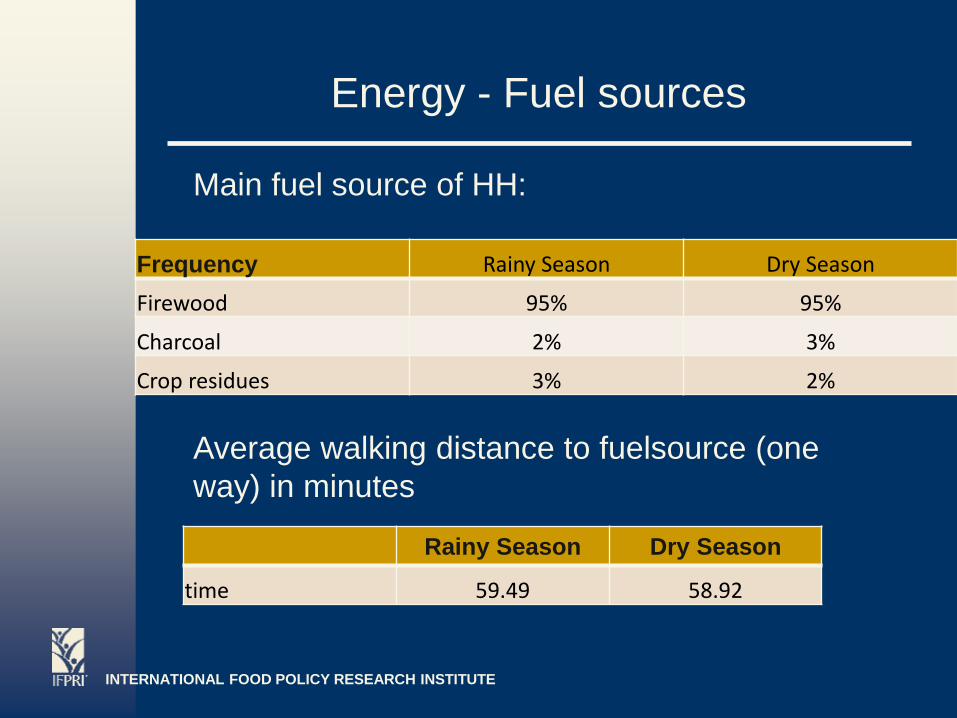
Energy - Fuel sources
Frequency Rainy Season Dry Season
Firewood 95% 95%
Charcoal 2% 3%
Crop residues 3% 2%
Page 14
Main fuel source of HH:
Rainy Season Dry Season
time 59.49 58.92
Average walking distance to fuelsource (one
way) in minutes

INTERNATIONAL FOOD POLICY RESEARCH INSTITUTE
Energy – Cookstove ownership
Clay Stove Metal (wood) Metal (charcoal)
0 1 30
Page 15
Cookstove ownership (total 507 HH)
Reasons for small number of improved
cookstoves ownership
6% own a charcoal metal stove
Cannot
afford an
improved
cookstove
Not
interested/
satisfied
with
traditional
stove
Did not
know about
improved
cookstoves
Not
available in
the village
37% 2% 38% 22%

INTERNATIONAL FOOD POLICY RESEARCH INSTITUTE
Energy – Cooks toves and health
Page 16
Affliction Frequency
Illness with a cough 35%
Cough with short, rapid breaths 19%
Cough affected ability to work 14%
Burns from the stove 8%
Eye infections 14%
• Stove related health issues
• People present in the same room as the
stove while the fire is active
• Occured at least once within the six months
preceeding the survey

INTERNATIONAL FOOD POLICY RESEARCH INSTITUTE
Energy – WTP for fuel efficient cook
stoves
Page 17
WTP for a clay stove (in MZN)
Mean: 100,91 MZN; Median: 80 MZN
RCT Selling price: 90 MZN
0
20
40
60
80
100
120
140

INTERNATIONAL FOOD POLICY RESEARCH INSTITUTE
Energy – WTP for fuel efficient cook
stoves
Mean: 188.08 MZN; Median: 150 MZN
RCT Selling price: 150 MZN
Page 18
WTP for a clay stove (in MZN)
0
10
20
30
40
50
60
70
80
90

INTERNATIONAL FOOD POLICY RESEARCH INSTITUTE
Analyzing WTC for small-scale
irrigation
Page 19

INTERNATIONAL FOOD POLICY RESEARCH INSTITUTE
Analyzing WTP for improved cook
stoves
Page 20

INTERNATIONAL FOOD POLICY RESEARCH INSTITUTE
Discussion
Page 21

INTERNATIONAL FOOD POLICY RESEARCH INSTITUTE
Thank you for your attention
Page 22