Embed Size (px)
Citation preview

Commonwealth Educational
Media Centre for Asia
Technical Vocational Skill
Development through Open and
Distance Learning in India
Dr Ankuran Dutta
Programme Officer
CEMCA, New Delhi
Education in India
1.4 Million Schools
36.7 K Colleges
11.5 K Stand-
alone Inst.
712 Universities
56% 28%
9%
7%
School Education
Primary
Upper Primary
Secondary
Senior Secondary
31%
4% 23%
41%
1%
Stand Alone Institutions
Diploma LevelTechnical
PGDM
Diploma LevelNursing
Diploma LevelTeacher Training
Institute underMinistries

Higher Education
6%
43%
18%
20%
0% 2% 10%
1% 0%
Universities in India
Central University
State Public University
Deemed University
State Private University
Central Open University
State Open University
Institution of National Importance
Institutions under State Legislature Act
Others

What GER says?
Gross enrolment ratio
(GER) is 90.8% for the
school level, 49.1% in
the senior or higher
secondary level and
21.1% in the higher
education level
2004-05 2005-06 2006-07 2007-08 2008-09 2009-10 2010-11 2011-12 2012-13(P)
Secondary (IX-X)
14-15years51.7 52.2 53.5 58.2 60.4 62.9 65.2 66.6 67.7
Senior Secondary (XI-XII)16-17years
27.8 28.5 28.9 33.5 34.5 36.1 39.4 45.9 43.6
(IX-XII) 14-17 years
39.9 40.4 41.1 45.8 47.4 49.4 52.2 56.8 56.3
Higher Education 18-23 years
10.0 11.6 12.4 13.1 13.7 15.0 19.4 20.8 21.1
0
10
20
30
40
50
60
70
80
Gross Enrolment Ratio

Dropout- the threat in Indian Education
• The drop-out rate in
secondary level is
47.4%, which was
82.5% in 1980-81.
• The rate is more for
the backward classes.
• Girls dropout rate is
decreasing than boys-
70.9% (I-V) in 1960-
61is projected to came
down to 18.3% in
2013-14 for girls,
which is for boys –
61.7 to 21.2
2005-06 2006-07 2007-08 2008-09 2009-10 2010-11 2011-122012-13(P)
2013-14(P)
Classes(I-X) All
61.6 59.9 56.7 54.2 52.7 49.2 50.3 50.4 47.4
Classes(I-X) SC
70.6 69.0 68.4 59.8 59.0 56.1 55.3 52.5 50.1
Classes(I-X) ST
78.5 78.1 76.9 76.0 74.9 70.9 65.9 62.7 62.4
0.0
10.0
20.0
30.0
40.0
50.0
60.0
70.0
80.0
90.0
Drop out rates

Quality vs Quantity in Education
• Are we producing unemployable youth?
• A research shows that 67% of Indian employers
reported that they struggle to find workers who
meet their requirements.
• “80% of the workforce in rural and urban areas
does not possess any identifiable marketable
skills.”
• 75% of future job opportunities will be “skill-
based.”
http://monitor.icef.com/2013/02/to-upskill-workforce-india-goes-international/

Vocational Education in India • Labour Force as % of Population is 45 %
• India has one of the lowest productivity index in the world.
• Number of people undergoing TVSD courses in the ‘organized sector’
about 3.5 million {& 45 million in the ‘unorganized sector’ (estimated)}
• Percentage of work force undergoing some sort of TVSD course 8%
to10 %
• Nearly 20 Ministries of the Government seem to be imparting TVSD
courses. The largest are the Ministry of Labour and the Ministry of HRD.
• Ministry of labour has more than 5000 ITI’s. Ministry of Education has
about 700 Polytechnics and about 6000 Vocational schools.
• The National Policy for Skill Development, adopted in 2009, aims to
create a skilled workforce of 500 million people by 2022.
• The NSDC alone is tasked with training 30% of the 500 million workers.

What ODL contributes?
• Out of 21.1% GER in higher education, 3.5 million students enrolled
in the open and distance institutions that comprises of 12% of the
total enrolment of 29.6 million in higher education in the year 2012-
13.
• About 44% enrollments in distance education are female students
and 80% students are enrolled in the undergraduate level
programmes.
• Through- 14 Open Universities + more than 150 dual mode
universities.
• In schooling level except state open schools, cumulative enrolment at
NIOS is 2.71 Million (Secondary - 46%, Senior Secondary - 49% &
Vocational - 5%). NIOS is the largest Open Schooling System in the
world.

Why ODL for Vocational Education?
• ODL can play a major role in skilling a large number
• It can provide the support in skilling and re-skilling
• It has the flexibility and learner friendly approach
• ODL play a significant role to those who could not get access to
the formal education system
• It is cost effective and can take place while continuing full-time
employment
• ODL can provide skill training to the learners of remote areas
• It can be aligned with changing skills demands due to competition
and rapid market changes, especially in Small and Medium
Enterprises
• More suitable for TVET for the girls and women
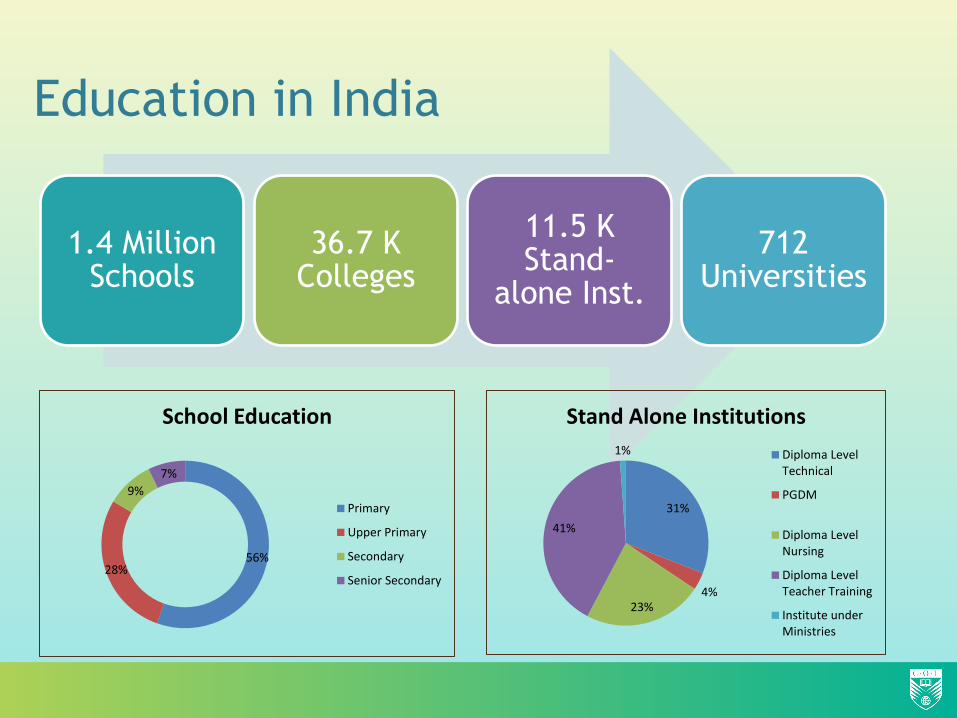
Why to develop courses considering gender?
0
5000
10000
15000
20000
25000
30000
Vocational Admission 2001-7*
No of Students
Male
Female
0
5000
10000
15000
20000
25000
30000
35000
2009-10 2010-11 2011-12 2012-13
Vocational Admission 2009-13*
Boys
Girls
Total
Linear (Boys)
Linear (Girls)
Linear (Total)
* Statistics of National Institute of Open Schooling.

Medium of Instruction should be a major
concern
11559
15832
19511
20722
7514 6947 6843
7312
0
5000
10000
15000
20000
25000
2009-10 2010-11 2011-12 2012-13
Medium Wise Vocational Admission at NIOS
HINDI
ENGLISH
Linear (HINDI)
Linear (ENGLISH)

ODL should focus on all age groups for skill development
-2000
0
2000
4000
6000
8000
10000
12000
14000
16000
2009-10 2010-11 2011-12 2012-13
14 - 20
21 - 25
26 - 30
31 - 35
36 - 40
41 - 45
46 - 50
Above 50
Linear (Above 50)
0
2000
4000
6000
8000
10000
12000
14000
16000
0 0.5 1 1.5 2 2.5 3 3.5 4 4.5
14 - 20
21 - 25
26 - 30
31 - 35
36 - 40
41 - 45
46 - 50
Above 50

What gets priority in vocational certification?
2000 2001 2002 2003 2004 2005 2006 2007 2008 2009 2010 2011 2012
Appeared 8808 11456 13735 17759 21352 22496 21584 21001 23141 22616 23622 23833 13226
Certified 5796 6677 9466 11787 12474 13682 12420 12622 13784 13438 14210 12154 8595
0
5000
10000
15000
20000
25000
30000
cati
on
al C
ert
ific
atio
n a
t N
IOS
0
5000
10000
15000
20000
25000
30000
2009 2010 2011
Vocational Examination Result
Appeared
Certified
Linear(Appeared)
Linear(Certified)

ANDHRA PRADESH ASSAM
BIHAR
GUJARAT
HARYANA
HIMACHAL PRADESH
JAMMU &KASHMIR
KARNATAKA
KERALA
MADHYA PRADESH
MAHARASHTRA
ORISSA
PUNJAB
RAJASTHAN TAMILNADU
TRIPURA
UTTAR PRADESH
WEST BENGAL
CHANDIGARH
JHARKHAND
GOA
CHHATTISGARH
PONDICHERY
UTTARAKHAND
DELHI
Vocational admission in States at NIOS in 2011-12
No admission in the
states like Nagaland,
Meghalaya, Manipur,
Arunachal Pradesh.
Admission in Assam and
Tripura is bellow 1% of
the total enrolment.
Special focus needs for under developed regions.

D/ Lib & Info Science 27%
PGD/ Computer Application 18%
C/ Computer Hardware 15%
C/ Tea Cultivation & Management
14%
C/ Computer Networking
8%
PHD/ HRM 6%
C/ Computer Application
2%
PGD/ Business
Management 2%
D/ Hotel Management 2%
D/ Creative Writing in English
1%
PGD/ B'cast Journalism 1%
D/ Computer Hardware & Networking
1% D/ Tourism
Management 1%
C/ 2-3 Wheeler Repairing
1%
PGD/ Tourism & Hospitality
Management 1%
C/ Mobilephone repairing 0%
D/ Computer Application 0%
KKHSOU Vocational Admission 2011-13
Missing link- Institution vs Industry

Identify the need based and innovative courses
0
500
1000
1500
2000
2500
3000
2010 2011 2012 2013 2014
IGNOU top enrolled vocational courses
DECE
DTS
CTS
DDT
DWM
CPF
CHCWM
COF
Diploma in Early Childhood Care and Education (DECE), Diploma in Tourism Studies (DTS), Certificate in Tourism Studies (CTS), Diploma in Dairy Technology (DDT), Diploma in Watershed
Management (DWM), Certificate in Poultry Farming (CPF), Certificate in Health Care Waste Management (CHCWM), Certificate in Organic Farming (COF)

Awareness, publicity, pre-admission counselling needed to
make programmes successful
11
3
12 11
18
3
5 4
3
1
9
4 4
1
5 6
3
7
DMT DPVCPO DAQ DFPT
IGNOU low enrolled vocational courses
2010 2011 2012 2013 2014
Diploma in Meat Technology (DMT), Diploma in Production of Value Added Products from
Cereals, Pulses and Oilseeds (DPVCPO), Diploma in Aquaculture (DAQ), Diploma in Fish
Products Technology (DFPT)

Major Challenges
1. Development of courses without market research
2. Non-availability of courses in new/emerging areas
3. Inadequate infrastructure & obsolete equipment
4. Insufficient financial resources
5. Social stigma
6. Non-availability of appropriate policies- institutional/ state
7. Lack of flexibility and autonomy to the institutions
8. Expensive print based SLMs
9. Lack of exposure on hands on activity
10.Lack of importance on blended approach
11.Inadequate industry linkage
12.Lack of Research and Development
13.Outdated curricula
14. Absence on policy for revision

Recommendations
1. Alignment of the courses with NSQF
2. Development of courses on local need
3. Innovative curricula based on need assessment, may consult
the NSDC Skill gap report
4. Design curricula as per industry requirement
5. Development of infrastructure
6. Stop duplication, use/ adopt OERs
7. Adopt appropriate policies with autonomy to the institutions
8. Mandatory internship/ hands on activity/ workshop
9. Design SLMs with blended and user friendly approach; need
more emphasis on ICT
10.Need attention for all category of people considering age,
gender, ability, location
11.Instructional design for Persons with Disability
12.Assurance of maintaining quality in designing, implementing and
delivery of vocational courses through ODL.

4 key issues for vocational education through ODL
- To be local
- To engage the private sector
- To be up to date
- To be open to the world
- Sir John Daniel
References
• All India Survey on Higher Education 2011-12. (2014). New Delhi: Ministry of Human Resource
Development, Govt. of India.
• All India Survey on Higher Education 2012-13 (Provisional). (2014). New Delhi: Ministry of Human
Resource Development, Govt. of India.
• Higher Education in India: Vision 2030. (2013). Retrieved from FICCI website:
http://www.teqipgoodgovernance.in/FICCI-E%20Y%20Report%20Final.pdf
• India - Higher Education Sector Opportunities for Private Participation. (2012). Retrieved from
https://www.pwc.in/en_IN/in/assets/pdfs/industries/education-services.pdf
• MHRD. (2014). Indian Standard Classification of Education. Retrieved January 31, 2015, from
aishe.nic.in/aishe/viewDocument.action?documentId=174
• Report of ‘The Committee to Advise on Renovation and Rejuvenation of Higher Education’. (2012).
Retrieved from MHRD website: http://www.academics-india.com/yashpal-committee-report.pdf
• Taking Stock A sector wide scan of Higher Education in India. (2012). Retrieved from
Confederation of Indian Industry website:
https://www.pwc.in/en_IN/in/assets/pdfs/industries/education/publication/higher-education-report-
nov-2012.pdf
• Understanding India: The future of higher education and opportunities for international cooperation.
(2014). New Delhi: British Council India.

Thank You
You may contact-
Blog: comcomm.blogspot.in
Web: www.cemca.org.in


![[PPT]PowerPoint Presentation - Kampabhai Vocational …kbvtiindia.org/pdf/Bussiness-Proposal.pptx · Web viewNational Skill Development Corporation (NSDC) and Sector Skill Council](https://img.pdfslide.us/doc/110x75/5a9ea6297f8b9a84178b9e61/pptpowerpoint-presentation-kampabhai-vocational-viewnational-skill-development.jpg)