Embed Size (px)
Citation preview

TANKS – IN – SERIES MODEL

CONTENT
• Introduction
• Tanks in series model
• Applications
• Reference
INTRODUCTION
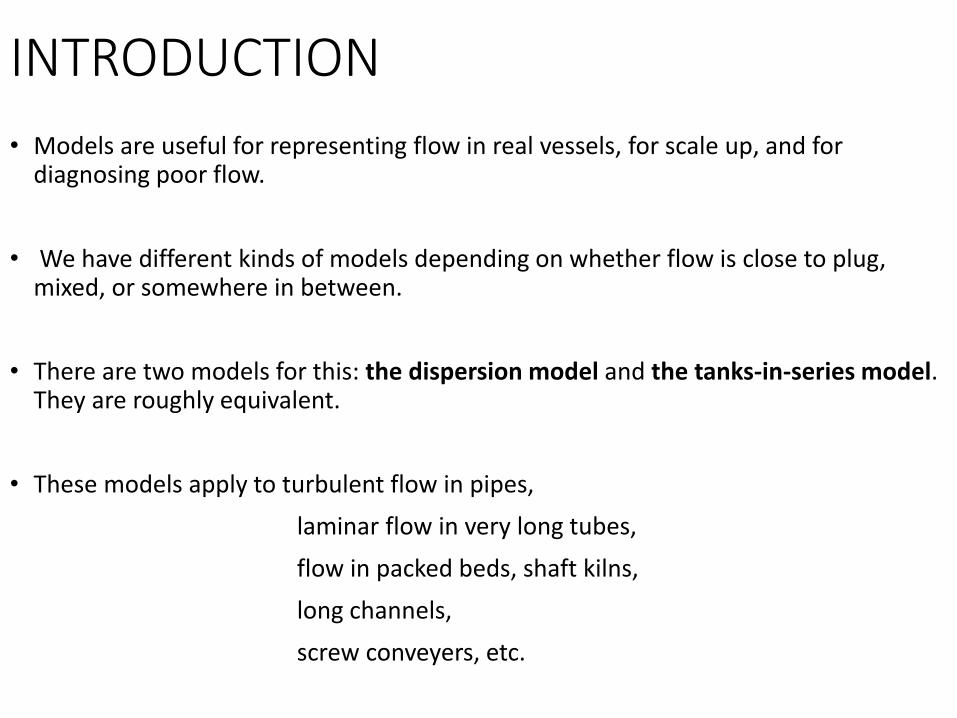
• Models are useful for representing flow in real vessels, for scale up, and for diagnosing poor flow.
• We have different kinds of models depending on whether flow is close to plug, mixed, or somewhere in between.
• There are two models for this: the dispersion model and the tanks-in-series model. They are roughly equivalent.
• These models apply to turbulent flow in pipes,
laminar flow in very long tubes,
flow in packed beds, shaft kilns,
long channels,
screw conveyers, etc.

• For laminar flow in short tubes or laminar flow of viscous materials these models may not apply, and it may be that the parabolic velocity profile is the main cause of deviation from plug flow.
• We treat this situation, called the pure convection model.
• Tanks in Series model is used when the deviation from plug flow is very less.
Advantages of Tanks in series model:-
• It is simple,
• It can be used with any kinetics,
• It can be extended without too much difficulty to any arrangement of compartments, with or without recycle.

TANKS IN SERIES MODEL
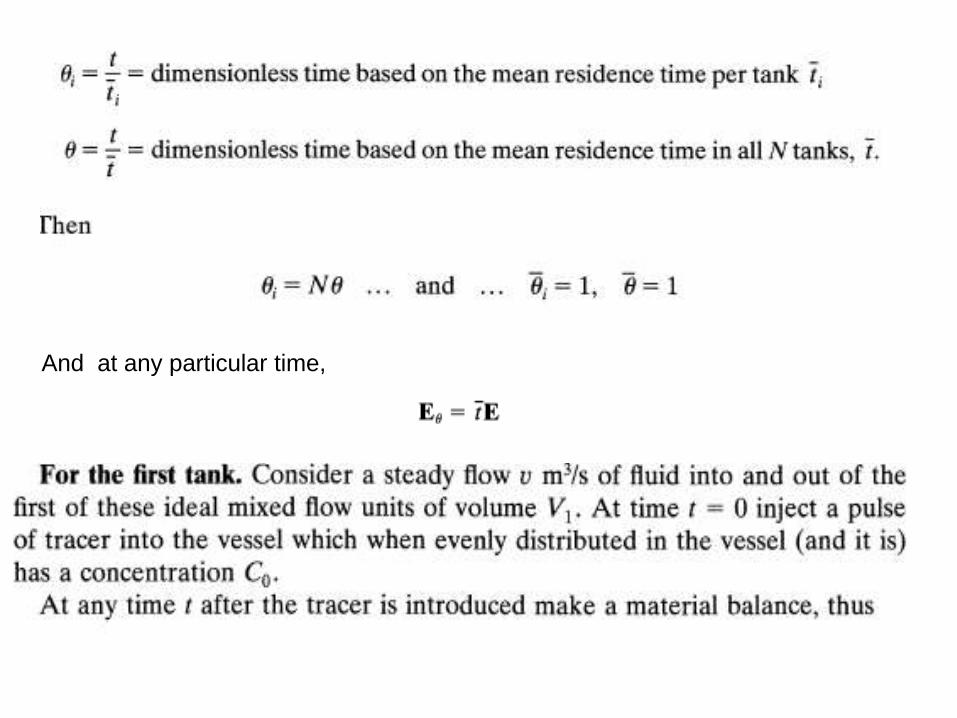
And at any particular time,


If we introduce any one shot tracer input into N tanks, then from Equations 3 and 4 we
can write


APPLICATIONS
1. CLOSED RECIRCULATION SYSTEM• If we introduce a DELTA signal into an N stage system, the recorder will
measure tracer as it flows by the first time, the second time, and so on. In other words it measures tracer which has passed through N tanks, 2N tanks, and so on.
• In fact it measures the superposition of all these signals. To obtain the output signal for these systems simply sum up the contributions from the first, second, and succeeding passes. If m is the number of passes, we then have from Eq. 3

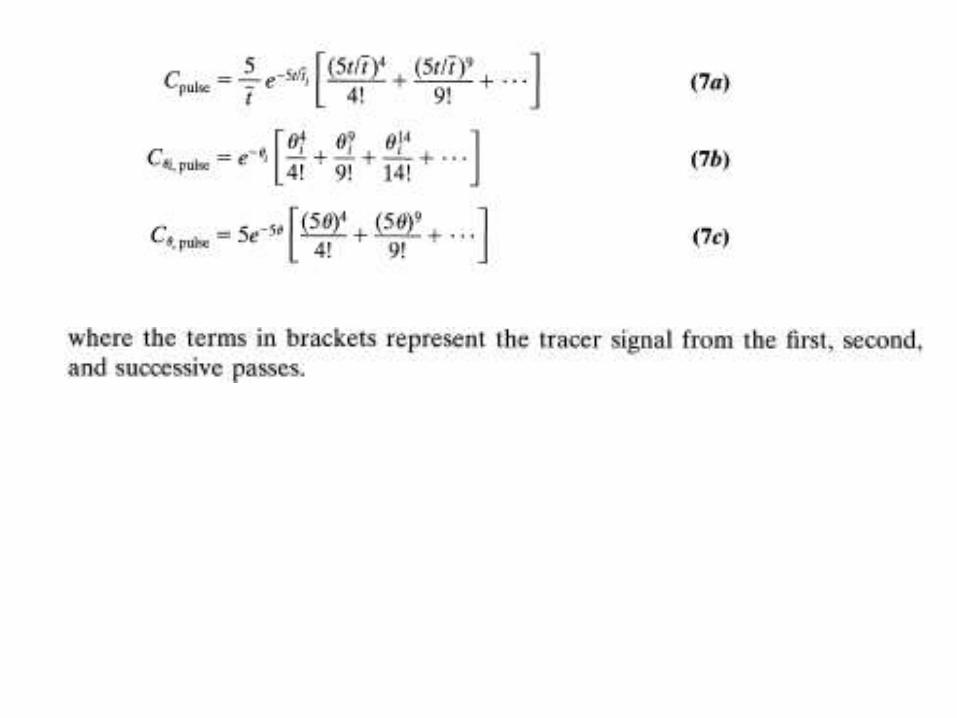
• The below figure shows the resulting C curve. As an example of the expanded form of Eq. 5 we have for five tanks in series
where the terms in brackets represent the tracer signal from the first, second,and successive passes.

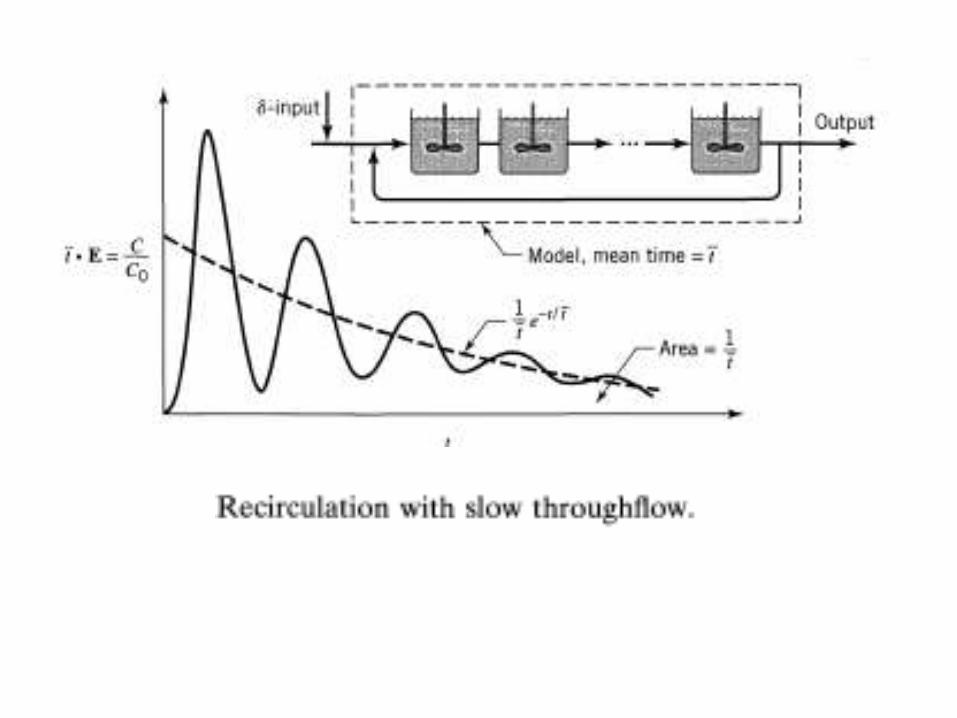
2. Recirculation with Throughflow.
• For relatively rapid recirculation compared to throughflow, the system as a whole acts as one large stirred tank; hence, the observed tracer signal is simply the superposition of the recirculation pattern and the exponential decay of an ideal stirred tank. This is shown in Figure below where C, is the concentration of tracer if it is evenly distributed in the system.
• This form of curve is encountered in closed recirculation systems in which tracer is broken down and removed by a first-order process, or in system using radioactive tracer.
• Drug injection on living organisms give this sort of superposition because the drug is constantly being eliminated by the organism.

3. Step Response Experiments and the F Curve
The output F curve from a series of N ideal stirred tanks is, in its various forms, given by Eq. 8.

• This is shown graphically as