Embed Size (px)
Citation preview
States on the Hot Seat
Climate Change Laws in California and Oregon
(and a little itty bit on Maryland and Washington)
Keith Bartholomew, University of UtahRebecca Lewis, University of OregonGeoffrey Chiapella, San Luis Obispo COGKim Ellis, Oregon Metro MPOLauren Michele, Policy in Motion

Recurring Questions in Climate Mitigation Planning
• Appropriate Scale – Local, Metropolitan, or State?
• Voluntary Action – Limitation or Opportunity?
• Coalition Building – Good Policy vs. Good Politics?
• Sticks, Carrots, and Orange-Colored Sticks – What works best?
• Data and Tools for Monitoring Progress – Who and how?
• Performance-Based Planning – What does the future hold?
Driving down GHG from Transportation: Assessing Efforts in Four States
Rebecca Lewis, Robert Zako, Alexis Biddle, Rory Isbell, Emily Kettell,
Elizabeth Miller
NITC #789 Assessing State Efforts to Integrate Transportation, Land Use and Climate.
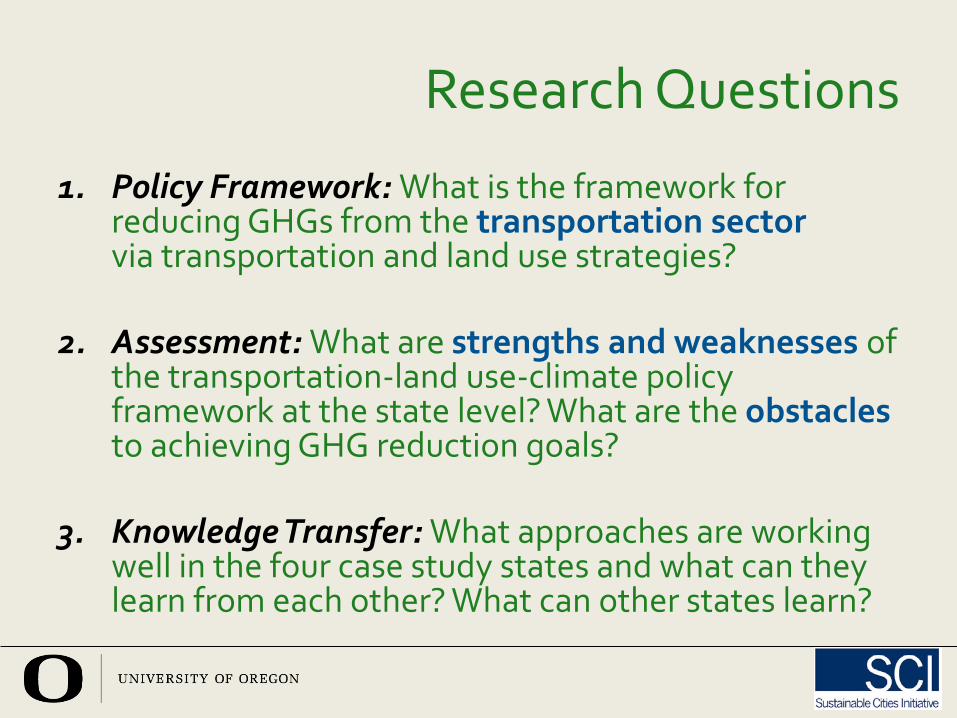
Research Questions
1. Policy Framework: What is the framework for reducing GHGs from the transportation sector via transportation and land use strategies?
2. Assessment: What are strengths and weaknesses of the transportation-land use-climate policy framework at the state level? What are the obstacles to achieving GHG reduction goals?
3. Knowledge Transfer: What approaches are working well in the four case study states and what can they learn from each other? What can other states learn?
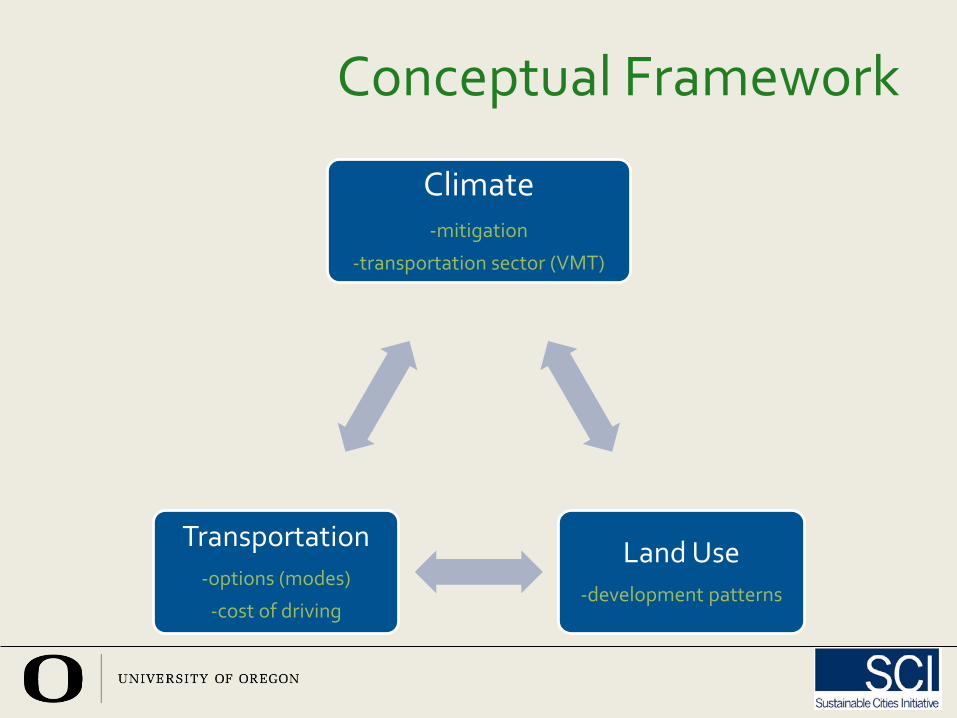
Conceptual Framework
Climate-mitigation
-transportation sector (VMT)
Land Use-development patterns
Transportation-options (modes)
-cost of driving
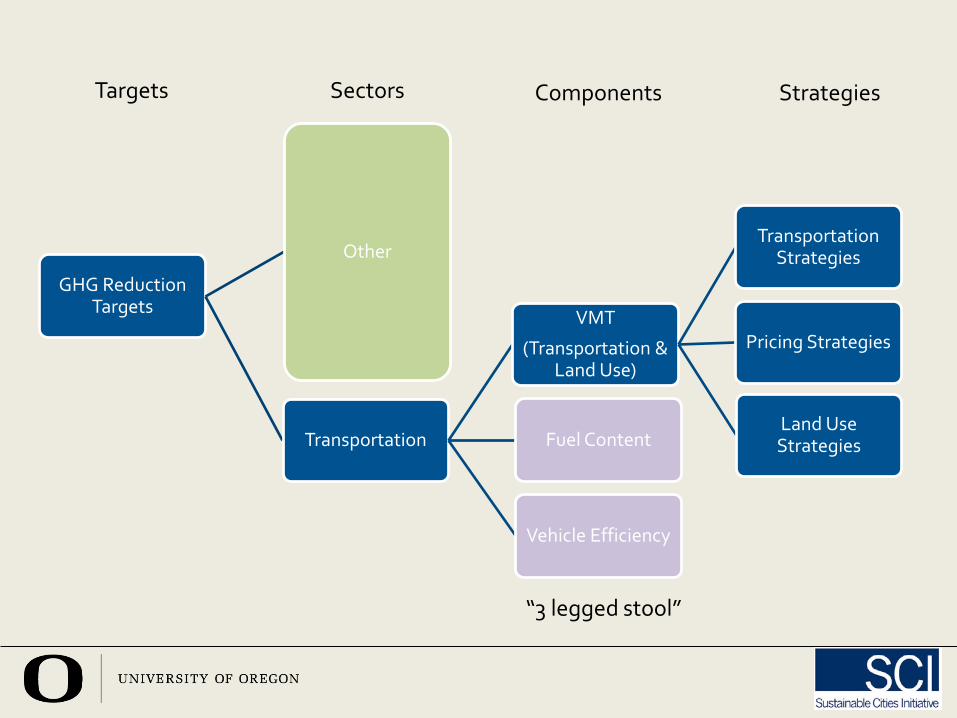
GHG Reduction Targets
Other
Transportation
VMT
(Transportation & Land Use)
Transportation Strategies
Pricing Strategies
Land Use Strategies
Vehicle Efficiency
Fuel Content
Targets Sectors Components Strategies
“3 legged stool”
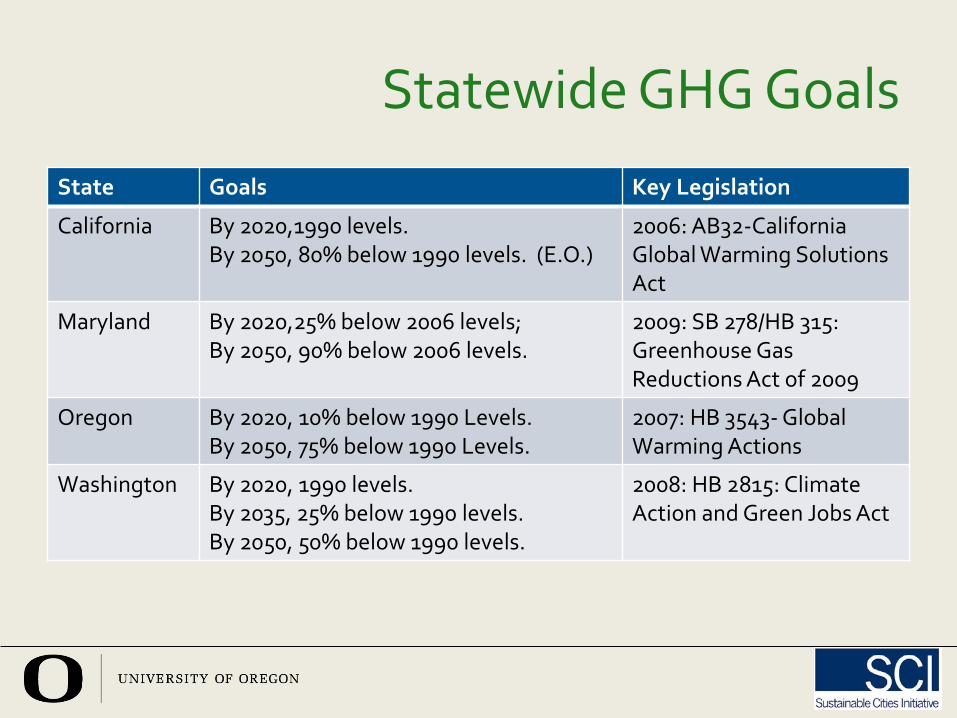
Statewide GHG GoalsState Goals Key Legislation
California By 2020,1990 levels. By 2050, 80% below 1990 levels. (E.O.)
2006: AB32-California Global Warming Solutions Act
Maryland By 2020,25% below 2006 levels; By 2050, 90% below 2006 levels.
2009: SB 278/HB 315:Greenhouse Gas Reductions Act of 2009
Oregon By 2020, 10% below 1990 Levels.By 2050, 75% below 1990 Levels.
2007: HB 3543- Global Warming Actions
Washington By 2020, 1990 levels. By 2035, 25% below 1990 levels. By 2050, 50% below 1990 levels.
2008: HB 2815: Climate Action and Green Jobs Act
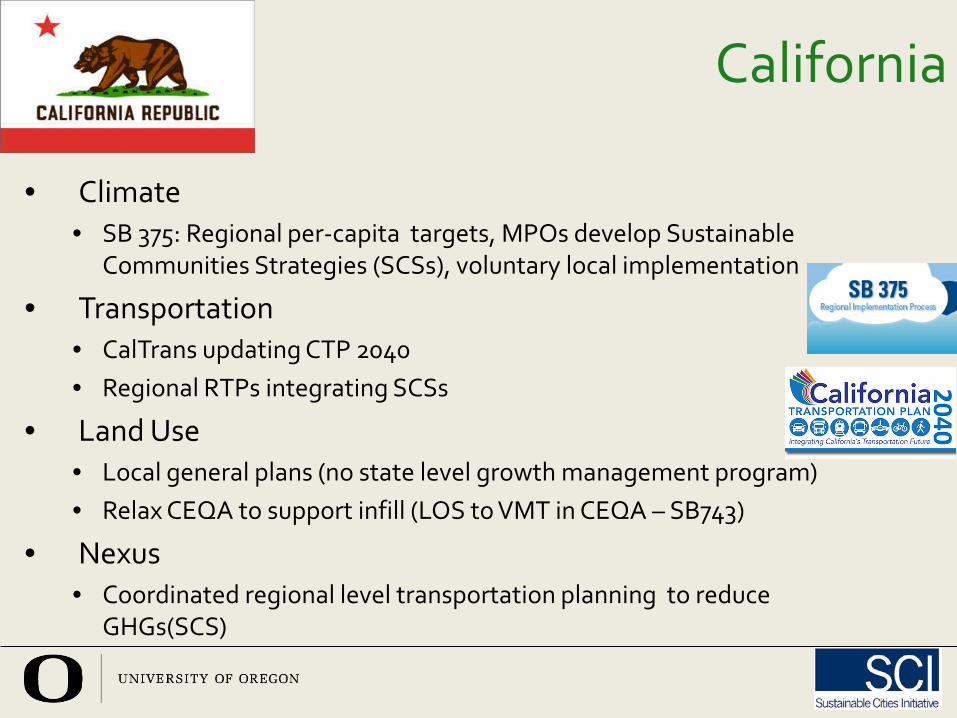
California
• Climate• SB 375: Regional per-capita targets, MPOs develop Sustainable
Communities Strategies (SCSs), voluntary local implementation
• Transportation• CalTrans updating CTP 2040 • Regional RTPs integrating SCSs
• Land Use• Local general plans (no state level growth management program)• Relax CEQA to support infill (LOS to VMT in CEQA – SB743)
• Nexus• Coordinated regional level transportation planning to reduce
GHGs(SCS)
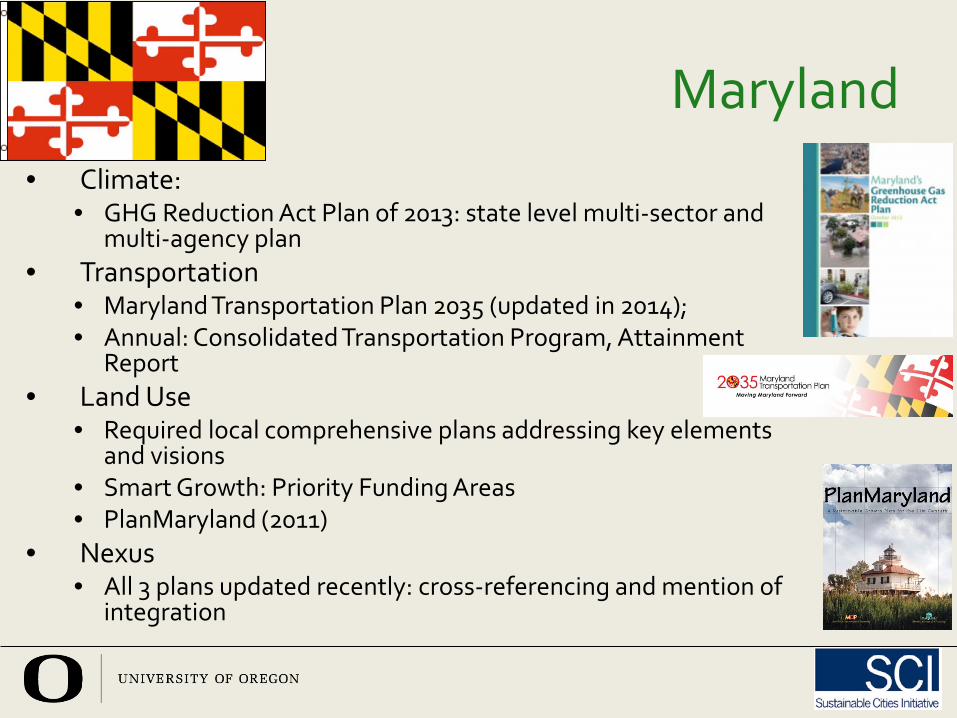
Maryland• Climate:
• GHG Reduction Act Plan of 2013: state level multi-sector and multi-agency plan
• Transportation• Maryland Transportation Plan 2035 (updated in 2014); • Annual: Consolidated Transportation Program, Attainment
Report• Land Use
• Required local comprehensive plans addressing key elements and visions
• Smart Growth: Priority Funding Areas• PlanMaryland (2011)
• Nexus• All 3 plans updated recently: cross-referencing and mention of
integration
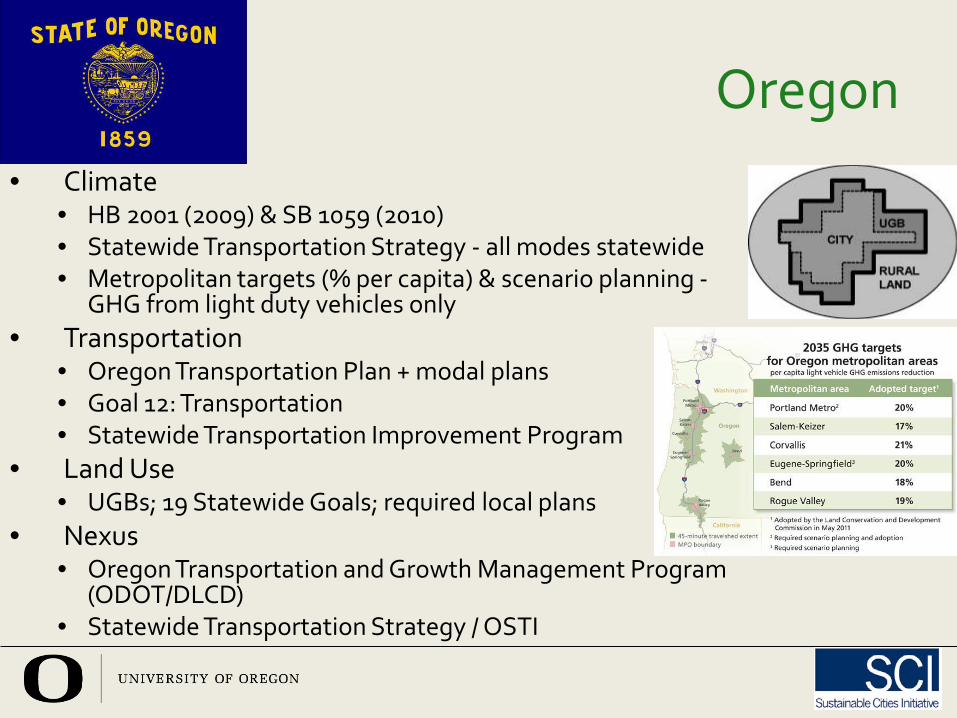
Oregon• Climate
• HB 2001 (2009) & SB 1059 (2010)• Statewide Transportation Strategy - all modes statewide• Metropolitan targets (% per capita) & scenario planning -
GHG from light duty vehicles only • Transportation
• Oregon Transportation Plan + modal plans• Goal 12: Transportation • Statewide Transportation Improvement Program
• Land Use• UGBs; 19 Statewide Goals; required local plans
• Nexus• Oregon Transportation and Growth Management Program
(ODOT/DLCD)• Statewide Transportation Strategy / OSTI
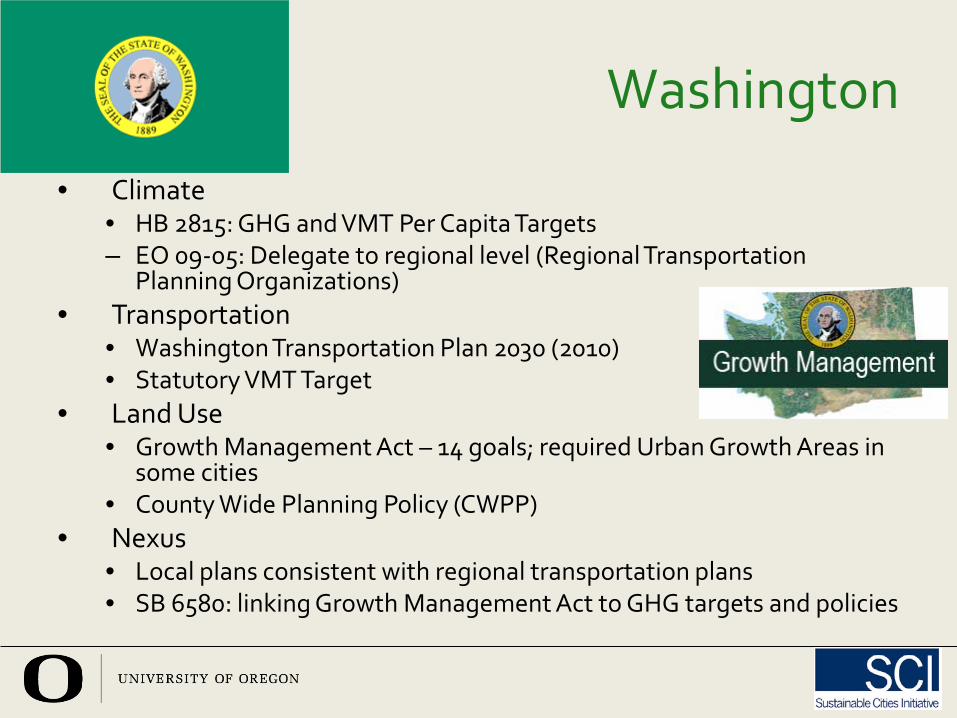
Washington
• Climate• HB 2815: GHG and VMT Per Capita Targets – EO 09-05: Delegate to regional level (Regional Transportation
Planning Organizations)• Transportation
• Washington Transportation Plan 2030 (2010)• Statutory VMT Target
• Land Use• Growth Management Act – 14 goals; required Urban Growth Areas in
some cities• County Wide Planning Policy (CWPP)
• Nexus• Local plans consistent with regional transportation plans• SB 6580: linking Growth Management Act to GHG targets and policies
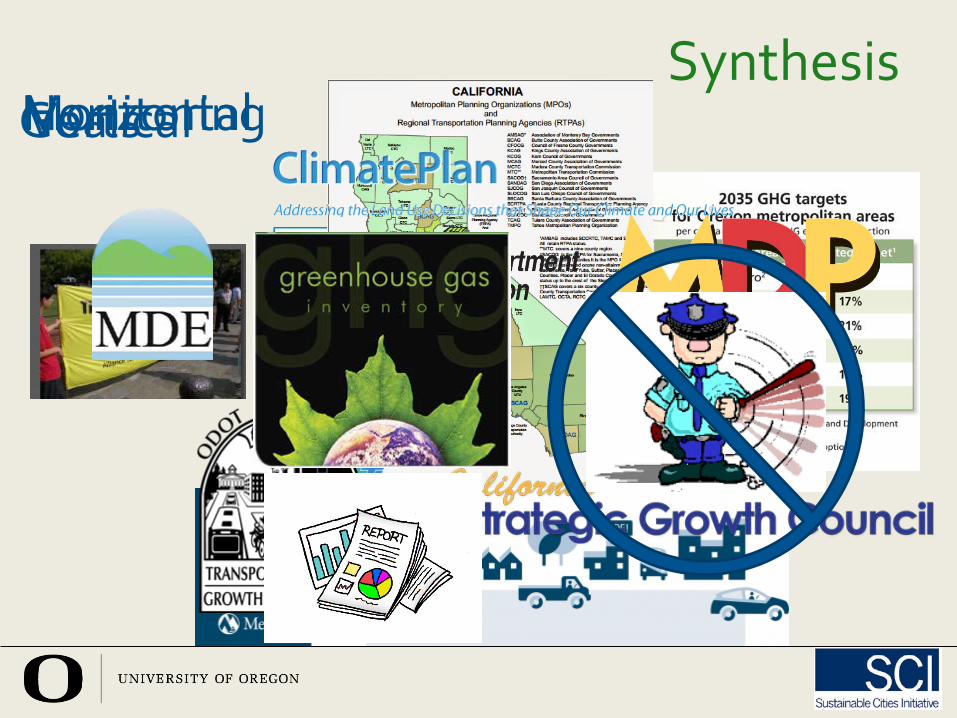
SynthesisGoalsVerticalHorizontalMonitoring
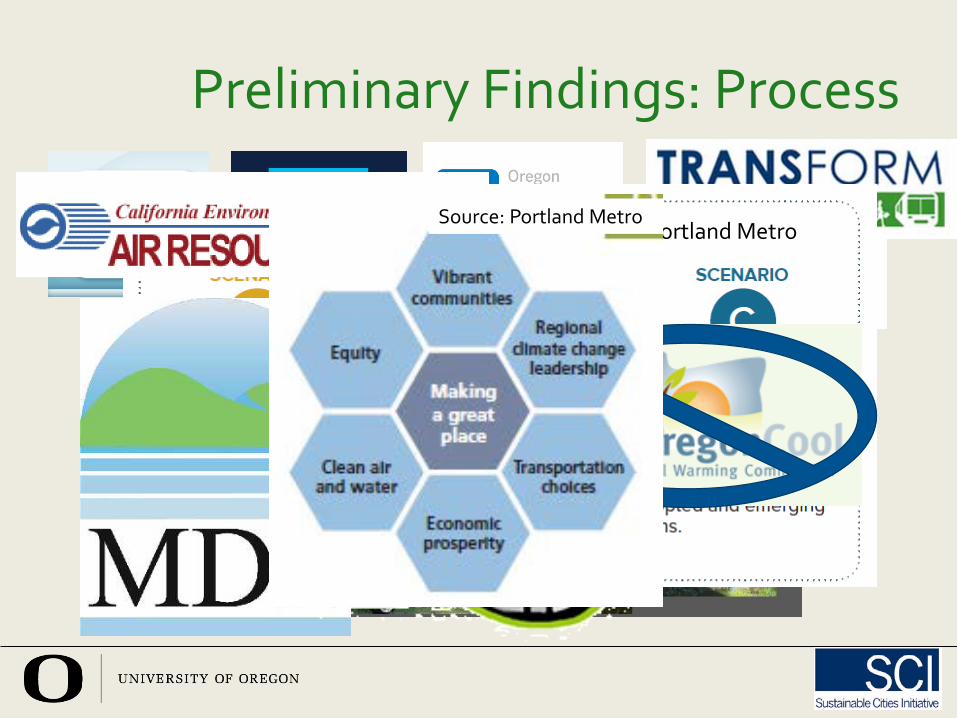
Preliminary Findings: Process
Source: Tescher, Mintier, Hammond
Source: http://www.oregon.gov/ODOT/TD/OSTI/Pages/scenario_planning.aspx
Source: Portland MetroSource: Portland Metro
Preliminary Findings & Recommendations: Implementation
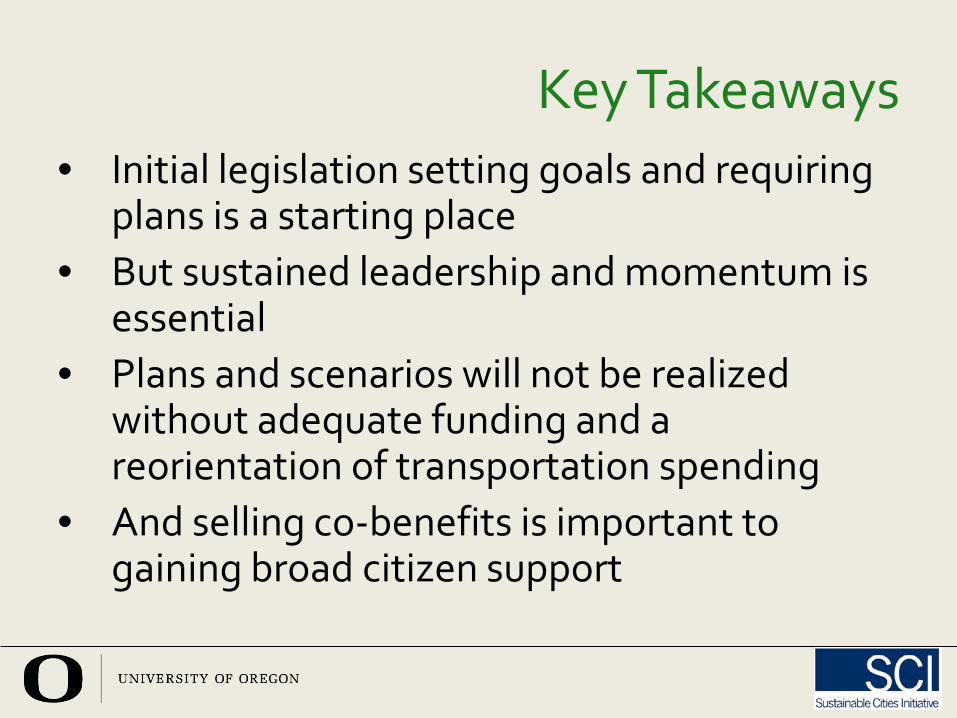
Key Takeaways• Initial legislation setting goals and requiring
plans is a starting place• But sustained leadership and momentum is
essential• Plans and scenarios will not be realized
without adequate funding and a reorientation of transportation spending
• And selling co-benefits is important to gaining broad citizen support
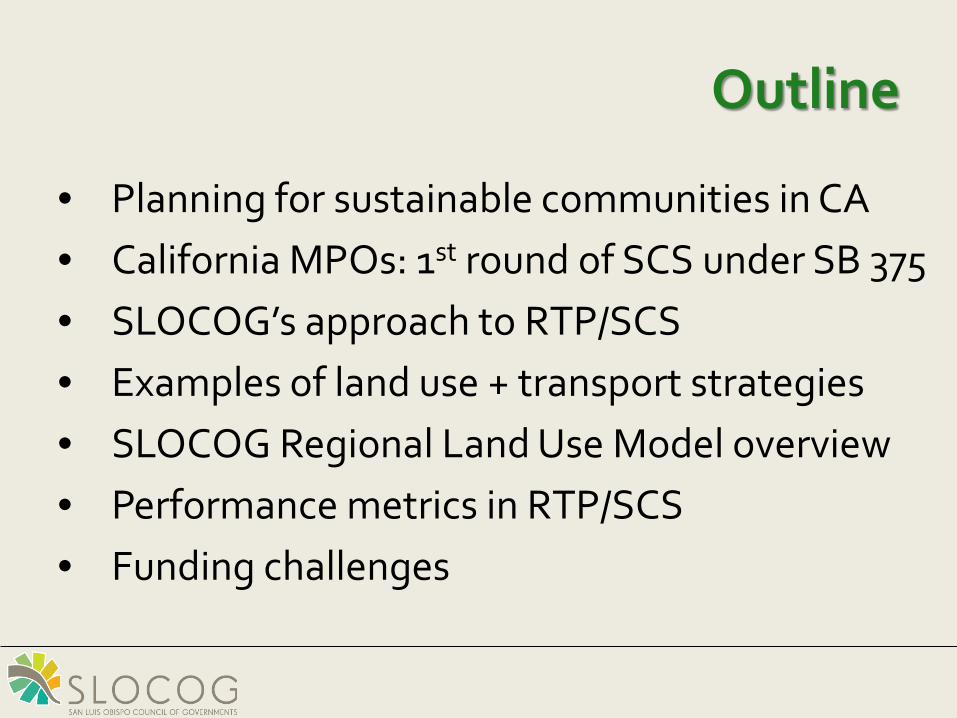
Outline
• Planning for sustainable communities in CA• California MPOs: 1st round of SCS under SB 375• SLOCOG’s approach to RTP/SCS• Examples of land use + transport strategies• SLOCOG Regional Land Use Model overview• Performance metrics in RTP/SCS• Funding challenges
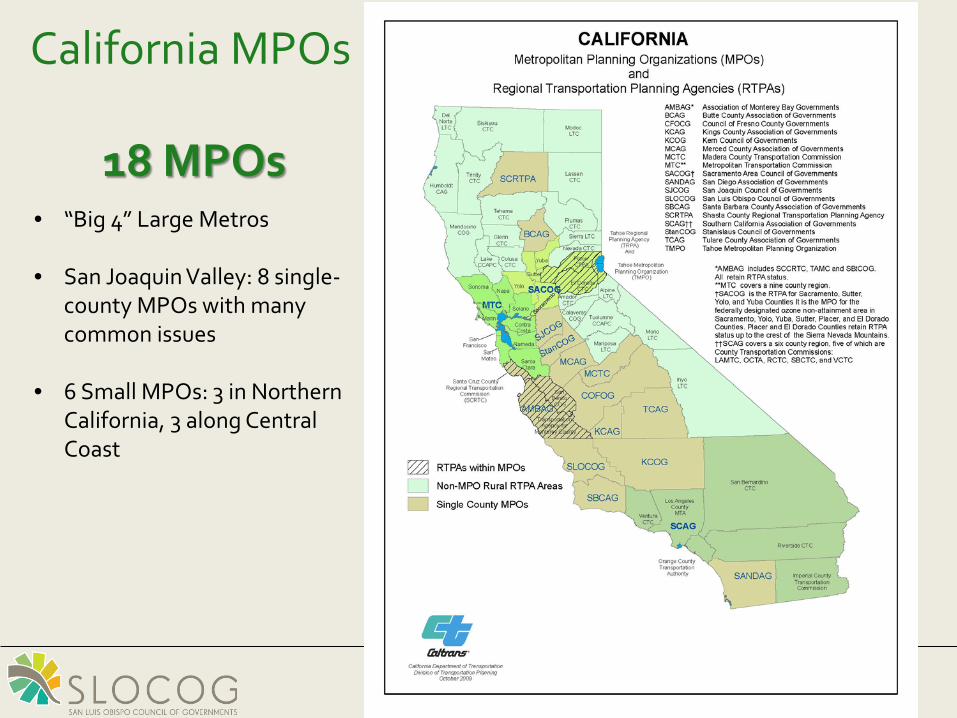
California MPOs
18 MPOs• “Big 4” Large Metros
• San Joaquin Valley: 8 single-county MPOs with many common issues
• 6 Small MPOs: 3 in Northern California, 3 along Central Coast
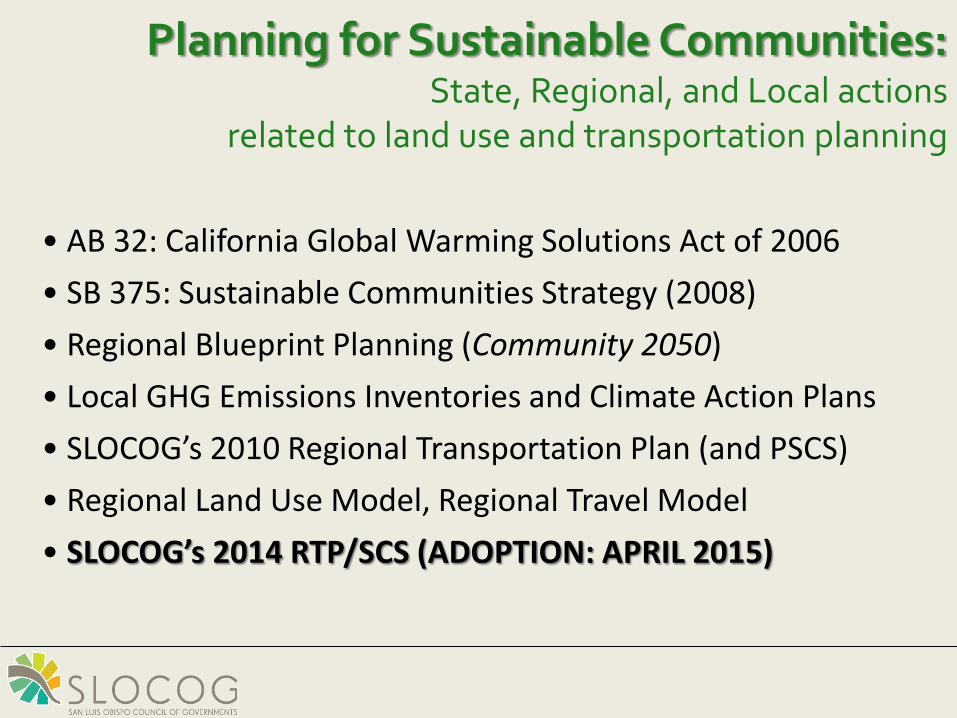
Planning for Sustainable Communities: State, Regional, and Local actions
related to land use and transportation planning
• AB 32: California Global Warming Solutions Act of 2006• SB 375: Sustainable Communities Strategy (2008)• Regional Blueprint Planning (Community 2050)• Local GHG Emissions Inventories and Climate Action Plans• SLOCOG’s 2010 Regional Transportation Plan (and PSCS)• Regional Land Use Model, Regional Travel Model• SLOCOG’s 2014 RTP/SCS (ADOPTION: APRIL 2015)
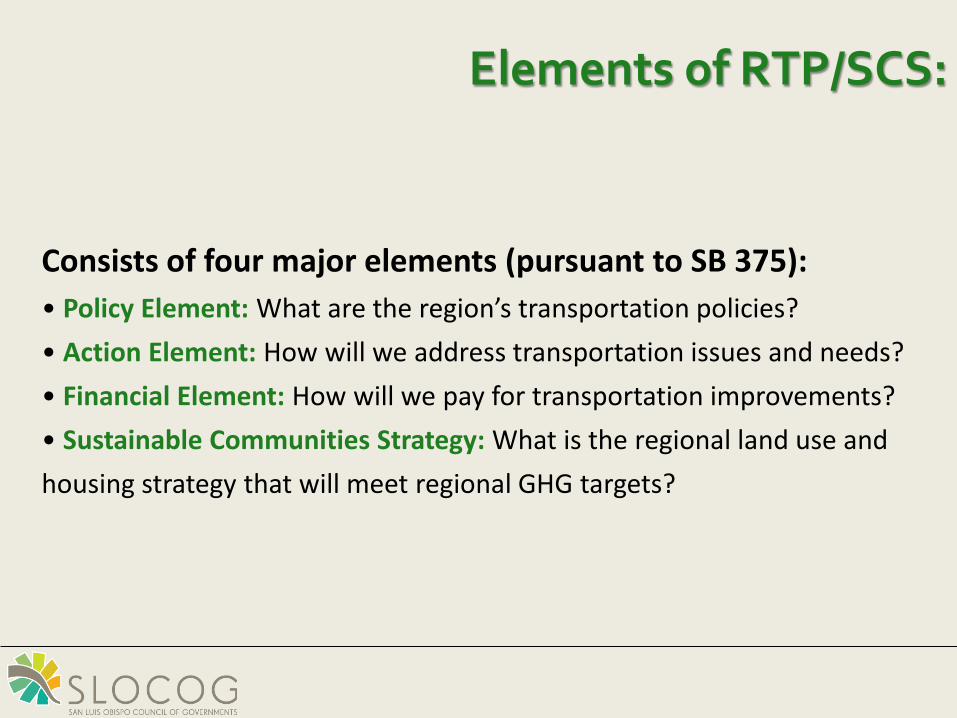
Elements of RTP/SCS:
Consists of four major elements (pursuant to SB 375):• Policy Element: What are the region’s transportation policies?• Action Element: How will we address transportation issues and needs?• Financial Element: How will we pay for transportation improvements?• Sustainable Communities Strategy: What is the regional land use and housing strategy that will meet regional GHG targets?
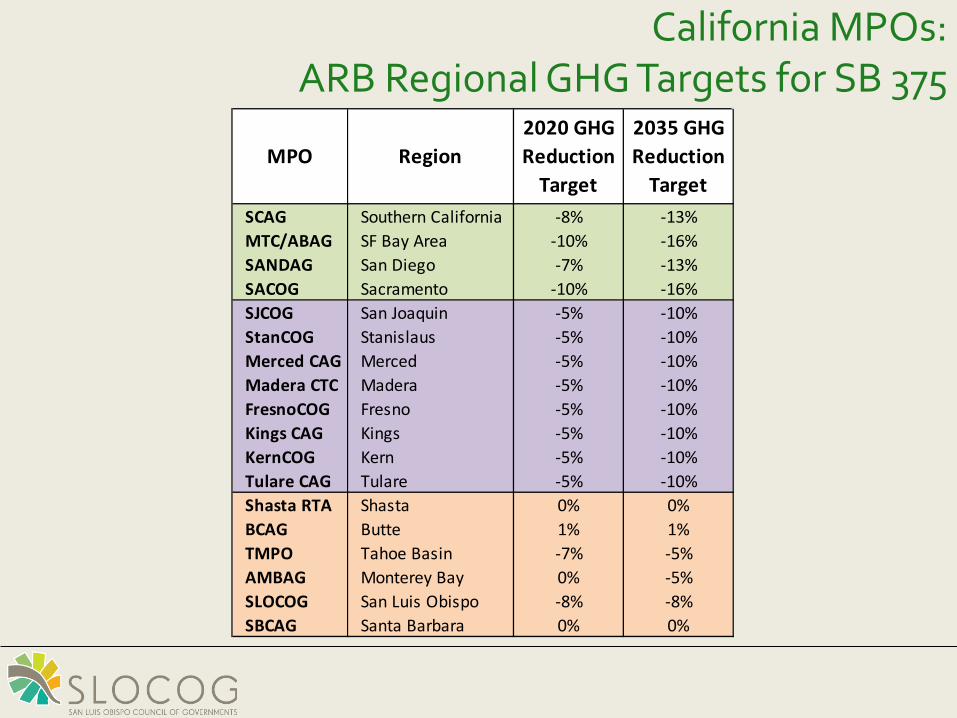
California MPOs: ARB Regional GHG Targets for SB 375
SCAG Southern California -8% -13%MTC/ABAG SF Bay Area -10% -16%SANDAG San Diego -7% -13%SACOG Sacramento -10% -16%SJCOG San Joaquin -5% -10%StanCOG Stanislaus -5% -10%Merced CAG Merced -5% -10%Madera CTC Madera -5% -10%FresnoCOG Fresno -5% -10%Kings CAG Kings -5% -10%KernCOG Kern -5% -10%Tulare CAG Tulare -5% -10%Shasta RTA Shasta 0% 0%BCAG Butte 1% 1%TMPO Tahoe Basin -7% -5%AMBAG Monterey Bay 0% -5%SLOCOG San Luis Obispo -8% -8%SBCAG Santa Barbara 0% 0%
MPO Region2020 GHG Reduction
Target
2035 GHG Reduction
Target
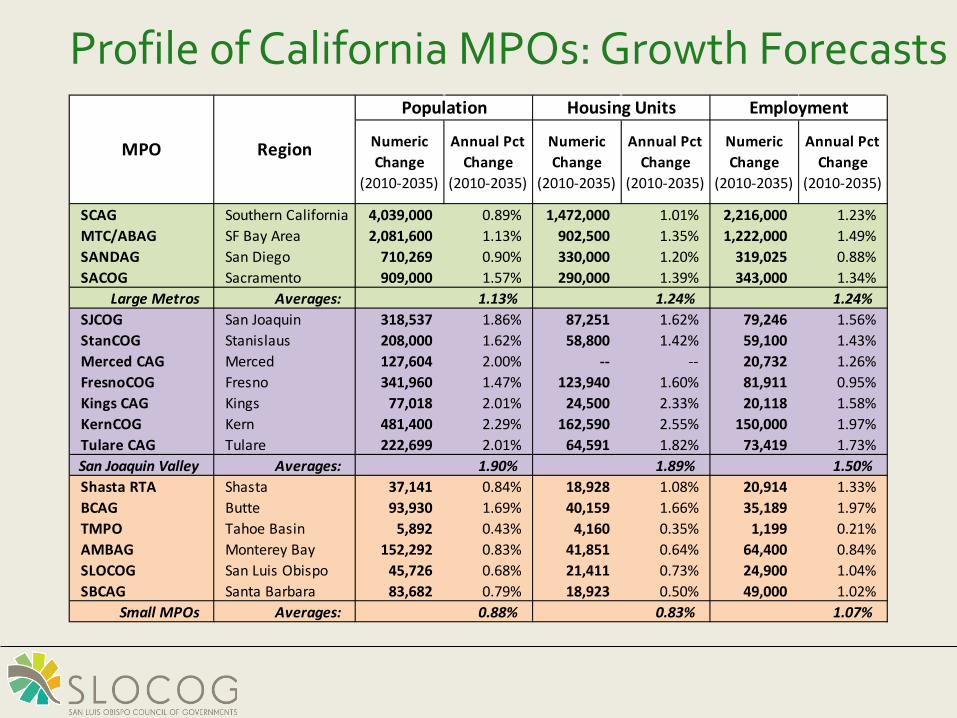
Profile of California MPOs: Growth Forecasts
Numeric Change
(2010-2035)
Annual Pct Change
(2010-2035)
Numeric Change
(2010-2035)
Annual Pct Change
(2010-2035)
Numeric Change
(2010-2035)
Annual Pct Change
(2010-2035)
SCAG Southern California 4,039,000 0.89% 1,472,000 1.01% 2,216,000 1.23%MTC/ABAG SF Bay Area 2,081,600 1.13% 902,500 1.35% 1,222,000 1.49%SANDAG San Diego 710,269 0.90% 330,000 1.20% 319,025 0.88%SACOG Sacramento 909,000 1.57% 290,000 1.39% 343,000 1.34%
Large Metros Averages: 1.13% 1.24% 1.24%SJCOG San Joaquin 318,537 1.86% 87,251 1.62% 79,246 1.56%StanCOG Stanislaus 208,000 1.62% 58,800 1.42% 59,100 1.43%Merced CAG Merced 127,604 2.00% -- -- 20,732 1.26%FresnoCOG Fresno 341,960 1.47% 123,940 1.60% 81,911 0.95%Kings CAG Kings 77,018 2.01% 24,500 2.33% 20,118 1.58%KernCOG Kern 481,400 2.29% 162,590 2.55% 150,000 1.97%Tulare CAG Tulare 222,699 2.01% 64,591 1.82% 73,419 1.73%San Joaquin Valley Averages: 1.90% 1.89% 1.50%Shasta RTA Shasta 37,141 0.84% 18,928 1.08% 20,914 1.33%BCAG Butte 93,930 1.69% 40,159 1.66% 35,189 1.97%TMPO Tahoe Basin 5,892 0.43% 4,160 0.35% 1,199 0.21%AMBAG Monterey Bay 152,292 0.83% 41,851 0.64% 64,400 0.84%SLOCOG San Luis Obispo 45,726 0.68% 21,411 0.73% 24,900 1.04%SBCAG Santa Barbara 83,682 0.79% 18,923 0.50% 49,000 1.02%
Small MPOs Averages: 0.88% 0.83% 1.07%
Population Housing Units Employment
MPO Region
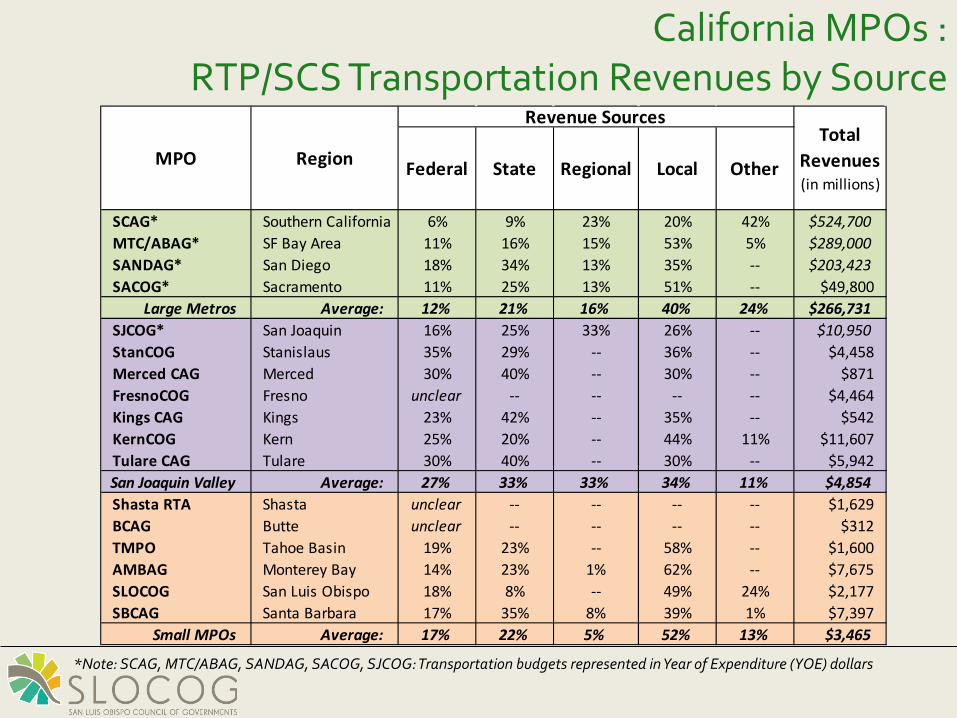
California MPOs : RTP/SCS Transportation Revenues by Source
*Note: SCAG, MTC/ABAG, SANDAG, SACOG, SJCOG: Transportation budgets represented in Year of Expenditure (YOE) dollars
Federal State Regional Local Other
SCAG* Southern California 6% 9% 23% 20% 42% $524,700MTC/ABAG* SF Bay Area 11% 16% 15% 53% 5% $289,000SANDAG* San Diego 18% 34% 13% 35% -- $203,423SACOG* Sacramento 11% 25% 13% 51% -- $49,800
Large Metros Average: 12% 21% 16% 40% 24% $266,731SJCOG* San Joaquin 16% 25% 33% 26% -- $10,950StanCOG Stanislaus 35% 29% -- 36% -- $4,458Merced CAG Merced 30% 40% -- 30% -- $871FresnoCOG Fresno unclear -- -- -- -- $4,464Kings CAG Kings 23% 42% -- 35% -- $542KernCOG Kern 25% 20% -- 44% 11% $11,607Tulare CAG Tulare 30% 40% -- 30% -- $5,942San Joaquin Valley Average: 27% 33% 33% 34% 11% $4,854Shasta RTA Shasta unclear -- -- -- -- $1,629BCAG Butte unclear -- -- -- -- $312TMPO Tahoe Basin 19% 23% -- 58% -- $1,600AMBAG Monterey Bay 14% 23% 1% 62% -- $7,675SLOCOG San Luis Obispo 18% 8% -- 49% 24% $2,177SBCAG Santa Barbara 17% 35% 8% 39% 1% $7,397
Small MPOs Average: 17% 22% 5% 52% 13% $3,465
Total Revenues(in millions)
Revenue Sources
MPO Region
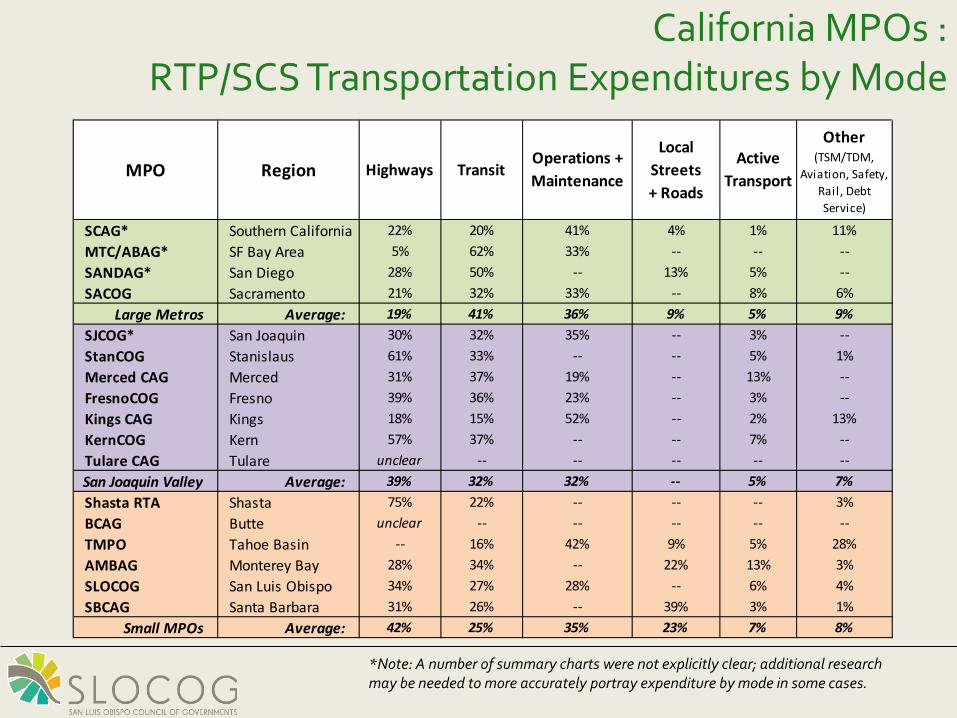
California MPOs : RTP/SCS Transportation Expenditures by Mode
SCAG* Southern California 22% 20% 41% 4% 1% 11%MTC/ABAG* SF Bay Area 5% 62% 33% -- -- --SANDAG* San Diego 28% 50% -- 13% 5% --SACOG Sacramento 21% 32% 33% -- 8% 6%
Large Metros Average: 19% 41% 36% 9% 5% 9%SJCOG* San Joaquin 30% 32% 35% -- 3% --StanCOG Stanislaus 61% 33% -- -- 5% 1%Merced CAG Merced 31% 37% 19% -- 13% --FresnoCOG Fresno 39% 36% 23% -- 3% --Kings CAG Kings 18% 15% 52% -- 2% 13%KernCOG Kern 57% 37% -- -- 7% --Tulare CAG Tulare unclear -- -- -- -- --San Joaquin Valley Average: 39% 32% 32% -- 5% 7%Shasta RTA Shasta 75% 22% -- -- -- 3%BCAG Butte unclear -- -- -- -- --TMPO Tahoe Basin -- 16% 42% 9% 5% 28%AMBAG Monterey Bay 28% 34% -- 22% 13% 3%SLOCOG San Luis Obispo 34% 27% 28% -- 6% 4%SBCAG Santa Barbara 31% 26% -- 39% 3% 1%
Small MPOs Average: 42% 25% 35% 23% 7% 8%
MPO RegionActive
Transport
Other(TSM/TDM,
Aviation, Safety, Rail, Debt Service)
Highways TransitOperations + Maintenance
Local Streets + Roads
*Note: A number of summary charts were not explicitly clear; additional research may be needed to more accurately portray expenditure by mode in some cases.
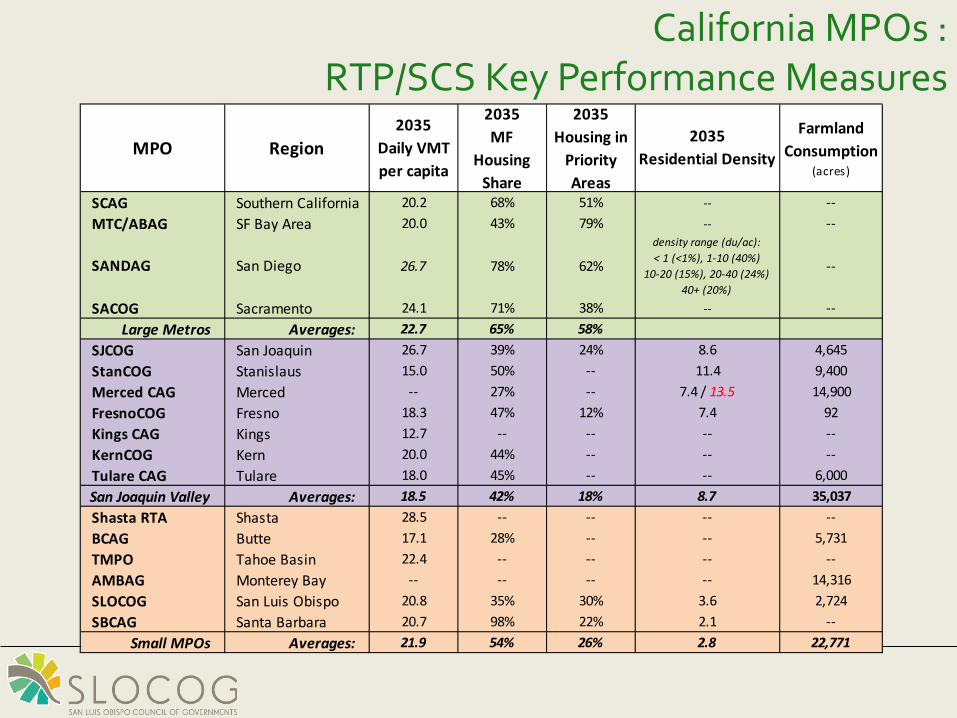
California MPOs : RTP/SCS Key Performance Measures
SCAG Southern California 20.2 68% 51% -- --MTC/ABAG SF Bay Area 20.0 43% 79% -- --
SANDAG San Diego 26.7 78% 62%
density range (du/ac):< 1 (<1%), 1-10 (40%)
10-20 (15%), 20-40 (24%)40+ (20%)
--
SACOG Sacramento 24.1 71% 38% -- --Large Metros Averages: 22.7 65% 58%
SJCOG San Joaquin 26.7 39% 24% 8.6 4,645StanCOG Stanislaus 15.0 50% -- 11.4 9,400Merced CAG Merced -- 27% -- 7.4 / 13.5 14,900FresnoCOG Fresno 18.3 47% 12% 7.4 92Kings CAG Kings 12.7 -- -- -- --KernCOG Kern 20.0 44% -- -- --Tulare CAG Tulare 18.0 45% -- -- 6,000San Joaquin Valley Averages: 18.5 42% 18% 8.7 35,037Shasta RTA Shasta 28.5 -- -- -- --BCAG Butte 17.1 28% -- -- 5,731TMPO Tahoe Basin 22.4 -- -- -- --AMBAG Monterey Bay -- -- -- -- 14,316SLOCOG San Luis Obispo 20.8 35% 30% 3.6 2,724SBCAG Santa Barbara 20.7 98% 22% 2.1 --
Small MPOs Averages: 21.9 54% 26% 2.8 22,771
MPO Region2035
Daily VMT per capita
2035 MF
Housing Share
2035 Housing in
Priority Areas
2035 Residential Density
Farmland Consumption
(acres)
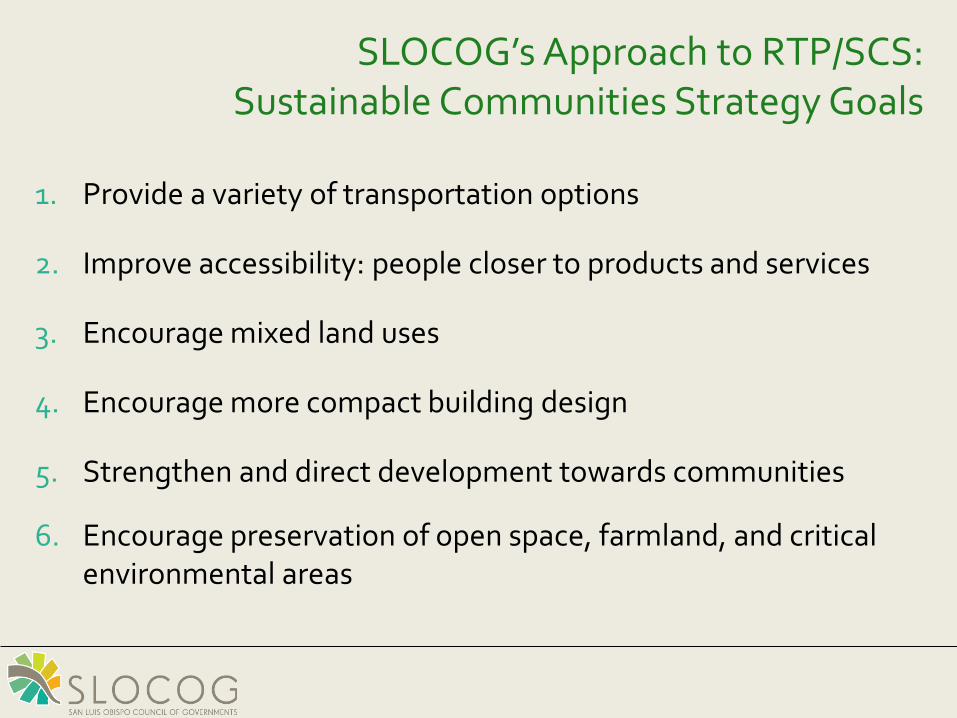
SLOCOG’s Approach to RTP/SCS: Sustainable Communities Strategy Goals
1. Provide a variety of transportation options
2. Improve accessibility: people closer to products and services
3. Encourage mixed land uses
4. Encourage more compact building design
5. Strengthen and direct development towards communities
6. Encourage preservation of open space, farmland, and critical environmental areas
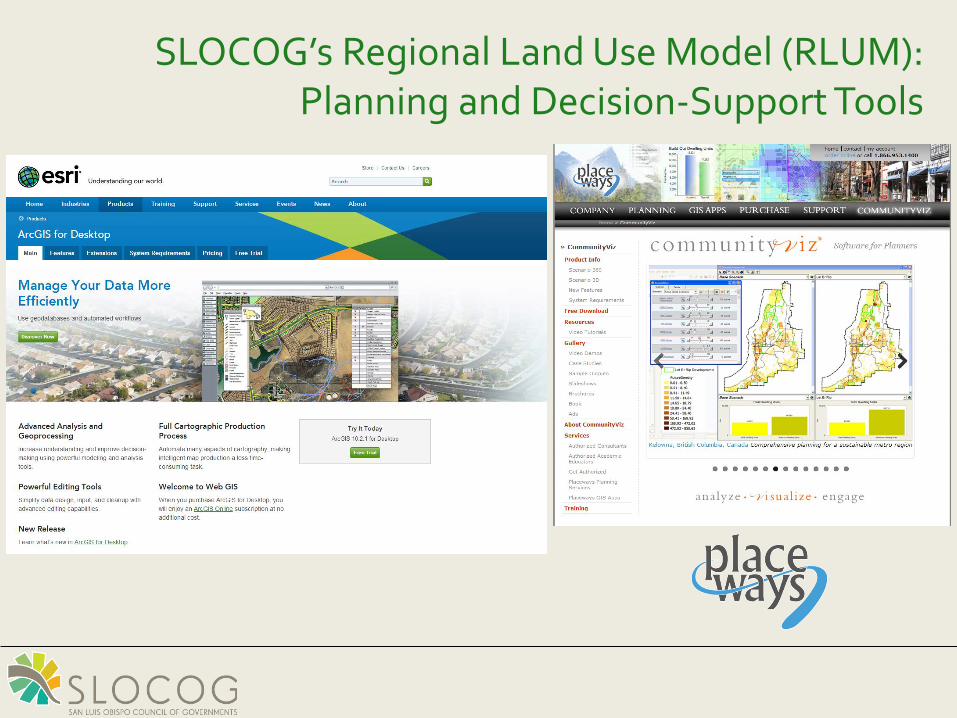
SLOCOG’s Regional Land Use Model (RLUM): Planning and Decision-Support Tools
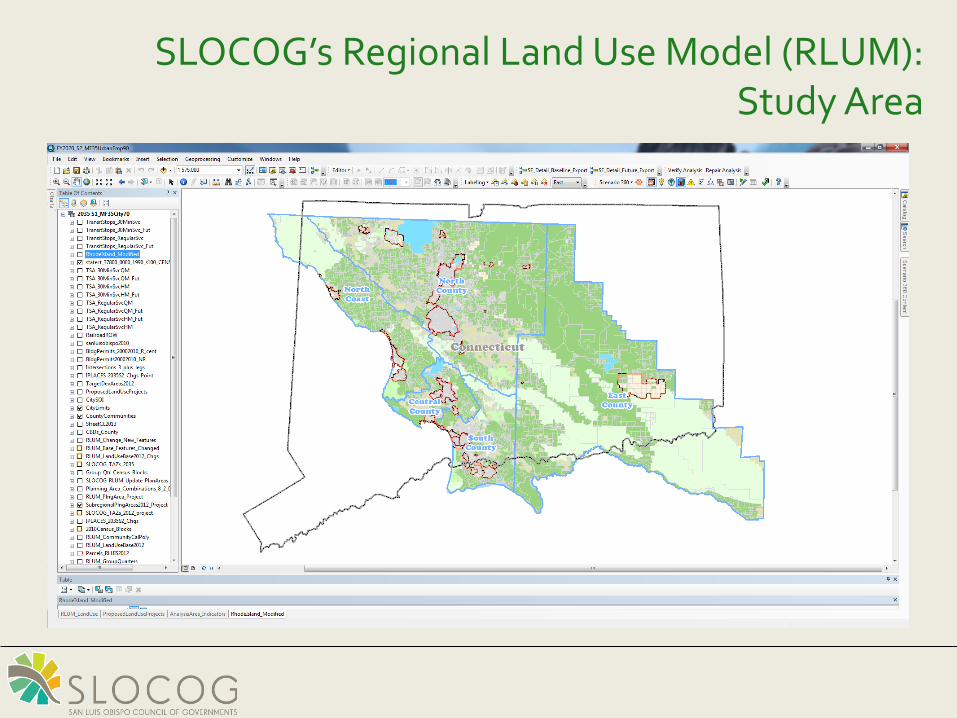
SLOCOG’s Regional Land Use Model (RLUM): Study Area
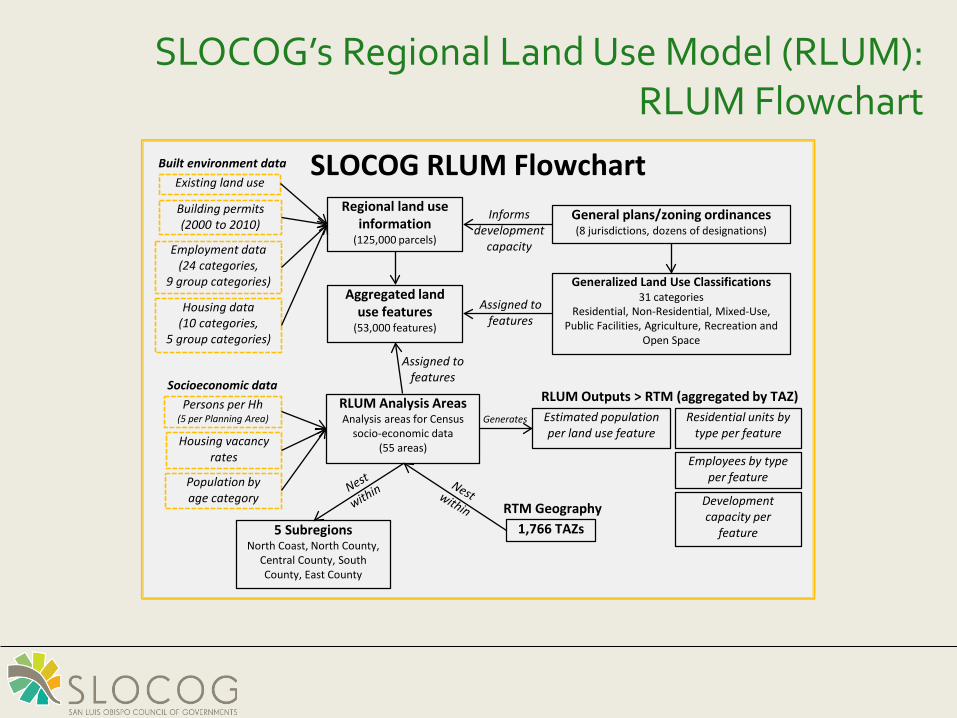
SLOCOG’s Regional Land Use Model (RLUM): RLUM Flowchart
SLOCOG RLUM FlowchartGeneral plans/zoning ordinances (8 jurisdictions, dozens of designations)
Generalized Land Use Classifications 31 categories
Residential, Non-Residential, Mixed-Use, Public Facilities, Agriculture, Recreation and
Open Space
Informs development
capacity
Assigned to features
Assigned tofeatures
Regional land use information
(125,000 parcels)
Aggregated land use features
(53,000 features)
5 Subregions North Coast, North County,
Central County, South County, East County
1,766 TAZsRTM Geography
RLUM Analysis AreasAnalysis areas for Census
socio-economic data (55 areas)
Estimated population per land use feature
Generates
RLUM Outputs > RTM (aggregated by TAZ)Residential units by
type per feature
Employees by type per feature
Development capacity per
feature
Persons per Hh (5 per Planning Area)
Housing vacancy rates
Population by age category
Socioeconomic data
Building permits(2000 to 2010)
Existing land use
Employment data(24 categories,
9 group categories)
Housing data(10 categories,
5 group categories)
Built environment data
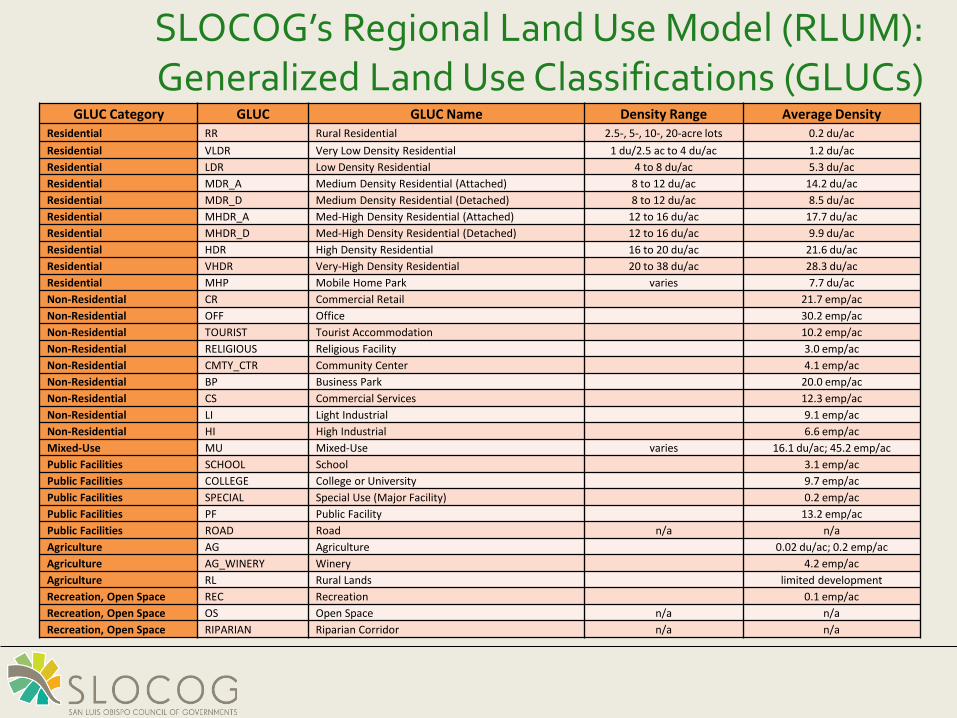
SLOCOG’s Regional Land Use Model (RLUM): Generalized Land Use Classifications (GLUCs)
GLUC Category GLUC GLUC Name Density Range Average DensityResidential RR Rural Residential 2.5-, 5-, 10-, 20-acre lots 0.2 du/acResidential VLDR Very Low Density Residential 1 du/2.5 ac to 4 du/ac 1.2 du/acResidential LDR Low Density Residential 4 to 8 du/ac 5.3 du/acResidential MDR_A Medium Density Residential (Attached) 8 to 12 du/ac 14.2 du/acResidential MDR_D Medium Density Residential (Detached) 8 to 12 du/ac 8.5 du/acResidential MHDR_A Med-High Density Residential (Attached) 12 to 16 du/ac 17.7 du/acResidential MHDR_D Med-High Density Residential (Detached) 12 to 16 du/ac 9.9 du/acResidential HDR High Density Residential 16 to 20 du/ac 21.6 du/acResidential VHDR Very-High Density Residential 20 to 38 du/ac 28.3 du/acResidential MHP Mobile Home Park varies 7.7 du/acNon-Residential CR Commercial Retail 21.7 emp/acNon-Residential OFF Office 30.2 emp/acNon-Residential TOURIST Tourist Accommodation 10.2 emp/acNon-Residential RELIGIOUS Religious Facility 3.0 emp/acNon-Residential CMTY_CTR Community Center 4.1 emp/acNon-Residential BP Business Park 20.0 emp/acNon-Residential CS Commercial Services 12.3 emp/acNon-Residential LI Light Industrial 9.1 emp/acNon-Residential HI High Industrial 6.6 emp/acMixed-Use MU Mixed-Use varies 16.1 du/ac; 45.2 emp/acPublic Facilities SCHOOL School 3.1 emp/acPublic Facilities COLLEGE College or University 9.7 emp/acPublic Facilities SPECIAL Special Use (Major Facility) 0.2 emp/acPublic Facilities PF Public Facility 13.2 emp/acPublic Facilities ROAD Road n/a n/aAgriculture AG Agriculture 0.02 du/ac; 0.2 emp/acAgriculture AG_WINERY Winery 4.2 emp/acAgriculture RL Rural Lands limited developmentRecreation, Open Space REC Recreation 0.1 emp/acRecreation, Open Space OS Open Space n/a n/aRecreation, Open Space RIPARIAN Riparian Corridor n/a n/a
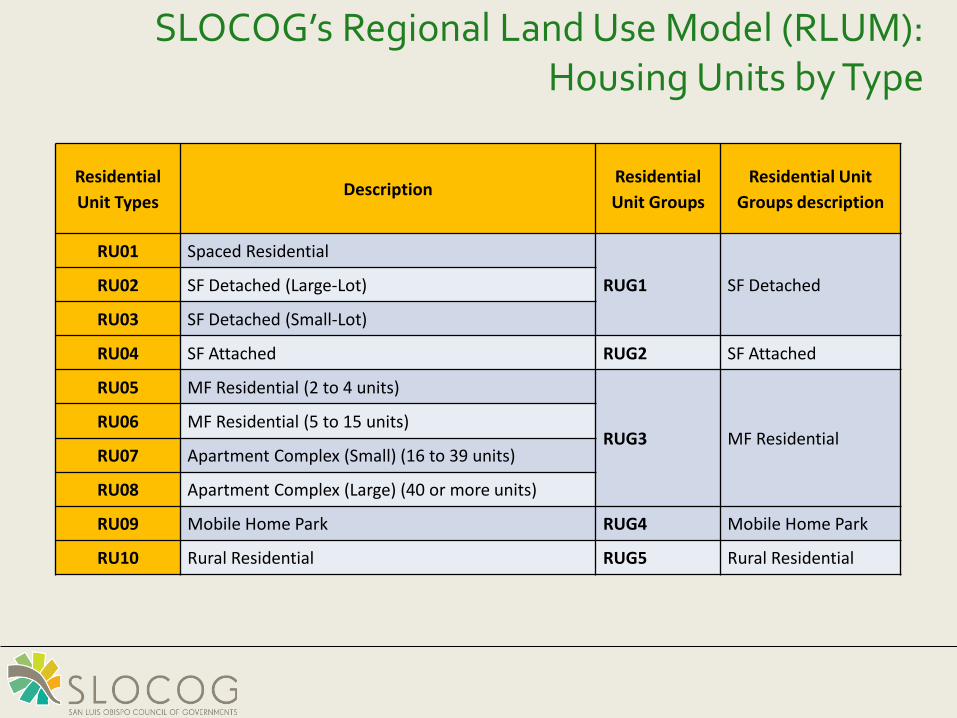
SLOCOG’s Regional Land Use Model (RLUM): Housing Units by Type
Residential Unit Types
DescriptionResidential Unit Groups
Residential Unit Groups description
RU01 Spaced Residential
RUG1 SF DetachedRU02 SF Detached (Large-Lot)
RU03 SF Detached (Small-Lot)
RU04 SF Attached RUG2 SF Attached
RU05 MF Residential (2 to 4 units)
RUG3 MF ResidentialRU06 MF Residential (5 to 15 units)
RU07 Apartment Complex (Small) (16 to 39 units)
RU08 Apartment Complex (Large) (40 or more units)
RU09 Mobile Home Park RUG4 Mobile Home Park
RU10 Rural Residential RUG5 Rural Residential
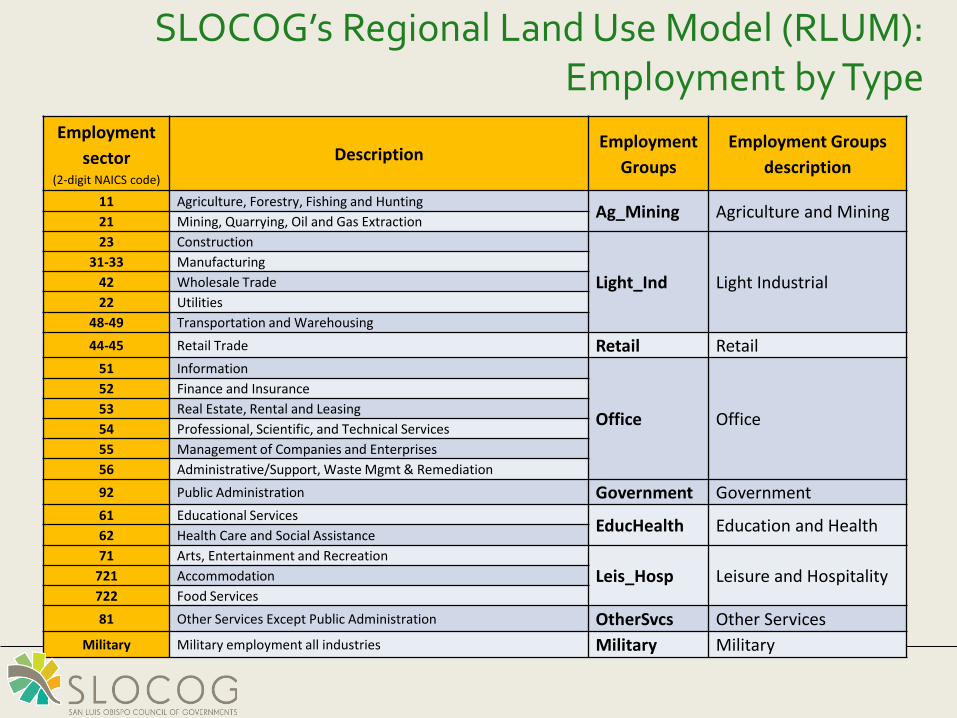
SLOCOG’s Regional Land Use Model (RLUM): Employment by Type
Employment sector
(2-digit NAICS code)
DescriptionEmployment
GroupsEmployment Groups
description
11 Agriculture, Forestry, Fishing and Hunting Ag_Mining Agriculture and Mining21 Mining, Quarrying, Oil and Gas Extraction23 Construction
Light_Ind Light Industrial31-33 Manufacturing
42 Wholesale Trade22 Utilities
48-49 Transportation and Warehousing44-45 Retail Trade Retail Retail
51 Information
Office Office
52 Finance and Insurance53 Real Estate, Rental and Leasing54 Professional, Scientific, and Technical Services55 Management of Companies and Enterprises56 Administrative/Support, Waste Mgmt & Remediation92 Public Administration Government Government61 Educational Services EducHealth Education and Health62 Health Care and Social Assistance71 Arts, Entertainment and Recreation
Leis_Hosp Leisure and Hospitality721 Accommodation722 Food Services81 Other Services Except Public Administration OtherSvcs Other Services
Military Military employment all industries Military Military
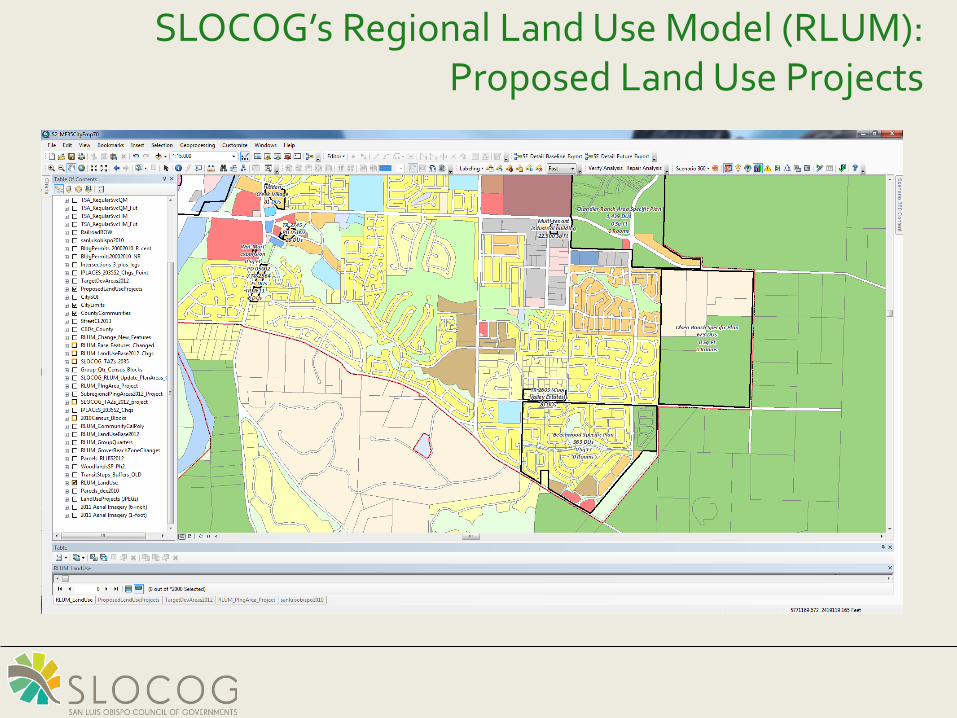
SLOCOG’s Regional Land Use Model (RLUM): Proposed Land Use Projects
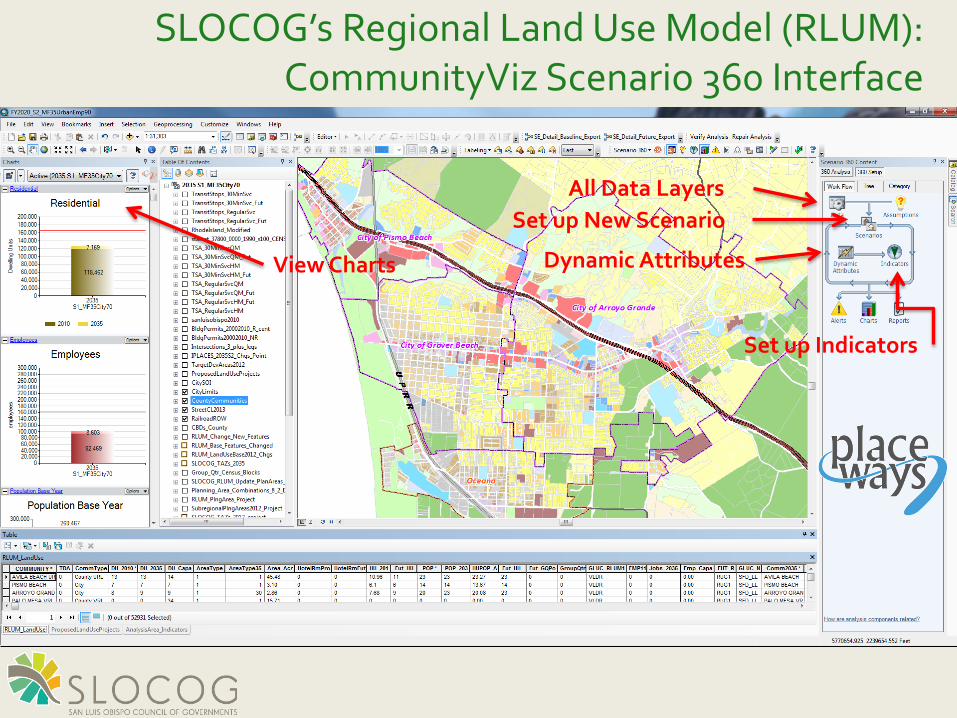
SLOCOG’s Regional Land Use Model (RLUM): CommunityViz Scenario 360 Interface
Set up Indicators
Dynamic Attributes
Set up New ScenarioAll Data Layers
View Charts
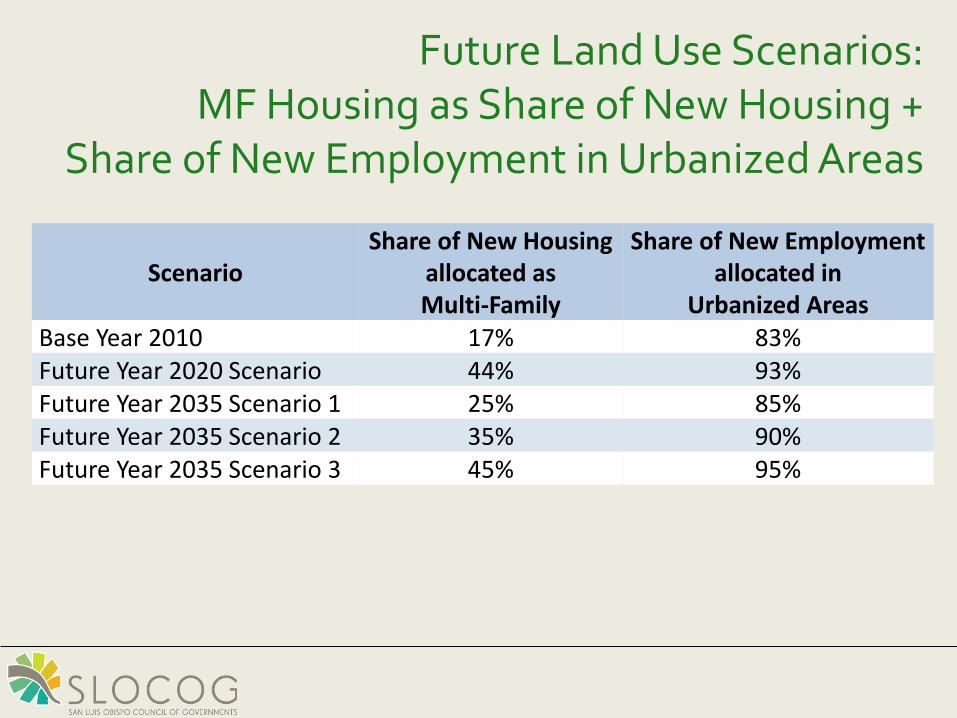
Future Land Use Scenarios:MF Housing as Share of New Housing +
Share of New Employment in Urbanized Areas
ScenarioShare of New Housing
allocated as Multi-Family
Share of New Employment allocated in
Urbanized AreasBase Year 2010 17% 83%Future Year 2020 Scenario 44% 93%Future Year 2035 Scenario 1 25% 85%Future Year 2035 Scenario 2 35% 90%Future Year 2035 Scenario 3 45% 95%
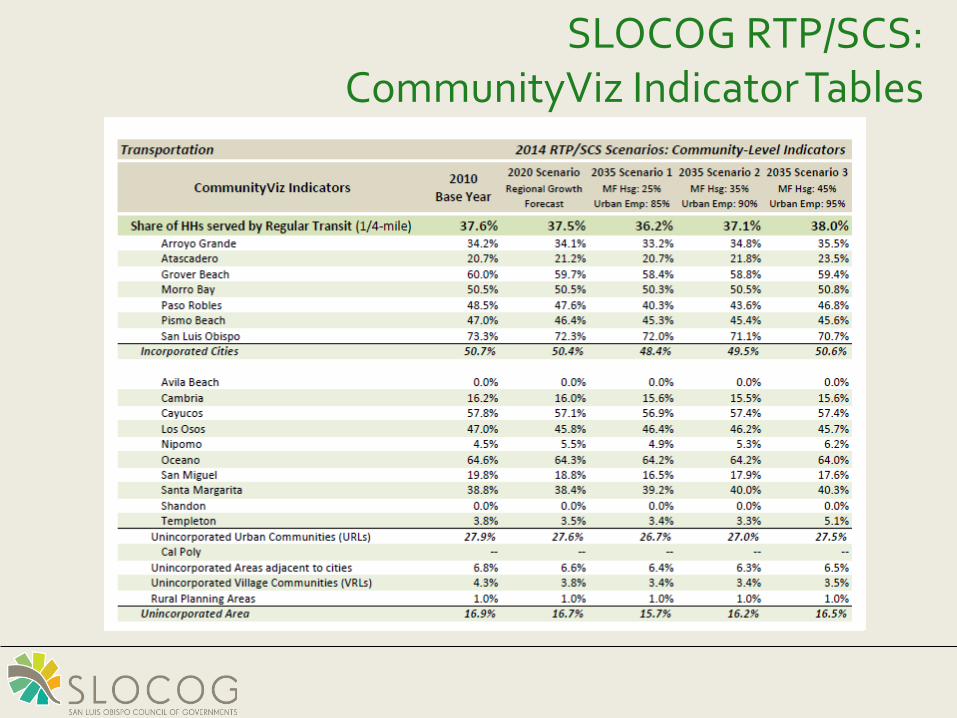
SLOCOG RTP/SCS:CommunityViz Indicator Tables
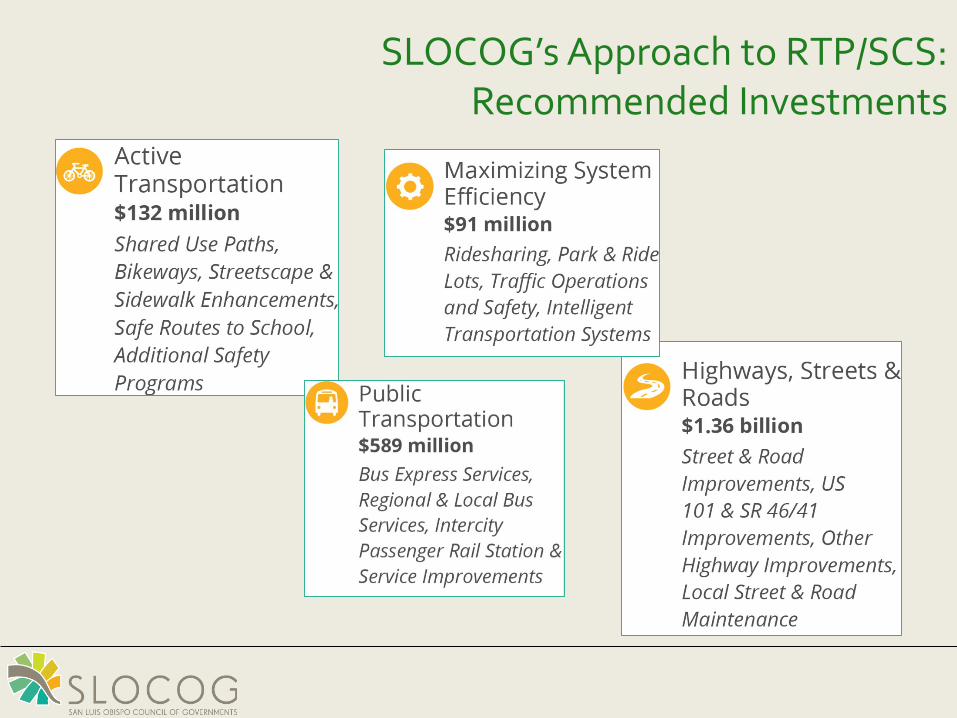
SLOCOG’s Approach to RTP/SCS: Recommended Investments
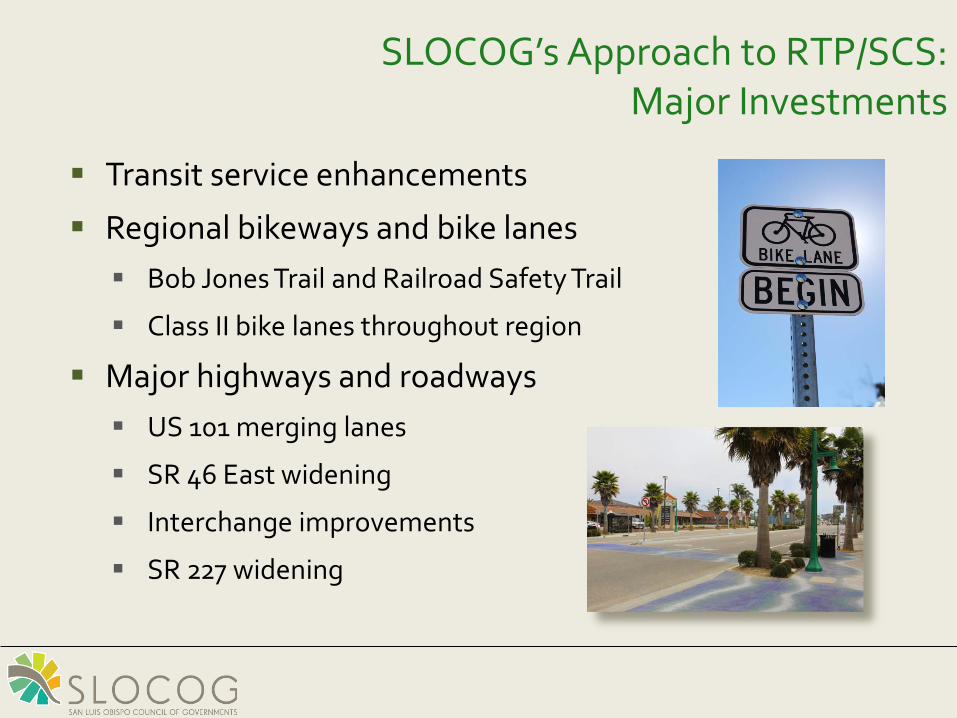
SLOCOG’s Approach to RTP/SCS: Major Investments
Transit service enhancements
Regional bikeways and bike lanes Bob Jones Trail and Railroad Safety Trail
Class II bike lanes throughout region
Major highways and roadways US 101 merging lanes
SR 46 East widening
Interchange improvements
SR 227 widening
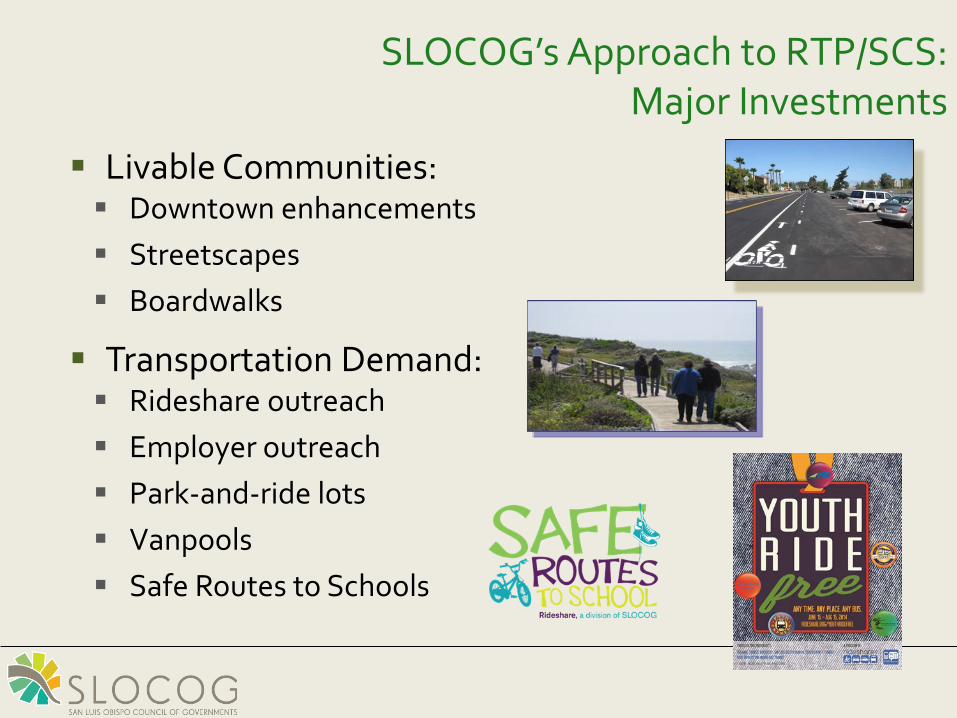
SLOCOG’s Approach to RTP/SCS: Major Investments
Livable Communities: Downtown enhancements Streetscapes Boardwalks
Transportation Demand: Rideshare outreach Employer outreach Park-and-ride lots Vanpools Safe Routes to Schools
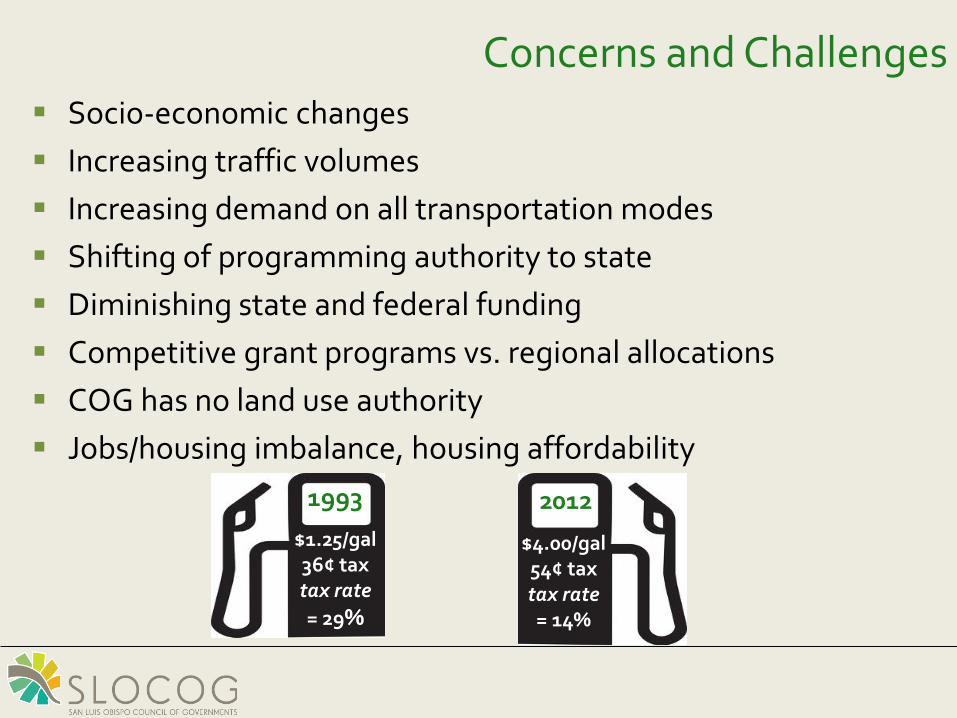
Concerns and Challenges Socio-economic changes Increasing traffic volumes Increasing demand on all transportation modes Shifting of programming authority to state Diminishing state and federal funding Competitive grant programs vs. regional allocations COG has no land use authority Jobs/housing imbalance, housing affordability
$1.25/gal36¢ taxtax rate = 29%
$4.00/gal54¢ taxtax rate = 14%
20121993
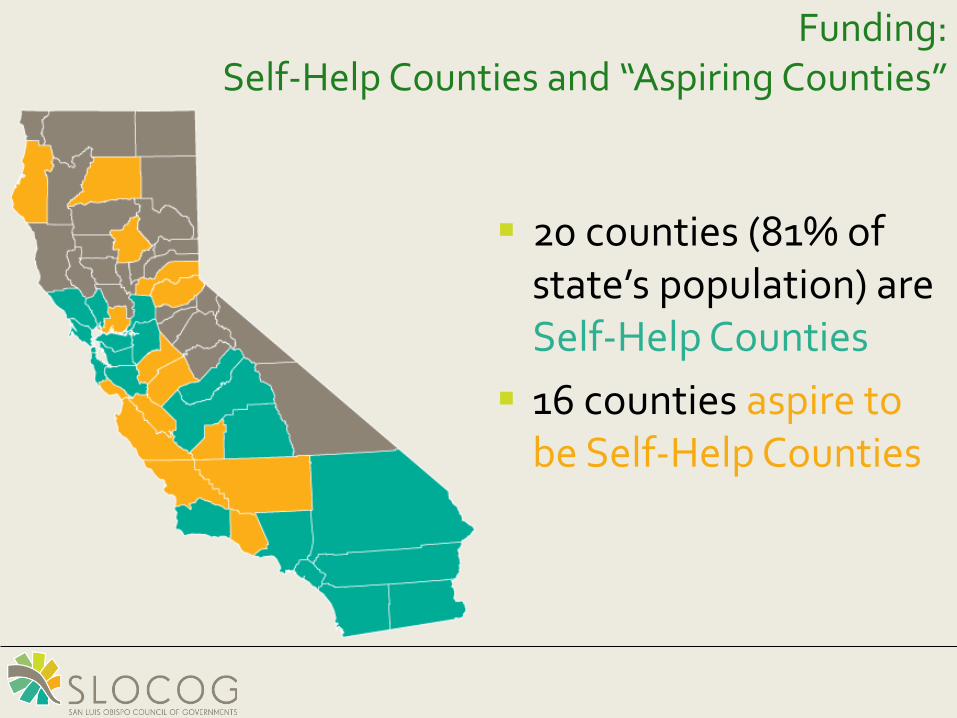
20 counties (81% of state’s population) are Self-Help Counties 16 counties aspire to
be Self-Help Counties
Funding: Self-Help Counties and “Aspiring Counties”
47
CONNECTING LAND USE AND TRANSPORTATION IN THE PORTLAND METROPOLITAN REGION
Regional Collaboration, Local Solutions
Kim Ellis, project managerOregon Metro MPO
September 15, 2015
48
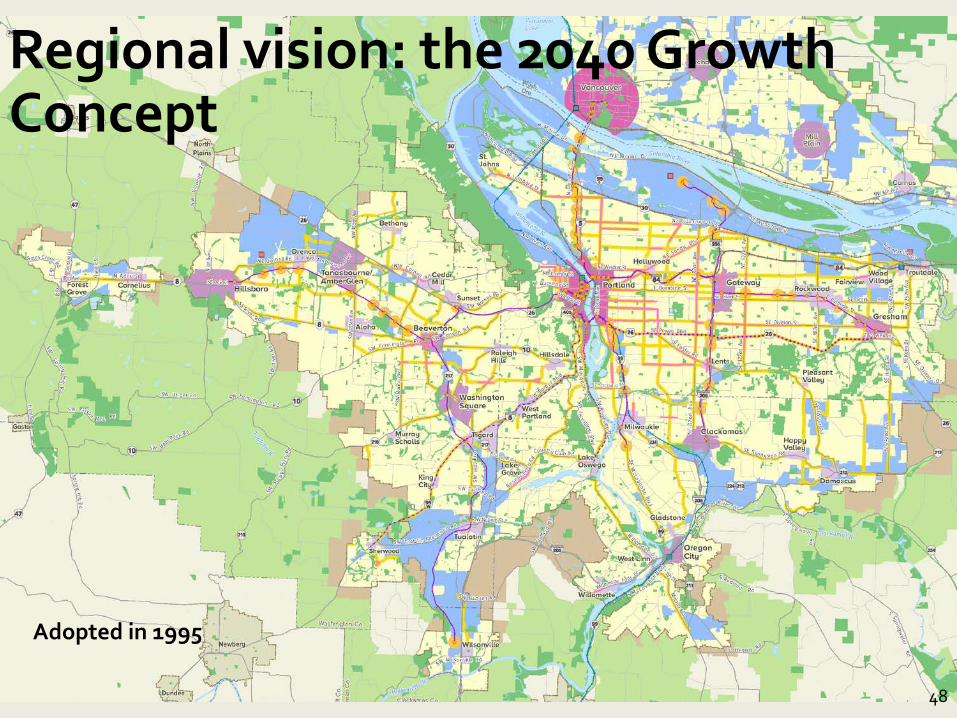
Regional vision: the 2040 Growth Concept
Adopted in 1995
49
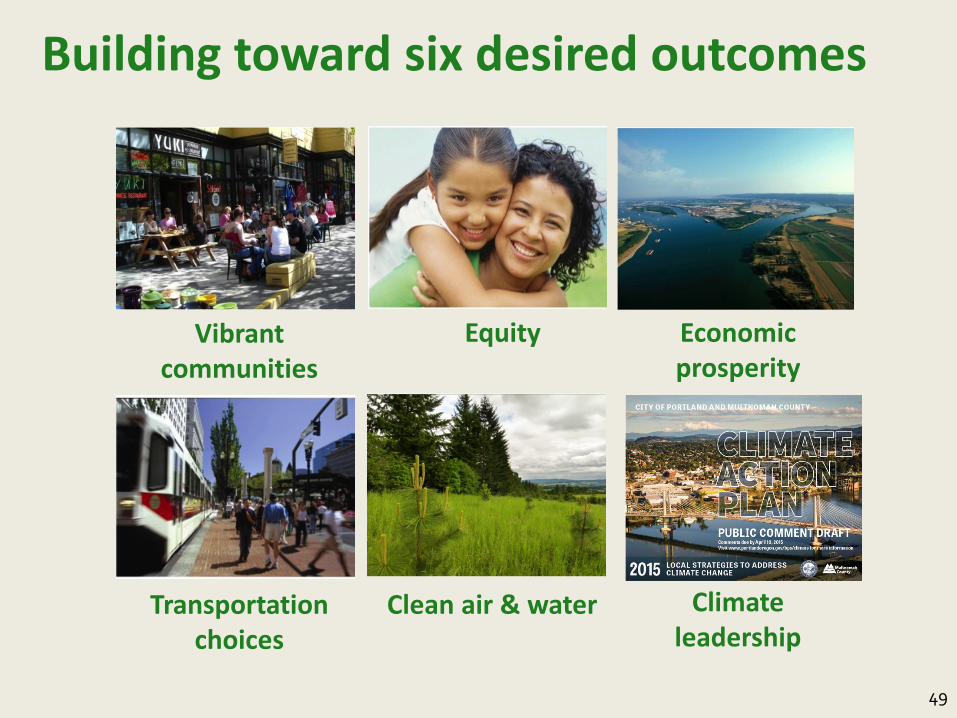
Building toward six desired outcomes
Equity
Clean air & waterTransportation choices
Vibrant communities
Economic prosperity
Climate leadership
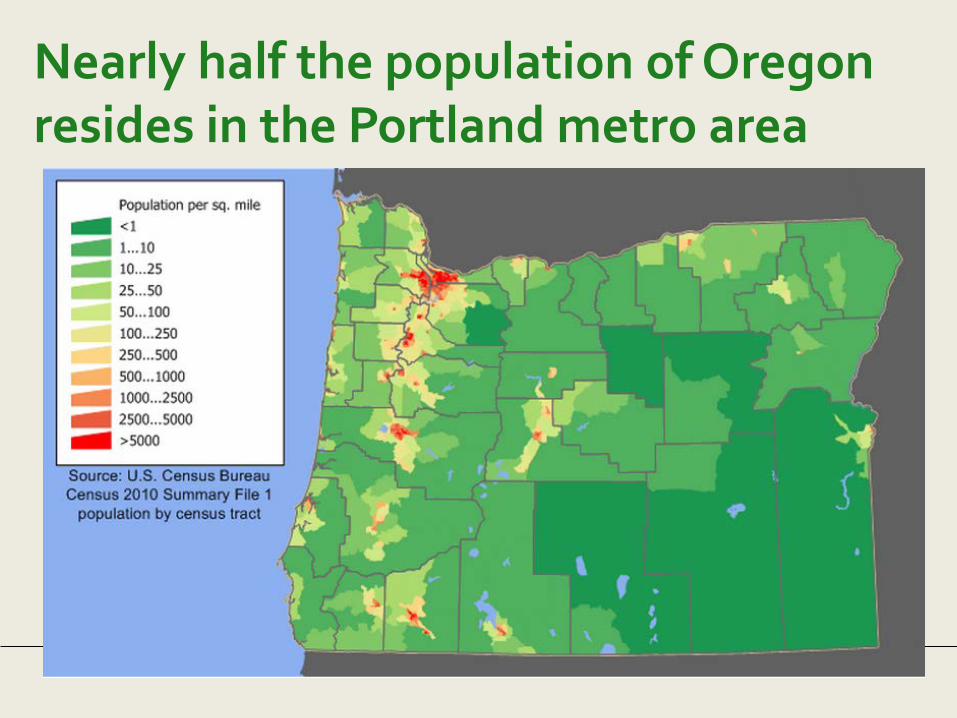
Nearly half the population of Oregon resides in the Portland metro area
51
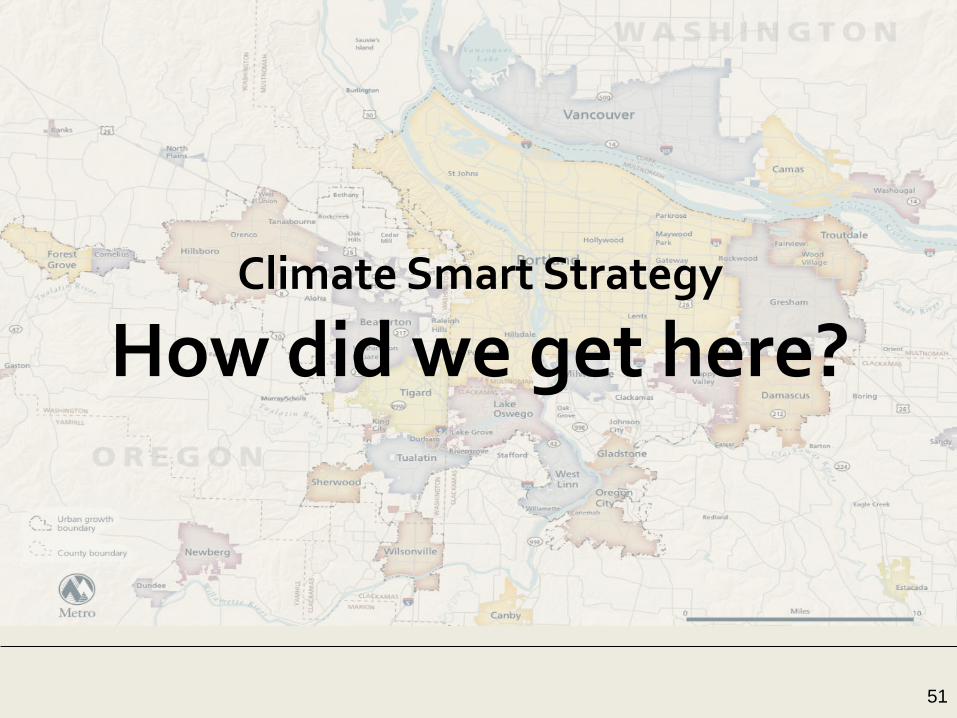
Climate Smart Strategy
How did we get here?
52
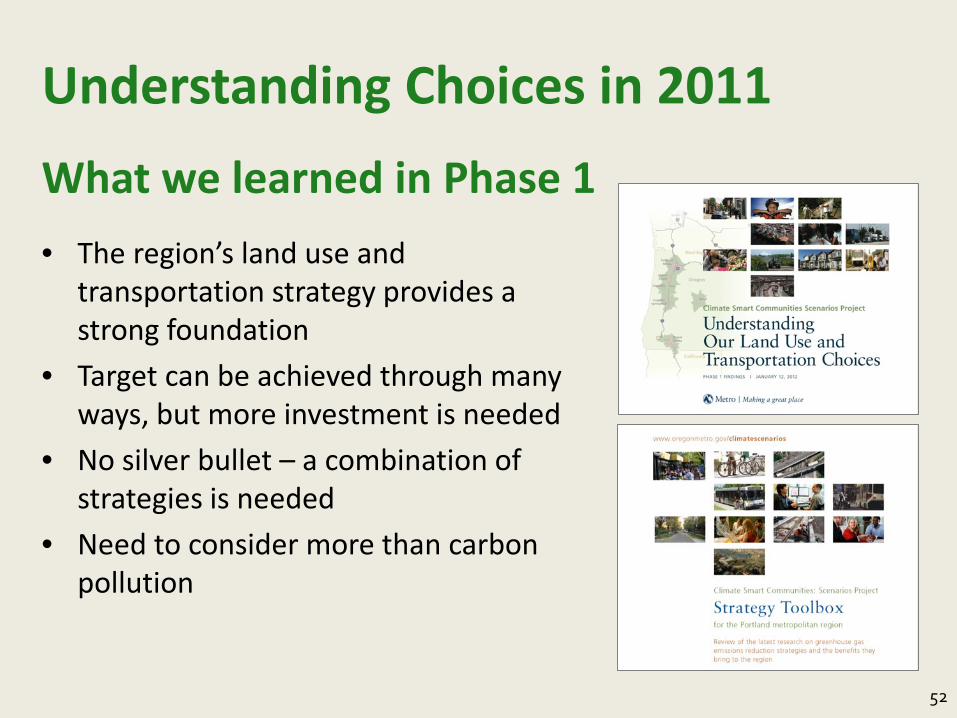
Understanding Choices in 2011What we learned in Phase 1• The region’s land use and
transportation strategy provides a strong foundation
• Target can be achieved through many ways, but more investment is needed
• No silver bullet – a combination of strategies is needed
• Need to consider more than carbon pollution
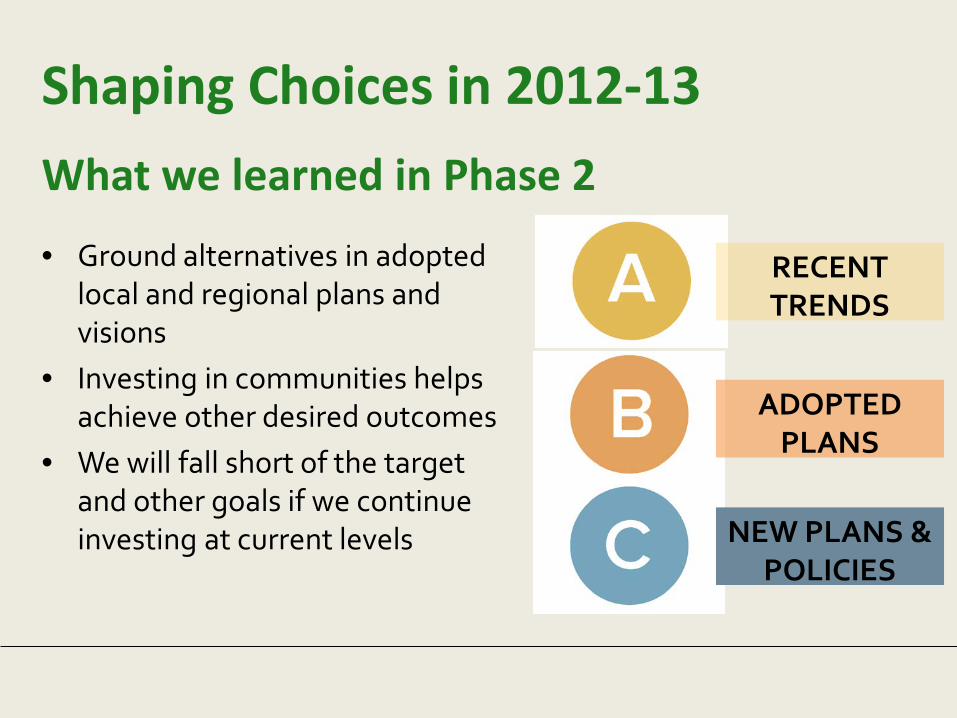
Shaping Choices in 2012-13What we learned in Phase 2
RECENT TRENDS
ADOPTED PLANS
NEW PLANS & POLICIES
• Ground alternatives in adopted local and regional plans and visions
• Investing in communities helps achieve other desired outcomes
• We will fall short of the target and other goals if we continue investing at current levels
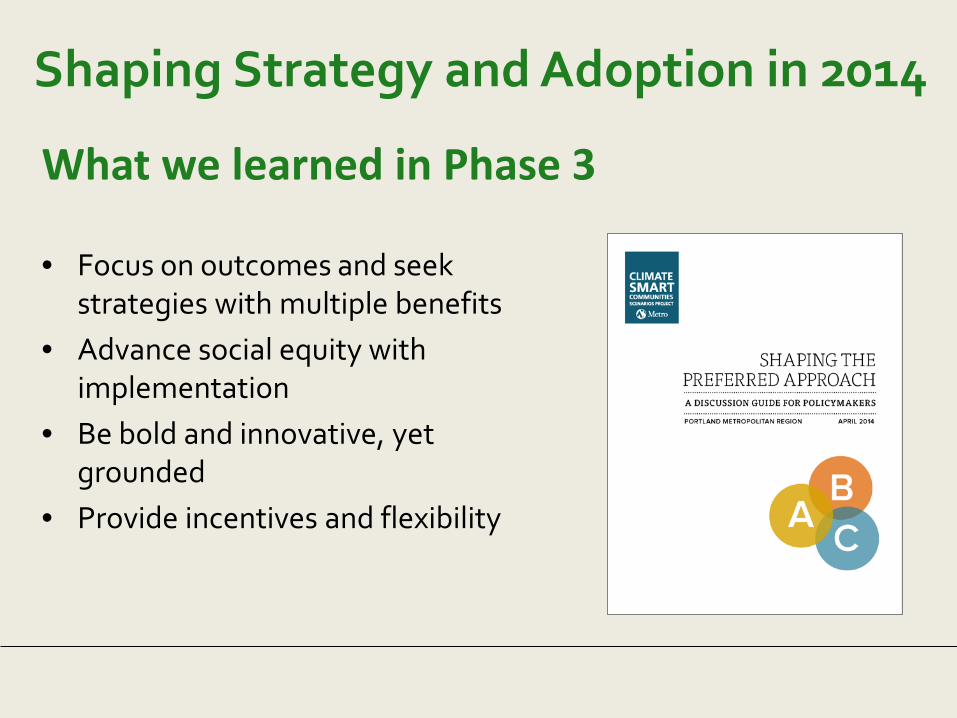
Shaping Strategy and Adoption in 2014
What we learned in Phase 3
• Focus on outcomes and seek strategies with multiple benefits
• Advance social equity with implementation
• Be bold and innovative, yet grounded
• Provide incentives and flexibility
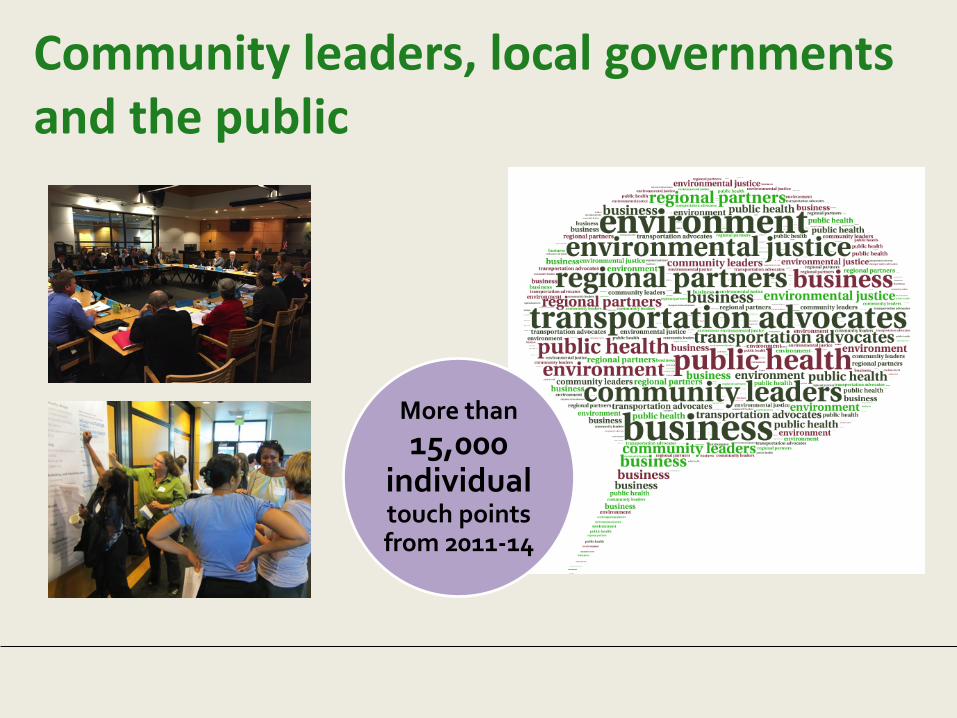
Community leaders, local governments and the public
More than 15,000
individual touch points from 2011-14
56
Climate Smart Strategy
What is included in the final strategy?
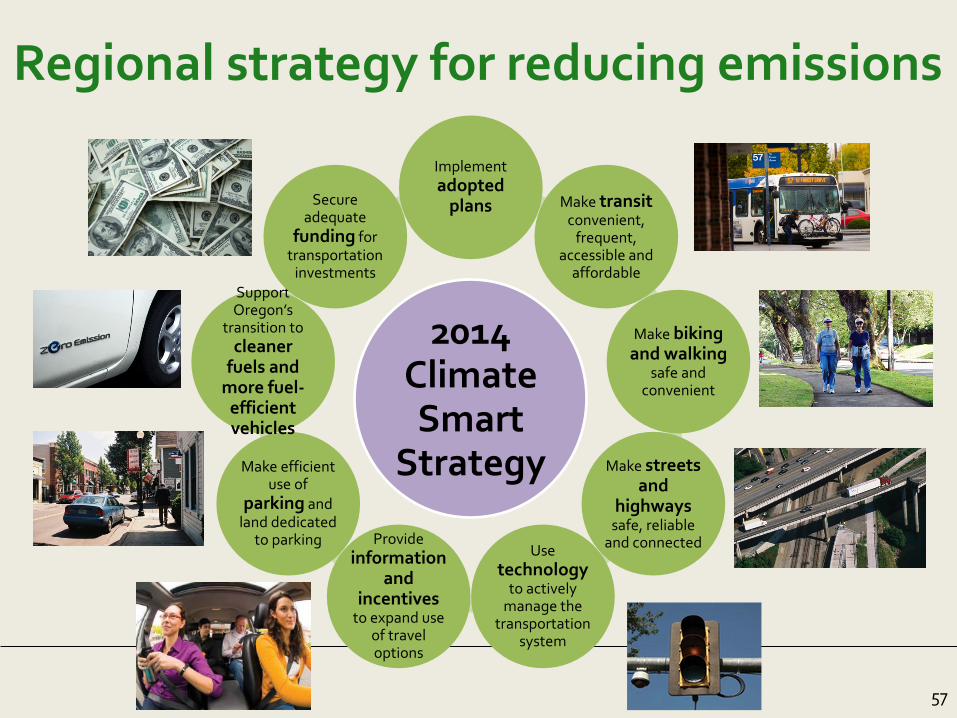
2014 Climate Smart
Strategy
Implement adopted
plans Make transitconvenient,
frequent, accessible and
affordable
Make biking and walking
safe and convenient
Make streets and
highways safe, reliable
and connectedUse technology
to actively manage the
transportation system
Provide information
and incentives
to expand use of travel options
Make efficient use of
parking and land dedicated
to parking
Support Oregon’s
transition to cleaner
fuels and more fuel-
efficient vehicles
Secure adequate
funding for transportation
investments
Regional strategy for reducing emissions
57
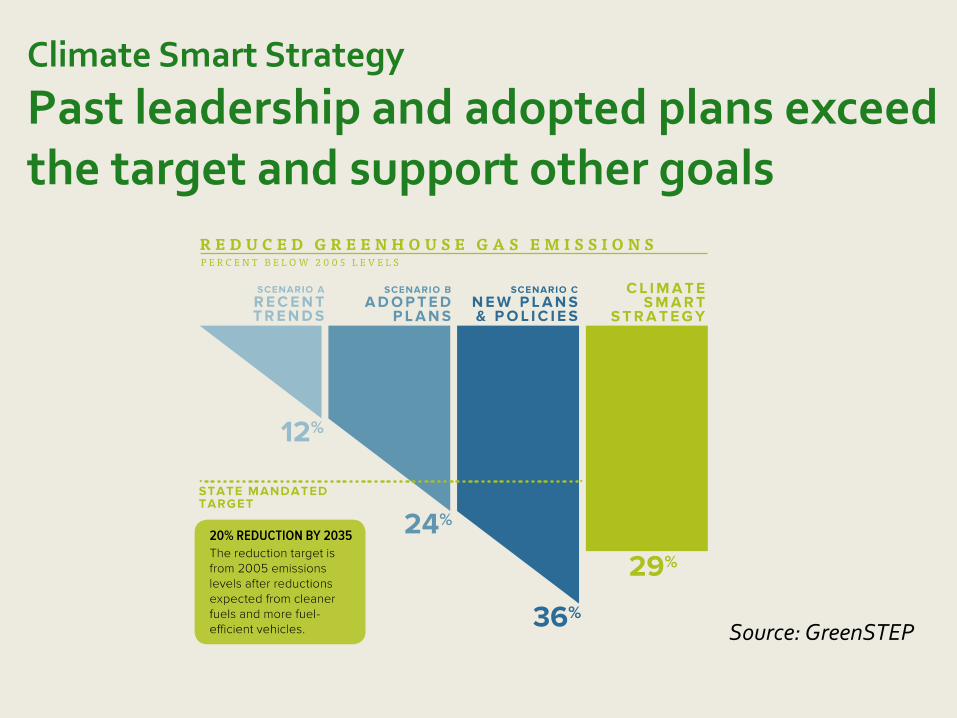
Source: GreenSTEP
Climate Smart Strategy
Past leadership and adopted plans exceed the target and support other goals
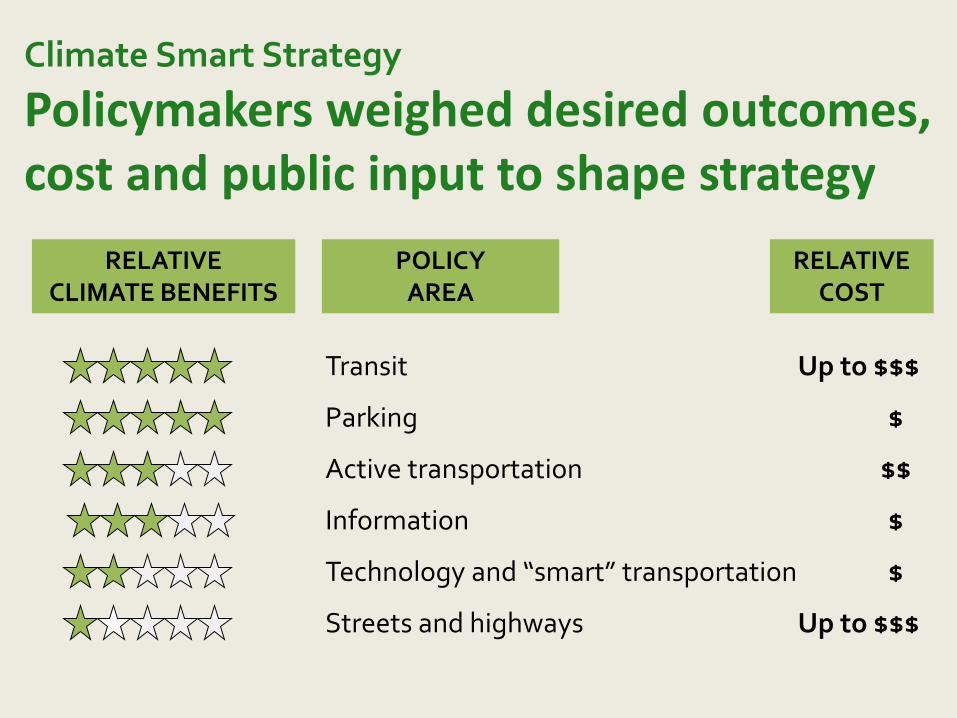
Climate Smart Strategy
Policymakers weighed desired outcomes, cost and public input to shape strategy
Transit
Technology and “smart” transportation
Active transportation
Streets and highways
Parking
Up to $$$
Up to $$$
$
$$
$
Information $
RELATIVE CLIMATE BENEFITS
RELATIVE COST
POLICY AREA
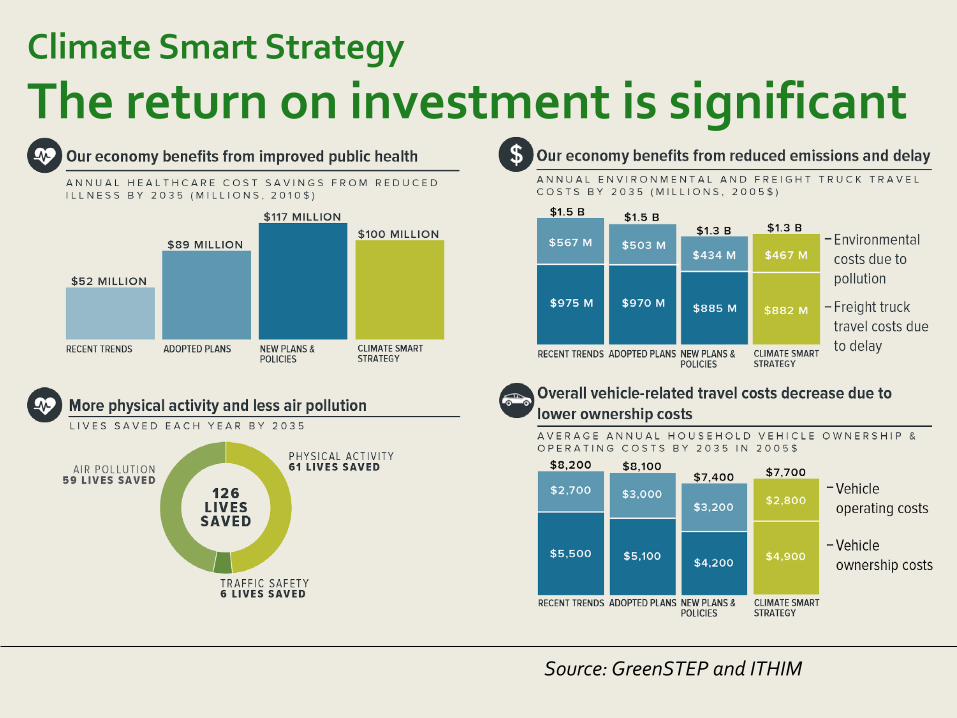
Climate Smart Strategy
The return on investment is significant
Source: GreenSTEP and ITHIM
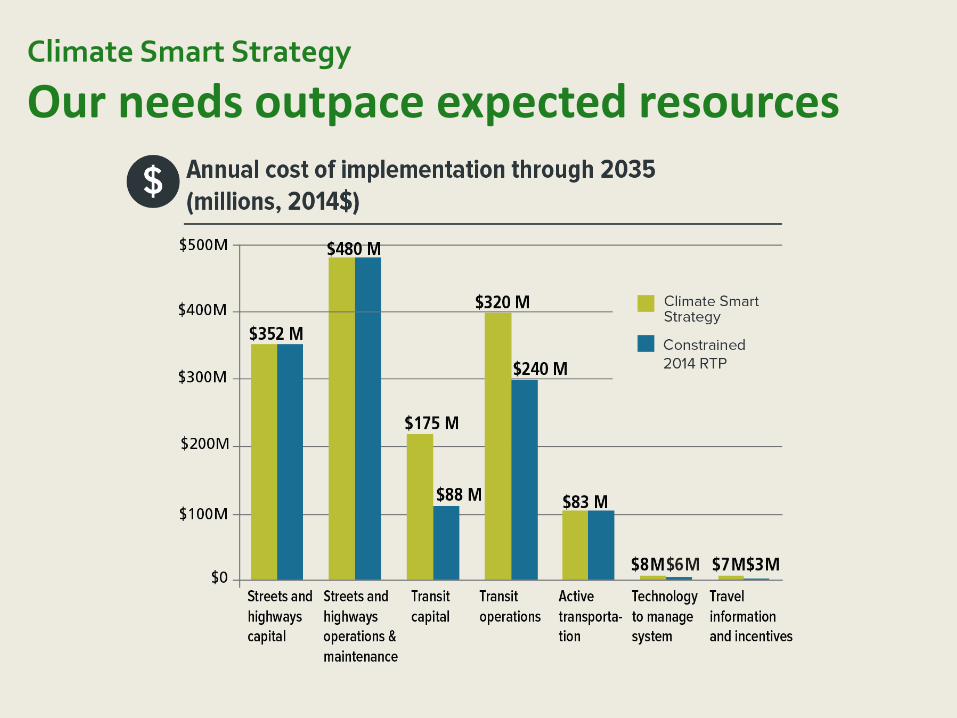
Climate Smart Strategy
Our needs outpace expected resources
62
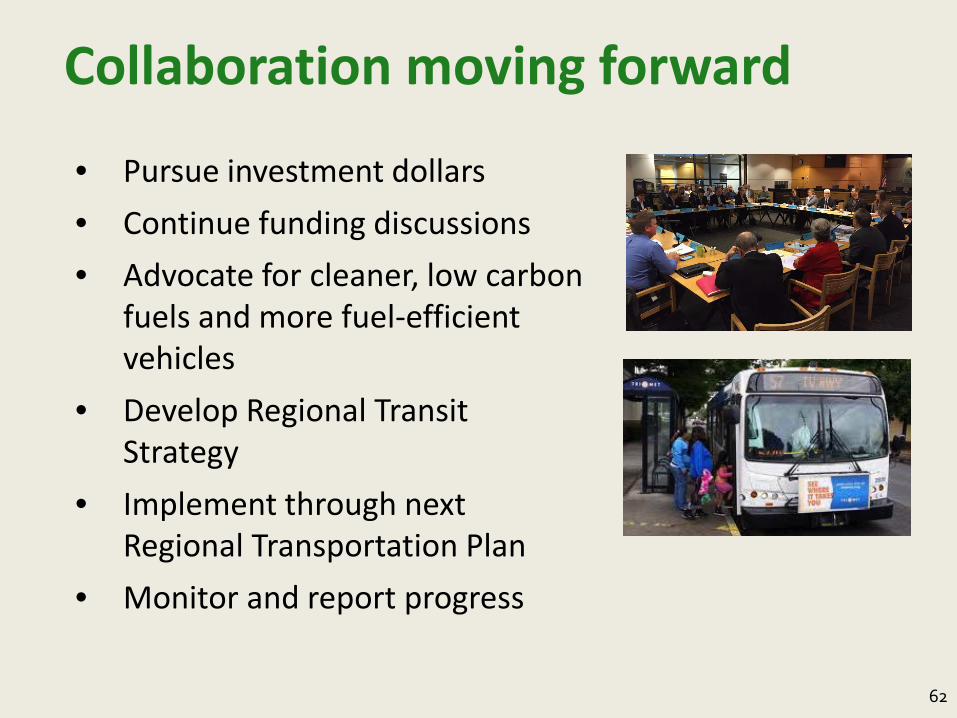
Collaboration moving forward
• Pursue investment dollars • Continue funding discussions• Advocate for cleaner, low carbon
fuels and more fuel-efficient vehicles
• Develop Regional Transit Strategy
• Implement through next Regional Transportation Plan
• Monitor and report progress
63
www.oregonmetro.gov/climatestrategy
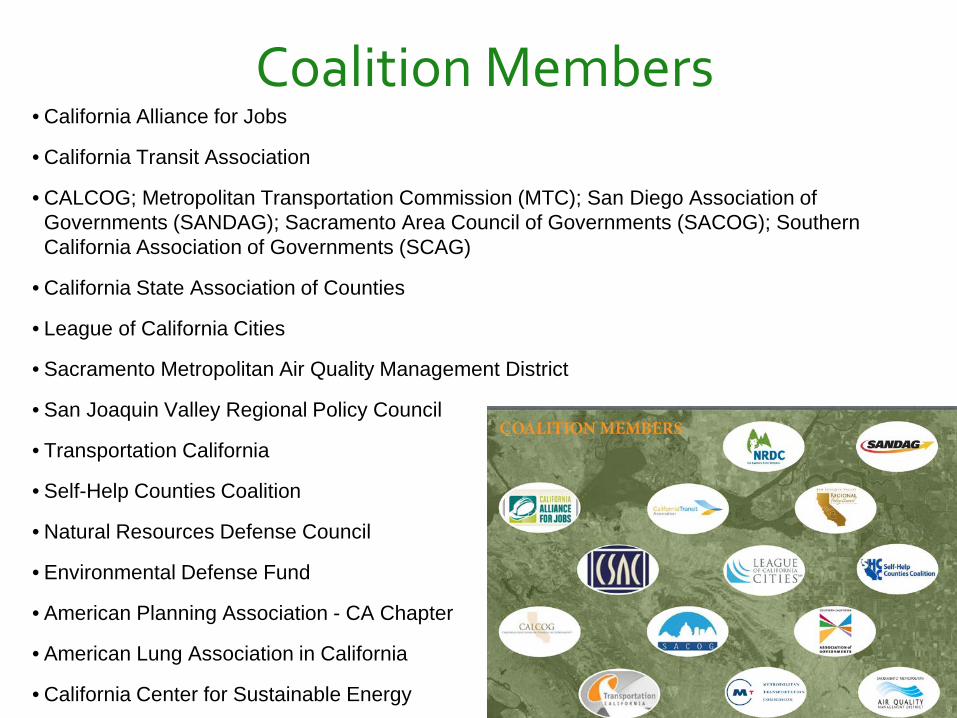
Coalition Members• California Alliance for Jobs
• California Transit Association
• CALCOG; Metropolitan Transportation Commission (MTC); San Diego Association of Governments (SANDAG); Sacramento Area Council of Governments (SACOG); Southern California Association of Governments (SCAG)
• California State Association of Counties
• League of California Cities
• Sacramento Metropolitan Air Quality Management District
• San Joaquin Valley Regional Policy Council
• Transportation California
• Self-Help Counties Coalition
• Natural Resources Defense Council
• Environmental Defense Fund
• American Planning Association - CA Chapter
• American Lung Association in California
• California Center for Sustainable Energy
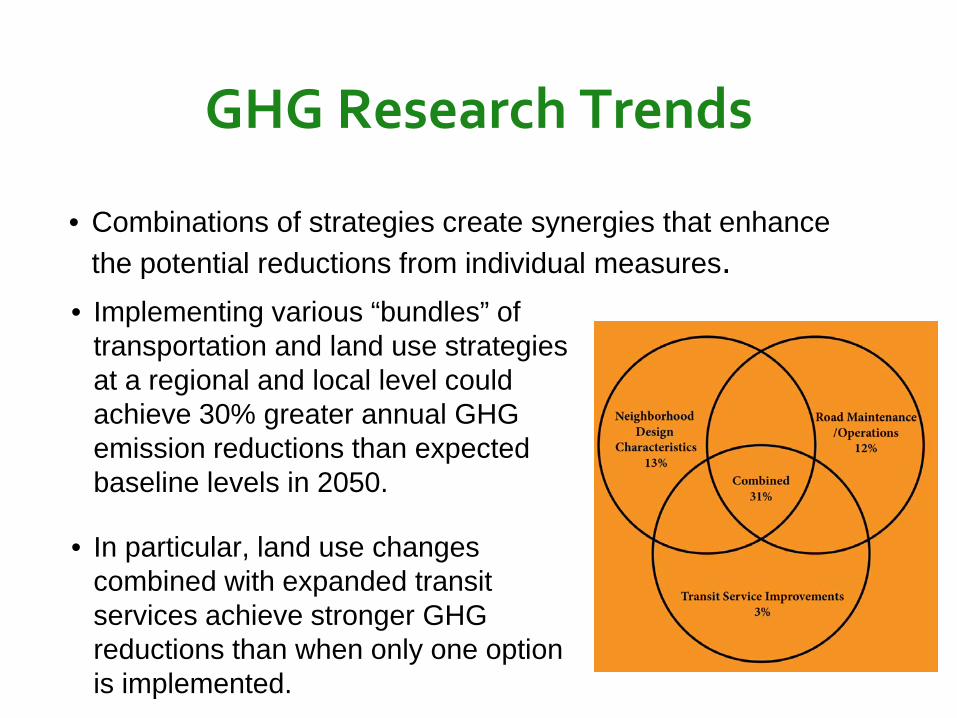
GHG Research Trends
• Implementing various “bundles” of transportation and land use strategies at a regional and local level could achieve 30% greater annual GHG emission reductions than expected baseline levels in 2050.
• In particular, land use changes combined with expanded transit services achieve stronger GHG reductions than when only one option is implemented.
• Combinations of strategies create synergies that enhance the potential reductions from individual measures.
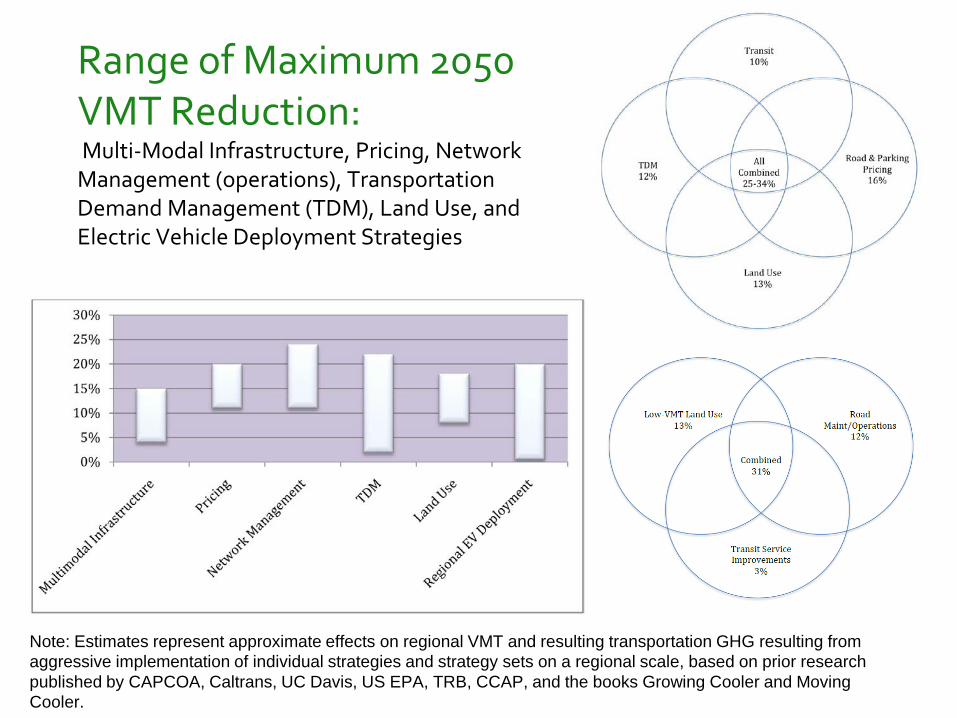
Note: Estimates represent approximate effects on regional VMT and resulting transportation GHG resulting from aggressive implementation of individual strategies and strategy sets on a regional scale, based on prior research published by CAPCOA, Caltrans, UC Davis, US EPA, TRB, CCAP, and the books Growing Cooler and Moving Cooler.
Range of Maximum 2050 VMT Reduction:Multi-Modal Infrastructure, Pricing, Network Management (operations), Transportation Demand Management (TDM), Land Use, and Electric Vehicle Deployment Strategies
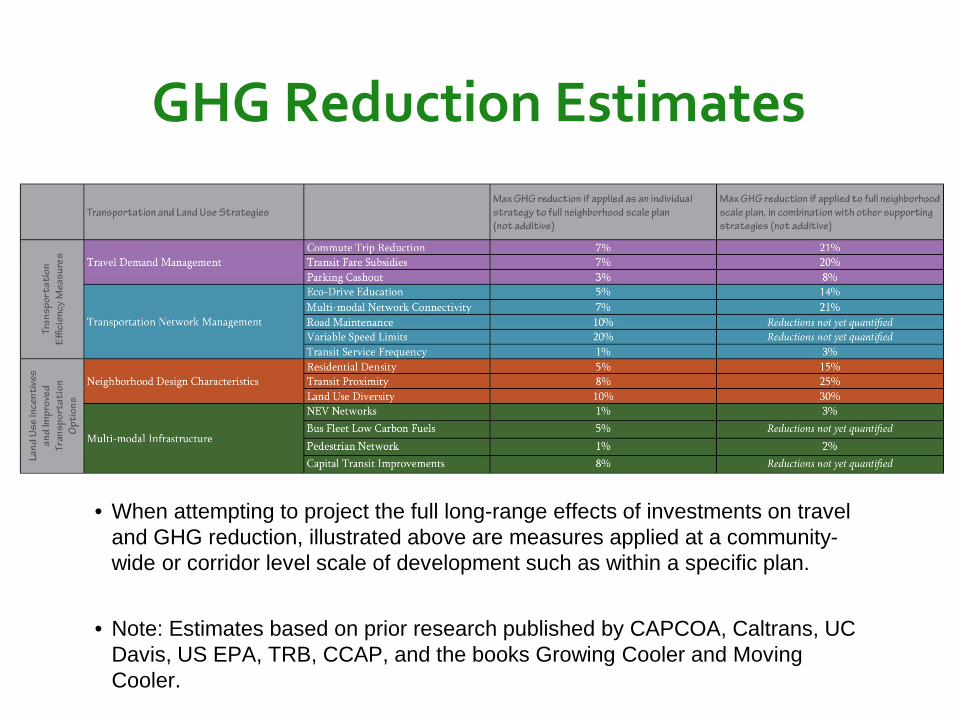
GHG Reduction Estimates
• When attempting to project the full long-range effects of investments on travel and GHG reduction, illustrated above are measures applied at a community-wide or corridor level scale of development such as within a specific plan.
• Note: Estimates based on prior research published by CAPCOA, Caltrans, UC Davis, US EPA, TRB, CCAP, and the books Growing Cooler and Moving Cooler.
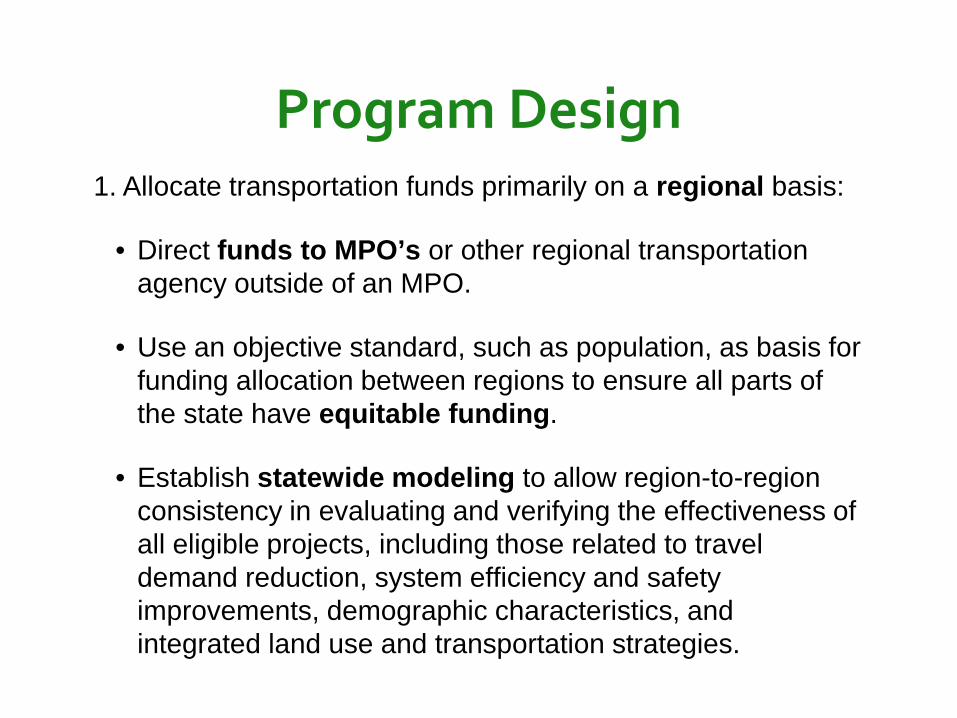
Program Design1. Allocate transportation funds primarily on a regional basis:
• Direct funds to MPO’s or other regional transportation agency outside of an MPO.
• Use an objective standard, such as population, as basis for funding allocation between regions to ensure all parts of the state have equitable funding.
• Establish statewide modeling to allow region-to-region consistency in evaluating and verifying the effectiveness of all eligible projects, including those related to travel demand reduction, system efficiency and safety improvements, demographic characteristics, and integrated land use and transportation strategies.
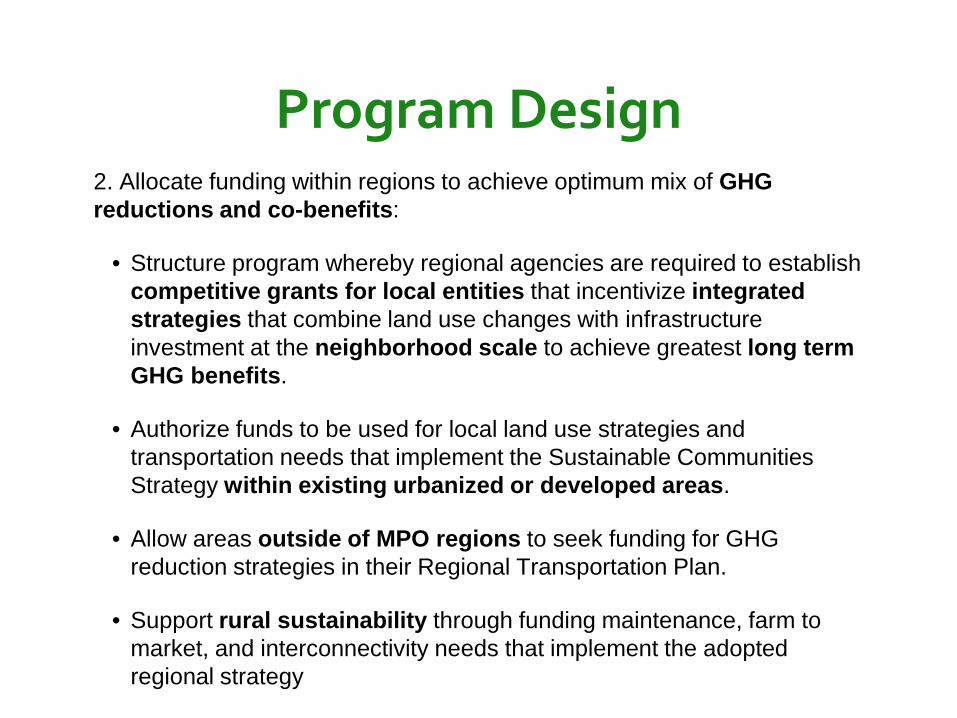
Program Design2. Allocate funding within regions to achieve optimum mix of GHG reductions and co-benefits:
• Structure program whereby regional agencies are required to establish competitive grants for local entities that incentivize integrated strategies that combine land use changes with infrastructure investment at the neighborhood scale to achieve greatest long term GHG benefits.
• Authorize funds to be used for local land use strategies and transportation needs that implement the Sustainable Communities Strategy within existing urbanized or developed areas.
• Allow areas outside of MPO regions to seek funding for GHG reduction strategies in their Regional Transportation Plan.
• Support rural sustainability through funding maintenance, farm to market, and interconnectivity needs that implement the adopted regional strategy
Program Design
3. Allocate funding to administer competitive grant program for intercity and interregional rail modernization, and roadway operational and maintenance improvements that implement or enhance GHG reduction strategies in statewide and regional transportation plans.
4. California Air Resources Board will establish minimum standards for the development of regional and interregional funding programs, including criteria for evaluating GHG impacts that ensure program compliance while retaining flexibility to meet transportation goals. CARB will periodically review each region’s effectiveness in meeting the standards to ensure legal compliance with AB 32 requirements.
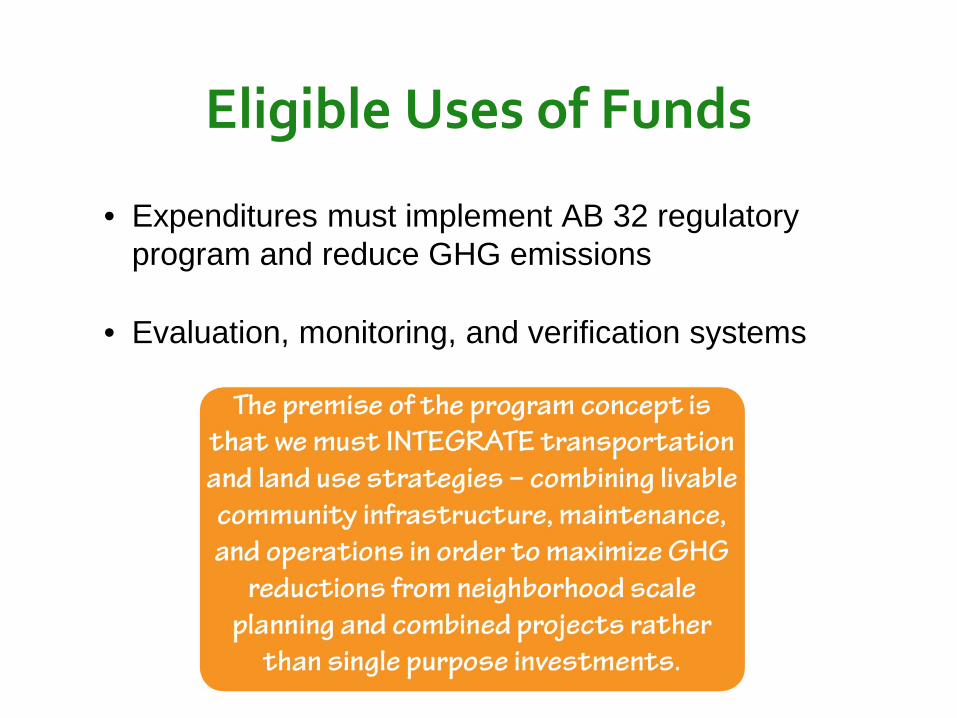
Eligible Uses of Funds
• Expenditures must implement AB 32 regulatory program and reduce GHG emissions
• Evaluation, monitoring, and verification systems
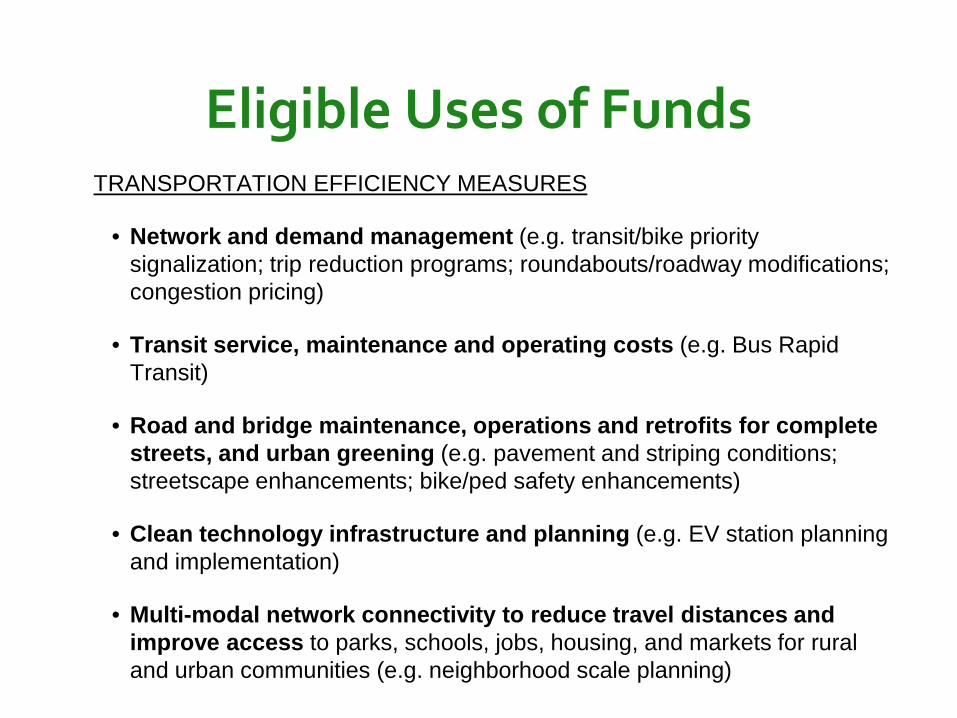
Eligible Uses of FundsTRANSPORTATION EFFICIENCY MEASURES
• Network and demand management (e.g. transit/bike priority signalization; trip reduction programs; roundabouts/roadway modifications; congestion pricing)
• Transit service, maintenance and operating costs (e.g. Bus Rapid Transit)
• Road and bridge maintenance, operations and retrofits for complete streets, and urban greening (e.g. pavement and striping conditions; streetscape enhancements; bike/ped safety enhancements)
• Clean technology infrastructure and planning (e.g. EV station planning and implementation)
• Multi-modal network connectivity to reduce travel distances and improve access to parks, schools, jobs, housing, and markets for rural and urban communities (e.g. neighborhood scale planning)
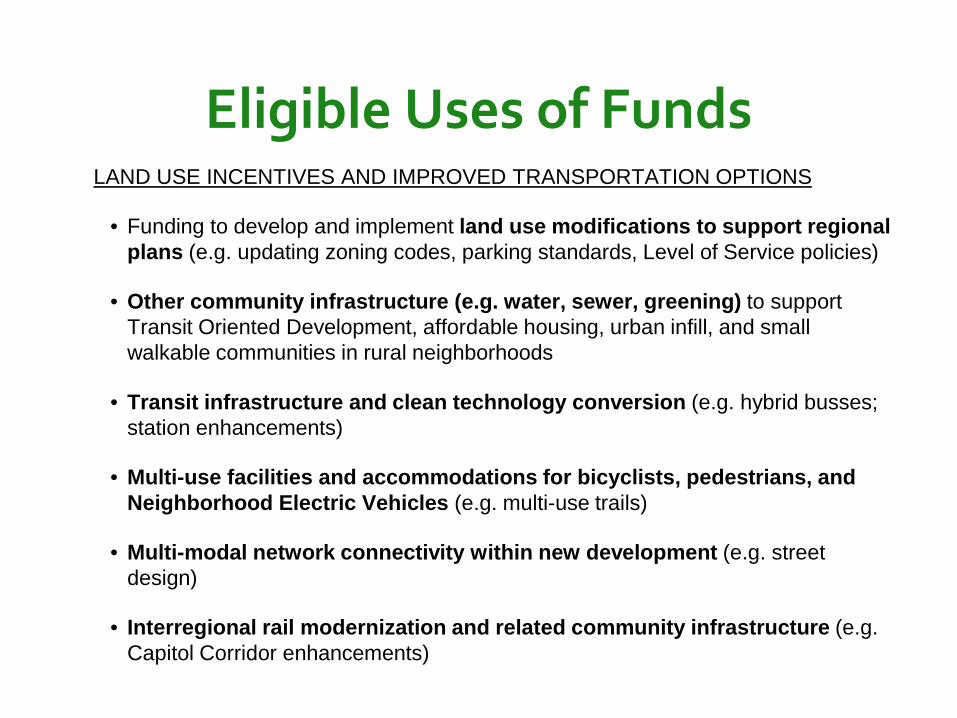
Eligible Uses of FundsLAND USE INCENTIVES AND IMPROVED TRANSPORTATION OPTIONS
• Funding to develop and implement land use modifications to support regional plans (e.g. updating zoning codes, parking standards, Level of Service policies)
• Other community infrastructure (e.g. water, sewer, greening) to support Transit Oriented Development, affordable housing, urban infill, and small walkable communities in rural neighborhoods
• Transit infrastructure and clean technology conversion (e.g. hybrid busses; station enhancements)
• Multi-use facilities and accommodations for bicyclists, pedestrians, and Neighborhood Electric Vehicles (e.g. multi-use trails)
• Multi-modal network connectivity within new development (e.g. street design)
• Interregional rail modernization and related community infrastructure (e.g. Capitol Corridor enhancements)
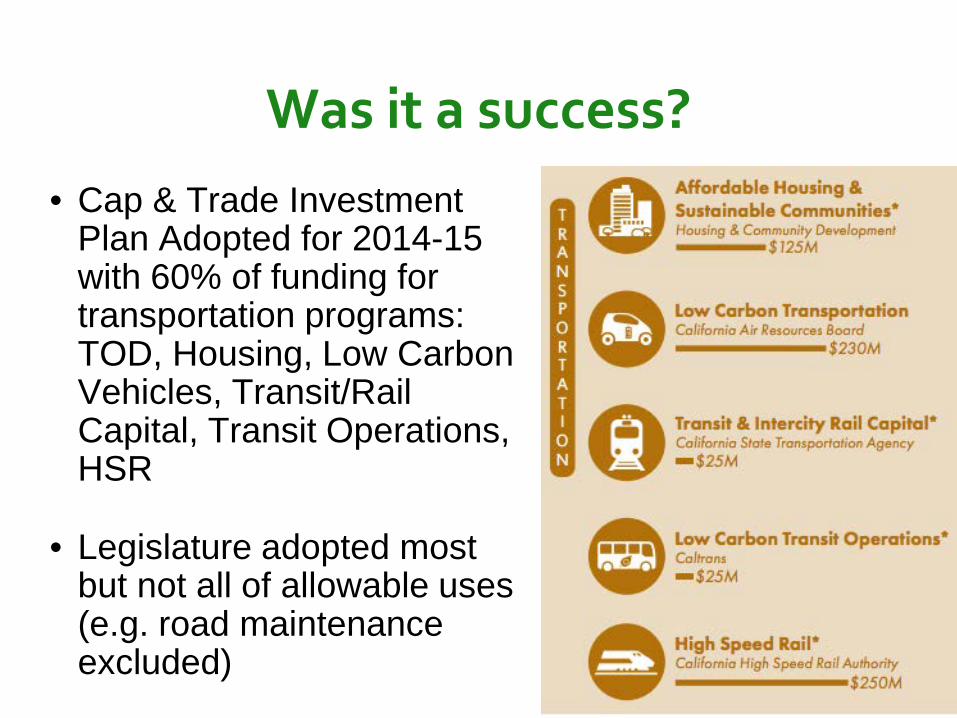
Was it a success?• Cap & Trade Investment
Plan Adopted for 2014-15 with 60% of funding for transportation programs: TOD, Housing, Low Carbon Vehicles, Transit/Rail Capital, Transit Operations, HSR
• Legislature adopted most but not all of allowable uses (e.g. road maintenance excluded)
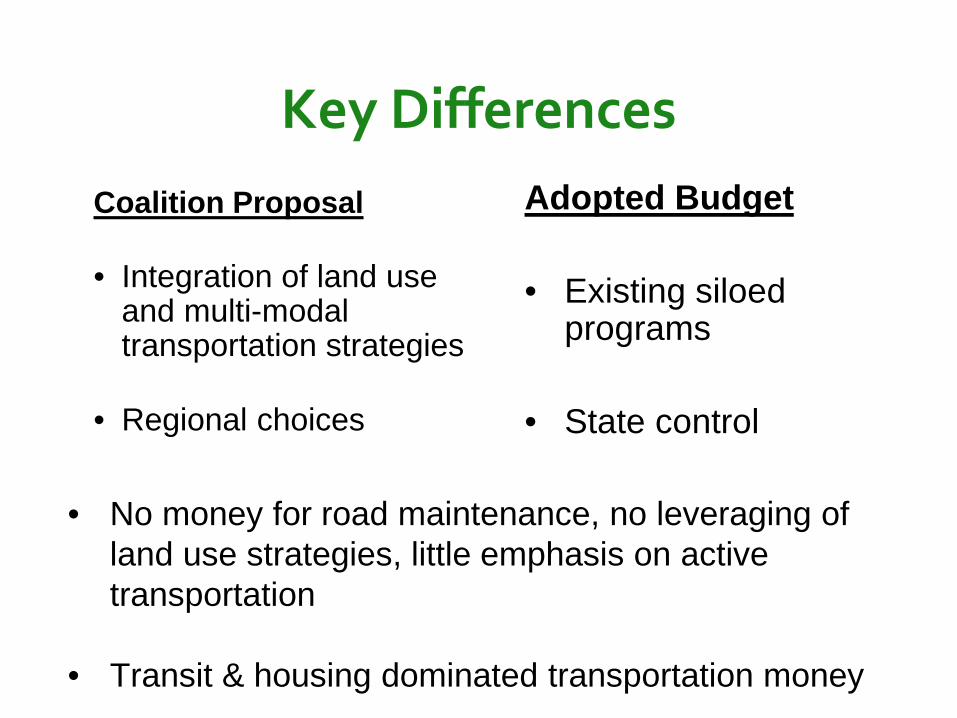
Key DifferencesCoalition Proposal
• Integration of land use and multi-modal transportation strategies
• Regional choices
Adopted Budget
• Existing siloedprograms
• State control
• No money for road maintenance, no leveraging of land use strategies, little emphasis on active transportation
• Transit & housing dominated transportation money
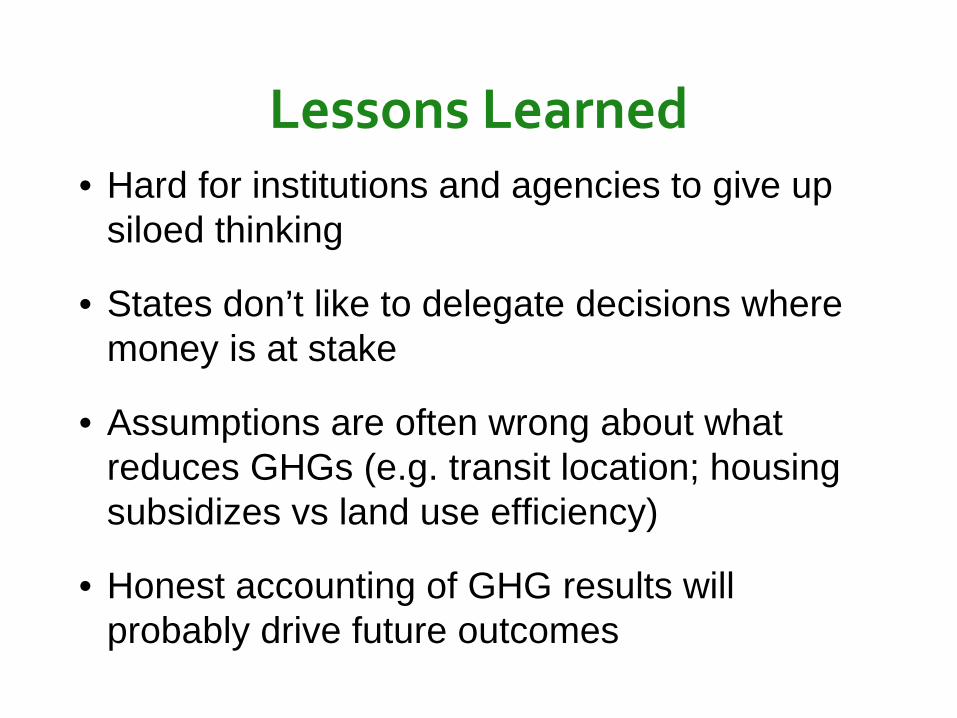
Lessons Learned• Hard for institutions and agencies to give up
siloed thinking
• States don’t like to delegate decisions where money is at stake
• Assumptions are often wrong about what reduces GHGs (e.g. transit location; housing subsidizes vs land use efficiency)
• Honest accounting of GHG results will probably drive future outcomes
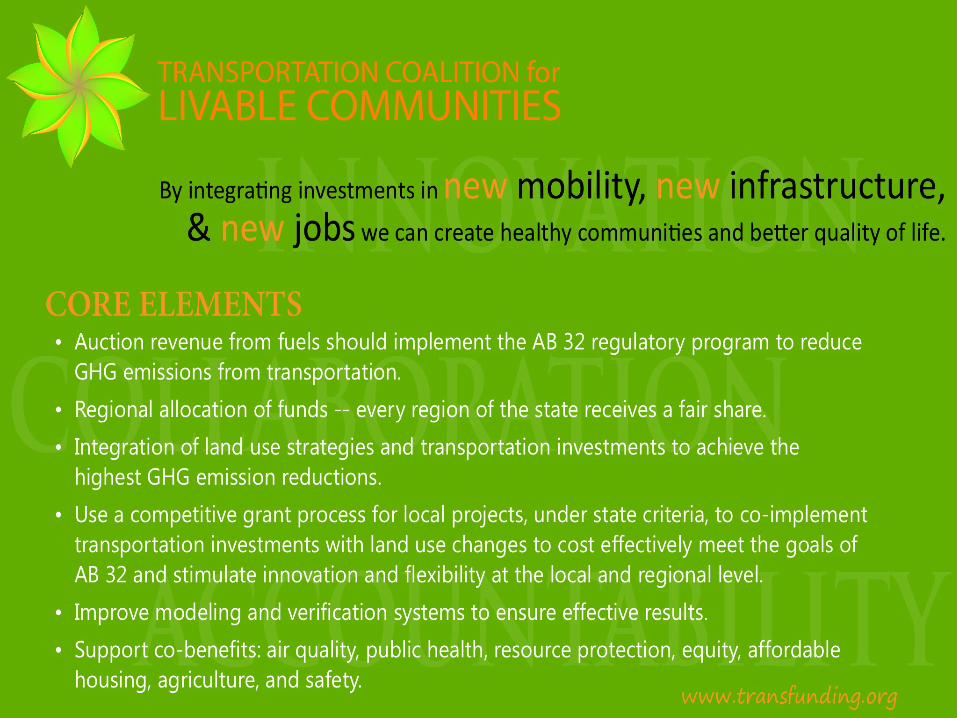
By integrating investments in new mobility, new infrastructure, and new jobs
we can create healthy communities and better quality of life for all
Innovation. Collaboration. Accountability.
For more information: [email protected]
www.transfunding.org
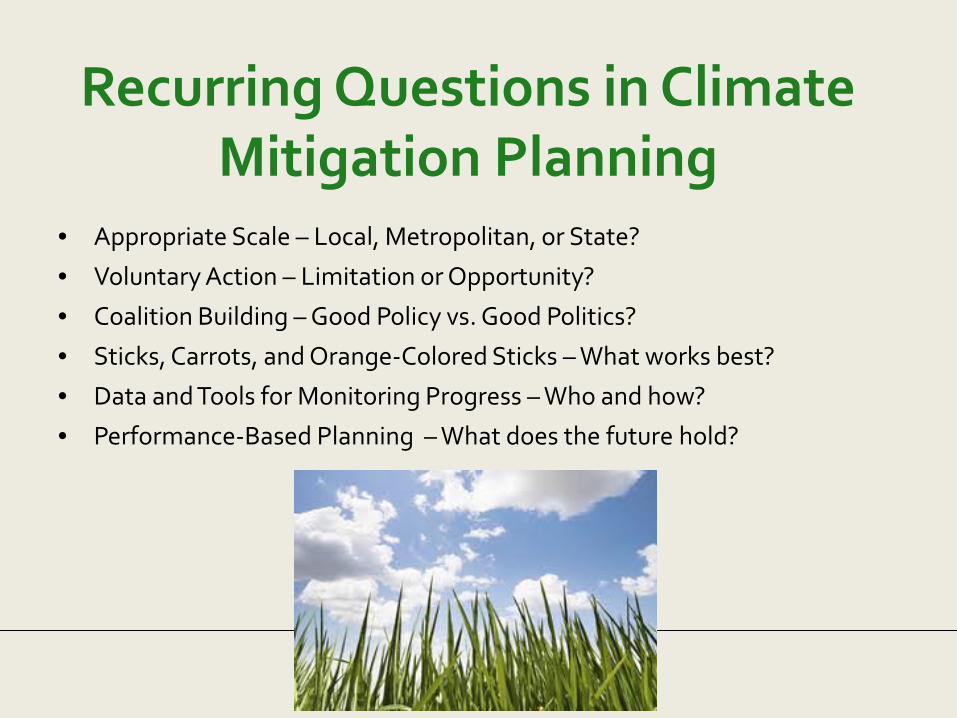
Recurring Questions in Climate Mitigation Planning
• Appropriate Scale – Local, Metropolitan, or State?
• Voluntary Action – Limitation or Opportunity?
• Coalition Building – Good Policy vs. Good Politics?
• Sticks, Carrots, and Orange-Colored Sticks – What works best?
• Data and Tools for Monitoring Progress – Who and how?
• Performance-Based Planning – What does the future hold?