Embed Size (px)
Citation preview
SQQS1013 Elementary Statistics
INTRODUCTION INTRODUCTION TO PROBABILITYTO PROBABILITY
3.1 INTRODUCTION
• The principles of probability help bridge the worlds of
descriptive statistics and inferential statistics.
• Probability can be defined as the chance of an event occurring or to be
specific the numeric value representing the chance, likelihood, or
possibility a particular event will occur.
• Situations that involve probability:
Observing or playing a game of chance such as card games and slot machines
Insurance
Investments
Weather Forecasting etc.
• It is the basis of inferential statistics such as predictions and testing the
hypotheses
3.2 SAMPLE SPACE & PROBABILTY CONCEPTSSome basic concepts of probability:
1. A Probability Experiment
- A chance process that leads to well-defined results called outcomes.
2. An Outcome
- The result of a single trial of a probability experiment.
3. A Sample Space
- The set of all possible outcomes of a probability experiment.
- Some sample spaces for various probability experiments are shown below
EXPERIMENT SAMPLE SPACES
Toss one coinHead, Tail
Roll a die 1, 2, 3, 4, 5, 6
Answer a true/false questions True, False
Toss two coins Head-Head, Head-Tail, Tail-Tail, Tail-Head
Chapter 3: Introduction to Probability 1
SQQS1013 Elementary Statistics
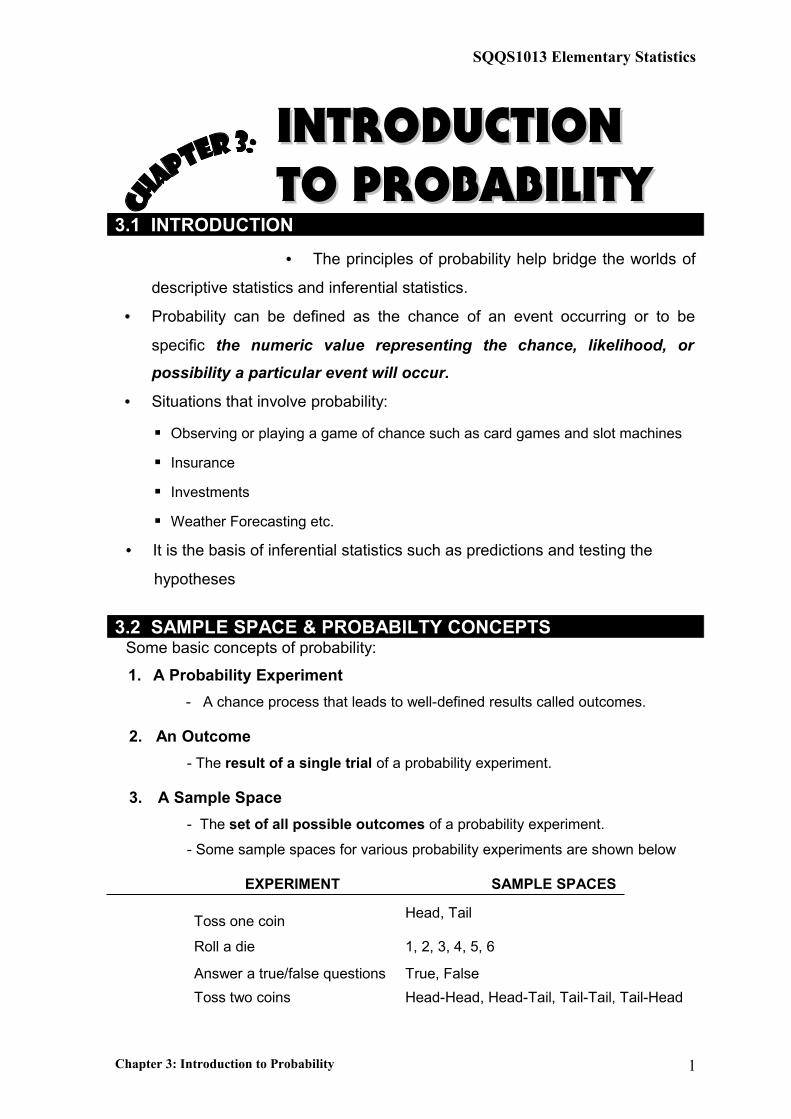
Find the sample space for rolling two dice.
Die1Die 2
1 2 3 4 5 6
1 (1,1) (1,2) (1,3) (1,4) (1,5) (1,6)2 (2,1) (2,2) (2,3) (2,4) (2,5) (2,6)3 (3,1) (3,2) (3,3) (3,4) (3,5) (3,6)4 (4,1) (4,2) (4,3) (4,4) (4,5) (4,6)5 (5,1) (5,2) (5,3) (5,4) (5,5) (5,6)6 (6,1) (6,2) (6,3) (6,4) (6,5) (6,6)
Find the sample space for the gender of the children if a family has three
children. Use B for boy and G for girl.
Solution:
There are two genders, male and female and each child could be either gender. Hence, there are eight possibilities.
BBB BBG BGB GBB GGG GGB GBG BGG
4. A Tree Diagram
- Another way to determine all possible outcomes (sample space) of a
probability experiment.
- It is a device consisting of line segments emanating from a starting point and
also from the outcome point.
Chapter 3: Introduction to Probability 2
Example 1
Example 2
Example 3
SQQS1013 Elementary Statistics
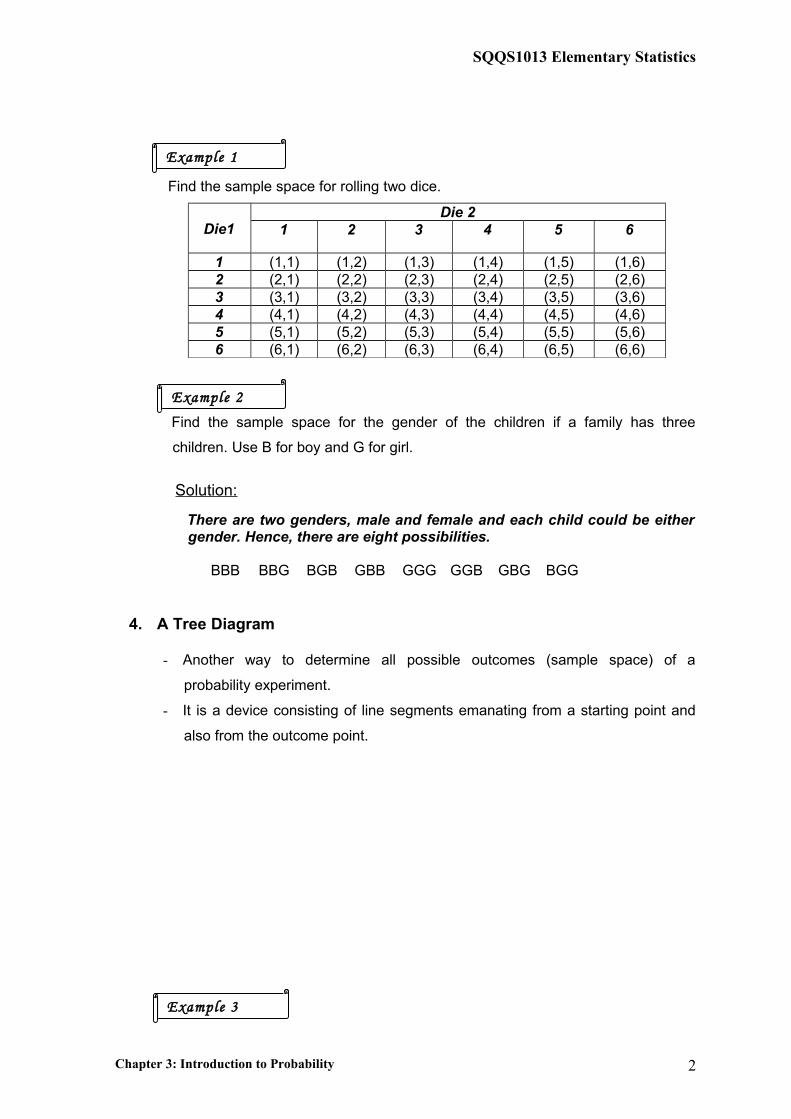
Use a tree diagram to find the sample space for the gender of three children in a
family.
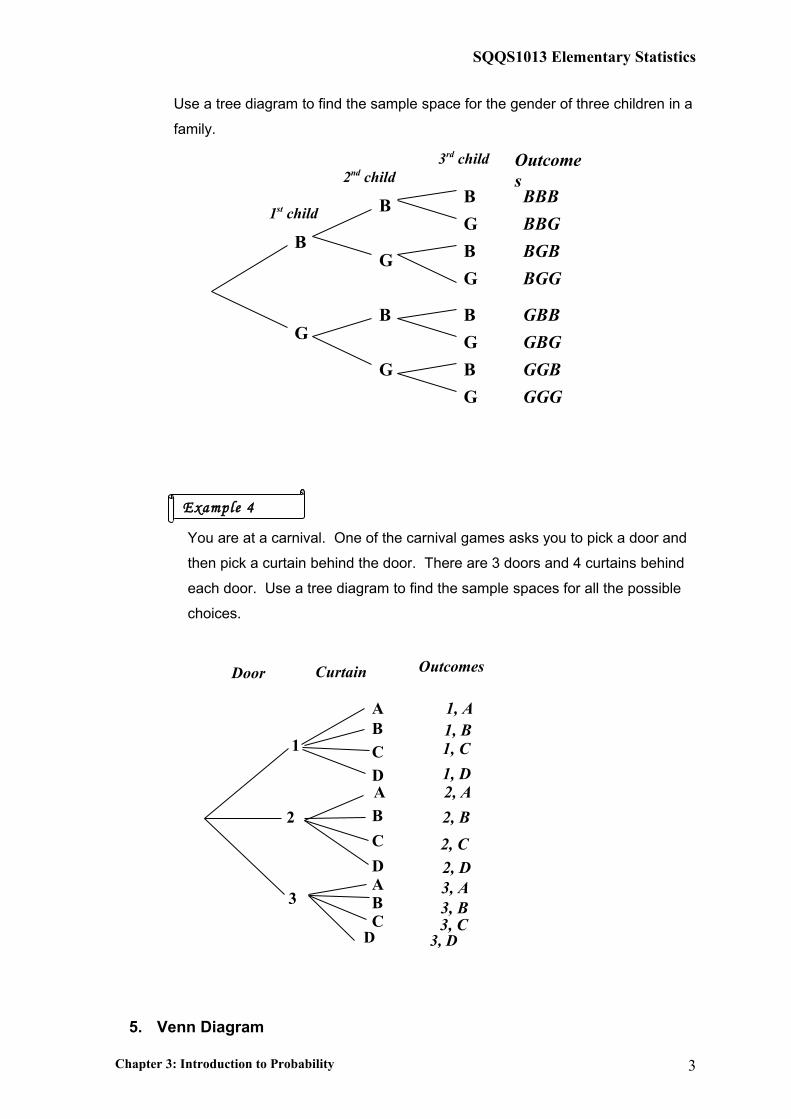
You are at a carnival. One of the carnival games asks you to pick a door and
then pick a curtain behind the door. There are 3 doors and 4 curtains behind
each door. Use a tree diagram to find the sample spaces for all the possible
choices.
5. Venn Diagram
Chapter 3: Introduction to Probability
B
G
B
B
G
G
B
G
B
G
B
G
B
G
1st child
2nd child3rd child
BBB
BBG
BGB
BGG
GBB
GBG
GGB
GGG
Outcomes
1
A
A
C
B
B
D
1, A1, B1, C
1, D2, A
2
3
C
DABC
2, B
2, C
2, D3, A
3, C3, B
3
3, D
Curtain OutcomesDoor
Example 4
D
SQQS1013 Elementary Statistics
- developed by John Venn and are used in set theory and symbolic logic.
- have been adapted to probability theory.
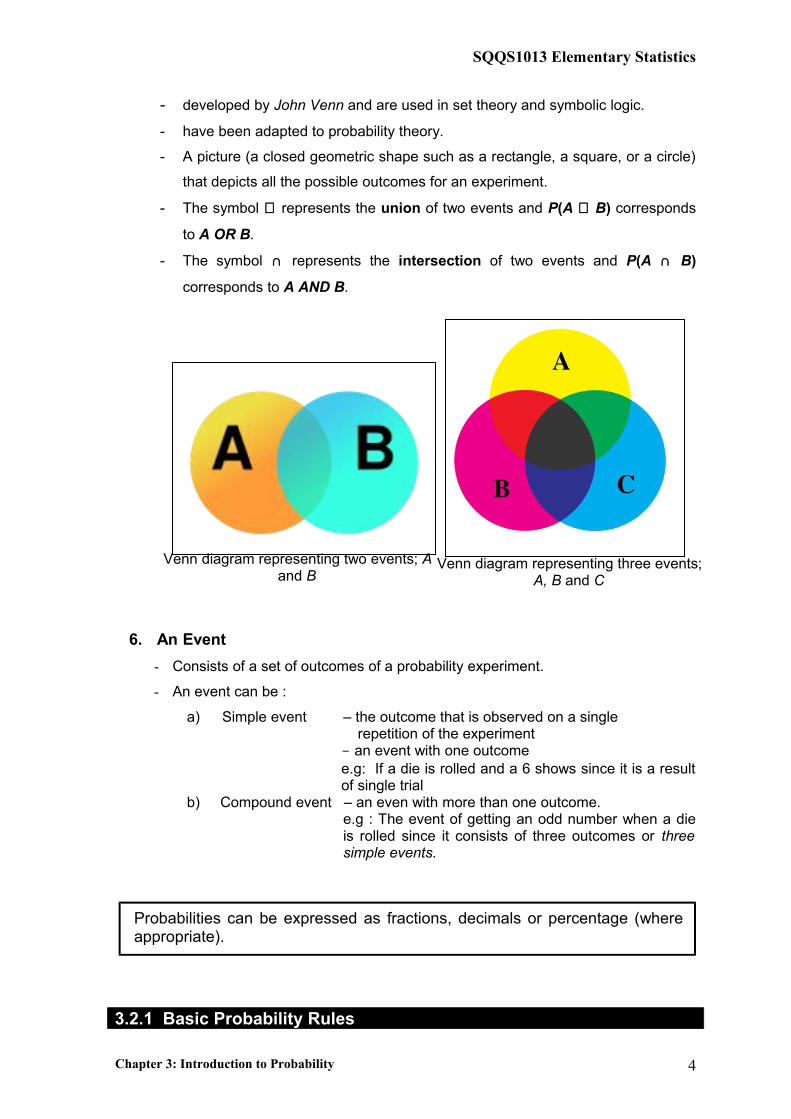
- A picture (a closed geometric shape such as a rectangle, a square, or a circle)
that depicts all the possible outcomes for an experiment.
- The symbol ∪ represents the union of two events and P(A ∪ B) corresponds
to A OR B.
- The symbol ∩ represents the intersection of two events and P(A ∩ B)
corresponds to A AND B.
6. An Event
- Consists of a set of outcomes of a probability experiment.
- An event can be :
a) Simple event – the outcome that is observed on a single repetition of the experiment
- an event with one outcomee.g: If a die is rolled and a 6 shows since it is a result of single trial
b) Compound event – an even with more than one outcome.e.g : The event of getting an odd number when a die is rolled since it consists of three outcomes or three simple events.
3.2.1 Basic Probability Rules
Chapter 3: Introduction to Probability 4
Venn diagram representing two events; A and B
Venn diagram representing three events; A, B and C
Probabilities can be expressed as fractions, decimals or percentage (where appropriate).
SQQS1013 Elementary Statistics
There are four basic probability rules:
1. The probability of any event E is a number between and including 0
and 1.
1)(0 ≤≤ EP
2. If an event E cannot occur, its probability is 0 (impossible event).
3. If an event is certain, then the probability of E is 1 (certain event).
4. The sum of the probabilities of all the outcomes in the sample space
is 1.
3.2.2 Basic Interpretation of Probability
Three basic interpretations of probability that are used to solve a variety of
problems in business, engineering and other fields:
1. Classical Probability
- Uses sample spaces to determine the probability an event will happen.
- Assumes that all outcomes in the sample space are equally likely to occur
which means that all the events have the same probability of occurring.
- The probability of any event E is:
Number of outcomes in E
Total number of outcomes in the sample space
Or denoted as,
)()()( SnEnEP =
e.g.: When a single die is rolled, each outcome has the same probability of occurring. Since there are six outcomes, each outcome has a probability of
6
1.
2. Empirical Probability
- Relies on actual experience to determine the likelihood of outcomes.
- Is based on observation.
- Given a frequency distribution, the probability of an event being in a given
class is:
Frequency for the class or denoted as, nfEP =)(
Total frequencies in the distribution
Chapter 3: Introduction to Probability 5
Example 5
SQQS1013 Elementary Statistics
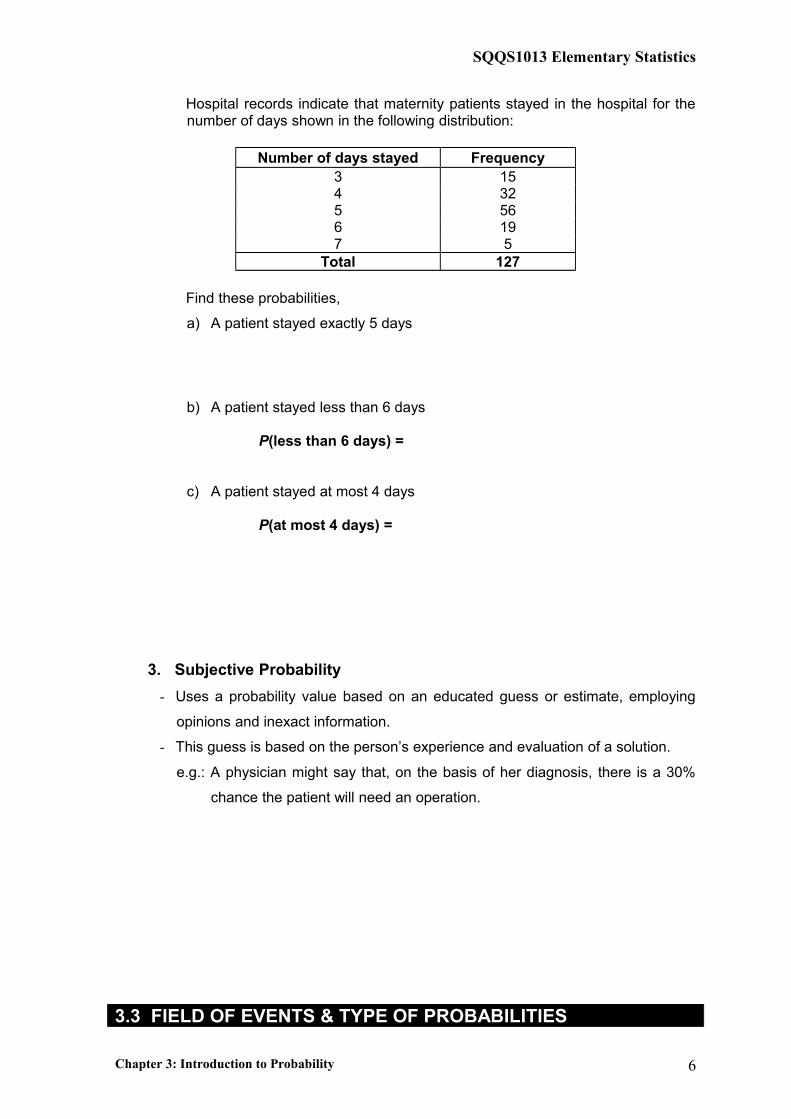
Hospital records indicate that maternity patients stayed in the hospital for the number of days shown in the following distribution:
Number of days stayed Frequency3 154 325 566 197 5
Total 127
Find these probabilities,
a) A patient stayed exactly 5 days
b) A patient stayed less than 6 days
P(less than 6 days) =
c) A patient stayed at most 4 days
P(at most 4 days) =
3. Subjective Probability
- Uses a probability value based on an educated guess or estimate, employing
opinions and inexact information.
- This guess is based on the person’s experience and evaluation of a solution.
e.g.: A physician might say that, on the basis of her diagnosis, there is a 30%
chance the patient will need an operation.
3.3 FIELD OF EVENTS & TYPE OF PROBABILITIES
Chapter 3: Introduction to Probability 6
SQQS1013 Elementary Statistics
3.3.1 Field of Events
• Intersection vs. Union events
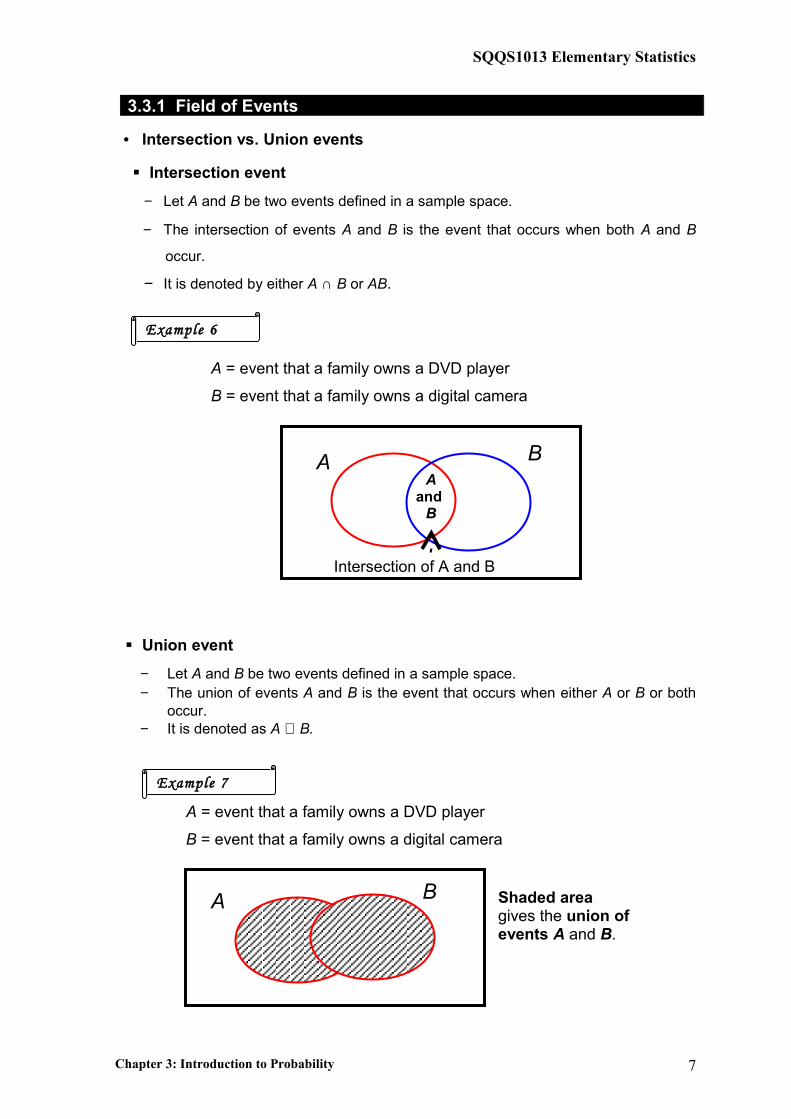
Intersection event
− Let A and B be two events defined in a sample space.
− The intersection of events A and B is the event that occurs when both A and B
occur.
− It is denoted by either A ∩ B or AB.
A = event that a family owns a DVD player
B = event that a family owns a digital camera
Union event
− Let A and B be two events defined in a sample space.− The union of events A and B is the event that occurs when either A or B or both
occur.− It is denoted as A ∪ B.
A = event that a family owns a DVD player
B = event that a family owns a digital camera
Shaded areagives the union ofevents A and B.
Chapter 3: Introduction to Probability 7
A BA
and B
Intersection of A and B
A B
Example 6
Example 7
SQQS1013 Elementary Statistics
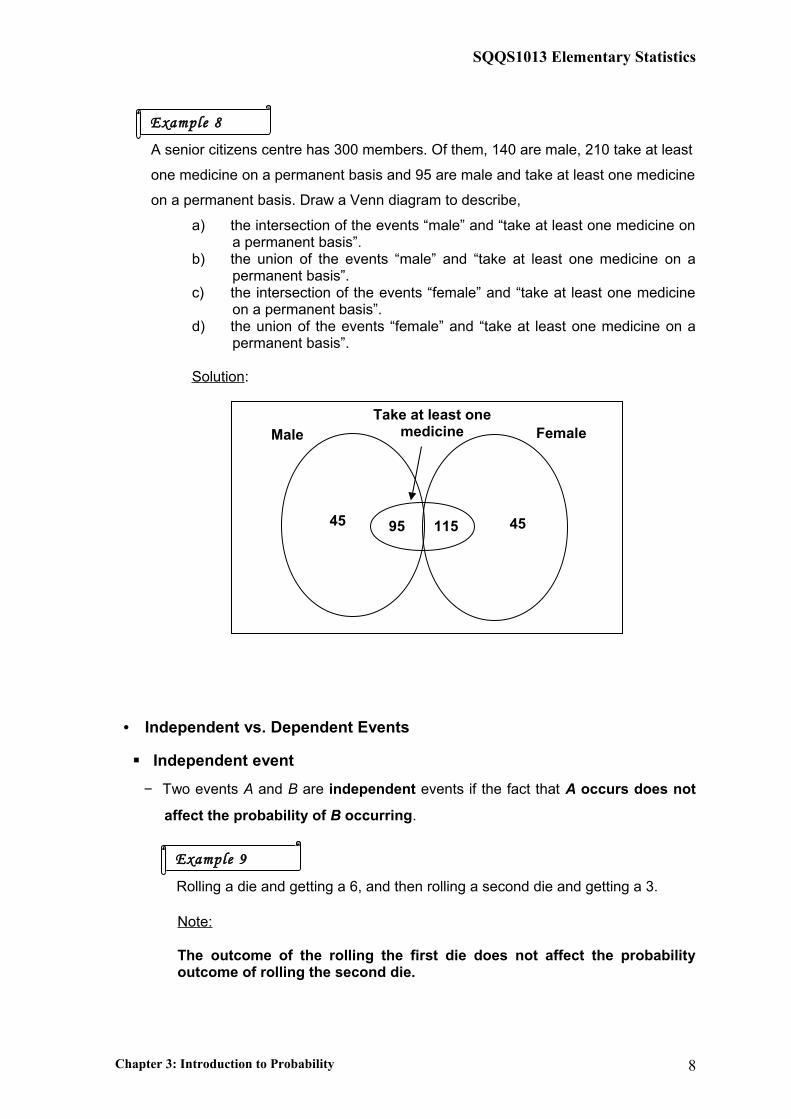
A senior citizens centre has 300 members. Of them, 140 are male, 210 take at least
one medicine on a permanent basis and 95 are male and take at least one medicine
on a permanent basis. Draw a Venn diagram to describe,
a) the intersection of the events “male” and “take at least one medicine on a permanent basis”.
b) the union of the events “male” and “take at least one medicine on a permanent basis”.
c) the intersection of the events “female” and “take at least one medicine on a permanent basis”.
d) the union of the events “female” and “take at least one medicine on a permanent basis”.
Solution:
• Independent vs. Dependent Events
Independent event
− Two events A and B are independent events if the fact that A occurs does not
affect the probability of B occurring.
Rolling a die and getting a 6, and then rolling a second die and getting a 3.
Note:
The outcome of the rolling the first die does not affect the probability outcome of rolling the second die.
Chapter 3: Introduction to Probability
Male FemaleTake at least one
medicine
95 11545 45
8
Example 8
Example 9
SQQS1013 Elementary Statistics
Dependent event
− When the outcome or occurrence of the first event affects the outcome or
occurrence of the second event in such a way that the probability is changed, the
events are said to be dependent events.
− Some examples of dependent events:
o Drawing a card from a deck, not replacing it, and then drawing a second card.
o Selecting a ball from an urn, not replacing it, and then selecting a second ball.
o Having high grades and getting a scholarship.o Parking in a no-parking zone and getting a parking ticket.
3.3.2 Type of Probabilities
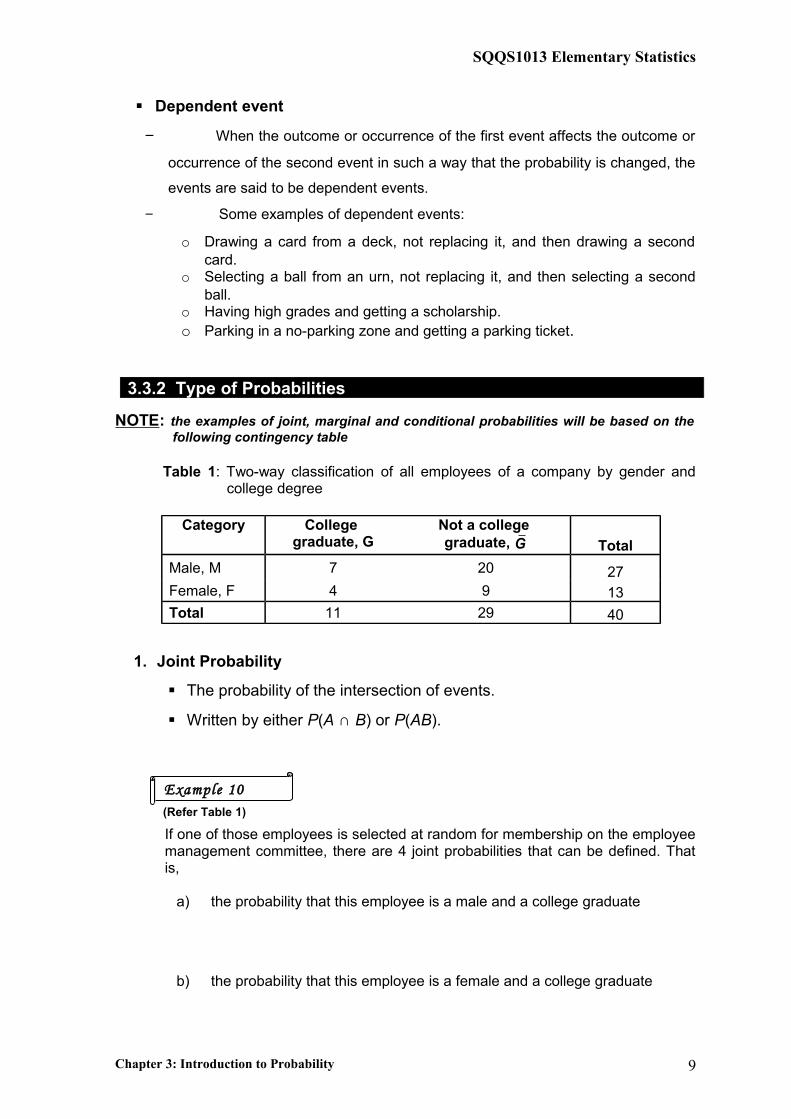
NOTE: the examples of joint, marginal and conditional probabilities will be based on the following contingency table
Table 1: Two-way classification of all employees of a company by gender and college degree
Category College graduate, G
Not a college graduate, G Total
Male, M 7 20 27Female, F 4 9 13Total 11 29 40
1. Joint Probability
The probability of the intersection of events.
Written by either P(A ∩ B) or P(AB).
(Refer Table 1)
If one of those employees is selected at random for membership on the employee management committee, there are 4 joint probabilities that can be defined. That is,
a) the probability that this employee is a male and a college graduate
b) the probability that this employee is a female and a college graduate
Chapter 3: Introduction to Probability 9
Example 10
SQQS1013 Elementary Statistics
c) the probability that this employee is a male and not a college graduate
d) the probability that this employee is a female and not a college graduate
2. Marginal Probability
The probability of a single event without consideration of any event.
Also called as simple probability.
Named so as they calculated in the margins of the table (divide the
corresponding totals for the row or column by the grand total).
(Refer Table 1)
If one of those employees is selected at random for membership on the employee management committee, find the probabilities for each of the followings:
a) the chosen employee is a male
b) the chosen employee is a female
c) the chosen employee a college graduate
d) the chosen employee is not a college graduate
Chapter 3: Introduction to Probability 10
Example 11
SQQS1013 Elementary Statistics
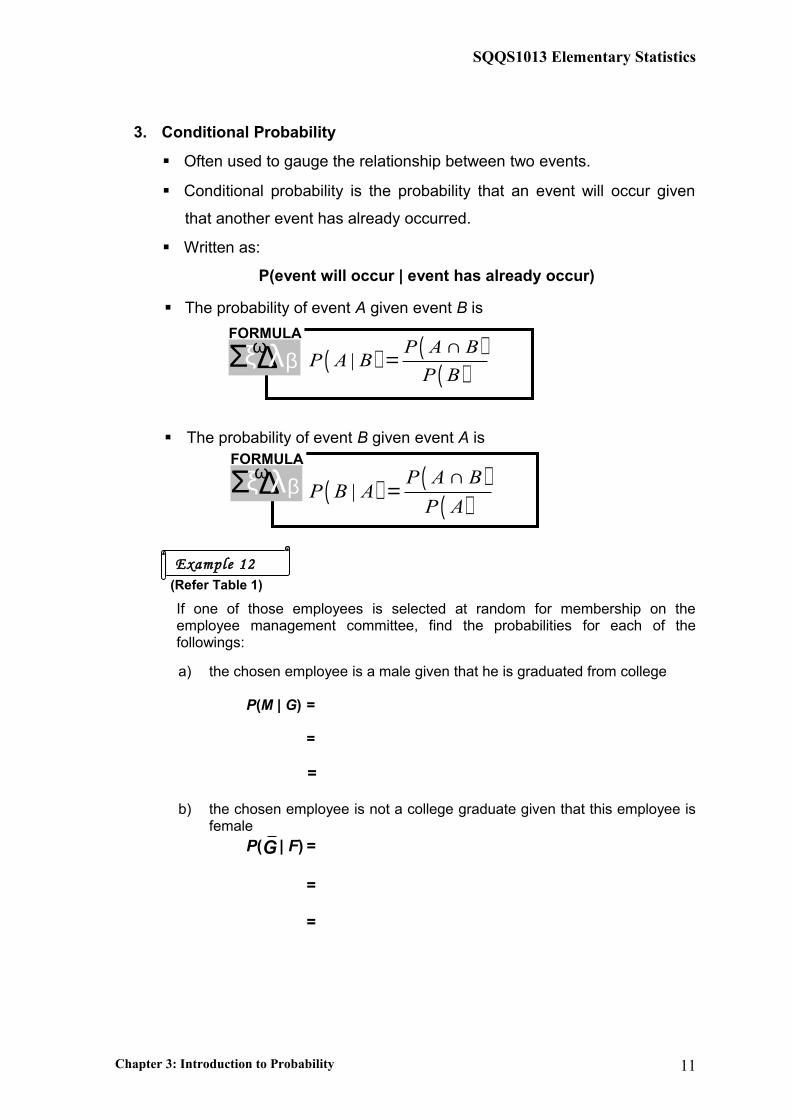
3. Conditional Probability
Often used to gauge the relationship between two events.
Conditional probability is the probability that an event will occur given
that another event has already occurred.
Written as:
P(event will occur | event has already occur)
The probability of event A given event B is
( ) ( )( )
|P A B
P A BP B
∩=
The probability of event B given event A is
( ) ( )( )|
P A BP B A
P A
∩=
(Refer Table 1)
If one of those employees is selected at random for membership on the employee management committee, find the probabilities for each of the followings:
a) the chosen employee is a male given that he is graduated from college
P(M | G) =
=
=
b) the chosen employee is not a college graduate given that this employee is female
P(G | F) =
=
=
Chapter 3: Introduction to Probability 11
Example 12
FORMULA
ξ∆Σ λϖβ
FORMULA
ξ∆Σ λϖβ

SQQS1013 Elementary Statistics
A person owns a collection of 30 CDs, of which 5 are country music.
a) 2 CDs are selected at random and with replacement. Find the probability that the second CD is country music given that the first CD is country music.
P(CM |CM) =
=
b) This time the selection made is without replacement. Find the probability that the second CD is country music given that the first CD is country music.
P(CM |CM) =
=
3.4 EVENTS & PROBABILITIES RULES
3.4.1 Mutually Exclusive Events & Non-Mutually Exclusive Events
• Two events are mutually exclusive if they cannot occur at the same time
(they have no outcomes in common).
• The probability of two or more events can be determined by the addition
rules.
Chapter 3: Introduction to Probability 12
Example 13
SQQS1013 Elementary Statistics
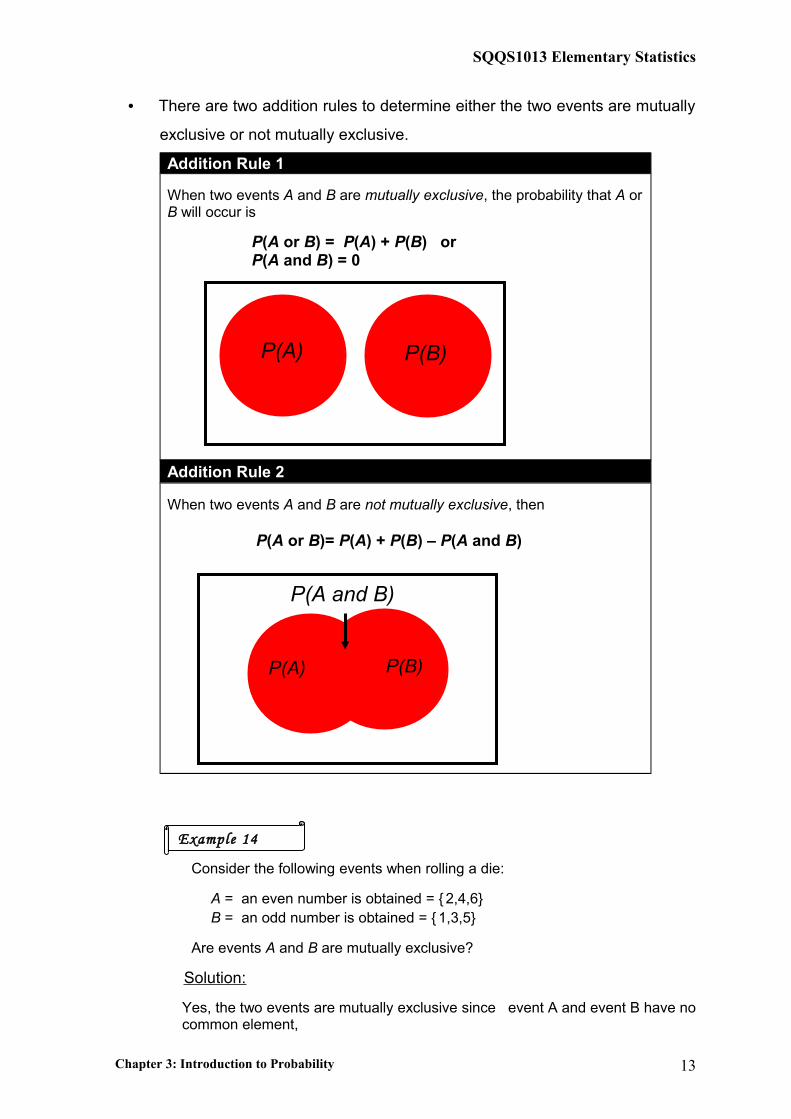
• There are two addition rules to determine either the two events are mutually
exclusive or not mutually exclusive.
Addition Rule 1
When two events A and B are mutually exclusive, the probability that A or B will occur is
P(A or B) = P(A) + P(B) or P(A and B) = 0
Addition Rule 2
When two events A and B are not mutually exclusive, then P(A or B)= P(A) + P(B) – P(A and B)
Consider the following events when rolling a die:
A = an even number is obtained = {2,4,6}B = an odd number is obtained = {1,3,5}
Are events A and B are mutually exclusive?
Solution:
Yes, the two events are mutually exclusive since event A and event B have no common element,
Chapter 3: Introduction to Probability 13
P(A) P(B)
P(B)P(A)
P(A and B)
Example 14
SQQS1013 Elementary Statistics
Determine which events are mutually exclusive and which are not when a single die is rolled.
a) Getting a 3 and getting an odd number.
Answer: Not Mutually Exclusive
b) Getting a number greater than 4 and getting a number less than 4.
Answer: Mutually Exclusive
c) Getting an odd number and getting a number less than 4.
Answer: Not Mutually Exclusive
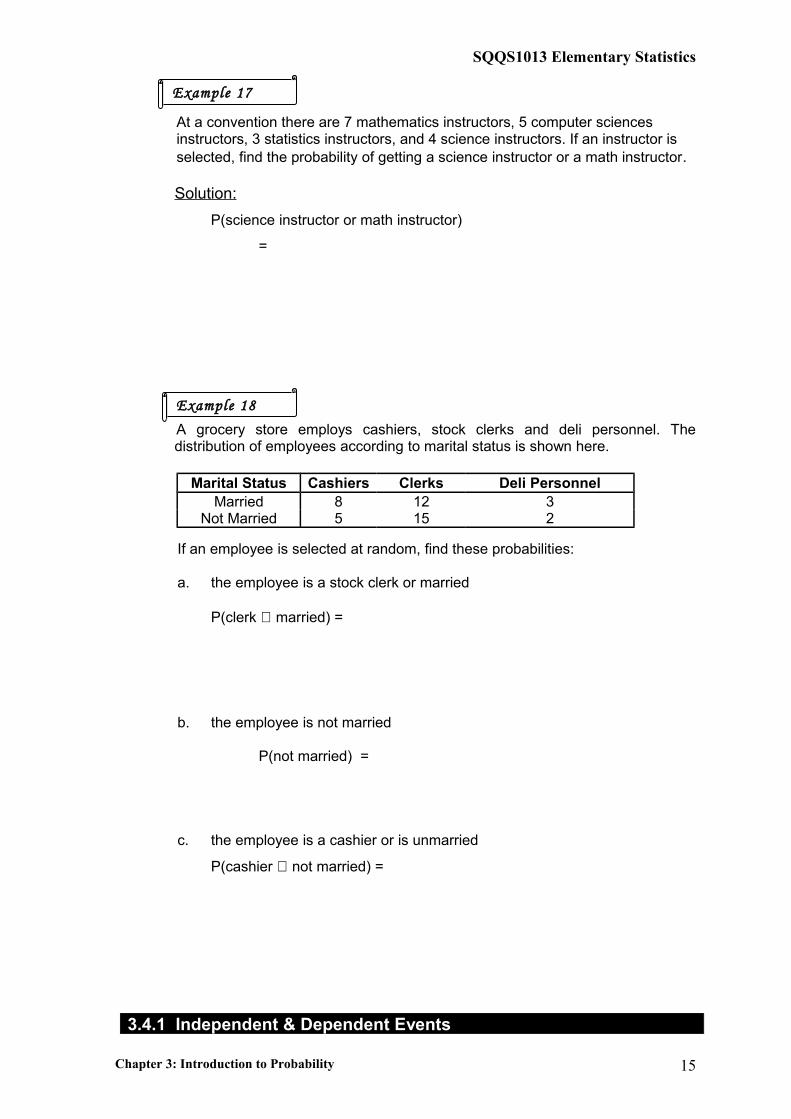
There are 8 nurses and 5 physicians in a hospital unit; 7 nurses and 3 physicians are females. If a staff person is selected, find the probability that the subject is a nurse or a male.
Solution:
Staff Female, F Male, M TotalNurses, N 7 1 8Physicians, PY 3 2 5
Total 10 3 13
P(N or M) = P(N ∪ M)=
Chapter 3: Introduction to Probability
A B
1 3 5
2 4 6
14
Example 15
Example 16
SQQS1013 Elementary Statistics
At a convention there are 7 mathematics instructors, 5 computer sciences instructors, 3 statistics instructors, and 4 science instructors. If an instructor is selected, find the probability of getting a science instructor or a math instructor.
Solution:
P(science instructor or math instructor)
=
A grocery store employs cashiers, stock clerks and deli personnel. The distribution of employees according to marital status is shown here.
Marital Status Cashiers Clerks Deli PersonnelMarried 8 12 3
Not Married 5 15 2
If an employee is selected at random, find these probabilities:
a. the employee is a stock clerk or married
P(clerk ∪ married) =
b. the employee is not married
P(not married) =
c. the employee is a cashier or is unmarried
P(cashier ∪ not married) =
3.4.1 Independent & Dependent Events
Chapter 3: Introduction to Probability 15
Example 17
Example 18
SQQS1013 Elementary Statistics
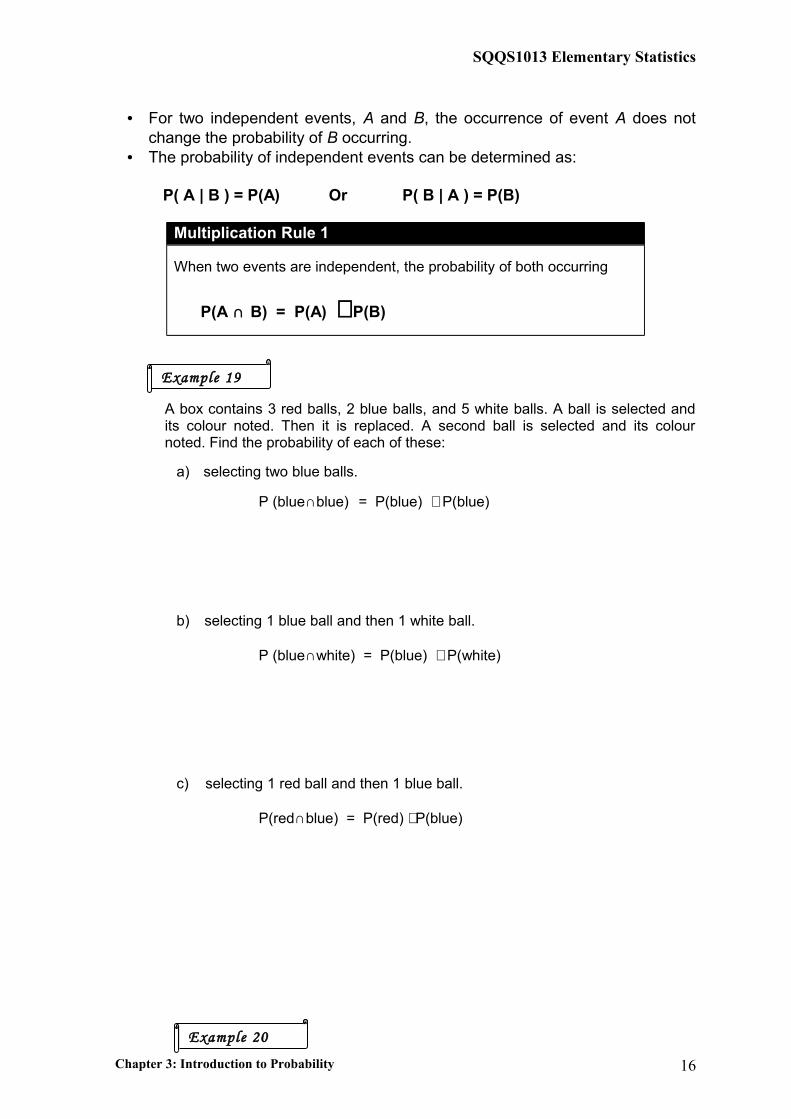
• For two independent events, A and B, the occurrence of event A does not change the probability of B occurring.
• The probability of independent events can be determined as:
P( A | B ) = P(A) Or P( B | A ) = P(B)
Multiplication Rule 1
When two events are independent, the probability of both occurring
P(A ∩ B) = P(A) ⋅ P(B)
A box contains 3 red balls, 2 blue balls, and 5 white balls. A ball is selected and its colour noted. Then it is replaced. A second ball is selected and its colour noted. Find the probability of each of these:
a) selecting two blue balls.
P (blue∩blue) = P(blue) ⋅ P(blue)
b) selecting 1 blue ball and then 1 white ball.
P (blue∩white) = P(blue) ⋅ P(white)
c) selecting 1 red ball and then 1 blue ball.
P(red∩blue) = P(red) ⋅ P(blue)
Chapter 3: Introduction to Probability 16
Example 19
Example 20
SQQS1013 Elementary Statistics
A survey found that 68% of book buyers are 40 years or older. If two book buyers are selected at random, find the probability that both are 40 years or older.
P (buyer) =
• On the other hand, two events, A and B are dependent when the occurrence of the event A changes the probability of the occurrence of event B.
• When two events are dependent, another multiplication rule can be used to find the probability.
Multiplication Rule 2
When two events are dependent, the probability of both occurring
P (A ∩ B) = P(A) ⋅ P( B | A )
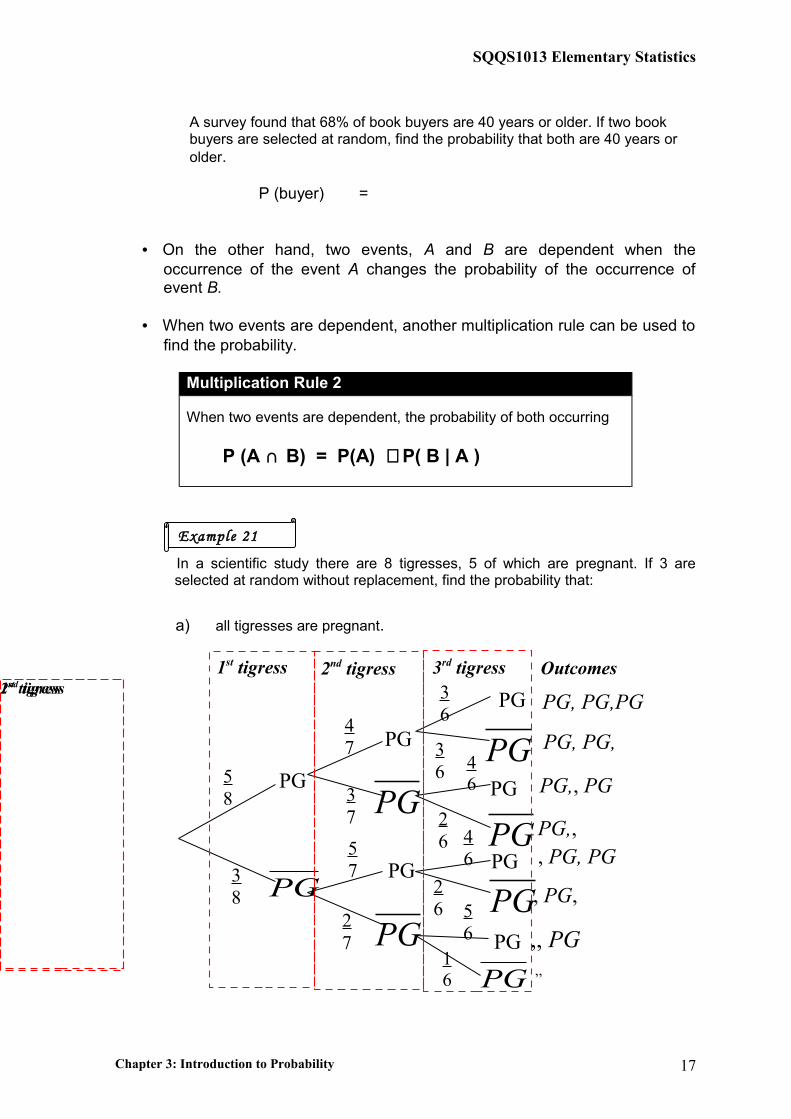
In a scientific study there are 8 tigresses, 5 of which are pregnant. If 3 are selected at random without replacement, find the probability that:
a) all tigresses are pregnant.
Chapter 3: Introduction to Probability 17
2nd tigress1st tigress
Example 21
PG
PG
PG, PG,PG
PG
PG
PG
PG
PG
PGPG
PG
PG
PG
PG
58
38
47
37
57
27
36
36 4
6
26 4
6
26 5
6
PG
16
PG,, PG
PG,, , PG, PG
PG, PG,
, PG,
,, PG,,
2nd tigress1st tigress 3rd tigress Outcomes
SQQS1013 Elementary Statistics
P(PG∩PG∩PG) =
b) two tigresses are pregnant.
Let A be an event of two tigresses are pregnant
P(A) =
3.4.3 Complementary Events
• The set of outcomes in the sample space that is not included in the outcomes
of event E.
• Denoted as E (read “E bar”)
Find the complement of each event.
a) Rolling a die and getting a 4
Answer:
b) Selecting a letter of the alphabet and getting a vowel
Answer:
c) Selecting a day of the week and getting a weekday
Answer:
• The outcomes of an event and the outcomes of the complement make up
the entire sample space.
Chapter 3: Introduction to Probability 18
Example 22
SQQS1013 Elementary Statistics
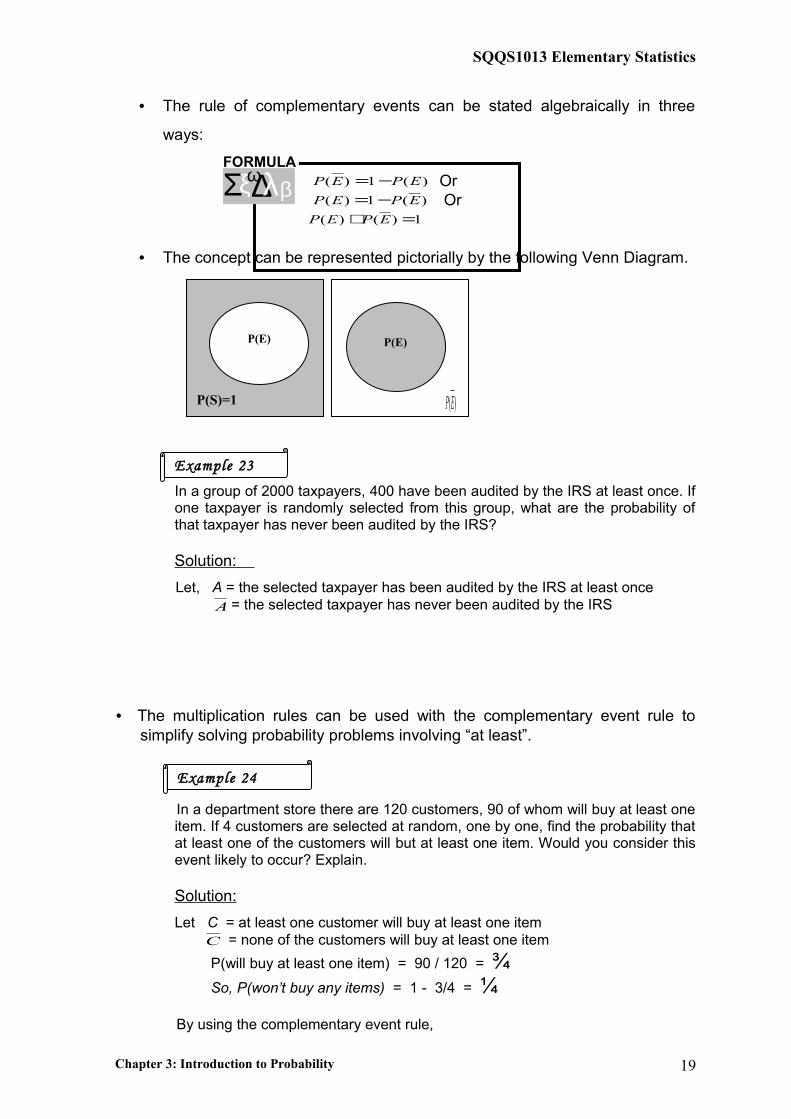
• The rule of complementary events can be stated algebraically in three
ways:
)(1)( EPEP −= Or )(1)( EPEP −= Or
1)()( =+ EPEP
• The concept can be represented pictorially by the following Venn Diagram.
In a group of 2000 taxpayers, 400 have been audited by the IRS at least once. If one taxpayer is randomly selected from this group, what are the probability of that taxpayer has never been audited by the IRS?
Solution:
Let, A = the selected taxpayer has been audited by the IRS at least onceA = the selected taxpayer has never been audited by the IRS
• The multiplication rules can be used with the complementary event rule to simplify solving probability problems involving “at least”.
In a department store there are 120 customers, 90 of whom will buy at least one item. If 4 customers are selected at random, one by one, find the probability that at least one of the customers will but at least one item. Would you consider this event likely to occur? Explain.
Solution:
Let C = at least one customer will buy at least one item C = none of the customers will buy at least one item
P(will buy at least one item) = 90 / 120 = ¾So, P(won’t buy any items) = 1 - 3/4 = ¼
By using the complementary event rule,
Chapter 3: Introduction to Probability
P(E)
P(S)=1
P(E)
)(EP
19
Example 23
Example 24
FORMULA
ξ∆Σ λϖβ
SQQS1013 Elementary Statistics
)(1)( CPCP −=
=
= Yes, this event is most likely to occur (certain event) since the probability almost 1
NOTE: The following examples are based on the overall understanding of the entire probability concepts
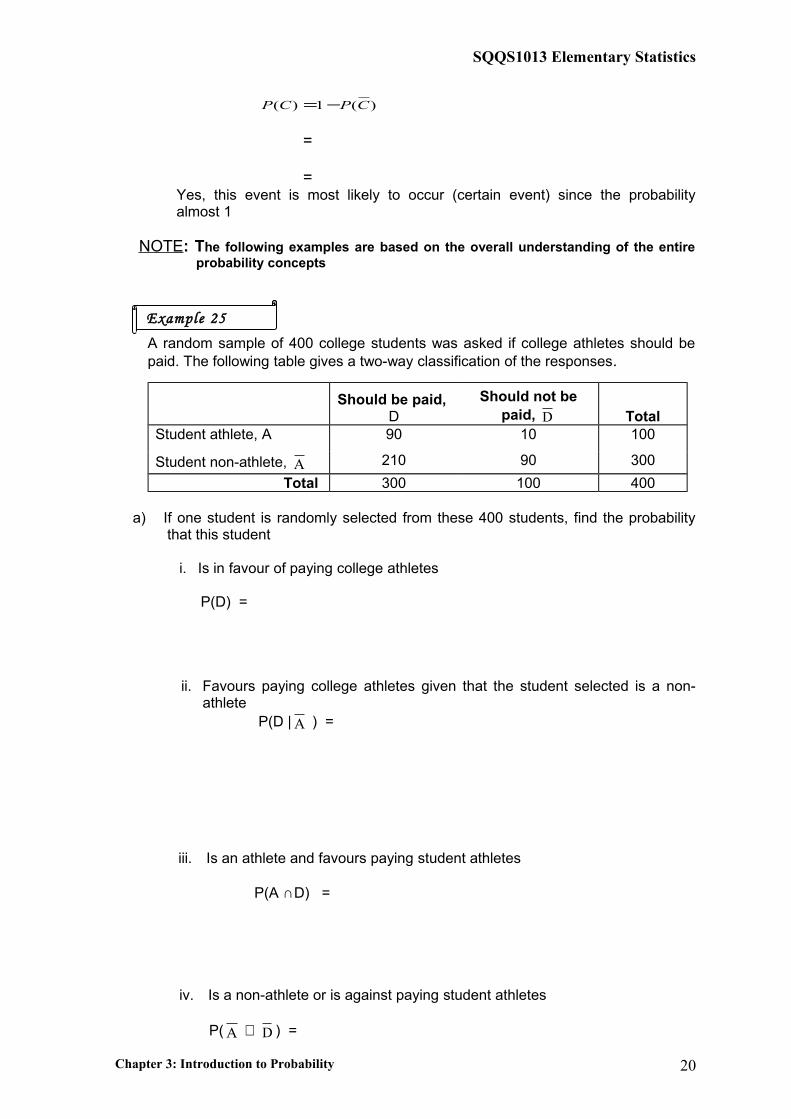
A random sample of 400 college students was asked if college athletes should be paid. The following table gives a two-way classification of the responses.
Should be paid, D
Should not be paid, D Total
Student athlete, A 90 10 100
Student non-athlete, A 210 90 300
Total 300 100 400
a) If one student is randomly selected from these 400 students, find the probability that this student
i. Is in favour of paying college athletes
P(D) =
ii. Favours paying college athletes given that the student selected is a non-athlete
P(D | A ) =
iii. Is an athlete and favours paying student athletes P(A ∩D) =
iv. Is a non-athlete or is against paying student athletes
P( A ∪ D ) =
Chapter 3: Introduction to Probability 20
Example 25
SQQS1013 Elementary Statistics
b) Are the events “student athlete” and “should be paid” independent? Are they mutually exclusive? Explain why or why not.
P(A∩D) =
Since, P(A∩D) ≠ P(A) ⋅ P(D), those two events are not independent (dependent).
And since P(A∩D) ≠ 0, those two events are not mutually exclusive
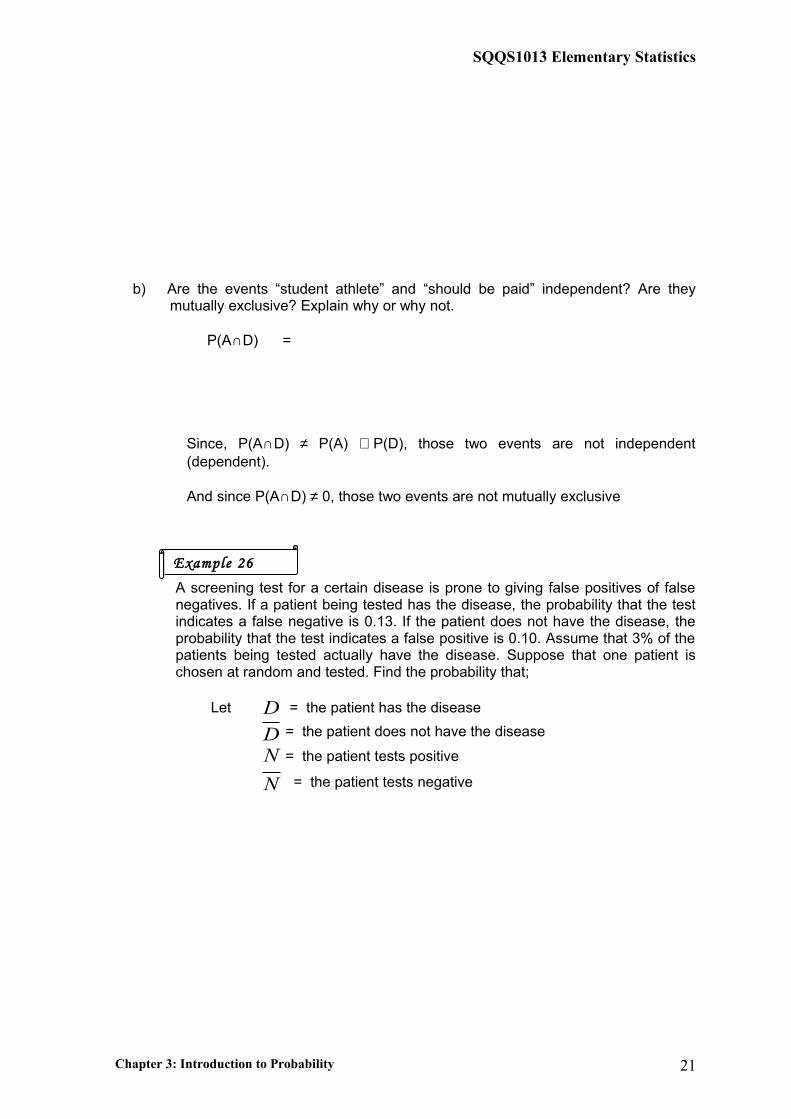
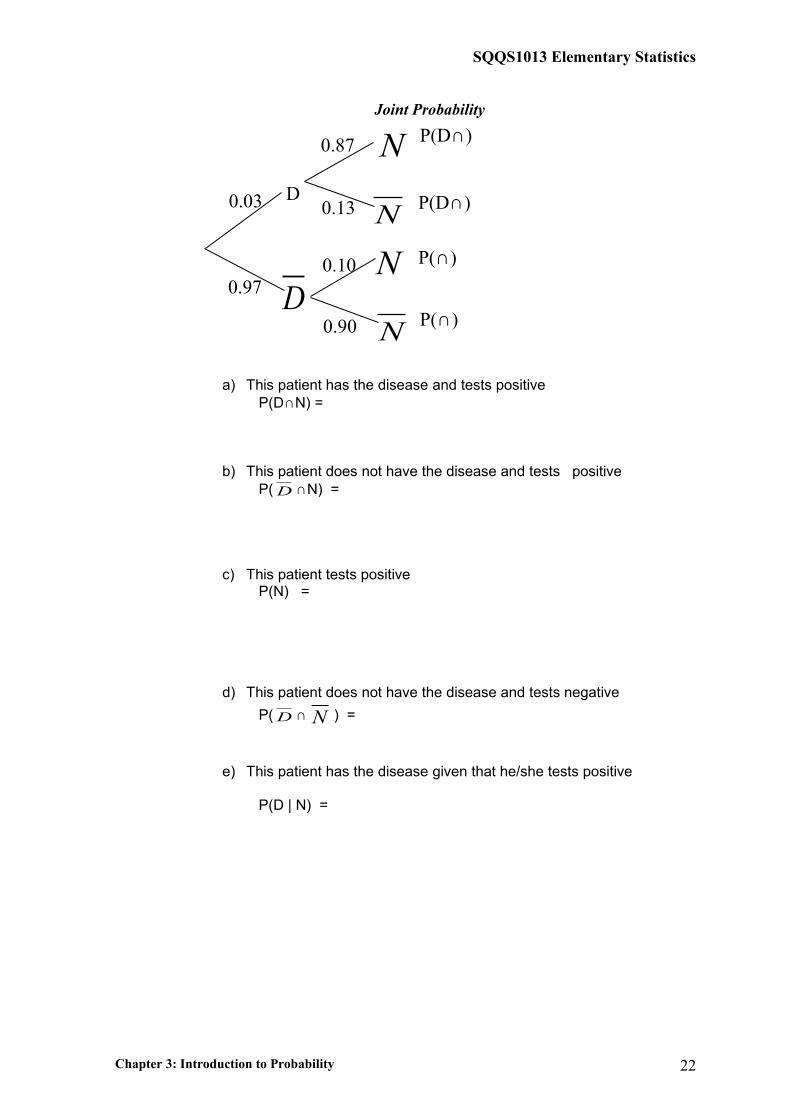
A screening test for a certain disease is prone to giving false positives of false negatives. If a patient being tested has the disease, the probability that the test indicates a false negative is 0.13. If the patient does not have the disease, the probability that the test indicates a false positive is 0.10. Assume that 3% of the patients being tested actually have the disease. Suppose that one patient is chosen at random and tested. Find the probability that;
Let D = the patient has the disease
D = the patient does not have the disease
N = the patient tests positive
N = the patient tests negative
Chapter 3: Introduction to Probability 21
Example 26
SQQS1013 Elementary Statistics
a) This patient has the disease and tests positiveP(D∩N) =
b) This patient does not have the disease and tests positiveP(D ∩N) =
c) This patient tests positiveP(N) =
d) This patient does not have the disease and tests negative
P(D ∩ N ) =
e) This patient has the disease given that he/she tests positive
P(D | N) =
Chapter 3: Introduction to Probability
D
D
N
N
N
N0.03
0.97
0.13
0.87
0.10
0.90
P(D∩)
P(D∩)
P(∩)
P(∩)
Joint Probability
22
SQQS1013 Elementary Statistics
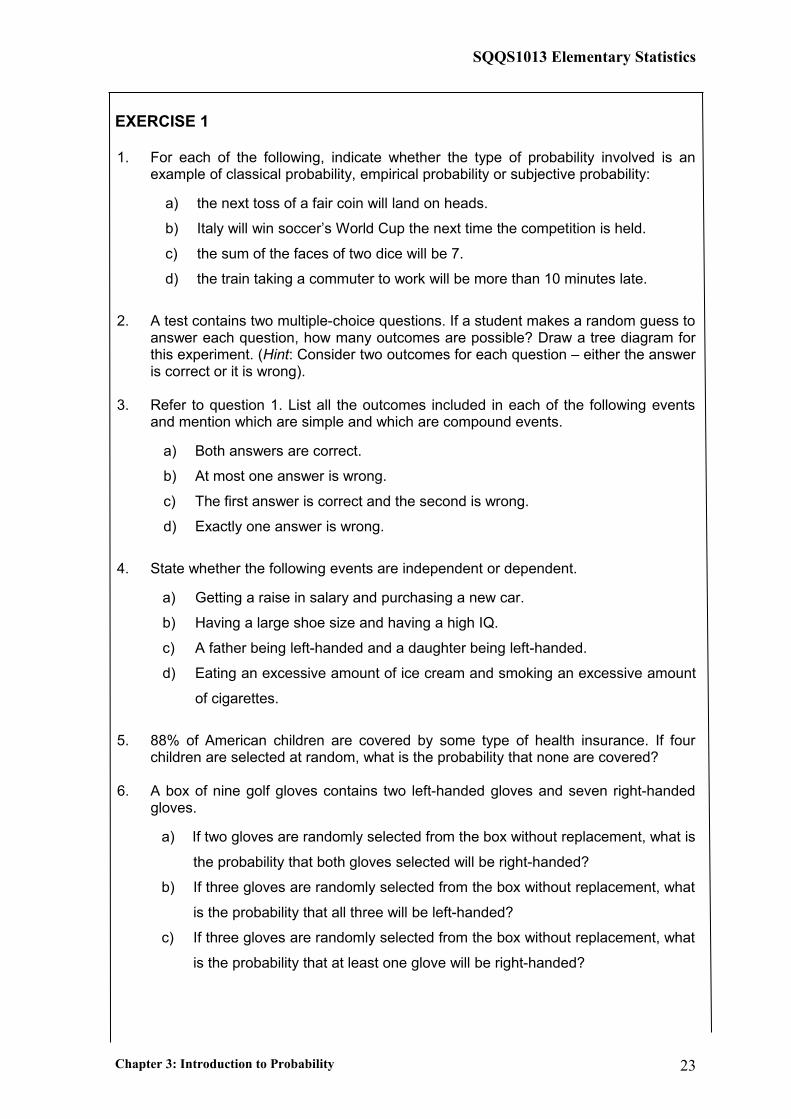
EXERCISE 1
1. For each of the following, indicate whether the type of probability involved is an example of classical probability, empirical probability or subjective probability:
a) the next toss of a fair coin will land on heads.
b) Italy will win soccer’s World Cup the next time the competition is held.
c) the sum of the faces of two dice will be 7.
d) the train taking a commuter to work will be more than 10 minutes late.
2. A test contains two multiple-choice questions. If a student makes a random guess to answer each question, how many outcomes are possible? Draw a tree diagram for this experiment. (Hint: Consider two outcomes for each question – either the answer is correct or it is wrong).
3. Refer to question 1. List all the outcomes included in each of the following events and mention which are simple and which are compound events.
a) Both answers are correct.
b) At most one answer is wrong.
c) The first answer is correct and the second is wrong.
d) Exactly one answer is wrong.
4. State whether the following events are independent or dependent.
a) Getting a raise in salary and purchasing a new car.
b) Having a large shoe size and having a high IQ.
c) A father being left-handed and a daughter being left-handed.
d) Eating an excessive amount of ice cream and smoking an excessive amount
of cigarettes.
5. 88% of American children are covered by some type of health insurance. If four children are selected at random, what is the probability that none are covered?
6. A box of nine golf gloves contains two left-handed gloves and seven right-handed gloves.
a) If two gloves are randomly selected from the box without replacement, what is
the probability that both gloves selected will be right-handed?
b) If three gloves are randomly selected from the box without replacement, what
is the probability that all three will be left-handed?
c) If three gloves are randomly selected from the box without replacement, what
is the probability that at least one glove will be right-handed?
Chapter 3: Introduction to Probability 23
SQQS1013 Elementary Statistics
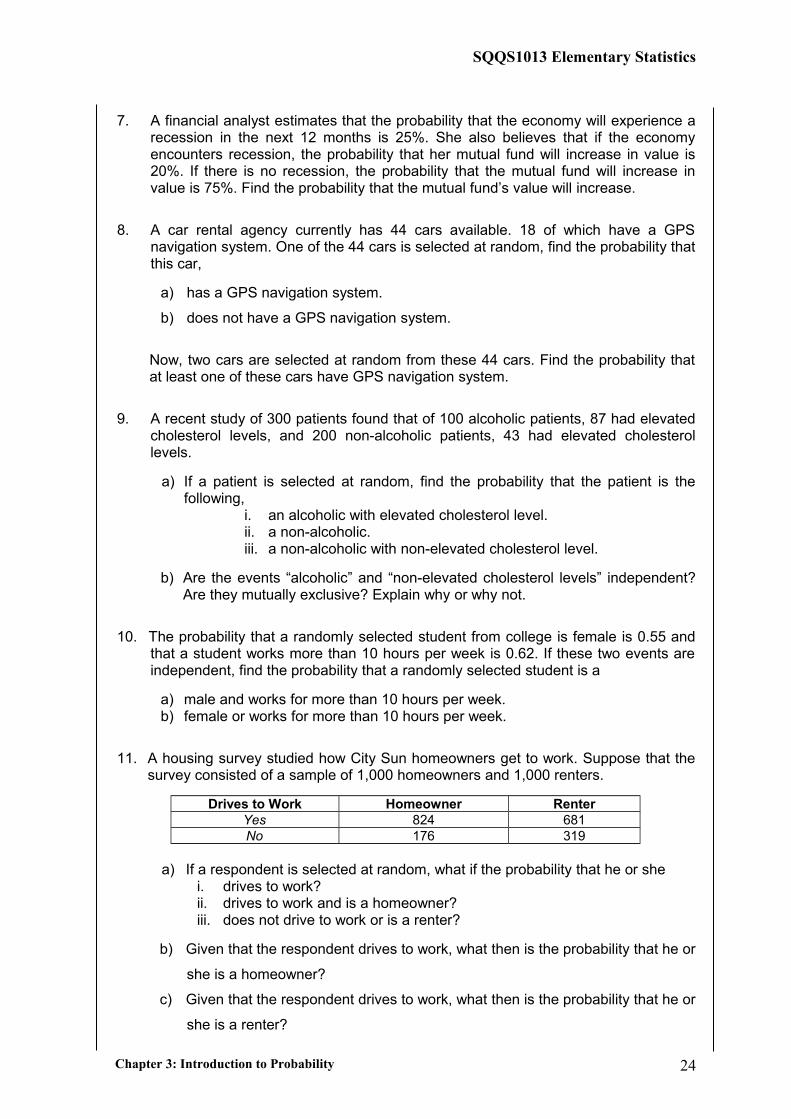
7. A financial analyst estimates that the probability that the economy will experience a recession in the next 12 months is 25%. She also believes that if the economy encounters recession, the probability that her mutual fund will increase in value is 20%. If there is no recession, the probability that the mutual fund will increase in value is 75%. Find the probability that the mutual fund’s value will increase.
8. A car rental agency currently has 44 cars available. 18 of which have a GPS navigation system. One of the 44 cars is selected at random, find the probability that this car,
a) has a GPS navigation system.
b) does not have a GPS navigation system.
Now, two cars are selected at random from these 44 cars. Find the probability that at least one of these cars have GPS navigation system.
9. A recent study of 300 patients found that of 100 alcoholic patients, 87 had elevated cholesterol levels, and 200 non-alcoholic patients, 43 had elevated cholesterol levels.
a) If a patient is selected at random, find the probability that the patient is the following,
i. an alcoholic with elevated cholesterol level.ii. a non-alcoholic.iii. a non-alcoholic with non-elevated cholesterol level.
b) Are the events “alcoholic” and “non-elevated cholesterol levels” independent? Are they mutually exclusive? Explain why or why not.
10. The probability that a randomly selected student from college is female is 0.55 and that a student works more than 10 hours per week is 0.62. If these two events are independent, find the probability that a randomly selected student is a
a) male and works for more than 10 hours per week.b) female or works for more than 10 hours per week.
11. A housing survey studied how City Sun homeowners get to work. Suppose that the survey consisted of a sample of 1,000 homeowners and 1,000 renters.
Drives to Work Homeowner RenterYes 824 681No 176 319
a) If a respondent is selected at random, what if the probability that he or shei. drives to work?ii. drives to work and is a homeowner?iii. does not drive to work or is a renter?
b) Given that the respondent drives to work, what then is the probability that he or
she is a homeowner?
c) Given that the respondent drives to work, what then is the probability that he or
she is a renter?
Chapter 3: Introduction to Probability 24
SQQS1013 Elementary Statistics
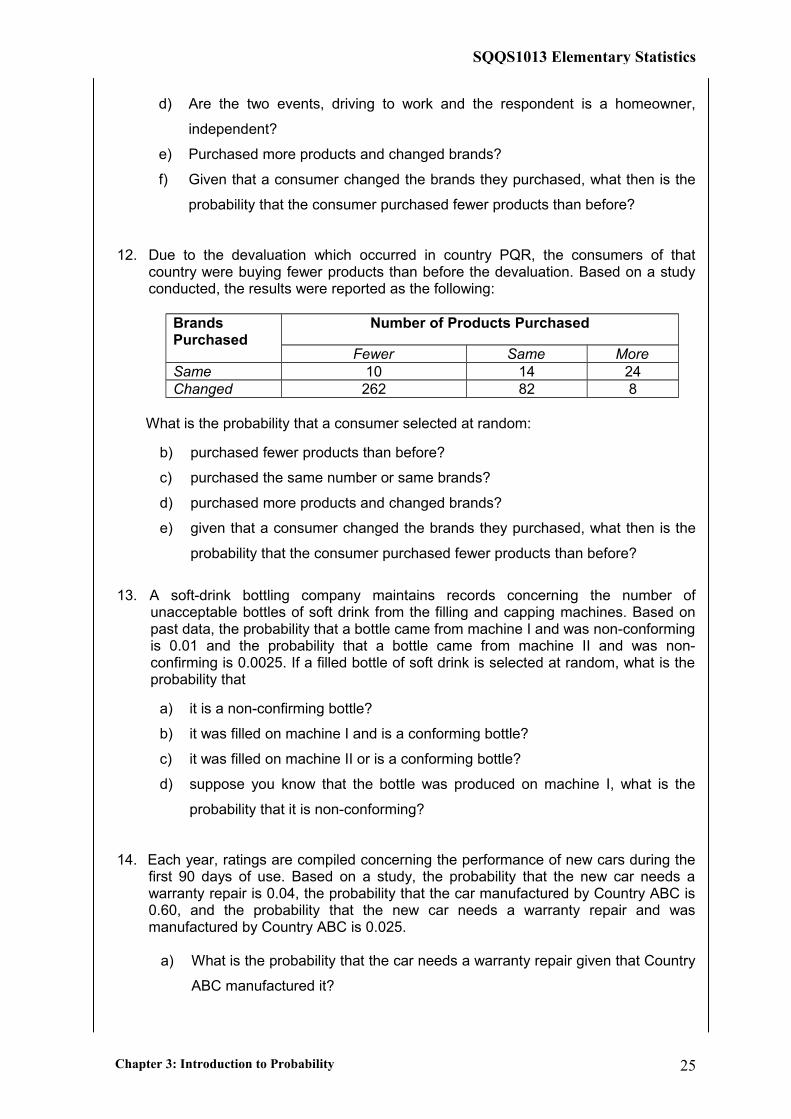
d) Are the two events, driving to work and the respondent is a homeowner,
independent?
e) Purchased more products and changed brands?
f) Given that a consumer changed the brands they purchased, what then is the
probability that the consumer purchased fewer products than before?
12. Due to the devaluation which occurred in country PQR, the consumers of that country were buying fewer products than before the devaluation. Based on a study conducted, the results were reported as the following:
BrandsPurchased
Number of Products Purchased
Fewer Same MoreSame 10 14 24Changed 262 82 8
What is the probability that a consumer selected at random:
b) purchased fewer products than before?
c) purchased the same number or same brands?
d) purchased more products and changed brands?
e) given that a consumer changed the brands they purchased, what then is the
probability that the consumer purchased fewer products than before?
13. A soft-drink bottling company maintains records concerning the number of unacceptable bottles of soft drink from the filling and capping machines. Based on past data, the probability that a bottle came from machine I and was non-conforming is 0.01 and the probability that a bottle came from machine II and was non-confirming is 0.0025. If a filled bottle of soft drink is selected at random, what is the probability that
a) it is a non-confirming bottle?
b) it was filled on machine I and is a conforming bottle?
c) it was filled on machine II or is a conforming bottle?
d) suppose you know that the bottle was produced on machine I, what is the
probability that it is non-conforming?
14. Each year, ratings are compiled concerning the performance of new cars during the first 90 days of use. Based on a study, the probability that the new car needs a warranty repair is 0.04, the probability that the car manufactured by Country ABC is 0.60, and the probability that the new car needs a warranty repair and was manufactured by Country ABC is 0.025.
a) What is the probability that the car needs a warranty repair given that Country
ABC manufactured it?
Chapter 3: Introduction to Probability 25
SQQS1013 Elementary Statistics
b) What is the probability that the car needs a warranty repair given that Country
ABC did not manufacture it?
c) Are need for a warranty repair and country manufacturing the car statistically independent?
15. CASTWAY is a direct selling company which has 350 authorized sale agents from all over the country. It is known that 168 of them are male. 40% of male sale agents has permanent job while half of female sale agents do not have permanent job.
a) Draw a tree diagram to illustrate the above events.
b) What is the probability that a randomly selected sale agent,
i. has permanent job?ii. is a male given that he does not have permanent job?
EXERCISE 2
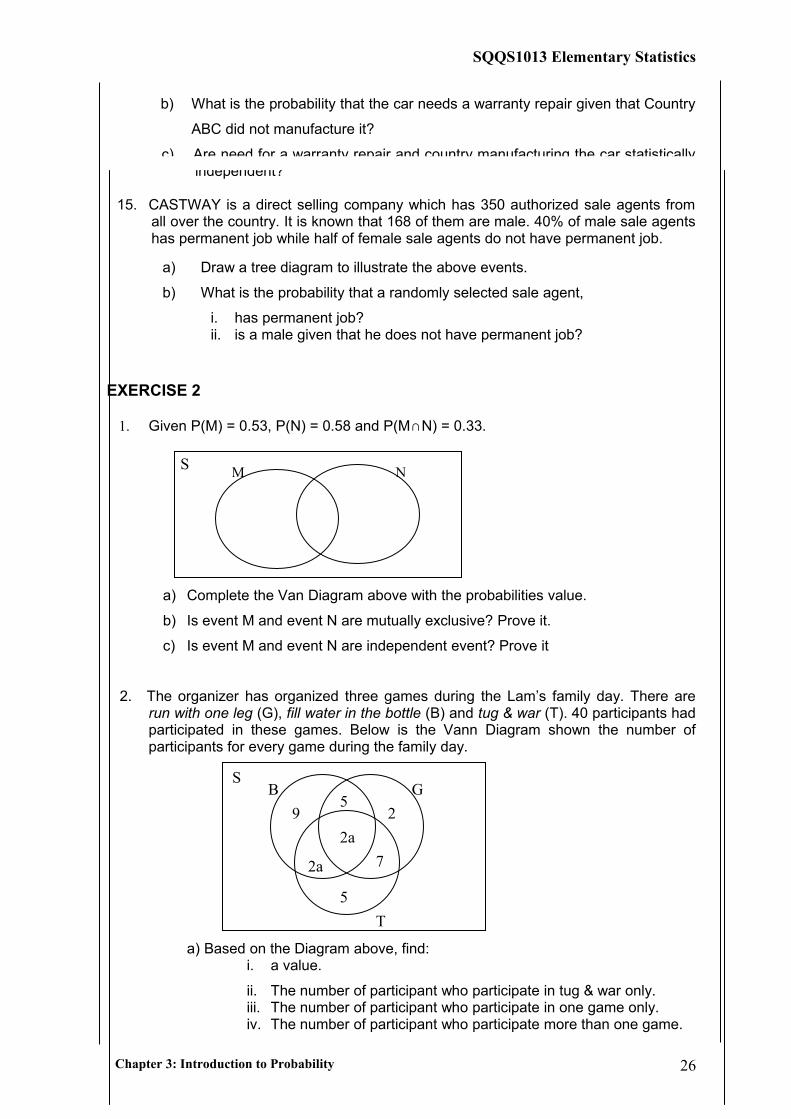
1. Given P(M) = 0.53, P(N) = 0.58 and P(M∩N) = 0.33.
a) Complete the Van Diagram above with the probabilities value.
b) Is event M and event N are mutually exclusive? Prove it.
c) Is event M and event N are independent event? Prove it
2. The organizer has organized three games during the Lam’s family day. There are run with one leg (G), fill water in the bottle (B) and tug & war (T). 40 participants had participated in these games. Below is the Vann Diagram shown the number of participants for every game during the family day.
a) Based on the Diagram above, find:i. a value.
ii. The number of participant who participate in tug & war only.iii. The number of participant who participate in one game only.iv. The number of participant who participate more than one game.
Chapter 3: Introduction to Probability 26
S M N
SB G
T
5
2a
9 2
2a 7
5
SQQS1013 Elementary Statistics
b) If one participant has been selected at random, find the probability the participant;
i. Participate in fill water in the bottle game and run with one leg game only.
ii. Participate in all gamesiii. Participate in tug & war game given he/she has participated in
run with one leg game.
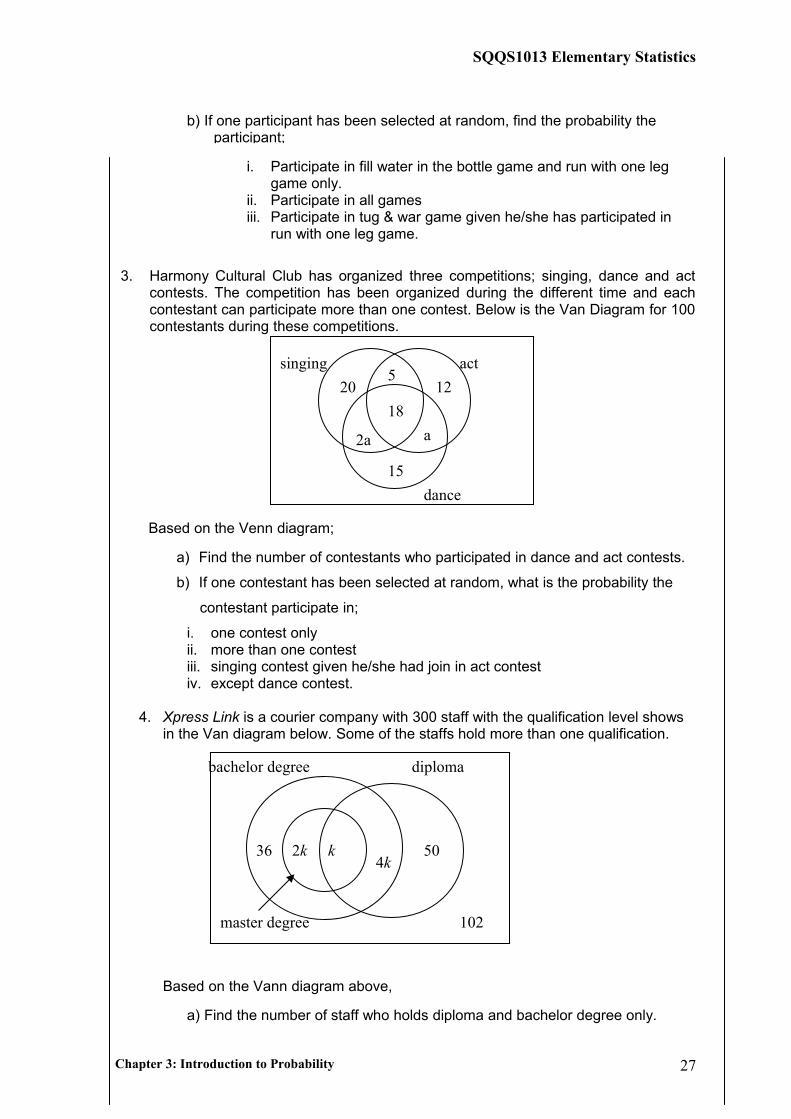
3. Harmony Cultural Club has organized three competitions; singing, dance and act contests. The competition has been organized during the different time and each contestant can participate more than one contest. Below is the Van Diagram for 100 contestants during these competitions.
Based on the Venn diagram;
a) Find the number of contestants who participated in dance and act contests.
b) If one contestant has been selected at random, what is the probability the
contestant participate in;
i. one contest onlyii. more than one contestiii. singing contest given he/she had join in act contestiv. except dance contest.
4. Xpress Link is a courier company with 300 staff with the qualification level shows in the Van diagram below. Some of the staffs hold more than one qualification.
Based on the Vann diagram above,
a) Find the number of staff who holds diploma and bachelor degree only.
Chapter 3: Introduction to Probability 27
singing act
dance
15
18
20 12
2a a
5
bachelor degree
master degree
diploma
36 2k4k
50k
102
SQQS1013 Elementary Statistics
b) What is the probability one staff who has been selected at random holds;i. qualifications except master degreeii. three qualifications.
c) Is the staff holds diploma and master degree is an independent event? Prove it.
5. Given P(A) = 0.3, P(B) = 0.6 and P (A ∩ B) = 0.2. Draw the Venn diagram to represents this statement. Then, find:
a) P(B’)
b) P(A ∪ B)
c) P(B|A)
d) P(A’ ∩ B)
e) Are A and B is mutually exclusive? Prove it.
6. 5% from the total radio sales at the Nora’s electric shop will be returned back for repair by the buyer because the malfunctions of the radio in first six month. Given two radios has been sold last week.
a) Draw the tree diagram to represent the above event.
b) Find the probability that:i. both radios will be return back for repairii. none of the radio has been returned back for repairiii. one of the radio will be returned back for repairiv. the second radio will be returned back for repair given the first
radio had been return for repair.
c) Are the events returning back both the radios for repair is independent event? Prove it.
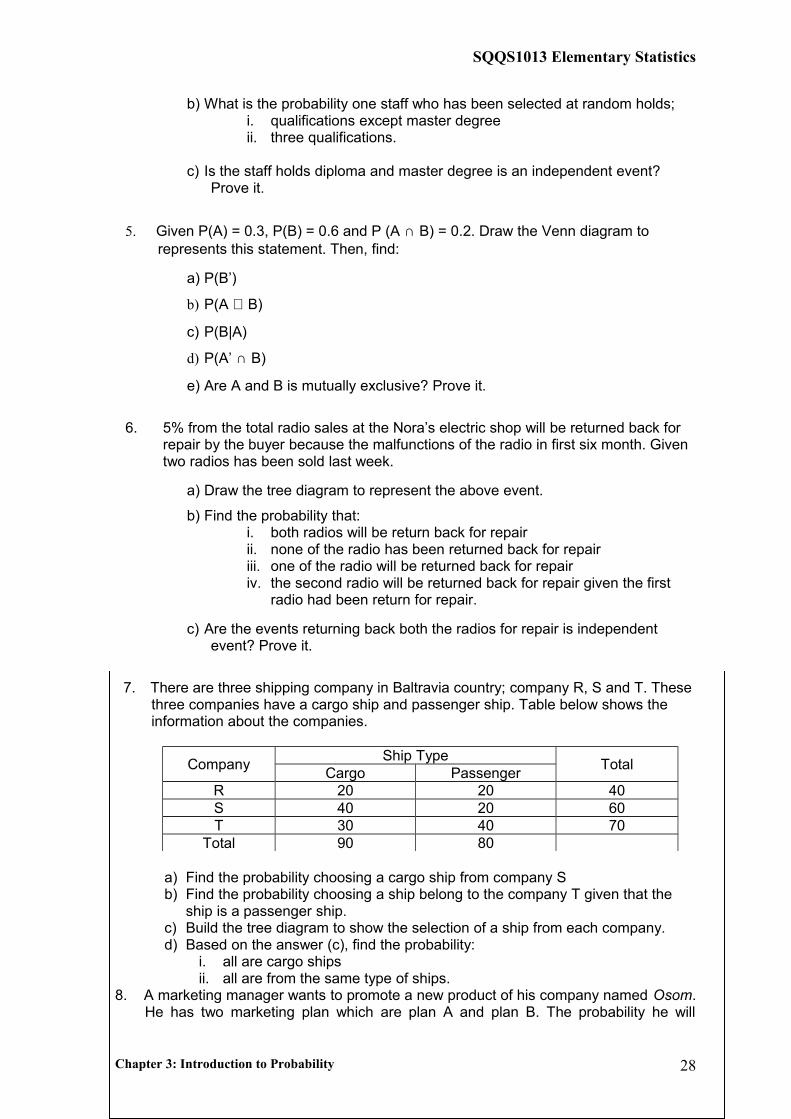
7. There are three shipping company in Baltravia country; company R, S and T. These three companies have a cargo ship and passenger ship. Table below shows the information about the companies.
CompanyShip Type
TotalCargo Passenger
R 20 20 40S 40 20 60T 30 40 70
Total 90 80
a) Find the probability choosing a cargo ship from company Sb) Find the probability choosing a ship belong to the company T given that the
ship is a passenger ship.c) Build the tree diagram to show the selection of a ship from each company.d) Based on the answer (c), find the probability:
i. all are cargo shipsii. all are from the same type of ships.
8. A marketing manager wants to promote a new product of his company named Osom. He has two marketing plan which are plan A and plan B. The probability he will
Chapter 3: Introduction to Probability 28
SQQS1013 Elementary Statistics
choose plan A is 1/3. The probability he does not succeed to promote the product when using plan A and plan B is 1/5 and 1/6.
a) Draw the tree diagram to represent the situation
b) What is the probability that he does not succeed to promote the product?
c) If he fails to promote the product, what is the probability he has used the
plan B?
9. Two shooters have been selected to represent Malaysia in USIA game. The probability the first shooter bid the target is ½ and the probability second shooter miss the target is 1/3. The game will be started by first shooter and followed by the second shooter. Draw the tree diagram to represent the events. Then, find the probability:
a) first shooter and second shooter bid the target
b) only one shooter bids the target
c) none of the shooter bid the target
Chapter 3: Introduction to Probability 29
SQQS1013 Elementary Statistics
Matrix No: ________________ Group: _________
TUTORIAL CHAPTER 3
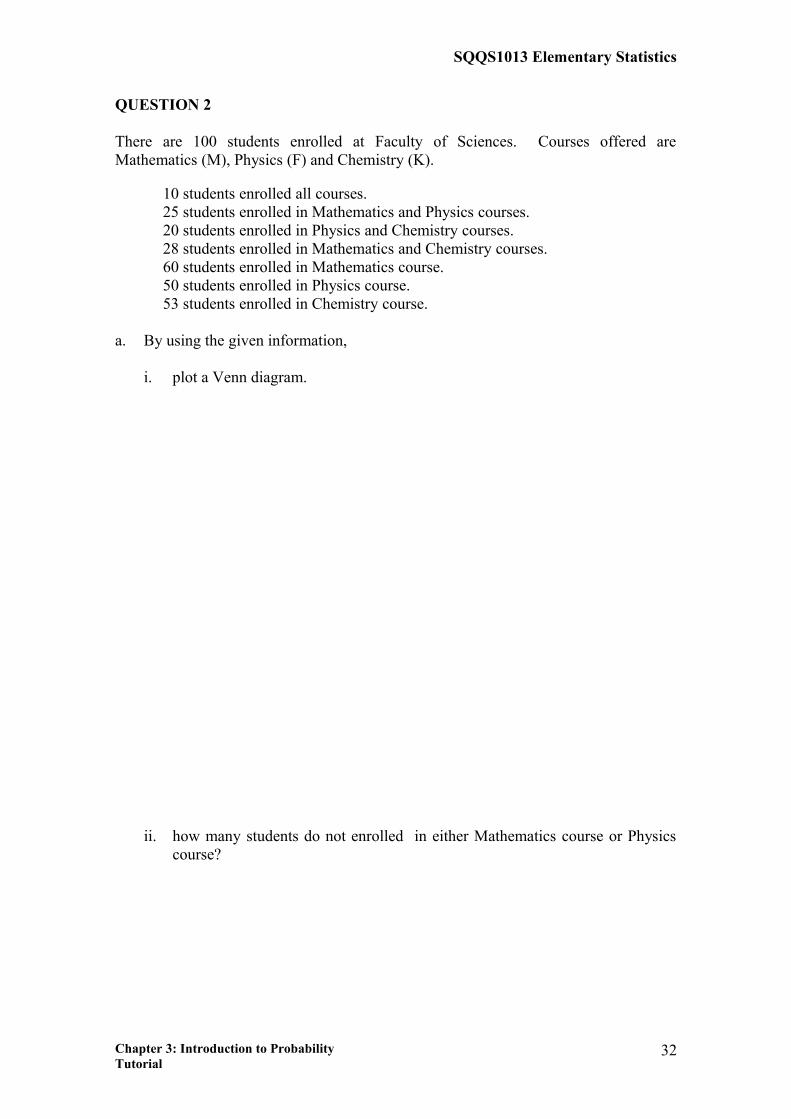
QUESTION 1Nora Kindergarten would like to conduct a Sport Day. TABLE 1 shows the number of children based on their sport’s group.
TABLE 1Group Boy (B) Girl (G) Total
Tuah (T) 60 70 130Jebat (J) 30 10 40Lekiu (L) 50 20 70
Total 140 100 240
a. If a child is selected at random, what is the probability that the child is:
i. in Tuah or Jebat group
ii. a boy and in Lekiu group
Chapter 3: Introduction to Probability Tutorial
30

SQQS1013 Elementary Statistics
iii. in group Jebat given that the child is a girl.
b. Are the event “female” and “Tuah” dependent? Prove it?
Chapter 3: Introduction to Probability Tutorial
31
SQQS1013 Elementary Statistics
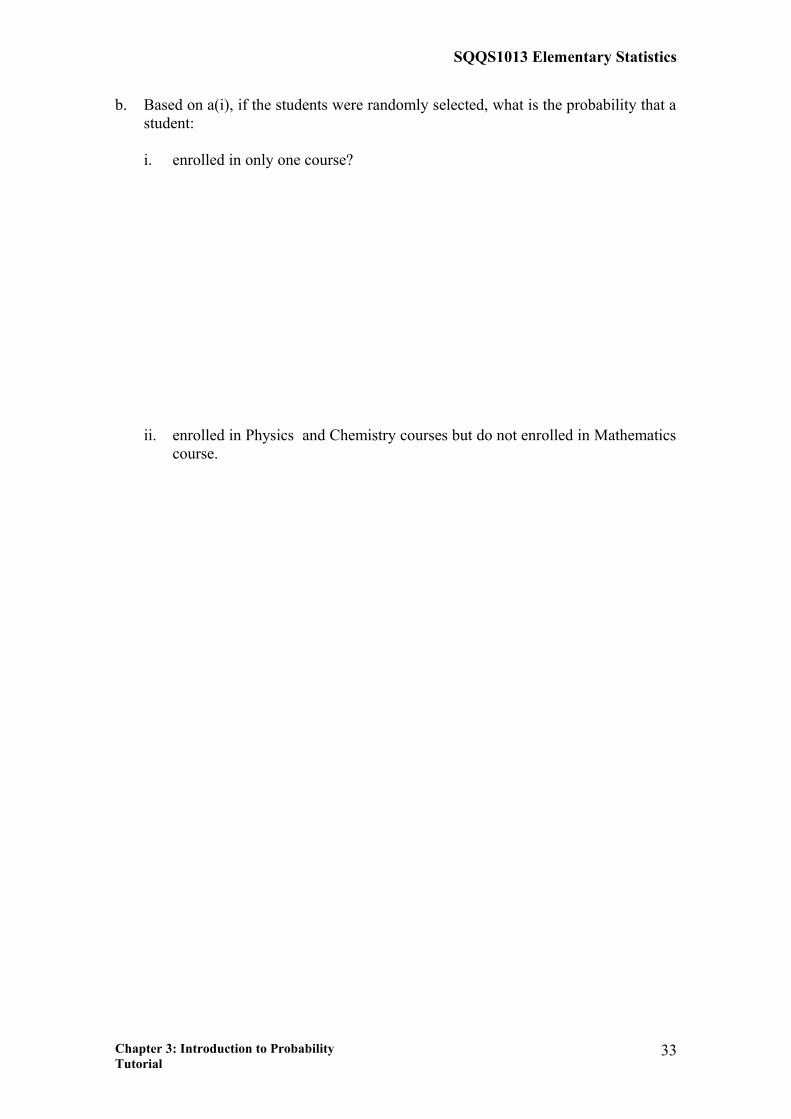
QUESTION 2
There are 100 students enrolled at Faculty of Sciences. Courses offered are Mathematics (M), Physics (F) and Chemistry (K).
10 students enrolled all courses.25 students enrolled in Mathematics and Physics courses.20 students enrolled in Physics and Chemistry courses.28 students enrolled in Mathematics and Chemistry courses.60 students enrolled in Mathematics course.50 students enrolled in Physics course.53 students enrolled in Chemistry course.
a. By using the given information,
i. plot a Venn diagram.
ii. how many students do not enrolled in either Mathematics course or Physics course?
Chapter 3: Introduction to Probability Tutorial
32
SQQS1013 Elementary Statistics
b. Based on a(i), if the students were randomly selected, what is the probability that a student:
i. enrolled in only one course?
ii. enrolled in Physics and Chemistry courses but do not enrolled in Mathematics course.
Chapter 3: Introduction to Probability Tutorial
33