Embed Size (px)
Citation preview
CROSS-CLASSIFICATION22-01-2015
2:00 - 3:00 PM
Selvarasu A MutharasuAnnamalai University
1. Nominal by Nominala. Adding layersb. Symmetric measuresc. Directional Measuresd. Relational Measure of Risk
2. Ordinal by Ordinal3. Measure of Agreement4. Display column proportion
Cross-Classification
Nominal by NominalSample SPSS File: satisf.sav
Ordinal by OrdinalSample File:
Cross classification
Nominal by Nominal
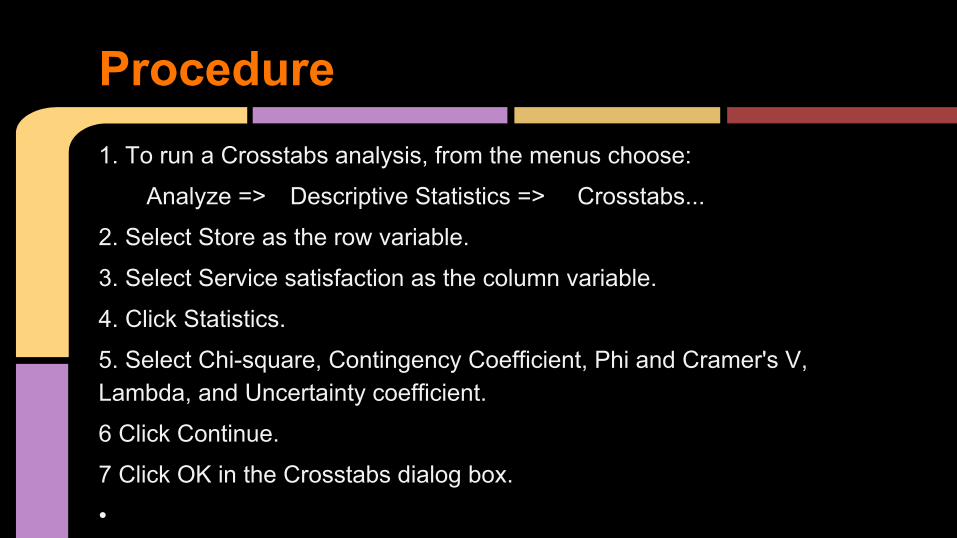
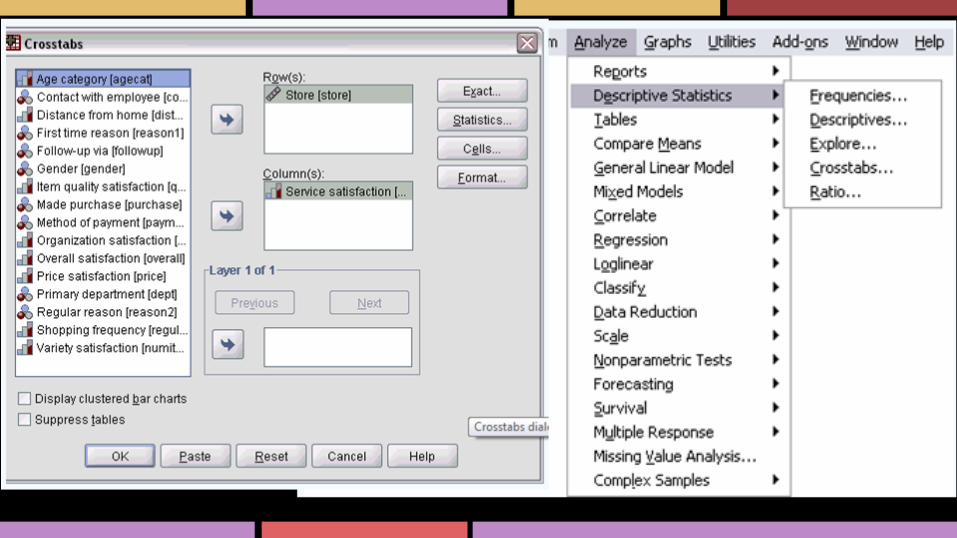
1. To run a Crosstabs analysis, from the menus choose:
Analyze => Descriptive Statistics => Crosstabs...
2. Select Store as the row variable.
3. Select Service satisfaction as the column variable.
4. Click Statistics.
5. Select Chi-square, Contingency Coefficient, Phi and Cramer's V, Lambda, and Uncertainty coefficient.
6 Click Continue.
7 Click OK in the Crosstabs dialog box.
•
Procedure


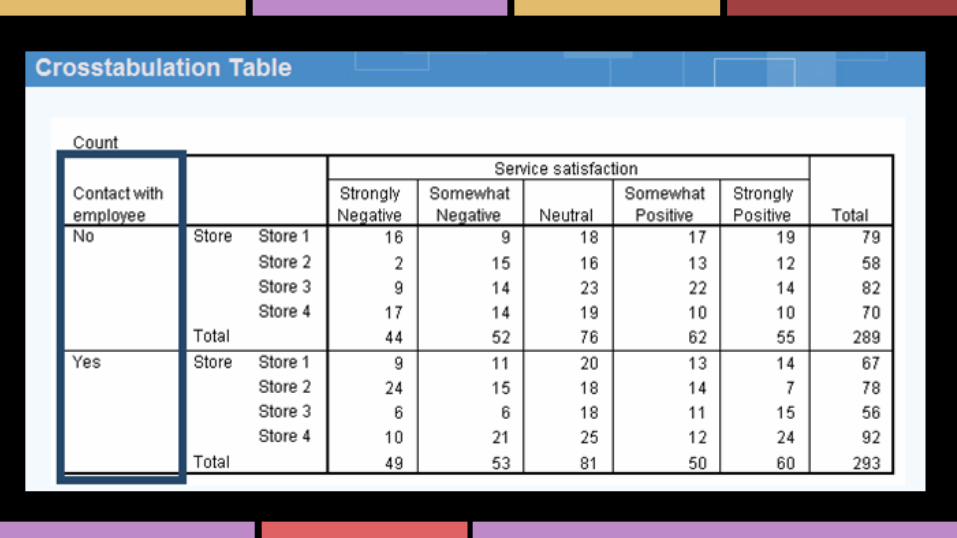
The cross-tabulation shows the frequency of each response at each store location.
If each store location provides a similar level of service, the pattern of responses should be similar across stores.
At each store, the majority of responses occur in the middle. Store 2 appears to have fewer satisfied customers.
Store 3 appears to have fewer dissatisfied customers.From the cross-tabulation alone, it's impossible to tell whether these differences are real or due to chance variation. Check the chi-square test to be sure.
Interpretation
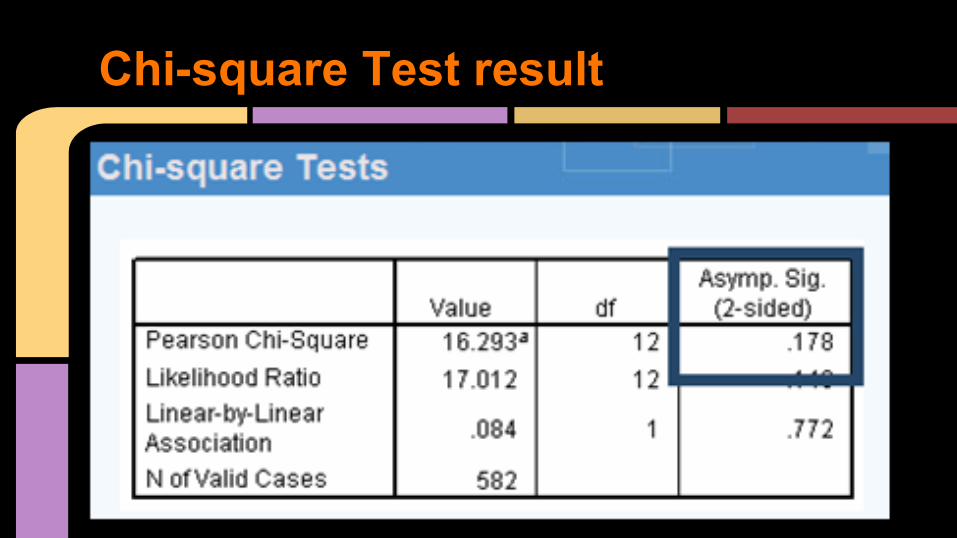
Chi-square Test result
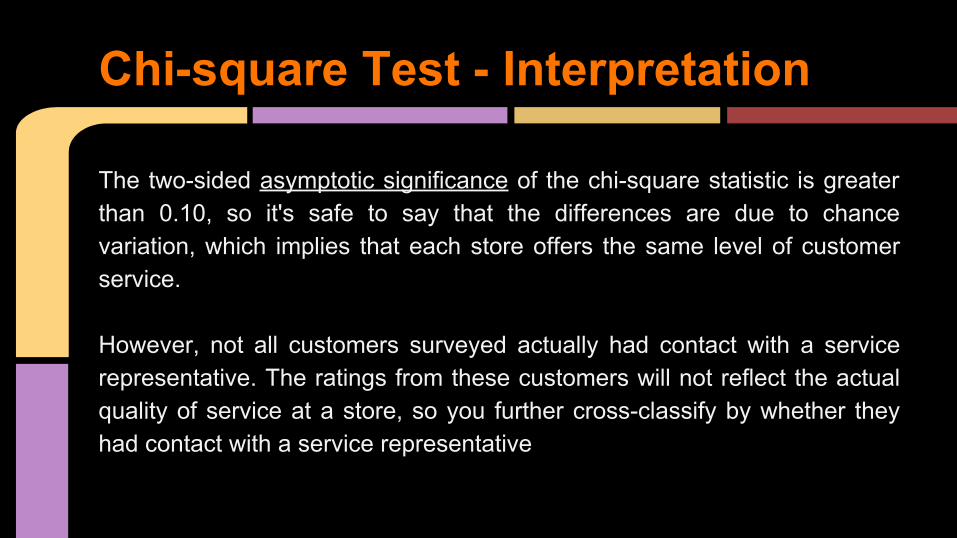
The two-sided asymptotic significance of the chi-square statistic is greater than 0.10, so it's safe to say that the differences are due to chance variation, which implies that each store offers the same level of customer service.
However, not all customers surveyed actually had contact with a service representative. The ratings from these customers will not reflect the actual quality of service at a store, so you further cross-classify by whether they had contact with a service representative
Chi-square Test - Interpretation

Adding Layers
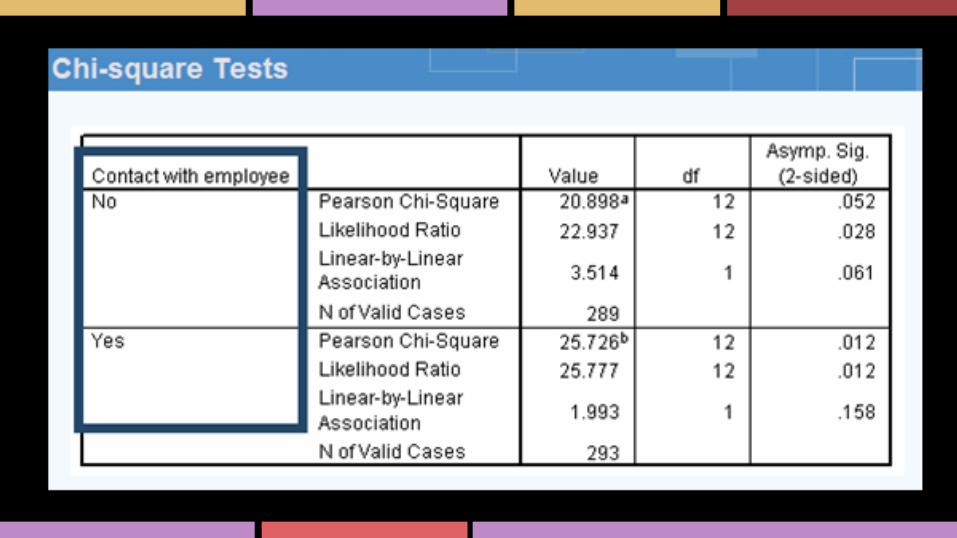
The chi-square test is performed separately for customers who did and did not have contact with a store representative. The significance value of the test for customers who did not have contact is 0.052. This is suggestive, but not conclusive, evidence of a relationship between Store and Service satisfaction for these customers. While not directly related to the quality of service given by your employees, you might consider a separate analysis of these customers to determine if there is some other factor that accounts for this relationship. The significance value of the test for customers who had contact with an employee is 0.012. Since this value is less than 0.05, you can conclude that the relationship observed in the crosstabulation is real and not due to chance.
Chi-square test With Layers

Symmetric Measures

While the chi-square test is useful for determining whether there is a relationship, it doesn't tell you the strength of the relationship. Symmetric measures attempt to quantify this.Symmetric measures are reported separately for customers who did and did not have contact with a store representative. These measures are based on the chi-square statistic.
Symmetric Measures
Phi is the ratio of the chi-square statistic to the weighted total number of observations. It is the most "optimistic" of the symmetric measures, and unlike most association measures, does not have a theoretical upper bound when either of the variables has more than two categories.
Phi
Cramer's V is a rescaling of phi so that its maximum possible value is always 1. As the number of rows and columns increases, Cramer's V becomes more conservative with respect to phi.
Cramer’s V
The contingency coefficient takes values between 0 and SQRT[(k-1)/k], where k = the number of rows or columns, whichever is smaller. It becomes more conservative with respect to phi as the associations between the variables become stronger.
The Contingency Co-efficient
The significance values of all three measures are 0.012, indicating a statistically significant relationship. However, the values of all three measures are under 0.3, so although the relationship is not due to chance, it is also not very strong.
Interpretation of results

Directional Measures Nominal
Lambda defines error as the misclassification of cases, and cases are classified according to the modal (most frequent) category.
Tau defines error as the misclassification of a case, and cases are classified into category j with probability equal to the observed frequency of category j.
The uncertainty coefficient defines error as the entropy, or P(category j) * ln(P(category j)) summed over the categories of the variable. The uncertainty coefficient is also known as Theil's U.
For customers who had contact, the Goodman and Kruskal's tau value of 0.031 with Store dependent means that there is a 3.1% reduction in misclassification.
The other measures report equally small values, indicating that the association between Store and Service satisfaction is almost solely due to the poor service at store 2.
Directional Measures Nominals
Ordinal by Ordinal Cross-Classifications
Concordant A pairwise comparison is considered concordant if the case with the larger value in the row variable also has the larger value in the column variable. Concordance implies a positive association between the row and column variables.
Discordant A pairwise comparison is considered discordant if the case with the larger value in the row variable has the smaller value in the column variable. Discordance implies a negative association between the row and column variables.
Ordinal by Ordinal Concordant - Discordant-Tied
Gamma is P(concordant) - P(discordant), ignoring comparisons that are tied. Somer's d decreases with as the tied comparisonon one variable increases.
Tau-b: It decreases with respect to gamma as the number of comparisons tied on one variable increases.Tau-c does not have a simple interpretation. Tau-c may be preferable to tau-b when the numbers of categories in the row and column variables are not equal.
Directional and Symmetric Ordinal