Embed Size (px)
Citation preview
International Workshop
“Soil Spectroscopy: the present and future of Soil Monitoring”
FAO HQ, Rome, Italy, 4-6 December 2013
Dr. Fabrício da Silva Terra
Dr. José Alexandre Melo Demattê
Dr. Raphael Viscarra Rossel
Spectral data fusion for quantitative assessment
of soils from Brazil
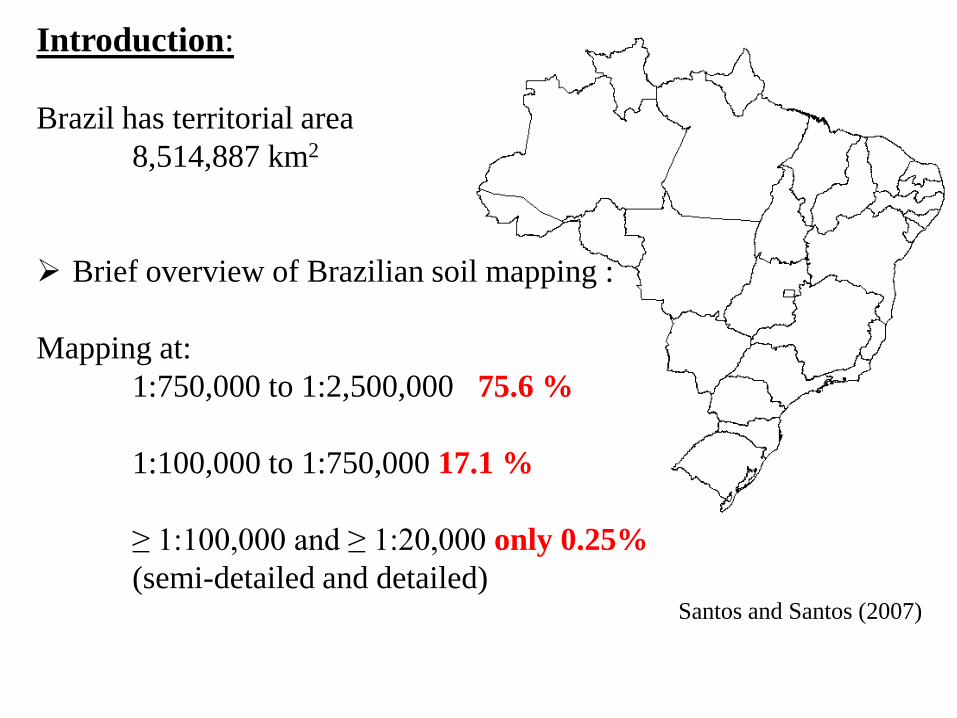
Introduction:
Brazil has territorial area
8,514,887 km2
Brief overview of Brazilian soil mapping :
Mapping at:
1:750,000 to 1:2,500,000 75.6 %
1:100,000 to 1:750,000 17.1 %
≥ 1:100,000 and ≥ 1:20,000 only 0.25%
(semi-detailed and detailed)Santos and Santos (2007)
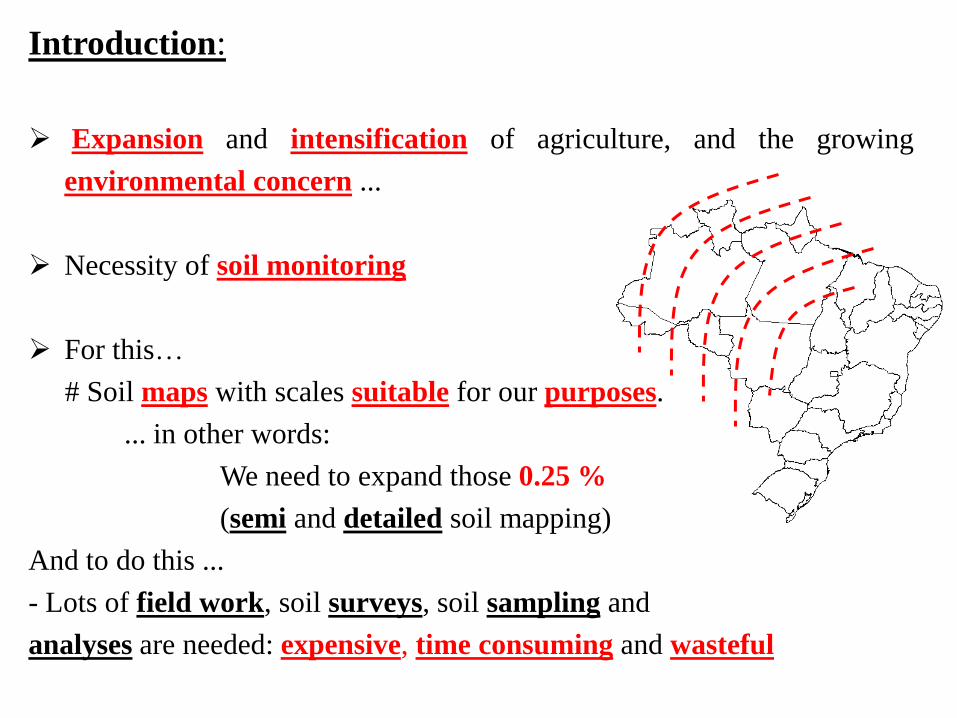
Introduction:
Expansion and intensification of agriculture, and the growing
environmental concern ...
Necessity of soil monitoring
For this…
# Soil maps with scales suitable for our purposes.
... in other words:
We need to expand those 0.25 %
(semi and detailed soil mapping)
And to do this ...
- Lots of field work, soil surveys, soil sampling and
analyses are needed: expensive, time consuming and wasteful
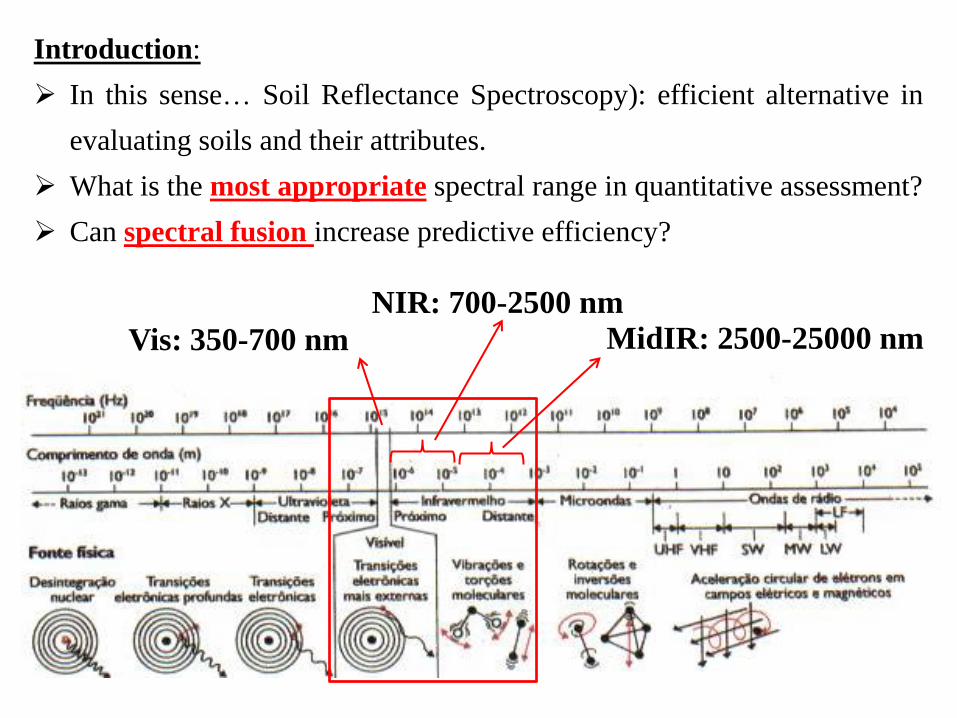
Introduction:
In this sense… Soil Reflectance Spectroscopy): efficient alternative in
evaluating soils and their attributes.
What is the most appropriate spectral range in quantitative assessment?
Can spectral fusion increase predictive efficiency?
Vis: 350-700 nm
NIR: 700-2500 nm
MidIR: 2500-25000 nm
Aims:
- To compare the predictions of clay content (CC), soil organic
carbon (SOC) and sum of bases (SB = Ca2+ + Mg2+ + K+) based on
individual and combined spectral ranges from visible to near-
infrared (VisNIR: 350 to 2500 nm) e from mid-infrared (MIR: 4000
to 400 cm-1)
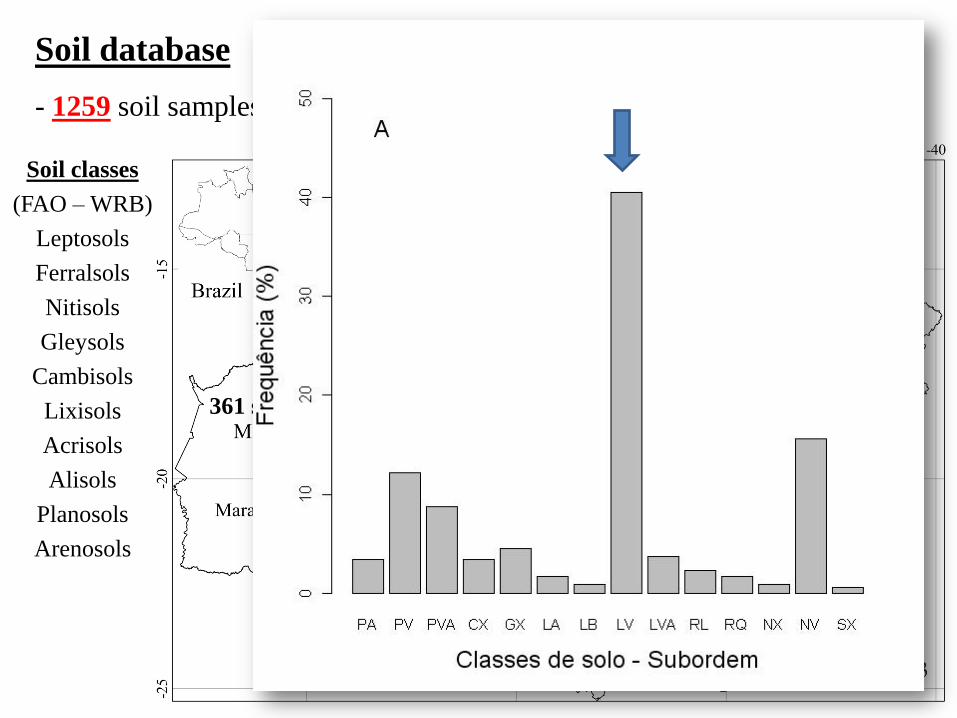
Soil database
- 1259 soil samples (≠ horizons from 396 soil profiles);
605 samples
219 samples74 samples
361 samples
Soil classes
(FAO – WRB)
Leptosols
Ferralsols
Nitisols
Gleysols
Cambisols
Lixisols
Acrisols
Alisols
Planosols
Arenosols
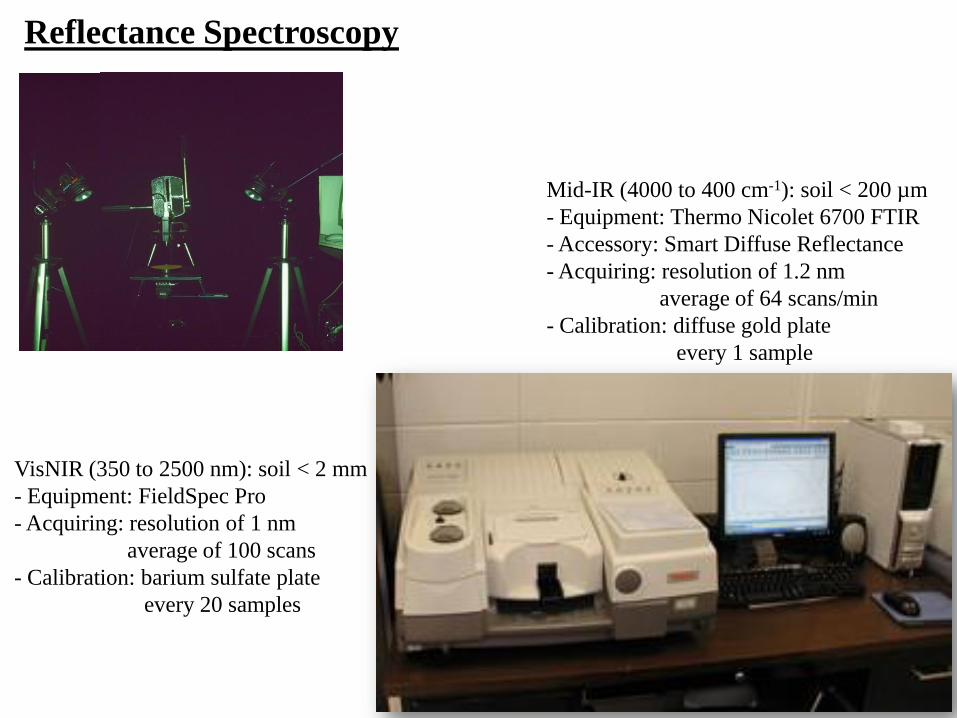
Reflectance Spectroscopy
VisNIR (350 to 2500 nm): soil < 2 mm
- Equipment: FieldSpec Pro
- Acquiring: resolution of 1 nm
average of 100 scans
- Calibration: barium sulfate plate
every 20 samples
Mid-IR (4000 to 400 cm-1): soil < 200 µm
- Equipment: Thermo Nicolet 6700 FTIR
- Accessory: Smart Diffuse Reflectance
- Acquiring: resolution of 1.2 nm
average of 64 scans/min
- Calibration: diffuse gold plate
every 1 sample
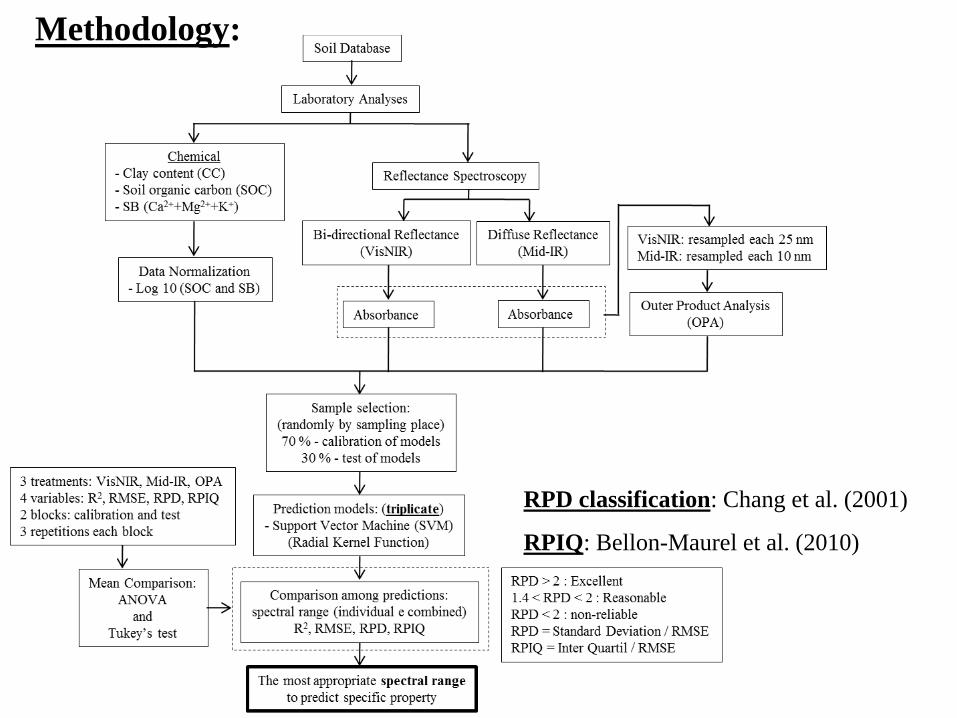
Methodology:
RPD classification: Chang et al. (2001)
RPIQ: Bellon-Maurel et al. (2010)
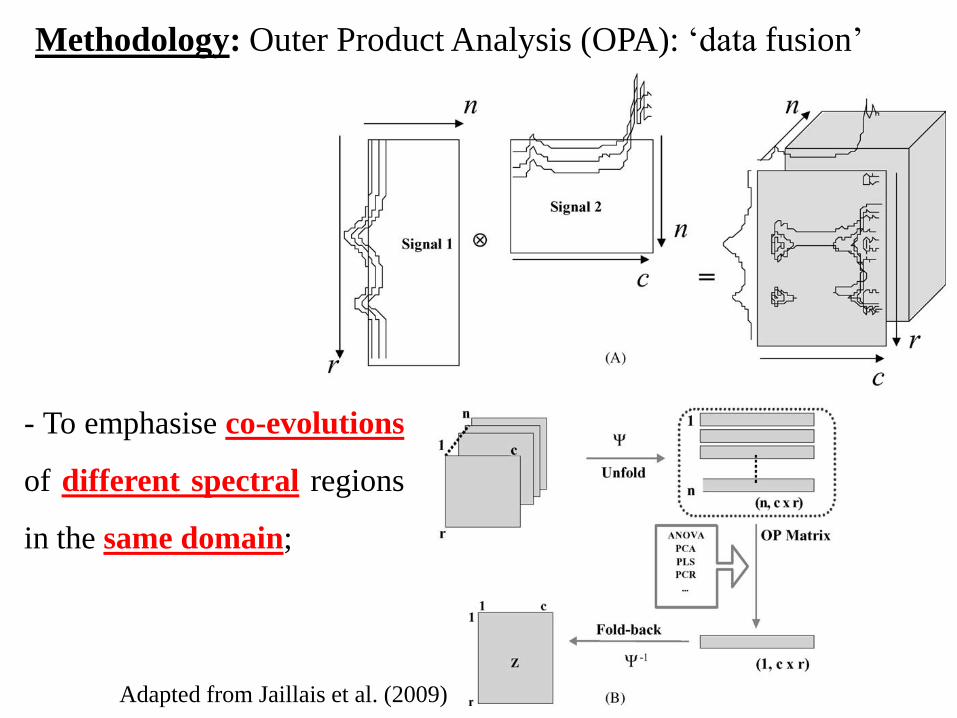
- To emphasise co-evolutions
of different spectral regions
in the same domain;
Methodology: Outer Product Analysis (OPA): „data fusion‟
Adapted from Jaillais et al. (2009)
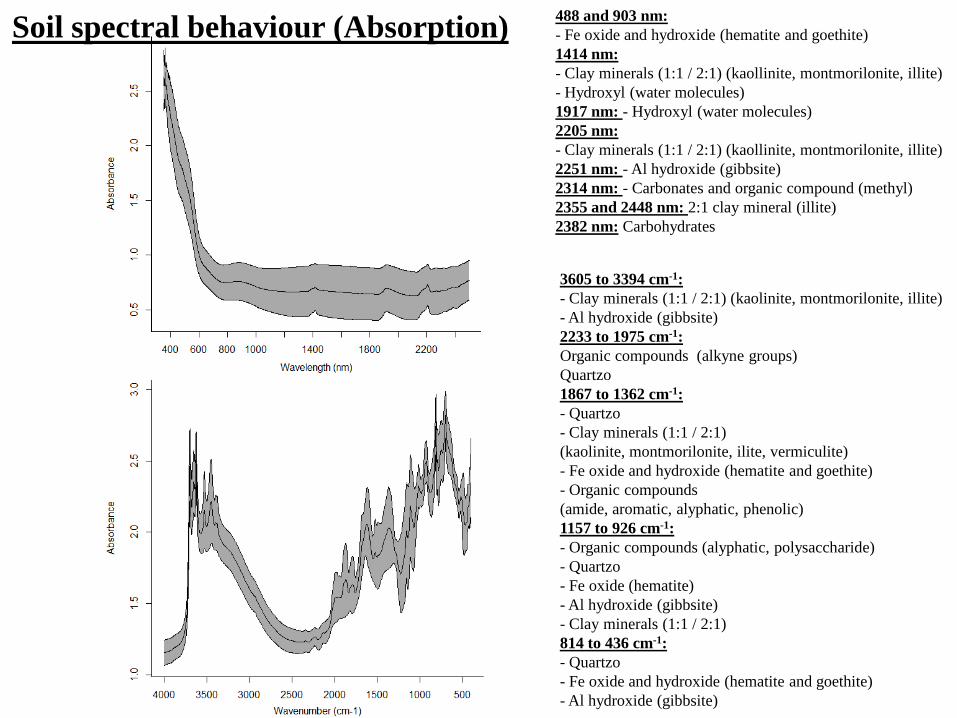
3605 to 3394 cm-1:
- Clay minerals (1:1 / 2:1) (kaolinite, montmorilonite, illite)
- Al hydroxide (gibbsite)
2233 to 1975 cm-1:
Organic compounds (alkyne groups)
Quartzo
1867 to 1362 cm-1:
- Quartzo
- Clay minerals (1:1 / 2:1)
(kaolinite, montmorilonite, ilite, vermiculite)
- Fe oxide and hydroxide (hematite and goethite)
- Organic compounds
(amide, aromatic, alyphatic, phenolic)
1157 to 926 cm-1:
- Organic compounds (alyphatic, polysaccharide)
- Quartzo
- Fe oxide (hematite)
- Al hydroxide (gibbsite)
- Clay minerals (1:1 / 2:1)
814 to 436 cm-1:
- Quartzo
- Fe oxide and hydroxide (hematite and goethite)
- Al hydroxide (gibbsite)
488 and 903 nm:
- Fe oxide and hydroxide (hematite and goethite)
1414 nm:
- Clay minerals (1:1 / 2:1) (kaollinite, montmorilonite, illite)
- Hydroxyl (water molecules)
1917 nm: - Hydroxyl (water molecules)
2205 nm:
- Clay minerals (1:1 / 2:1) (kaollinite, montmorilonite, illite)
2251 nm: - Al hydroxide (gibbsite)
2314 nm: - Carbonates and organic compound (methyl)
2355 and 2448 nm: 2:1 clay mineral (illite)
2382 nm: Carbohydrates
Soil spectral behaviour (Absorption)
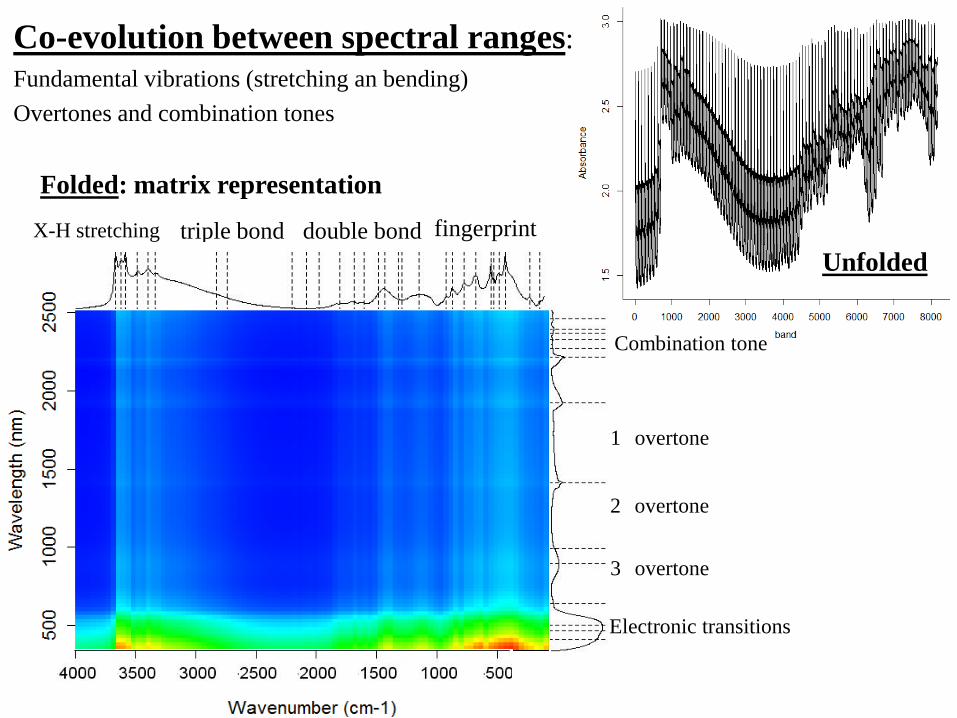
Co-evolution between spectral ranges:
Fundamental vibrations (stretching an bending)
Overtones and combination tones
fingerprintX-H stretching triple bond double bond
Unfolded
Folded: matrix representation
Electronic transitions
3 overtone
2 overtone
1 overtone
Combination tone
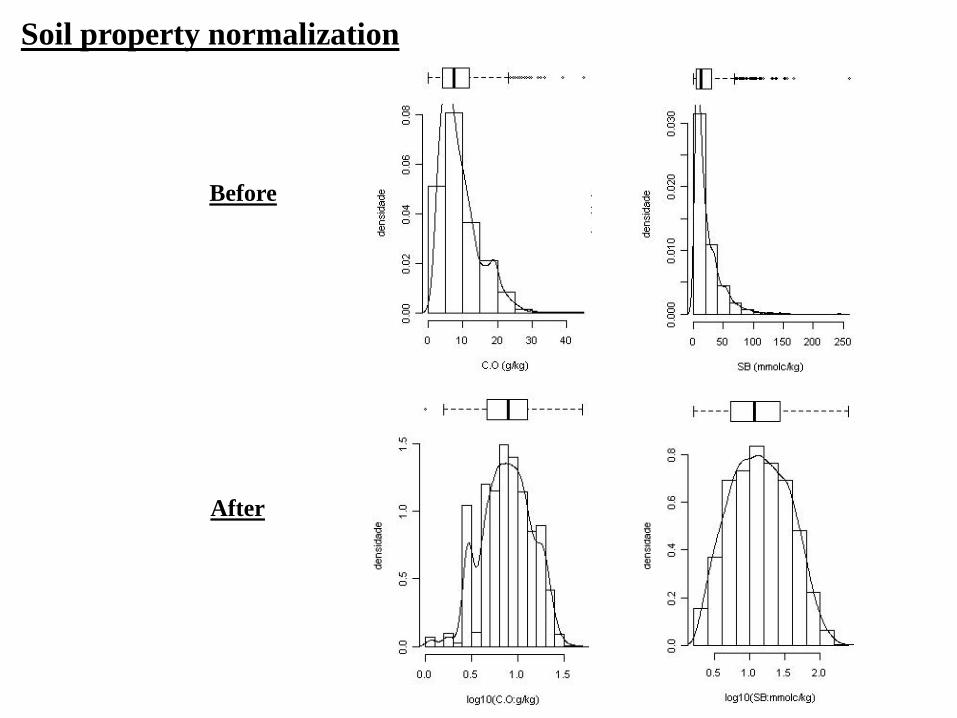
Soil property normalization
Before
After
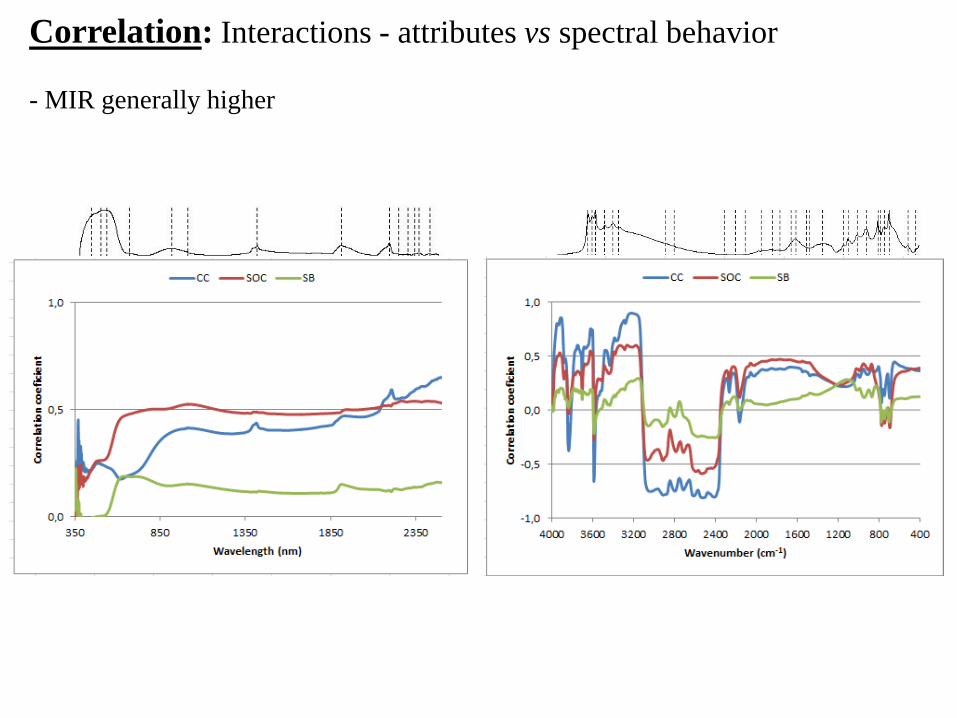
Correlation: Interactions - attributes vs spectral behavior
- MIR generally higher
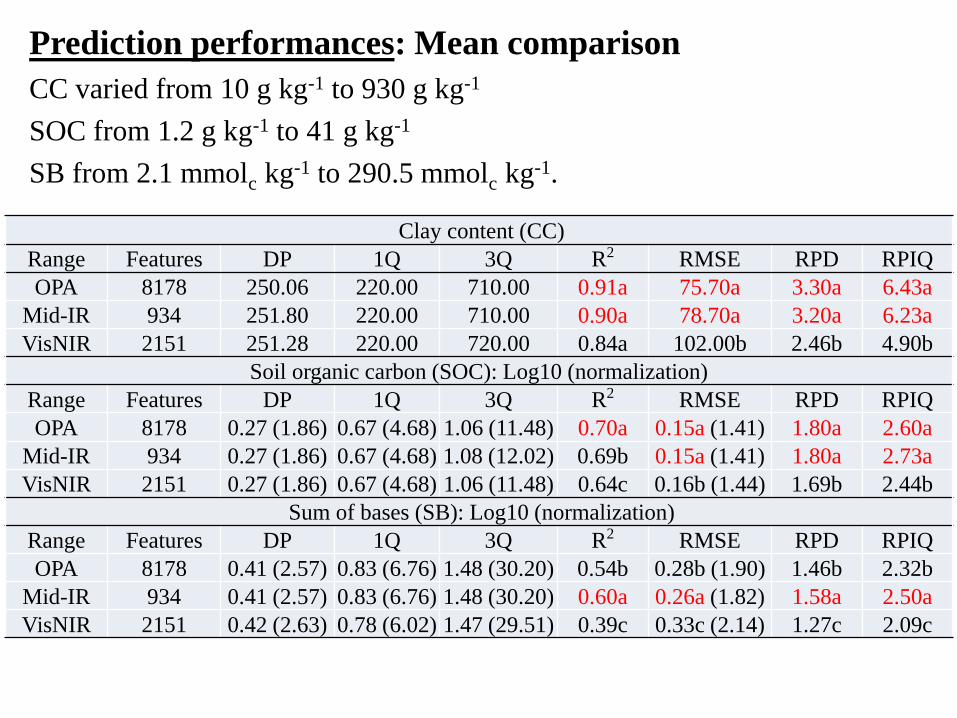
Prediction performances: Mean comparison
CC varied from 10 g kg-1 to 930 g kg-1
SOC from 1.2 g kg-1 to 41 g kg-1
SB from 2.1 mmolc kg-1 to 290.5 mmolc kg-1.
Clay content (CC)
Range Features DP 1Q 3Q R2 RMSE RPD RPIQ
OPA 8178 250.06 220.00 710.00 0.91a 75.70a 3.30a 6.43a
Mid-IR 934 251.80 220.00 710.00 0.90a 78.70a 3.20a 6.23a
VisNIR 2151 251.28 220.00 720.00 0.84a 102.00b 2.46b 4.90b
Soil organic carbon (SOC): Log10 (normalization)
Range Features DP 1Q 3Q R2 RMSE RPD RPIQ
OPA 8178 0.27 (1.86) 0.67 (4.68) 1.06 (11.48) 0.70a 0.15a (1.41) 1.80a 2.60a
Mid-IR 934 0.27 (1.86) 0.67 (4.68) 1.08 (12.02) 0.69b 0.15a (1.41) 1.80a 2.73a
VisNIR 2151 0.27 (1.86) 0.67 (4.68) 1.06 (11.48) 0.64c 0.16b (1.44) 1.69b 2.44b
Sum of bases (SB): Log10 (normalization)
Range Features DP 1Q 3Q R2 RMSE RPD RPIQ
OPA 8178 0.41 (2.57) 0.83 (6.76) 1.48 (30.20) 0.54b 0.28b (1.90) 1.46b 2.32b
Mid-IR 934 0.41 (2.57) 0.83 (6.76) 1.48 (30.20) 0.60a 0.26a (1.82) 1.58a 2.50a
VisNIR 2151 0.42 (2.63) 0.78 (6.02) 1.47 (29.51) 0.39c 0.33c (2.14) 1.27c 2.09c
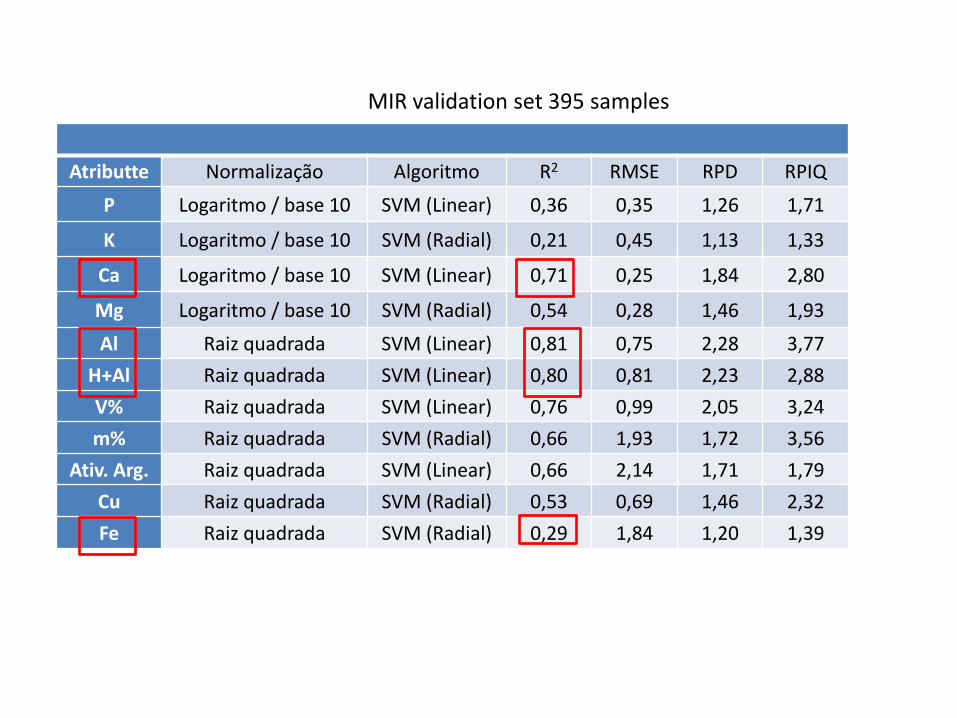
Atributte Normalização Algoritmo R2 RMSE RPD RPIQ
P Logaritmo / base 10 SVM (Linear) 0,36 0,35 1,26 1,71
K Logaritmo / base 10 SVM (Radial) 0,21 0,45 1,13 1,33
Ca Logaritmo / base 10 SVM (Linear) 0,71 0,25 1,84 2,80
Mg Logaritmo / base 10 SVM (Radial) 0,54 0,28 1,46 1,93
Al Raiz quadrada SVM (Linear) 0,81 0,75 2,28 3,77
H+Al Raiz quadrada SVM (Linear) 0,80 0,81 2,23 2,88
V% Raiz quadrada SVM (Linear) 0,76 0,99 2,05 3,24
m% Raiz quadrada SVM (Radial) 0,66 1,93 1,72 3,56
Ativ. Arg. Raiz quadrada SVM (Linear) 0,66 2,14 1,71 1,79
Cu Raiz quadrada SVM (Radial) 0,53 0,69 1,46 2,32
Fe Raiz quadrada SVM (Radial) 0,29 1,84 1,20 1,39
MIR validation set 395 samples
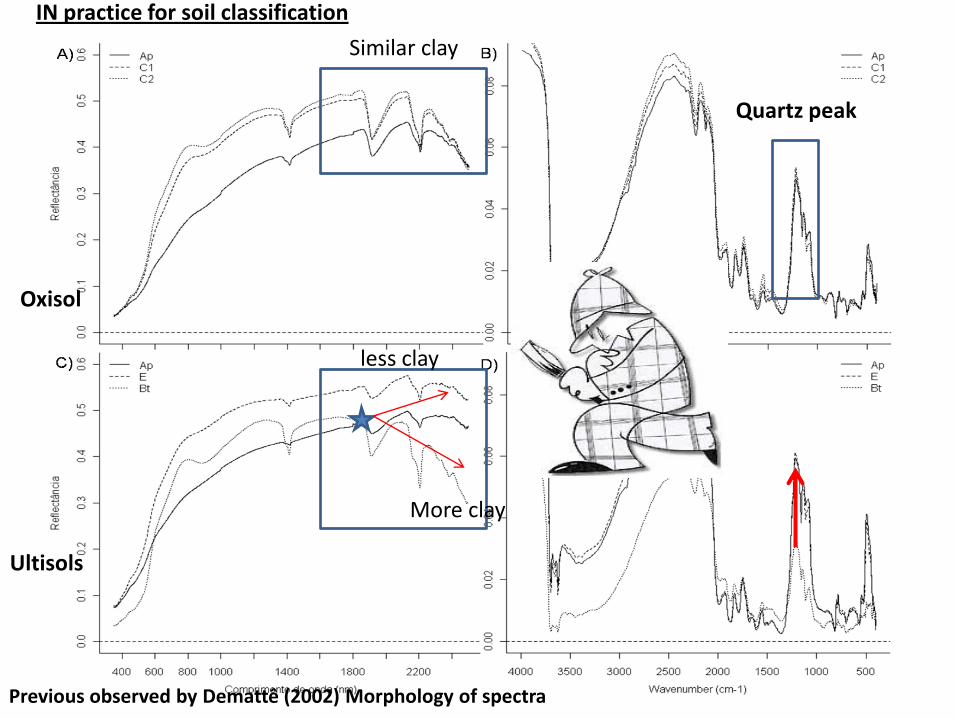
Oxisol
Ultisols
More clay
less clay
Similar clay
Quartz peak
IN practice for soil classification
Previous observed by Demattê (2002) Morphology of spectra
Conclusions:
Predictions by OPA were better for CC and SOC but the fusion did not
bring a considerable increase in the predictive efficiency (despite co-
evolutions and a large number of spectral features)
OPA may not be the best way to combine spectra of the same type
Other types of data fusion need to be tested
Mid-IR spectra are still the best option to quantitative assessment of
soil properties even for tropical soils
Both, Mid-IR and Vis-Nir can be used for assistence on soil
classification approachbo
University of São Paulo (USP), “Luiz de Queiroz” College of Agriculture
(ESALQ), Department of Soil Science (LSO)
Australian Commonwealth Scientific and Industrial Research
Organization (CSIRO)
National Council for Scientific and Technological Development (CNPq)
Coordination for the Improvement of Higher Education Personnel
(CAPES)
Acknowledgments