Embed Size (px)
Citation preview


SPECIAL CORE ANALYSIS• Presented to:
Dr. Nazir Ahmed • Presented by:
Muhammad Wajid Manzoor • Roll No:
09 Institute of Geology
Punjab University Lahore

SPECIAL CORE ANALYSIS• Special core analysis is a laboratory procedure for conducting flow
experiments on core.• Special core analysis separates from "routine or conventional core
analysis" by adding more experiments. • These experiments includes the measurements of two-phase
flow properties, determining relative permeability.

RELATIVE PERMEABILITY
• The relative permeability of a phase is a dimensionless measure of the effective permeability of that phase.• It is the ratio of the effective permeability of that phase to the absolute
permeability.


RELATIVE PERMEABILITY MEASUREMENTS
• In this method test sample is confined at the ends between samples having same properties.• The intimate contact is maintained between the three cores which
eliminate the capillary effects on test sample.• The saturation distribution of fluids in test sample will uniform during the
steady flow.

• The upstream plug also serves as mixing head for the injected fluids.• The cores are saturated with fluids to be displaced which is commonly oil
and the weight of test section is recorded.• A constant oil flow rate established such that the desired pressure drop
occurs.• After that oil flow rate is slightly reduced and the displacing fluids (water ,
gas) are injected in the sample at a sufficient rate to maintain this pressure drop.

• When input and outflow volumes are equal , equilibrium is established.• The oil rate decreased further and the gas , water flow increased
proportionally.• The porosity and relative permeability also measured before the test.

• A small core sample does not represent the average behavior of a reservoir.• For this purpose sufficient , properly selected cores are analyzed for
reasonable statistical sampling.• There are two fundamental factors on which effects the relative
permeability.1. Wettability alterations 2. Saturation history effects

WETTABILITY ALTERATIONS
• Laboratory flow test commonly conducted on the cores which are thoroughly cleaned and dried.• The test fluids used are mainly synthetic brines , air or nitrogen because
the use of actual reservoir fluids may introduced the severe problems.• Because the reservoir temperature and pressure are not simulated in the
laboratory so the wettability results of the normal laboratory system is accidently same as the reservoir.

• The alterations in wettability may change the relative permeability behavior of the sample.

• The wettability may be visualized in terms of contact angle.
• (A) Zero contact angle represents the complete wettability by water• (B) Intermediate wettabilities are indicated by angle between extremes
90.• (C) A contact angle of 180 denotes the complete wettability by oil.


SATURATION HISTORY EFFECTS
• Relative permeability is not a unique function of saturation but it depends on the direction from which saturation approaches.• The curve obtained by displacing oil with water is not same as those from
reverse processes.• There are two histories which are:1. Gas drive process 2. Water drive process

GAS DRIVE PROCESS
• Displacement of oil by gas, where oil is assumed as wetting phase. This is also known as drainage process.
WATER DRIVE PROCESS • Displacement of oil by water , where water is assumed as wetting phase.
CAPILLARY PRESSURE
• Capillary pressure is the difference between the ambient pressure and the pressure exerted by the column of liquid.• Capillarity is the phenomenon whereby liquid is drawn up a capillary tube.
• Meniscus is the curved upper surface of a liquid in a tube.

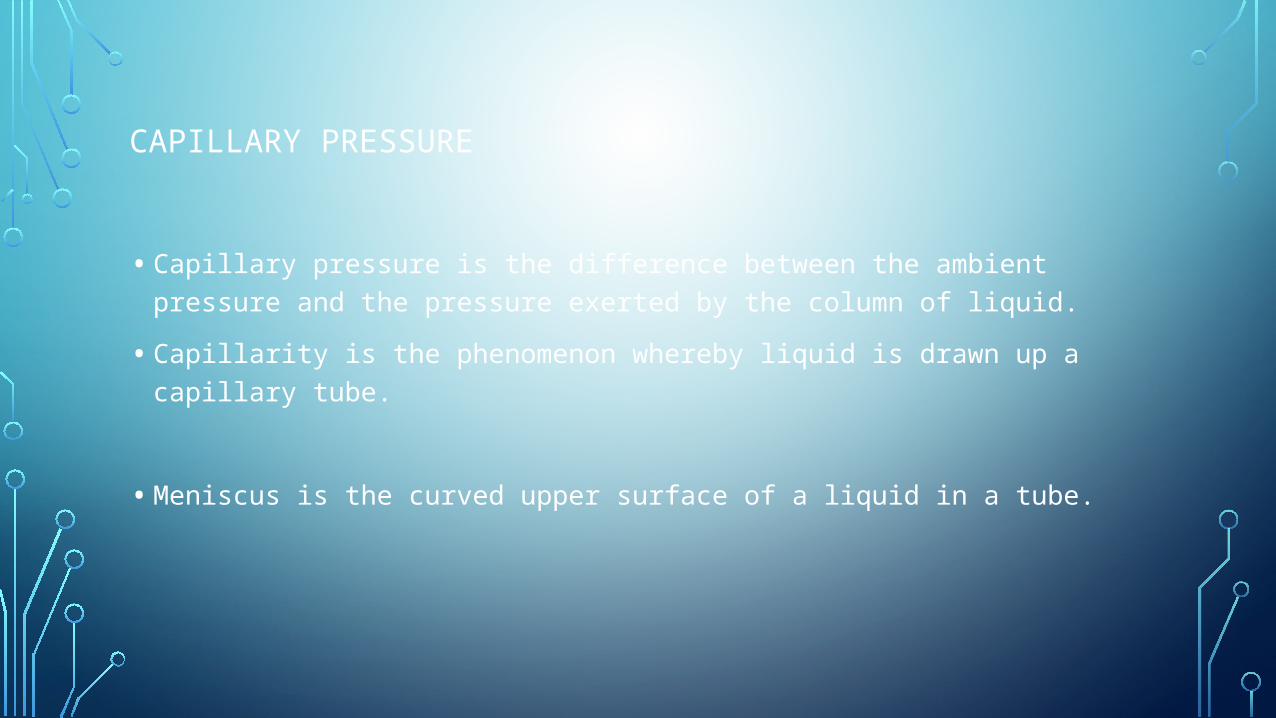
CAPILLARY TUBE IN A LIQUID FILLED TANK.
The pressure on the water level equals the pressure due to the hydrostatic head of water(h) minus the capillary pressure across the meniscus.

FACTORS ON WHICH CAPILLARY PRESSURE DEPENDS:
• Capillary pressure increases with tube diameter.• Translated into geological terms the capillary pressure of a reservoir
increases with decreasing pore size or more specifically pore throat diameter.• Capillary pressure is also related to the surface tension generated by the
two adjacent fluids, it increases with increasing surface tension.
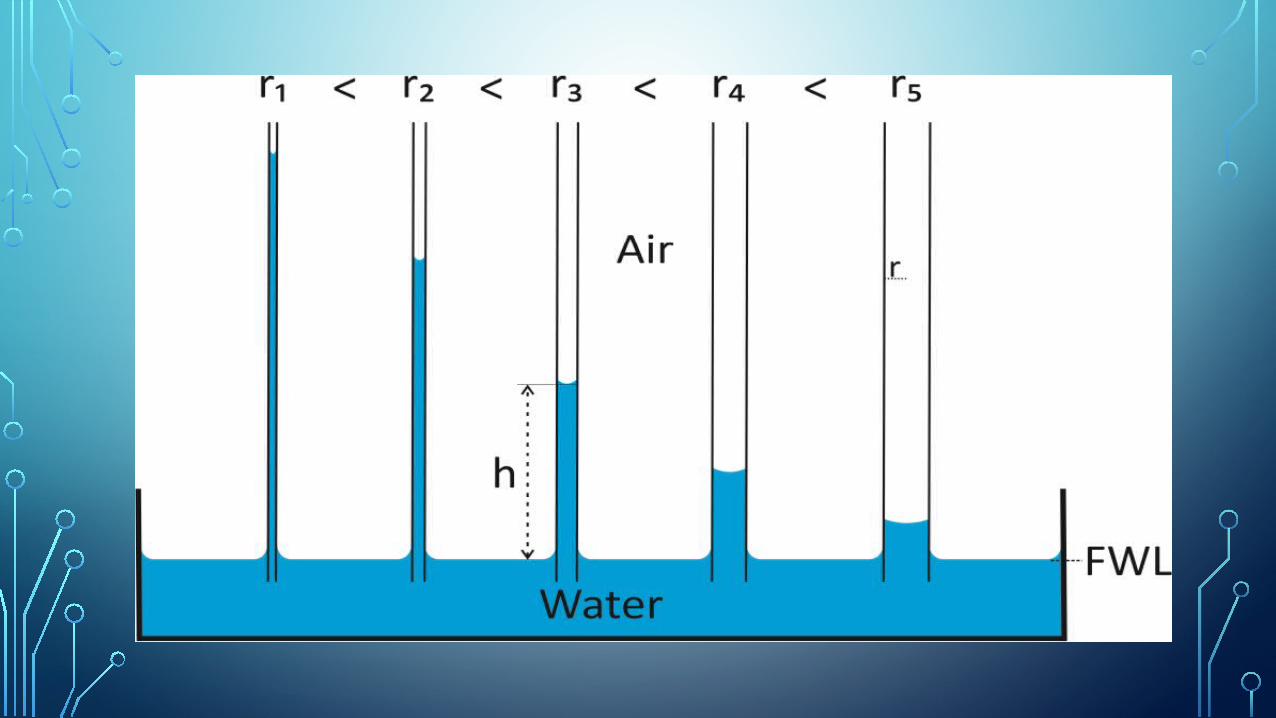

CAPILLARY PRESSURE TESTS
RESTORED METHOD • This method is purposed by Bruce and Welge in 1947.• In this method a reservoir core of known volume is saturated 100
% with water and then placed in contact with water membrane.• The membrane has extremely small pores that will not allow a
non-wetting fluids at the pressure to be used in the test.

• A non-wetting fluid ( oil, air , nitrogen etc) introduced into the cell at slightly increased pressure.• The air will enters in the pores having low capillary pressure than applied
pressure.• The water is displaced from the core and collected in a suitable graduate.• The saturation is computed when displaced water volume becomes
constant at given pressure.
• This procedure is repeated until an increase in pressure forces no more water from the core.

DISPLACEMENT PRESSURE
• The minimum pressure which is required for the displacement of water from pore is called displacement or entrance pressure.

DISADVANTAGE
• This is much time consuming method. Several days may be required toreach satisfactory equilibrium.
MERCURY INJECTION METHOD
• In this method the dry sample is placed in mercury cell. • Then pressure is applied , incrementally as before the volume injected
into the rock pores and noted at each pressure.• A curve of capillary pressure and saturation is obtained

ADVANTAGE
• The primary advantage of this method is speed, since only few hours are required for a complete curve.
DISADVANTAGE• The sample is ruined for subsequent testing.

EVAPORATION METHOD
• This method was purposed by Messer in 1959. In which a sample of known porosity is completely saturated with water.• Then this sample is placed in the oven and dried under constant conditions .• The weight loss is recorded and plotted against time continuously.• The main advantage of this method is the speed of measurements , a test
can be completed in twenty minutes to an hour.• It is an sharp , cheap and reasonable method for obtaining irreducible water
saturation value.