Embed Size (px)
Citation preview

1
Healthcare planning meets GIS: Locating
radiotherapy centres to meet changing
demand in space and time
Presented by: Dr. Nagesh Shukla and Dr. Rohan Wickramasuriya
Prof. Andrew Miller (ICCC, ISLHD)
Prof. Pascal Perez (SMART, UOW)
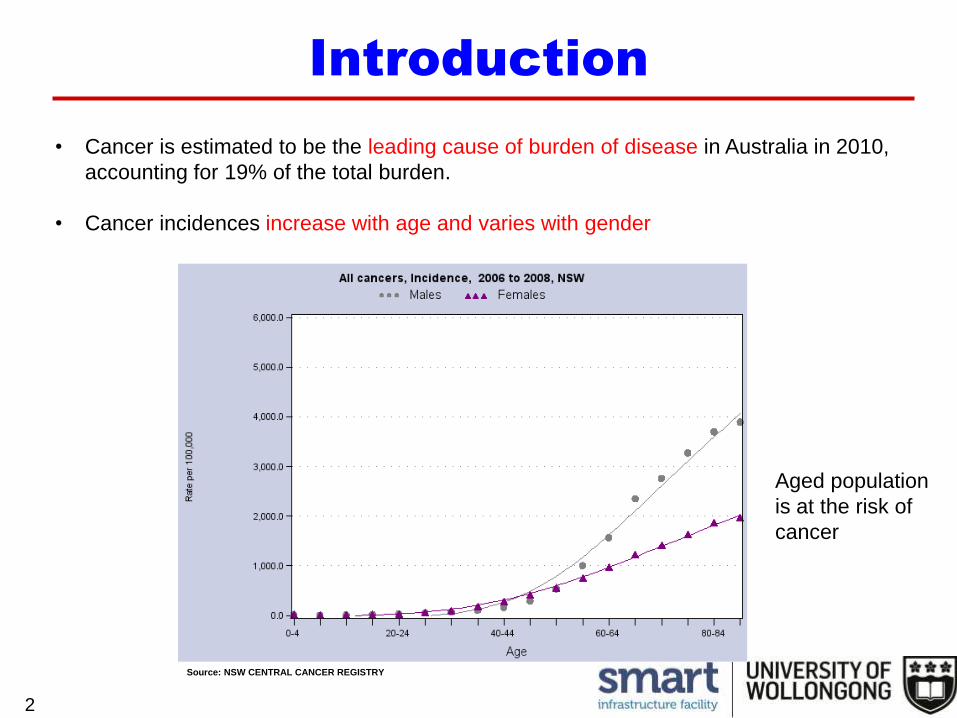
• Cancer is estimated to be the leading cause of burden of disease in Australia in 2010,
accounting for 19% of the total burden.
• Cancer incidences increase with age and varies with gender
Introduction
2
Source: NSW CENTRAL CANCER REGISTRY
Aged population
is at the risk of
cancer

• Population distribution, in general, is heterogeneously distributed in space
Introduction - Spatial variation of population
3
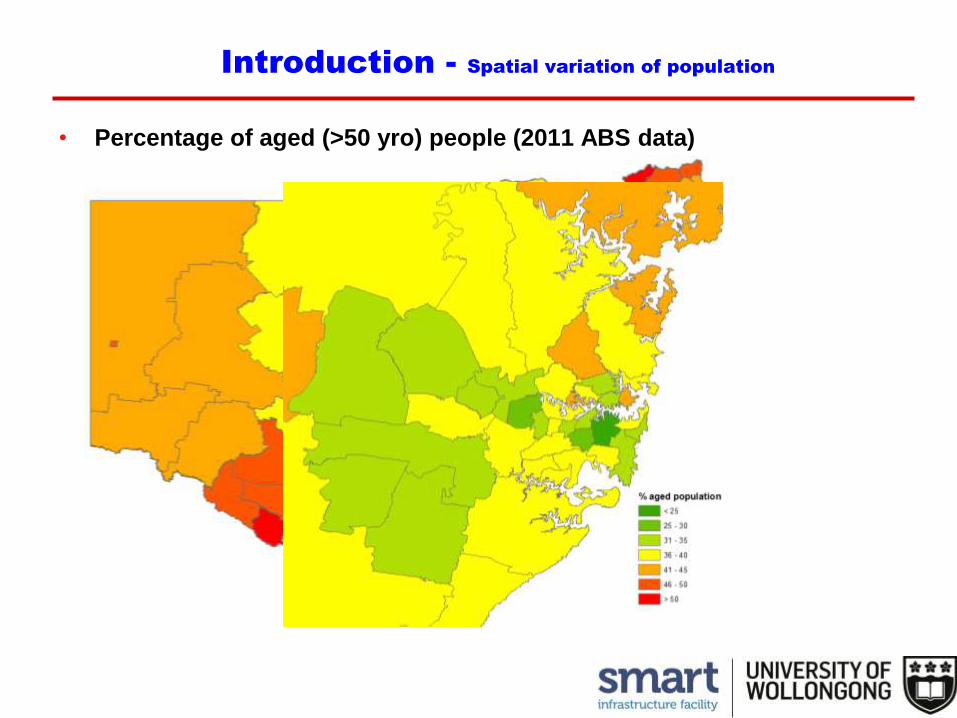
• Percentage of aged (>50 yro) people (2011 ABS data)
Introduction - Spatial variation of population

• Population evolution happens in space and time
• Growth rates
• Immigration
• Cancer rates for different types of cancer varies overtime
Space-time effects on cancer incidences
5
Regional Planning of Cancer Treatment services
6
• As life expectancy continues to grow; the proportion of elderly people in the
population will steadily increase over the next decades– it is expected that the number of cancer cases will continue to grow
• Thus, the pressure on specialised treatment services will increase as well,
calling for better planning and allocation of healthcare resources
• Radiotherapy (RT) is an essential mode of cancer treatment and contributes
to the cure of many cancer patients.– Evidence suggests that 52.3% of all diagnosed cancer cases in Australia would benefit from
RT
– However, only 38% of cancer sufferers receive radiotherapy at some point after the initial
detection
– This is largely due to the travel distance/access factors to RT centres
Regional Planning of RT services
7
• This research study proposes a methodology for location planning for RT
services with the help of:
– Population projections
– Cancer incidence rates estimation/prediction
– Road distance based accessibility to treatment centres
– Future RT demand estimation
Data Sources
8
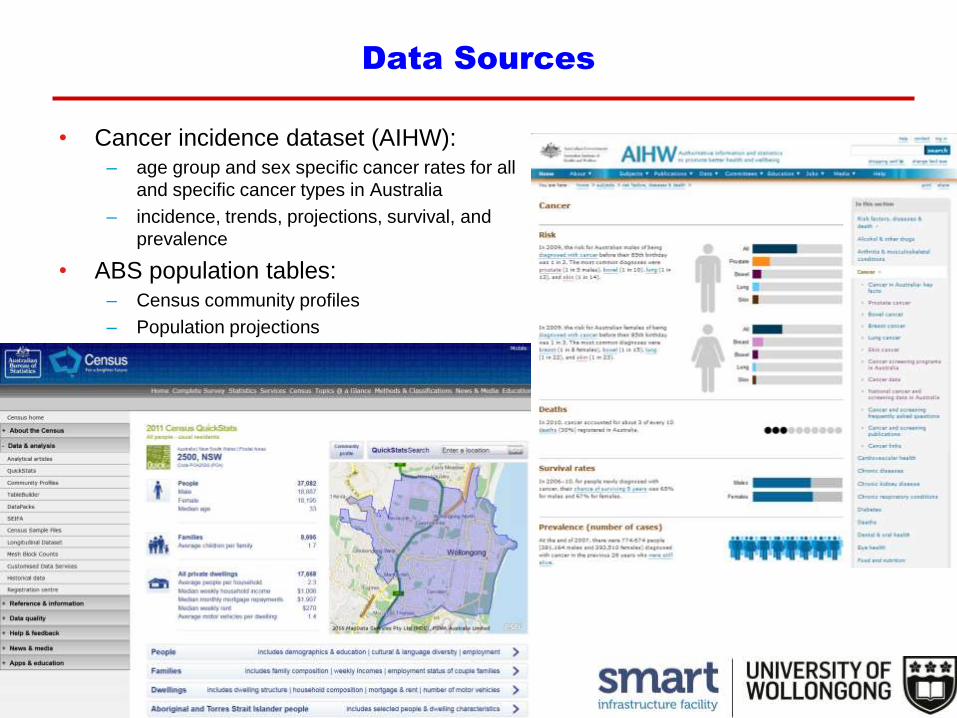
• Cancer incidence dataset (AIHW):– age group and sex specific cancer rates for all
and specific cancer types in Australia
– incidence, trends, projections, survival, and
prevalence
• ABS population tables:– Census community profiles
– Population projections

• Road network data from OpenStreetMap– It is a crowd-sourced initiative to collect and map roads, trails, and points of interest, with an
ultimate aim of building a geographic database
Data Sources
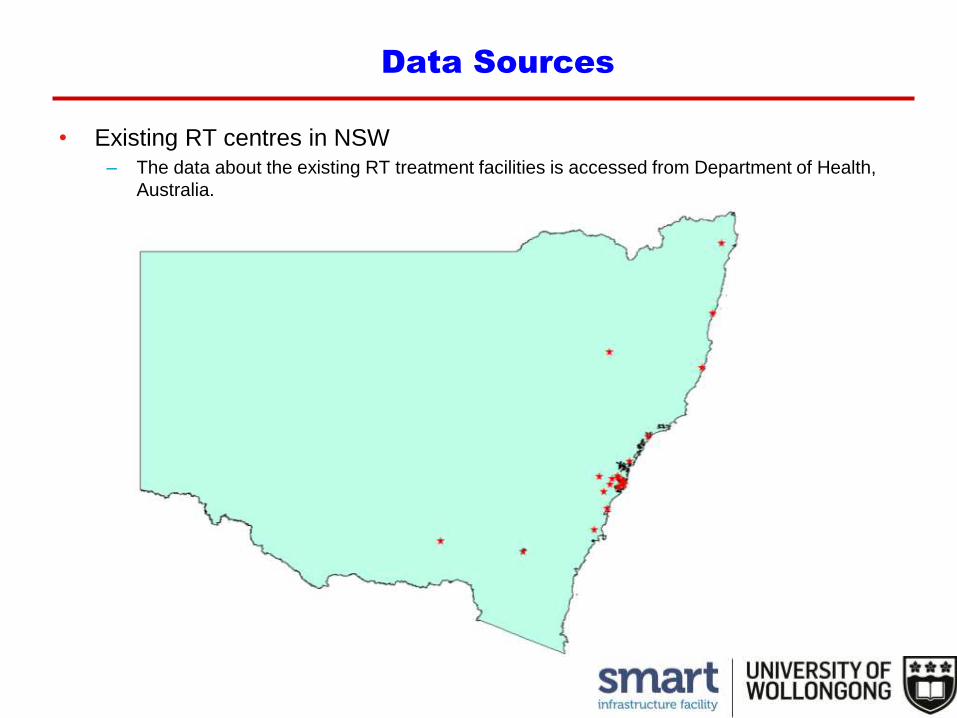
• Existing RT centres in NSW– The data about the existing RT treatment facilities is accessed from Department of Health,
Australia.
Data Sources
Proposed Methodology
11
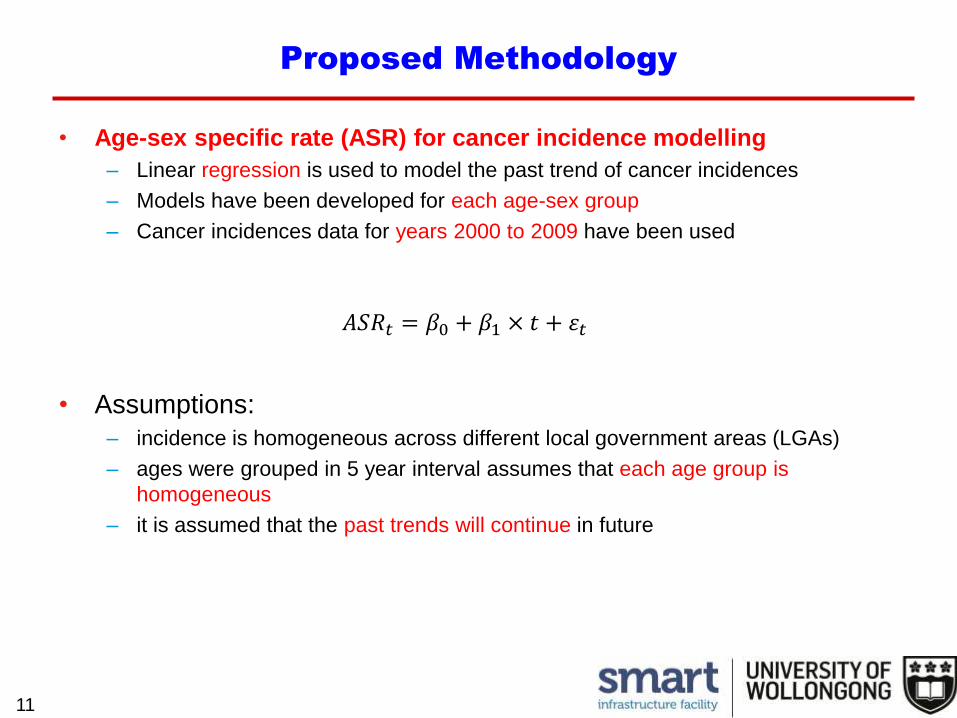
• Age-sex specific rate (ASR) for cancer incidence modelling
– Linear regression is used to model the past trend of cancer incidences
– Models have been developed for each age-sex group
– Cancer incidences data for years 2000 to 2009 have been used
• Assumptions:
– incidence is homogeneous across different local government areas (LGAs)
– ages were grouped in 5 year interval assumes that each age group is
homogeneous
– it is assumed that the past trends will continue in future
𝐴𝑆𝑅𝑡 = 𝛽0 + 𝛽1 × 𝑡 + 𝜀𝑡

Proposed Methodology
12
• Population projections
– These projections are based on the past trends (over a decade) of
• fertility,
• mortality,
• and migration trends
– the base population is projected into the future year annually by estimating the
effect of births, deaths and migration within each age-sex group
• Travel distance modelling
𝑐𝑎𝑛𝑐𝑒𝑟_𝑐𝑎𝑠𝑒𝑠(𝐿𝐺𝐴, 𝑡)=Population(LGA, t) × ASR(t)

GIS – formal definition
A Geographic Information System (GIS) is a system designed to capture, store,
manipulate, analyse and present all types of spatial or geographical data.
Bit of history
GIS in Healthcare
1854 Broad street cholera
outbreak – physician John Snow

Applications
1. Easily accessible directories: Google maps
- Extend with real time data
2. Market demand analysis
3. Epidemiology – Spatial epidemic models
4. Geomedicine
5. Strategic Planning – e.g. current study
GIS in Healthcare

RT rates based on distance
15
27% 26%24% 23%
22%20%
23%
18%
14%
0%
5%
10%
15%
20%
25%
30%
Rad
ioth
era
py u
tili
sa
tio
n
Distance in kilometres
Proportion of patients who received radiotherapy by distance from patient's residence to the nearest radiotherapy facility
NSW & ACT 2004-06
Gabriel et al. (2013)
Radiotherapy utilisation in
NSW & ACT 2004-06 - A Data
Linkage and a GIS experience
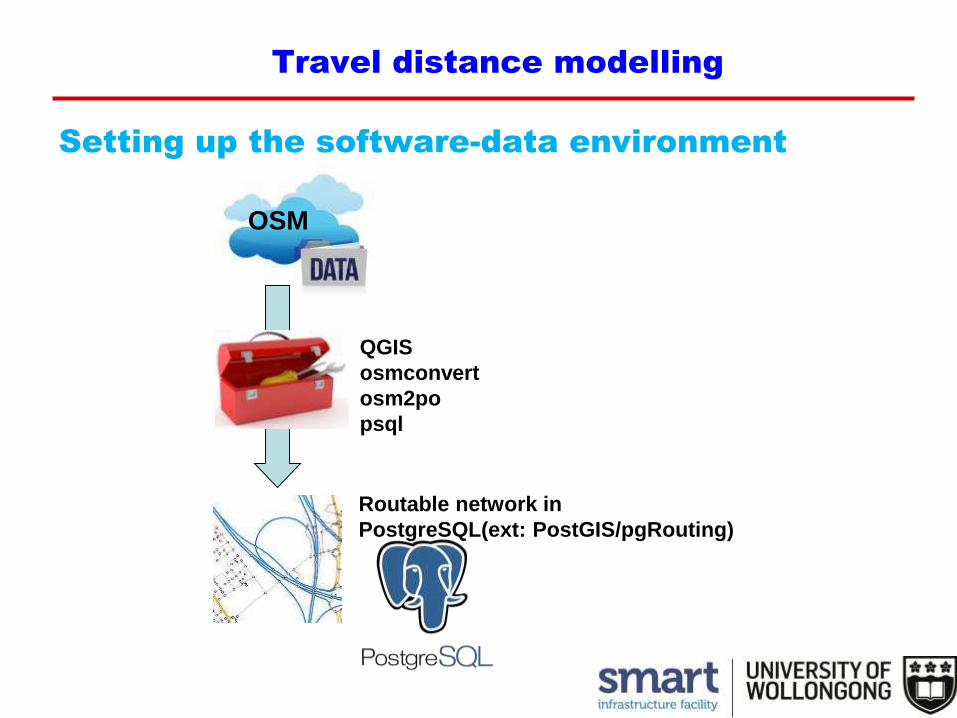
OSM
Setting up the software-data environment
Travel distance modelling
QGIS
osmconvert
osm2po
psql
Routable network in
PostgreSQL(ext: PostGIS/pgRouting)

Generating constant driving distance polygons
Travel distance modelling
Routable Network in
PostgreSQL
+
Origin (RT Centre) *
+
Distance (e.g. 50km) *
pgRouting
pgr_drivingdistance
Reachable nodes
Isochrone
* loop
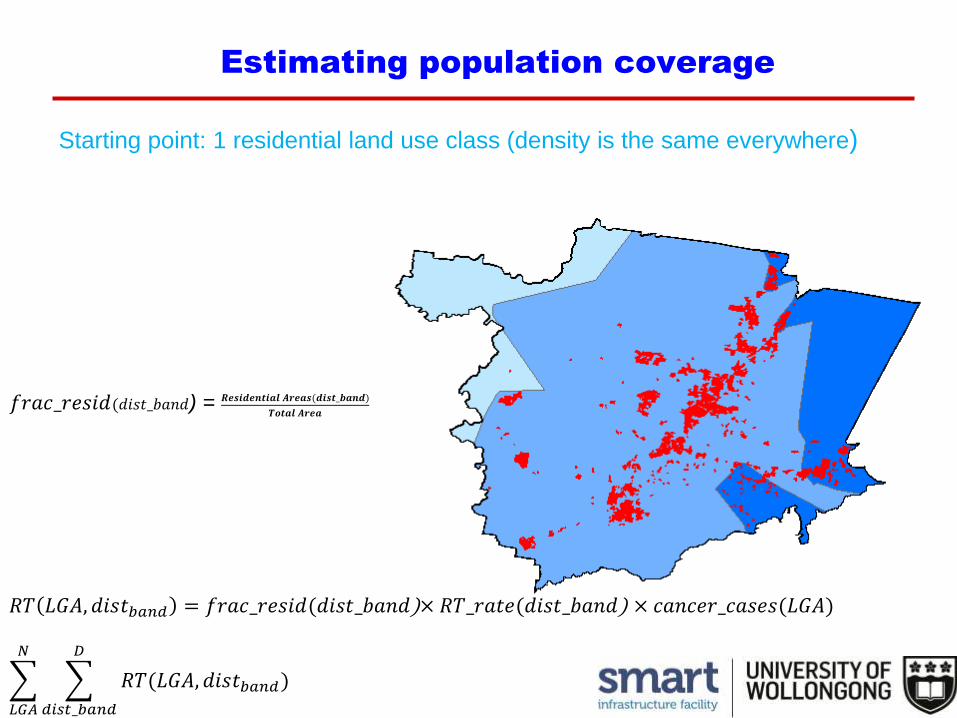
Starting point: 1 residential land use class (density is the same everywhere)
Estimating population coverage
𝑅𝑇 𝐿𝐺𝐴, 𝑑𝑖𝑠𝑡𝑏𝑎𝑛𝑑 = 𝑓𝑟𝑎𝑐_𝑟𝑒𝑠𝑖𝑑(𝑑𝑖𝑠𝑡_𝑏𝑎𝑛𝑑)× 𝑅𝑇_𝑟𝑎𝑡𝑒(𝑑𝑖𝑠𝑡_𝑏𝑎𝑛𝑑) × 𝑐𝑎𝑛𝑐𝑒𝑟_𝑐𝑎𝑠𝑒𝑠(𝐿𝐺𝐴)
𝐿𝐺𝐴
𝑁
𝑑𝑖𝑠𝑡_𝑏𝑎𝑛𝑑
𝐷
𝑅𝑇(𝐿𝐺𝐴, 𝑑𝑖𝑠𝑡𝑏𝑎𝑛𝑑)
𝑓𝑟𝑎𝑐_𝑟𝑒𝑠𝑖𝑑(𝑑𝑖𝑠𝑡_𝑏𝑎𝑛𝑑) = 𝑹𝒆𝒔𝒊𝒅𝒆𝒏𝒕𝒊𝒂𝒍 𝑨𝒓𝒆𝒂𝒔(𝒅𝒊𝒔𝒕_𝒃𝒂𝒏𝒅)
𝑻𝒐𝒕𝒂𝒍 𝑨𝒓𝒆𝒂
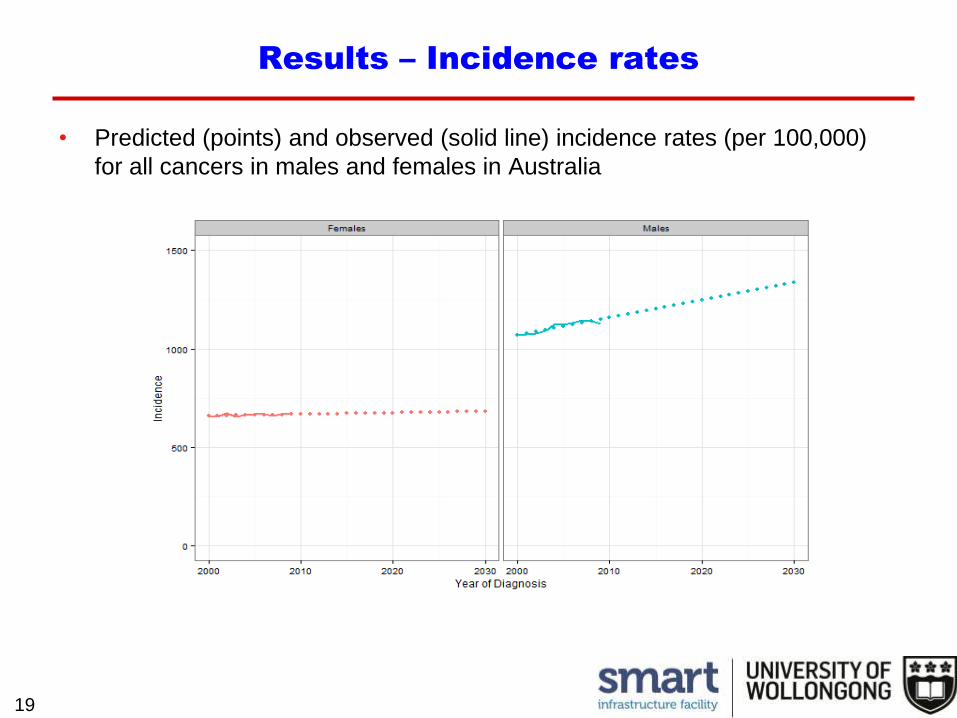
Results – Incidence rates
19
• Predicted (points) and observed (solid line) incidence rates (per 100,000)
for all cancers in males and females in Australia

Results – Population projection
20
• Age structure of NSW population in years 2011 and 2026
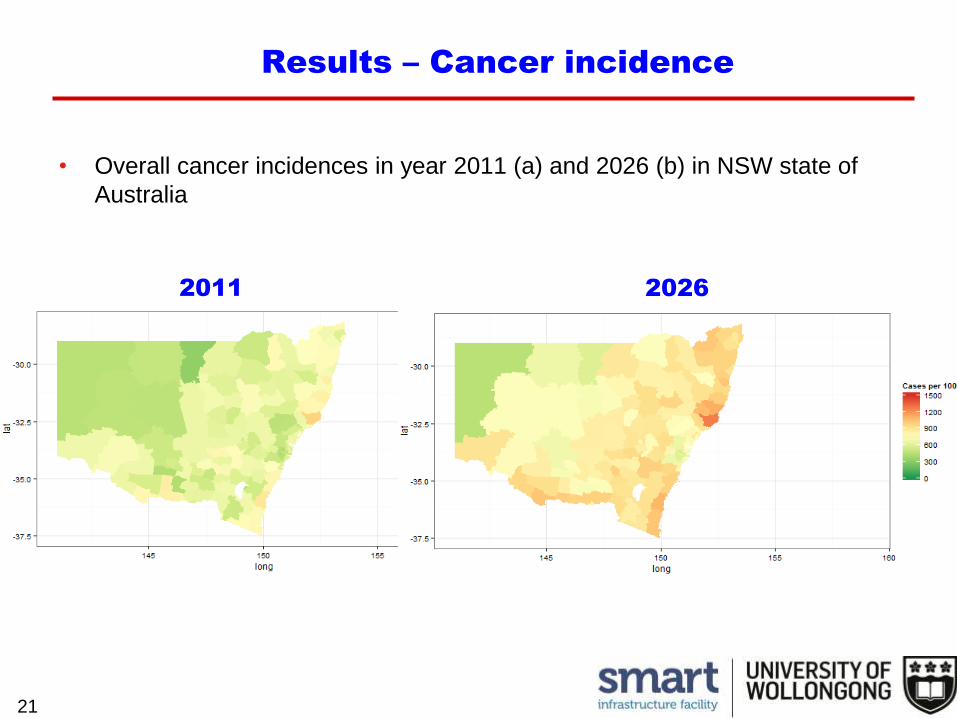
• Overall cancer incidences in year 2011 (a) and 2026 (b) in NSW state of
Australia
21
Results – Cancer incidence
2011 2026

• Constant driving distance polygons from radiotherapy centres
22
Results –driving distance from RT centres

• estimate change in access of cancer patients with the opening of new RT
centre in Shoalhaven
23
Results – Scenario

24
Future work
ASR Prediction Modelling
Cancer Incidence Prediction
Travel distance modelling and estimation
Percentage of Cancer Patient within the accessible regions in
future
AIHW Incidence Data
ABS Population Projection(2011-2026)
NSW Road Network Data
Residential areas
Existing RT centresFuture RT demand
estimation
Thank You
25
Dr. Nagesh Shukla
Research Fellow
SMART Infrastructure Facility
University of Wollongong
Dr. Rohan Wickramasuriya
Research Fellow
SMART Infrastructure Facility
University of Wollongong