Embed Size (px)
Citation preview

06.10.2016
1
Unique Epidemiologic Research
Rolv Skjærven
Department of Global Public Health and Primary Careand
Norwegian Institute of Public Health, Bergen
Unique Epidemiologic Research
06.10.2016
2
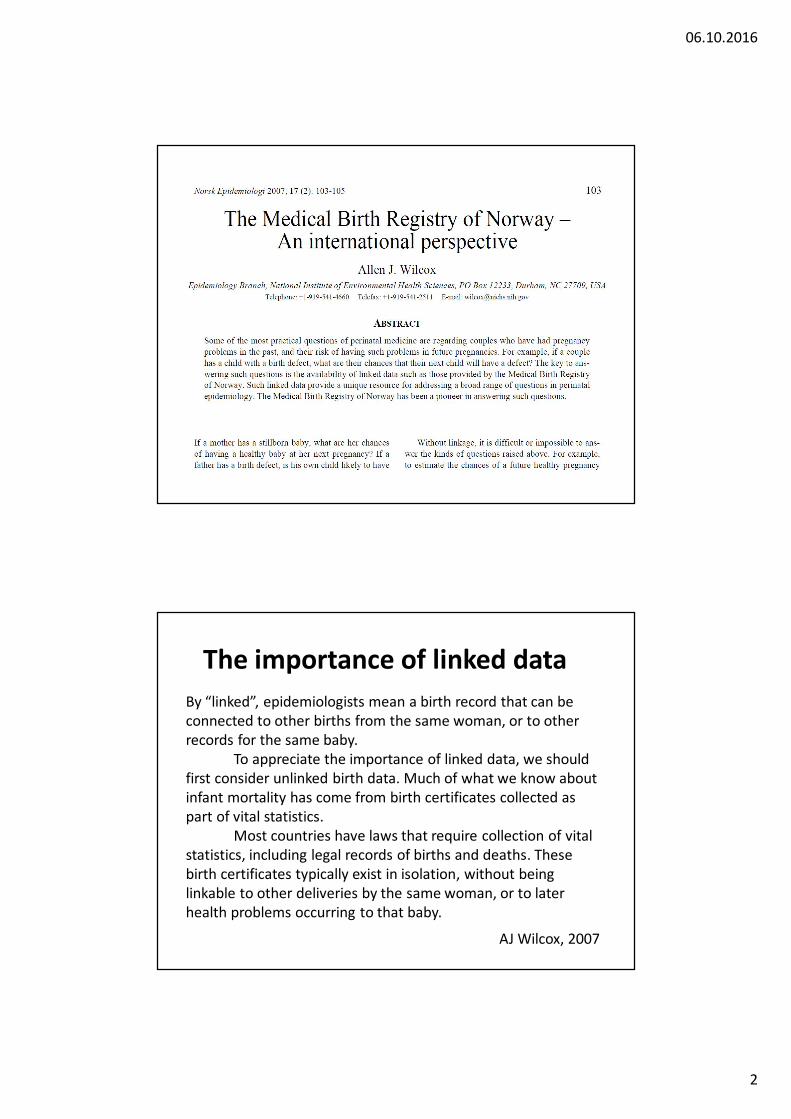
The importance of linked dataBy “linked”, epidemiologists mean a birth record that can be connected to other births from the same woman, or to other records for the same baby.
To appreciate the importance of linked data, we should first consider unlinked birth data. Much of what we know about infant mortality has come from birth certificates collected as part of vital statistics.
Most countries have laws that require collection of vital statistics, including legal records of births and deaths. These birth certificates typically exist in isolation, without being linkable to other deliveries by the same woman, or to later health problems occurring to that baby.
AJ Wilcox, 2007
06.10.2016
3
THE INTERNATIONAL IMPACT OF THEMEDICAL BIRTH REGISTRY OF NORWAY
In 1995, the US Centers for Disease Control and the US National Institutes of Health organized an international symposium on maternally-linked pregnancy outcomes. Along with the excellent linked Registries of Sweden and Denmark, the Medical Birth Registry of Norway was one of the centerpieces of that symposium. Ten years later, in 2005, a second international symposium was held, and once again, Norwegian researchers played a prominent role.
AJ Wilcox, 2007

06.10.2016
4
Medical birth registries started:Norway – 1967Iceland – 1972
Sweden/Denmark – 1973Finland – 1987
Number of infants born (2011):61322 (N) 4480 (I) 109766 (S)
59666 (D) 60258 (F)
How to do excellent research?
Topic for next yearsEPINOR summer school

06.10.2016
5

06.10.2016
6
Promoting innovationand creativity in epidemiologyHiatt et al., Anals of Epidemiol, 2013
New and innovative thinking will be needed to develop and applymethods to empirical observation that complement our traditionalapproaches to hypothesis-driven research and making causal inferences.
I think there is true inspiration and there is synthesis. They are not mutually exclusive, they need to be paired.
One can collect data - observations - like Darwin did for months and months, on end classify, look for patterns and structure; but all the time the underlying direction of the synthesis is being guided by inspiration - a half understood idea, something you have 'received' in a dream or by relaxing.
In effect one side is sheer hard work and intellectually driven 'bottom up' analysis and the other is subconscious emotion and relaxation driven 'top down' inspiration.
For one you need reason and memory; for the other you need to cut out reason and memory because they get in the way.
For one you need a working environment, an office, files, computers, structure, for the other you need nature, play, music, unstructured environments and meditation.
Where good ideas come from
Rosemary Rock-Evans, 2014, comment to Steven Johnson’s Where good ideas come from

06.10.2016
7
During the last 20 years, more than 20 papers have been published in the leading weekly clinical journals
– the most influential journals in the field ofmedicine and public health.
Thirty papers have been published in the international specialty clinical journals in pediatrics, obstetrics and
other fields, and nearly 80 papers have appeared in major
epidemiology journals.
Norsk epidemiologi, 2007
The Medical Birth Registry of Norway –An International Perspective. AJ Wilcox
The leading weeklyclinical journals
We have now as many publications (40)as Sweden in epidemiologic research
based on theMedical Birth Registry
of Norway and Sweden, resp.

06.10.2016
8
Overall, we have a third ofSweden’s publications in
N Engl J Med, BMJ, Lancet, JAMA
…but
The leading weeklyclinical journals
We have uniqueregistry data in Norway
Go for the unique aspectsin the data!
06.10.2016
9
Family data is a unique «factor»
A narrow area for science,but these data dominate
our «top» papers

06.10.2016
10
In relation to a pregnancy, it will be wrong to say
that the risk for a specific pregnancycondition is X%
Most often risks are higher in 1st pregnancies, and risks in later pregnancies depends onwhat happened in previous pregnancies.
Some examples …

06.10.2016
11
06/10/2016 21
Perinatal mortality and continuation ratesby outcome of previous births (1967-98)
Birth Order1 2 3 4
Peri
nata
l mor
talit
y (p
er 1
000)
20
30
40
50
60708090
200
300
10
100
Surviving childPerinatal loss
78
70
84
72
62
64
36
60
33
64
21
72
79
37
Continuation rate
Update of earlier studies:Skjaerven et al.,1987, PPE & 1988, AJE
06/10/2016 22
Risk for preeclampsia, 1st to 4th birth, by outcome of previous births. Singleton births, same partner for all births, Norway 1967-2009
Birth order1 2 3 4
Per C
ent
0
5
10
15
20
25
30
35
40
45
Conclusions:
After one preeclamptic pregnancy, the risk for the next pregnancy is
between 10 and 15 %, regardless of birth order.
After two or more preeclamptic pregnancies,
the risk is between 30 and 40%.
Red lines:risk following preeclampsia
Skjaerven et al. ‘The epidemiology of preeclampsia with focus on family data’ In ‘Placental Bed Disorders’, Pijnenborg et al. (eds), 2011

06.10.2016
12
Generations and recurrence
Breech delivery (BMJ; 2008)
Preeclampsia (BMJ; 2005)
Malformations (NEJM, 1994 & 1999, JAMA 2001)
Breech deliveries and generations• Hypothesis: Both women and men
delivered in breech presentation contribute to increased risk of breech delivery in their offspring ??
• ”Inherited”from women (OR=2.2;1.9-2.5) from men ?? (OR=2.2; 1.8-2.7)
Nordtveit et al.,BMJ, 2008

06.10.2016
13
Breech deliveries and generations• Hypothesis: Both women and men
delivered in breech presentation contribute to increased risk of breech delivery in their offspring
• ”Inherited” as stronglyfrom men (OR=2.2; 1.8-2.7) as from women (OR=2.2;1.9-2.5)
Nordtveit et al.,BMJ, 2008
Figure 1. Risk for preeclampsia in the second generation, given a preeclamptic pregnancy in the first generation. (Shaded area
represents preeclamptic pregnancies.)
(Skjaerven et al., BMJ, 2005)
06.10.2016
14
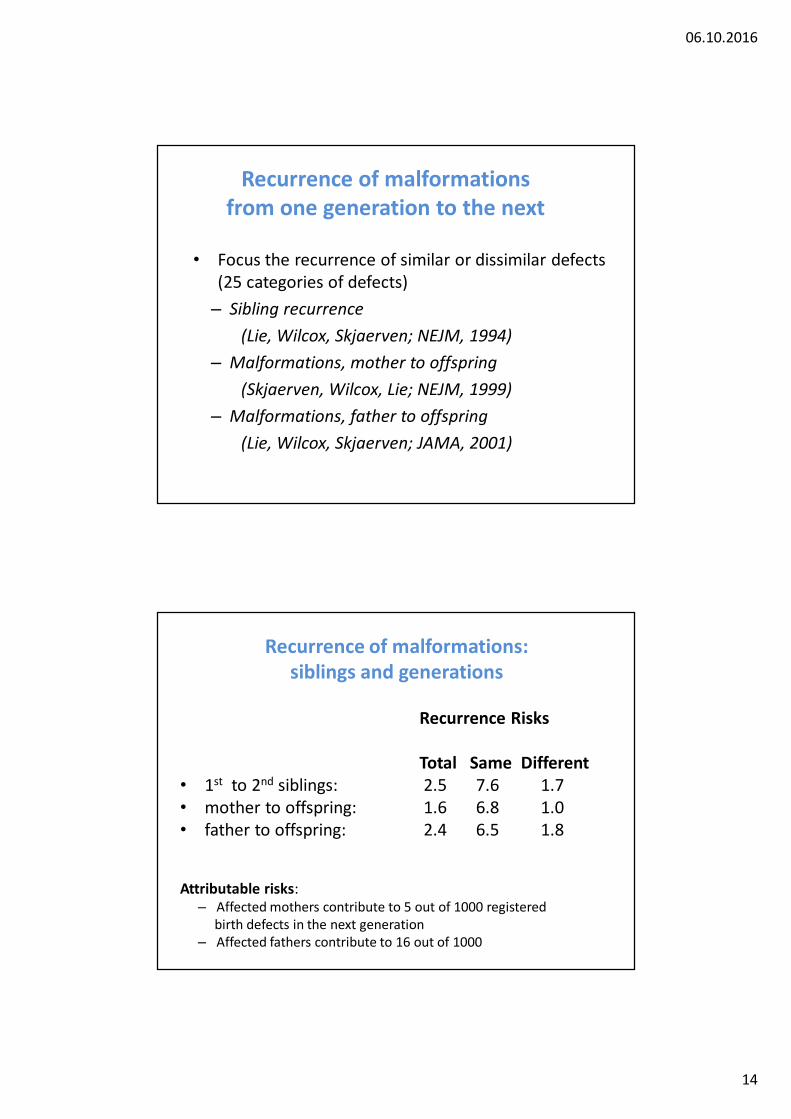
Recurrence of malformationsfrom one generation to the next
• Focus the recurrence of similar or dissimilar defects (25 categories of defects)
– Sibling recurrence(Lie, Wilcox, Skjaerven; NEJM, 1994)
– Malformations, mother to offspring (Skjaerven, Wilcox, Lie; NEJM, 1999)
– Malformations, father to offspring (Lie, Wilcox, Skjaerven; JAMA, 2001)
Recurrence of malformations: siblings and generations
Recurrence Risks
Total Same Different• 1st to 2nd siblings: 2.5 7.6 1.7• mother to offspring: 1.6 6.8 1.0• father to offspring: 2.4 6.5 1.8
Attributable risks:– Affected mothers contribute to 5 out of 1000 registered
birth defects in the next generation – Affected fathers contribute to 16 out of 1000

06.10.2016
15
Preeclampsia risk increases with pregnancy interval.
Implications for the observed effects of parity and paternity.
Reference:Skjaerven, Wilcox, Lie, NEnglJMed, 2002
Pregnancy interval (years)
Prop
ortio
nof
birt
hs (%
)
0102030405060708090100110120130140
1 2 3 4 5 6 7 8 9 10
Pre
ecla
mps
ia ri
sk(%
)
0.0
0.5
1.0
1.5
2.0
2.5
3.0
3.5
4.0
4.5
RISK AT FIRST PREGNANCY
Preeclampsia risk in 2nd pregnancy
OVERALL RISKAT SECOND PREGNANCY

06.10.2016
16
Preeclampsia risk in 2nd pregnancy,by interval since the 1st pregnancy
for mothers with the same partner and different partner
Pregnancy interval (years)1 2 3 4 5 6 7 8 9 10
Pree
clam
psia
(%)
0,0
0,5
1,0
1,5
2,0
2,5
3,0
SAME PARTNERS
DIFFERENTPARTNERS
Median pregnancy intervalfor 2nd births by- different fathers- same father
Distance (complete years)
Num
ber o
f birt
hs (%
)
0
10
20
30
Preeclampsia by distance between pregnancies,women with same and new partner in 2nd pregnancies
Distance is calculated from date of birth to date of conseption of next pregnancy
0 2 4 6 8 10 12 14
Pre
ecla
mps
ia R
isk
(%)
0.7
0.80.9
1.5
2
3
4
5
1

06.10.2016
17
Odds Ratio of preeclampsia for mothers who had changed partner between two pregnancies, and mothers who had the same partner for both pregnancies, for different scenarios of adjustment for potentially confounding factors.
2nd pregnancy 3rd pregnancy 4th pregnancy
1) Crude estimate 1.3 (1.2-1.5) 1.4 (1.2-1.5) 1.6 (1.2-2.2)
2) Adjusted for smokingduring pregnancy (*) 1.5 (1.3-1.7) 1.5 (1.2-1.8) 1.8 (1.3-2.6)
3) Adjusted for inter-birth interval 0.8 (0.7-0.9) 0.9 (0.8-1.2) 0.9 (0.6-1.3)
4) Adjusted for interval and smoking 0.9 (0.8-1.1) 1.0 (0.8-1.2) 1.0 (0.7-1.5)
5) Adjusted for interval, smoking and maternalage at last birth 0.9 (0.8-1.1) 1.0 (0.8-1.3) 1.0 (0.6-1.5)
(*) daily smoking versus no smoking
Odds Ratios with 95% C.I.
Conclusions
• Change of partner does not influence risk for preeclampsia in the next pregnancy
• The “primipaternity” effect is due to confounding by interval and smoking

06.10.2016
18
Main results: Low birthweight, preterm birth and perinatal deathall increased 2.0-2.5 fold, in 2nd birthfor women with a new partner.
Perinatal death in relation to mother’s and father’s
gestational age and birthweight
Skjaerven et al., BMJ, 1997

06.10.2016
19
Perinatal death by maternal birthweight
Maternal birthweight (lower cutp)1000 1500 2000 2500 3000 3500 4000 4500 5000
RR
(95%
C.I.
)
0.80.9
1.5
2
3
4
5
1
Skjærven et al., BMJ, 1997 and Nordtveit et al., PPE, 2010
Perinatal death by parental birthweight
Maternal birthweight (lower cutp)
1000
1500
2000
2500
3000
3500
4000
4500
5000
RR
(95%
C.I.
)
0.80.9
1.5
2
3
4
5
1
Paternal birthweight (lower cutp)
1000
1500
2000
2500
3000
3500
4000
4500
5000
RR
(95%
C.I.
)
0.80.9
1.5
2
3
4
5
1
Mother Father
Nordtveit et al., 2010

06.10.2016
20
Tandberg et al.; BJOG 2011
Perinatal death in twins and singletons by maternal gestational age
Perinatal death in low birth weight (<2500g) by maternal birthweight
Maternal birthweight (lower cutp)1000 1500 2000 2500 3000 3500 4000 4500 5000
RR
(95%
C.I.
)
0.3
0.4
0.50.60.70.80.9
1.5
2
3
1
Skjærven et al., BMJ 1989 (update 2011)SSkjaerven et al.,1997 (reanalyzed)
06.10.2016
21
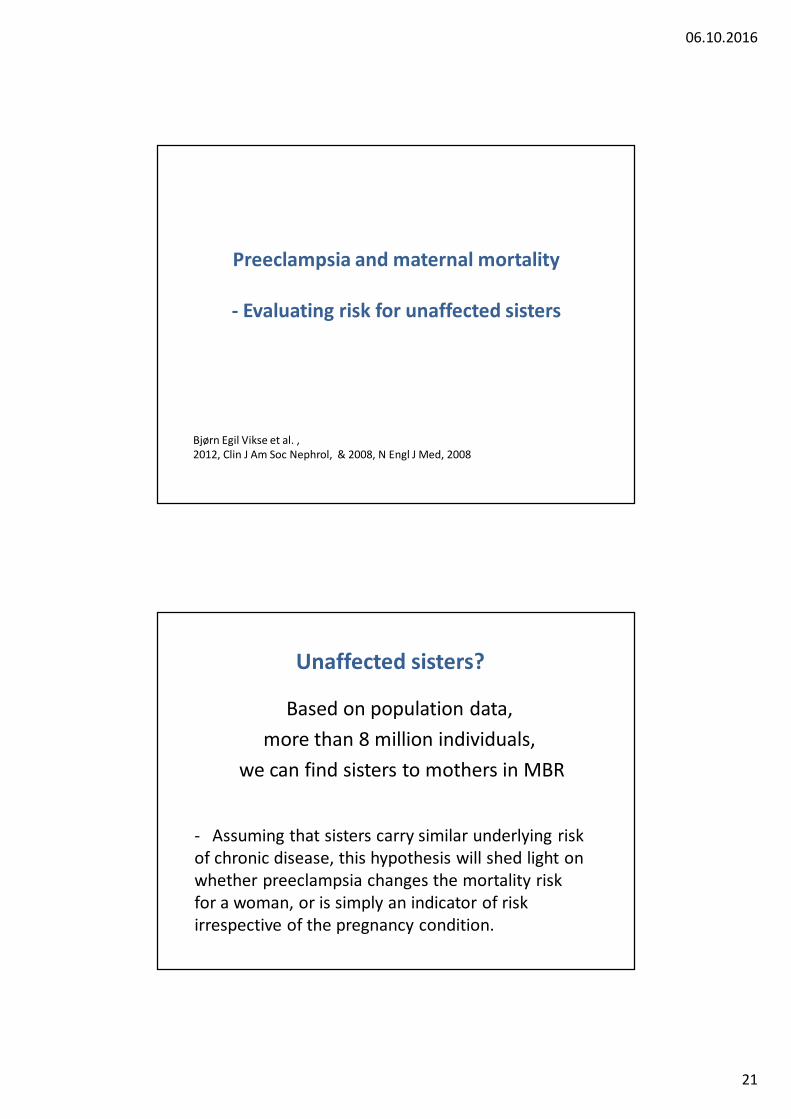
Preeclampsia and maternal mortality
- Evaluating risk for unaffected sisters
Bjørn Egil Vikse et al. , 2012, Clin J Am Soc Nephrol, & 2008, N Engl J Med, 2008
Unaffected sisters?
Based on population data, more than 8 million individuals,
we can find sisters to mothers in MBR
- Assuming that sisters carry similar underlying risk of chronic disease, this hypothesis will shed light on whether preeclampsia changes the mortality risk for a woman, or is simply an indicator of risk irrespective of the pregnancy condition.

06.10.2016
22
Preeclampsia and end stage renal disease:
HR(adj) =5.9 (4.3-8.0)
Unaffected sisters: HR(adj) =1.01 (0.62-1.7)
Bjørn Egil Vikse et al. , 2012, Clin J Am Soc Nephrol, & 2008, N Engl J Med, 2008
An example
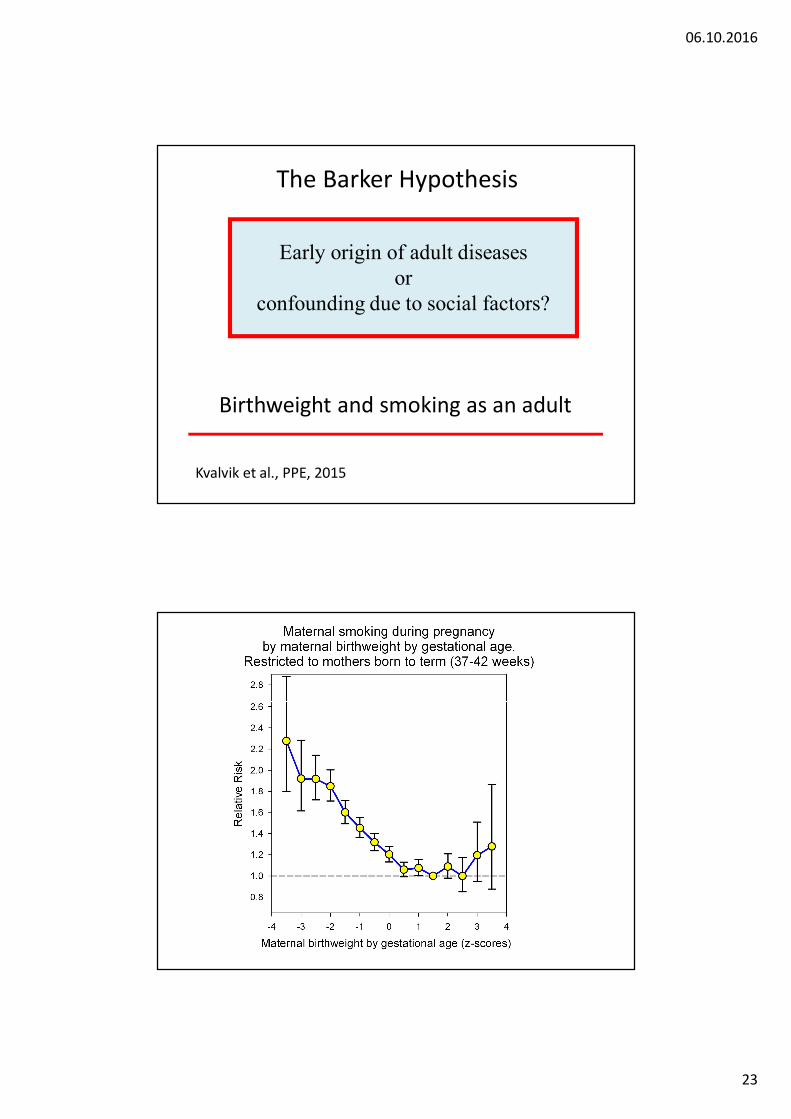
The Barker Hypothesis
Early origin of adult diseases
06.10.2016
23
Birthweight and smoking as an adult
Early origin of adult diseases or
confounding due to social factors?
Kvalvik et al., PPE, 2015
The Barker Hypothesis

06.10.2016
24
06/10/2016 47
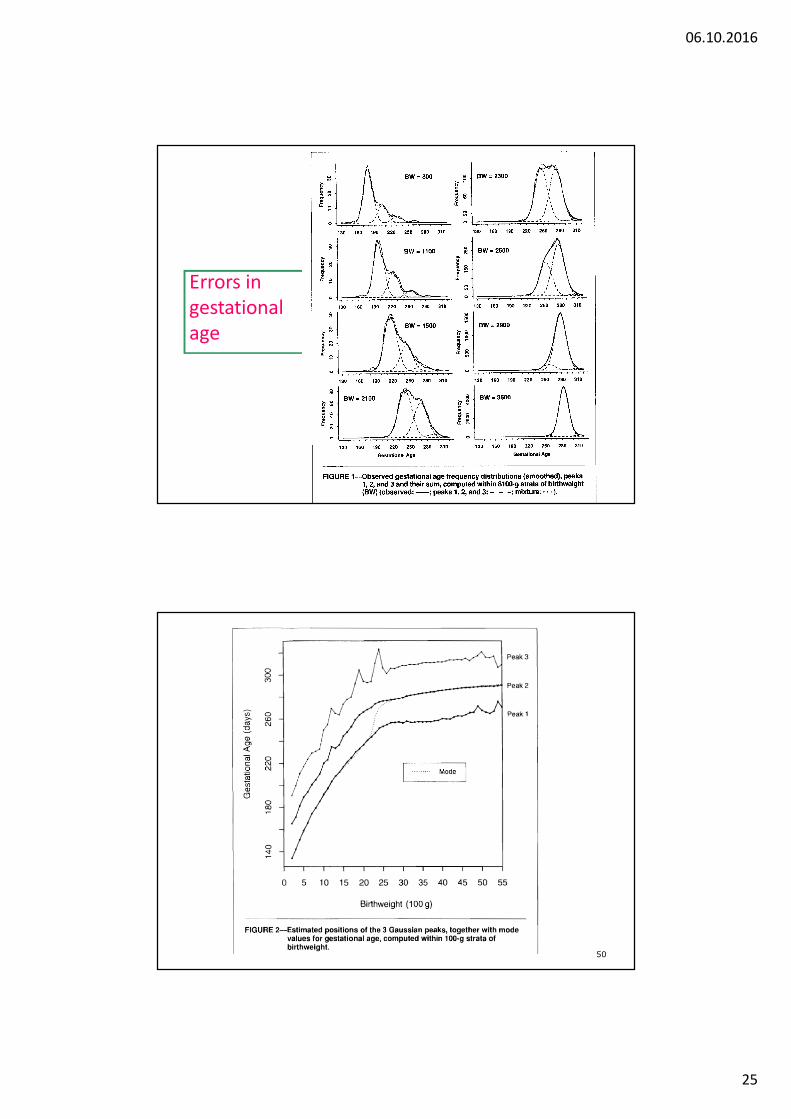
Errors in gestational age
Am.J.Publ.Health, 89, 213-218, 1999
O b se rve d b irth w e ig h t a t 3 2 w e eks g e sta tio n a l a g e
B irth w e ig h t (ro u n d e d 1 0 0 g r)0 500 1000 1500 2000 2500 3000 3500 4000 4500
Per
Cen
t
0
1
2
3
4
5
6
7
8
9
10
11
In c lu dedE x c lu ded
3 2 w e eks
p re te rm -3 2w dis tr1
T o ta l: M ean = 2088 SD = 750 n = 5129In c lu d ed : M ean = 1802 S D = 447 n = 4154
06.10.2016
25
Errors ingestationalage
50

06.10.2016
26
Pregnancy complications and long term maternal death
due to cardiovascular causes
The Medical Birth Registry of Norway
• All births in Norway 1967-2016 - 50 years with population based birth registration
• Close to 3 million births, for 1.6 million women• Personal identifiers for mother, father and child• Linked to - Death registry, Cancer registry
- Population registry- Education registry
• Internal linkage - Siblings and Generations

06.10.2016
27
State of the art?
Pregnancy complication in 1st birthCVD mortality
Pregnancy complications and long term maternal death
BMJ 2007, Meta-analysis, Bellamy et al.The relative risks (95% confidence intervals)
for ischaemic heart disease 2.2 (1.9 to 2.5) after 12 years,for stroke 1.8 (1.5 to 2.3) after 10 years
Almost all studies have been based on preeclampsia in 1st pregnancy
and no focus on effects of later reproduction
Cardiovascular deaths and preeclampsia

06.10.2016
28
Risk for preeclampsia, 1st to 4th singleton birth, by preeclampsia in previous births, Norway 1967-2014

06.10.2016
29
Fig 1 Cumulative risk of cardiovascular death for women according to pre-eclampsia status at first pregnancy and number of subsequentlifetime pregnancies
Cumulative risk of cardiovascular death in strata of outcome of first pregnancy.In each panel we compare mortality for women with one lifetime birth (green) , and women with two or more lifetime births (red) .
HR were adjusted for maternal age, year of first birth and maternal education

06.10.2016
30
Maternal deaths by lifetime number of pregnancies and term/preterm preeclampsia in first singleton pregnancy.
CARDIOVASCULAR DEATHS (CHD and Stroke, combined) LIFETIME NUMBER OF PREGNANCIES
NUMBER OF WOMEN
MATERNAL DEATHS (per 1000)
HR (95%C.I.) Adj. for maternal age,
1st pregnancy
HR (95%C.I.) ADJUSTED (*)
Women with one pregnancy0 No preeclampsia 112208 596 (5.3) 2.1 (1.9-2.3) 2.0 (1.8-2.2)1 Term
preeclampsia4758 47 (9.9) 4.1 (3.1-5.5) 3.4 (2.6-4.6)
2 Pretermpreeclampsia
1426 29 (20.3) 10.6 (7.3-15.3) 9.4 (6.5-13.7)
Women with two or more pregnancies3 No preeclampsia 599973 1415 (2.4) 1.0 (ref.) 1.0 (ref.)4 Term
preeclampsia21950 68 (3.1) 1.5 (1.2-2.0) 1.5 (1.2-2.0)
5 Pretermpreeclampsia
4459 16 (3.6) 2.3 (1.4-3.8) 2.4 (1.5-3.9)
(*) HR=Hazard Ratio with 95% confidence interval, adjusted for maternal education , maternal age and year of 1st birth
Paternal deaths by lifetime number of pregnancies and term/preterm preeclampsia in first singleton pregnancy.
CARDIOVASCULAR DEATHS (CHD and Stroke, combined)
LIFETIME NUMBER OF PREGNANCIES HR (95%C.I.) ADJUSTED (*)
Men whose partner had one pregnancy0 No preeclampsia 1.7 (1.6-1.7)1 Term preeclampsia 1.6 (1.4-1.8)
2 Preterm preeclampsia 1.6 (1.2-2.1)
Men whose partner had two or more pregnancies3 No preeclampsia 1.0 (ref.)4 Term preeclampsia 0.99 (0.91-1.1)
5 Preterm preeclampsia 0.94 (0.75-1.2)
(*) HR=Hazard Ratio with 95% confidence interval, adjusted for paternal education , paternal age and year of 1st birth

06.10.2016
31
- no preeclampsia
20-39 40-49 50-59 60-690,50,60,8
1,52
34568
1520
3040
1
10
- preterm preeclampsia
20-39 40-49 50-59 60-69
HAZ
ARD
RAT
IO (9
5% C
.I.)
0,50,60,8
1,52
34568
1520
3040
1
10
- term preeclampsia
20-39 40-49 50-59 60-690,50,60,8
1,52
34568
1520
3040
1
10
MATERNAL AGE AT DEATH
20-39 40-49 50-59 60-69
HAZ
ARD
RAT
IO (9
5% C
.I.)
0,50,60,8
1,52
34568
15203040
1
10
MATERNAL AGE AT DEATH
20-39 40-49 50-59 60-690,50,60,8
1,52
34568
15203040
1
10
MATERNAL AGE AT DEATH
20-39 40-49 50-59 60-690,50,60,8
1,52
34568
1520
3040
1
10
ONE PREGNANCY
2+ PREGNANCIES
HAZARD RATIOS FOR MATERNAL DEATH (CVD) BY AGE-CATEGORIES AT DEATH
references
Gestational diabetes in 2nd pregnancy for women with preeclampsia in 1st, by gestational age and z-score of birthweight by gestational age in 1st, relative to women with no preeclampsia (week 39-42);excluding women with diabetes in 1st pregnancy.
Gestational week, 1st pregnancy
25-34 35-36 37-38 39-42
OR
(95%
C.I.
)
0,70,85
1,52
34567
8,5
15
1
10
z <= medianz > median

06.10.2016
32
The GOS syndrome(great obstetric syndrome)
7 factors:Preeclampsia, Preterm Birth, PerinatalDeath, Gestational Diabetes, Placental abruption, Fetal Growth Retardation,
Macrosomia
… and all siblings
These factors are interrelated, and they all have an effect on maternal longterm survival

06.10.2016
33
GOS syndrome and maternal CVD death
Total number of complications0 1 2 3 4 5 6
Haza
rd R
atio
0.8
1.52
34568
15
1
101 pregn.
2 pregn.
3 pregn.
4 pregn.
Ref.
Figure 7: Parity specific GOS risk by history
of GOS, 1st birth in 1967-2002, followed to 2014
(solid=yes; non-solid=no)
Birth order1 2 3 4
Per C
ent
15
20
25
30
35
40
45
50
55
60
65

06.10.2016
34
Preeclampsia and paradoxes:• Smoking reduce the occurrence of preeclampsia
(to almost the half for heavy smokers) • Breast cancer is reduced 20-30%

06.10.2016
35
Conclusions
Pregnancy complicationsand maternal longterm disease or death?
• Not only preeclampsia• Not only 1st pregnancy• Not only CVD mortality
the end