Embed Size (px)
Citation preview
N.S.A Derkyi, B. Adu-Amankwa, D. Sekyere & N.A. Darkwa
International Journal of Applied Sciences (IJAS), Volume (2) : Issue (1) : 2011 1
Rapid Prediction of Extractives and Polyphenolic Contents in Pinus caribaea Bark Using Near Infrared Reflectance Spectroscopy
Nana Sarfo Agyemang Derkyi [email protected] Forest Products and Marketing Division CSIR-Forestry Research Institute of Ghana Kumasi, Ghana
Benjamin Adu-Amankwa [email protected] Chemical Engineering Department Kwame Nkrumah University of Science and Technology Kumasi, Ghana
Daniel Sekyere [email protected] Wood Industry Development and Trade Division CSIR-Forestry Research Institute of Ghana Kumasi, Ghana
Nicholas Albert Darkwa [email protected] Renewable Natural Resources Faculty Kwame Nkrumah University of Science and Technology Kumasi, Ghana
Abstract
The potential of near infrared reflectance spectroscopy (NIRS) for rapidly and accurately determining the extractives and polyphenol contents in Pinus caribaea bark extracts was assessed. Pinus caribaea bark samples were obtained from 110 trees in plantation stands at different locations of Ghana and were then scanned by NIRS. Their extractives and polyphenol contents reference values were obtained by TAPPI T204 om-88 and Folin-Ciocalteu methods respectively. These reference values were regressed against different spectral transformations using partial least square (PLS) regression. First derivative transformation equation of the raw spectral data, resulted in a coefficient of determination r2 in the external validation of 0.91 and 0.97 respectively for extractives content and polyphenol content. The calibration samples covered a wide range of extractives content from 34 – 45% and polyphenolic content from 16 – 23.5%. The standard deviation to root mean square error of cross validation ratio (SD/RMSECV), root mean square error of calibration to standard deviation ratio (RMSEC/SD), RMSECV/RMSEC and r2 for both extractives and polyphenol models were indicative of good prediction equations. The predicted values were thus highly correlated with time-consuming wet chemical measured values of extractives content and polyphenol content. The use of NIRS for the determination of the extractives and polyphenol contents in Pinus caribaea bark thus provides an advantage of time saving and cost of analysis. Keywords: Folin-Ciocalteu Assay, Chemometric Modeling, Soxhlet Extraction, First Derivative, Spectroscopy
1. INTRODUCTION Polyphenolic and extractives contents are very important for most wood utilization. In the adhesive industry, the polyphenolic and extractives contents affect product quality, process and production costs. Nevertheless, there is no established on-line method suitable for the determination of polyphenolic and extractives contents in the raw material, wood bark. Near infrared spectroscopy (NIRS) combined with chemometrics might offer such applications.

N.S.A Derkyi, B. Adu-Amankwa, D. Sekyere & N.A. Darkwa
International Journal of Applied Sciences (IJAS), Volume (2) : Issue (1) : 2011 2
Pinus caribaea is a plantation softwood species for wood production in Ghana. Extractives from P. caribaea bark have been studied in relation to wood adhesives production. These studies have revealed that P. caribaea bark contains significant amounts of polyphenols which can be useful as a basis for waterproof and durable wood adhesives when reacted with formaldehyde [1,2,3,4,5,6,7,8]. An alternative to wet chemical analysis of wood bark is NIRS. Absorption bands relating to many chemical bonds, such as: C–H, N–H, O–H, S–H, C=O and C=C, are found in the NIR region, from 780 to 2500 nm. The NIR spectrum shows overtone and combination bands of these groups. Unfortunately, the absorption bands in the NIR region are broad and overlap, which means that conventional univariate calibration techniques, using only one wavelength per component for evaluations, cannot be applied in cases of overlapping bands. The development of more sophisticated statistical tools, like the most widely used partial least square (PLS) regression multivariate method for analysis, gave the possibility for the broad application of NIR spectroscopy to many analytical laboratories. NIR spectroscopy offers a number of advantages for qualitative and quantitative analysis and process control applications, such as: no sample preparation, no waste, reduced costs, fast measurements and analysis, fiber optics for remote measurements, high analysis accuracy and ease of use. With the near-infrared reflectance technique, the sample to be analyzed is subjected to NIR radiation; the sample absorbs part of the energy, while the rest is dispersed in all directions. The dispersed light gives information about the composition of the test sample and the resulting spectrum is used in qualitative and quantitative analysis. The best frequency intervals are in the region of the spectrum in which the reflected light intensity best correlates with the concentrations of the analyzed chemical species. Mathematical modeling using data obtained from wet chemical methods and spectra information can be performed using classical least squares, multiple linear regression, principal component regression, and partial least squares. The latter has the versatility to predict more than one variable, because a non-iterative PLS algorithm is used to calculate model parameters [9]. This advantage has made PLS used extensively for NIRS applications in wood samples [10,11,12]. There is a broad range of analytical applications of NIRS in the agricultural, food, petrochemical polymer and textile industries [13,14,15]. This technology is also being used to an increasing extent in the forest and wood sectors. For wood products, NIRS is mainly used for rapid prediction of pulp yield and pulping characteristics [11,16,17]. NIRS technology is now being developed and calibrated to replace classical wet chemical methods for wood applications. One of the main problems affecting the utilization of bark tannins in the manufacture of bio-adhesives is that the raw material (bark) each time has to be analysed for its chemical constituents in order to use it appropriately. However, the classical chemical methods of analysis are tedious, time-consuming and costly. The aim of this study therefore was to investigate whether NIRS could be used to rapidly and accurately predict polyphenolic content and extractives content of P. caribaea bark.
2. MATERIALS AND METHODS 2.1 Materials Pinus caribaea bark, obtained from 110 trees in plantation stands at the moist and dry semi-deciduous forest zones of Ghana, were dried at 40°C for 48 h in a convection oven, ground in a Wiley mill to 100 - 250 µm particle size, sealed in a plastic bag, and stored at room temperature until use. The samples were milled to effect solvent extractions. All chemicals used were of analytical grade, obtained from commercial suppliers. 2.2 Chemical Analysis For each of the 110 trees, 20 g of the dried powdered bark sample was extracted using a soxhlet extractor. Extractions were carried out successively with 60% aqueous acetone and 70% aqueous ethanol for three hours each. Extractive contents were determined gravimetrically according to TAPPI T204 om-88 [18]. The total extractives content was calculated by summing the acetone extractives and ethanol extractives contents. All samples were analyzed in duplicate.
N.S.A Derkyi, B. Adu-Amankwa, D. Sekyere & N.A. Darkwa
International Journal of Applied Sciences (IJAS), Volume (2) : Issue (1) : 2011 3
The phenolic content was determined in the acetone and the ethanol extracts by means of a modified Folin-Ciocalteu assay [19]. For each extract, 0.5ml was put in a test tube and 0.5 ml distilled water added. 0.5ml of Folin-Ciocalteu reagent was added followed by 2.5 ml 20% Na2CO3 solution. The tube was vortexed and the absorbance at 765 nm taken after 60 min on a Beckman DU 650 UV-VIS spectrophotometer. The amount of total extractable phenolics as gallic acid equivalent was calculated from a calibration curve using standard gallic acid solution, and expressed on a dry matter basis. All samples were run in duplicate. 2.3 Near Infrared Spectra Aquisition Each of the 110 powdered un-extracted bark samples was placed in a NIRSystem micro sample cup. Near-infrared (NIR) spectra were recorded on a Bruker FT-IR spectrometer to measure diffuse reflected light in the range 800 to 2,600 nm from the sample held in the spinning sample holder. Sixty four scans were accumulated for the sample with a spectral resolution of 8 cm
-1 and the results averaged. After the
spectrum had been obtained, the sample cup was emptied, repacked with the next sample and the spectrum obtained. The background was taken with a sintered gold reference standard. 2.4 Calibration Modeling Chemometric modelling was performed with the OPUS software package (version 5.5). For pre-processing, the algorithms of full multiplicative scatter correction, first derivative (smoothed and derived according to Savitzky and Golay [20]), straight line subtraction and standard normal variate among others were applied. Wavelength selection was done manually as well as automatically by means of the Martens Uncertainty test [21], to eliminate unimportant variables to simplify the models and make them more reliable. Calibrations were developed (based on NIR spectra and wet chemical analysis of polyphenol content and extractives content) using partial least squares (PLS) regression after principal component analysis (PCA) had been performed on the global samples spectra which was also done after checking on the normal distribution of the samples. Calibrations were tested by full cross-validation and predicted extractives content and polyphenol content were compared to measured ones. The root mean square error was calculated for the calibration samples and for the predicted samples.
3. RESULTS AND DISCUSSIONS A statistical summary of the polyphenolic content and extractives content of P. caribaea bark determined through wet chemical analysis is given in Table 1. A meaningful interpretation of calibration results depends to a large extent on the accuracy and precision of the wet chemical analysis of the samples. The extractives content of P. caribaea bark varied from 34% to 45%, with a mean and standard deviation of 39.4% and 2.42% respectively. The measured extractives content (N=110) were fairly normally distributed around the mean. Similarly, the polyphenol content of P. caribaea bark varied from 16% to 23.5% with a mean and standard deviation of 19.69% and 1.18% respectively. The measured polyphenol content (N=110) were also fairly normally distributed around the mean. The values determined for both extractives content and polyphenol content of the samples covered a large enough range, which was helpful for developing good models.
Parameter (%) N Range Mean Standard deviation
Extractives content
Polyphenol content
110
110
34 – 45
16 – 23.5
39.4
19.69
2.42
1.18
TABLE 1: Descriptive statistics for extractives content and phenolic content of bark samples.
N: total number of samples statistically analysed.
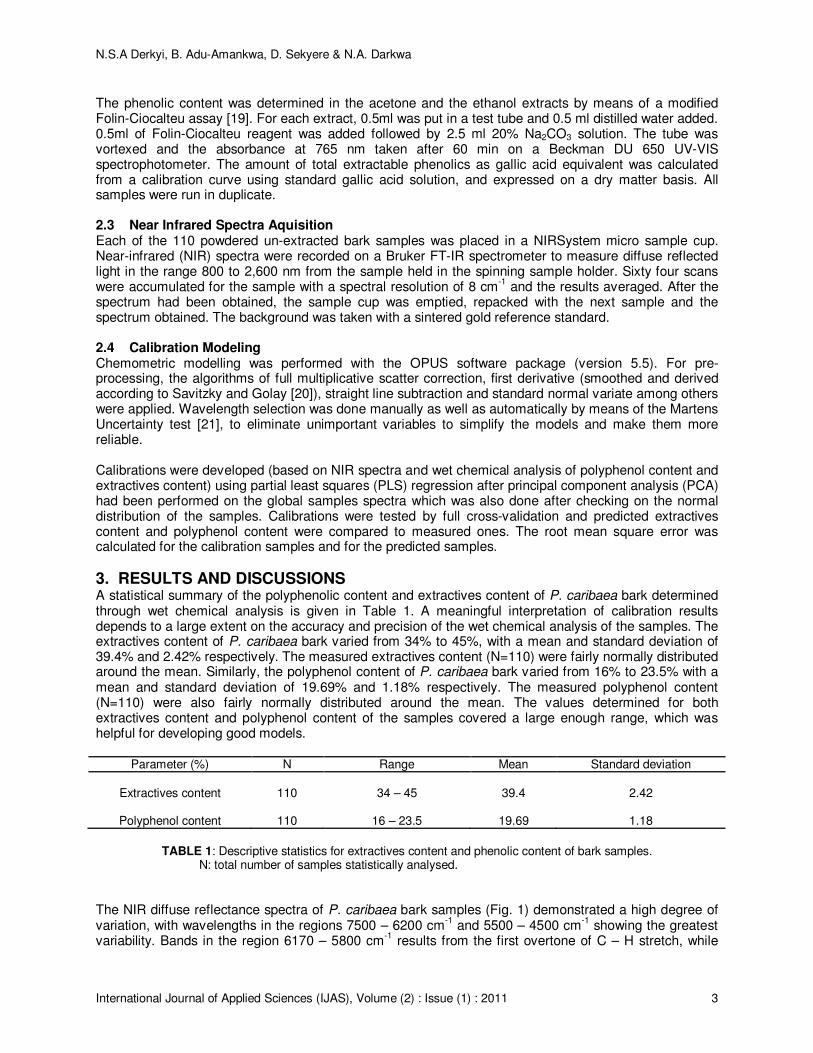
The NIR diffuse reflectance spectra of P. caribaea bark samples (Fig. 1) demonstrated a high degree of variation, with wavelengths in the regions 7500 – 6200 cm
-1 and 5500 – 4500 cm
-1 showing the greatest
variability. Bands in the region 6170 – 5800 cm-1
results from the first overtone of C – H stretch, while
N.S.A Derkyi, B. Adu-Amankwa, D. Sekyere & N.A. Darkwa
International Journal of Applied Sciences (IJAS), Volume (2) : Issue (1) : 2011 4
bands in the region 4760 – 4350 cm-1
mainly results from C – H, N – H and O – H combination bands [13,22]. Some of the compounds that have been noted have been assigned to specific wood components that are also present in bark. The band at 4760 cm has been assigned to cellulose [23] and starch [22] and the bands at 6000 and 5930 cm
-1 have been assigned to lignin [22,24]. Michell and Schimleck [25] in
a study of Eucalyptus Globulus Labill. Woods, noted that the bands at 5995, 4800 and 4690 cm-1
were all very well correlated with extractives and lignin content.
4000600080001000012000
Wavenumber cm-1
0.2
0.4
0.6
0.8
1.0
1.2
1.4
1.6
1.8
Ab
so
rba
nce
Un
its
FIGURE 1: Near infrared diffused reflectance spectra of P. caribaea bark.
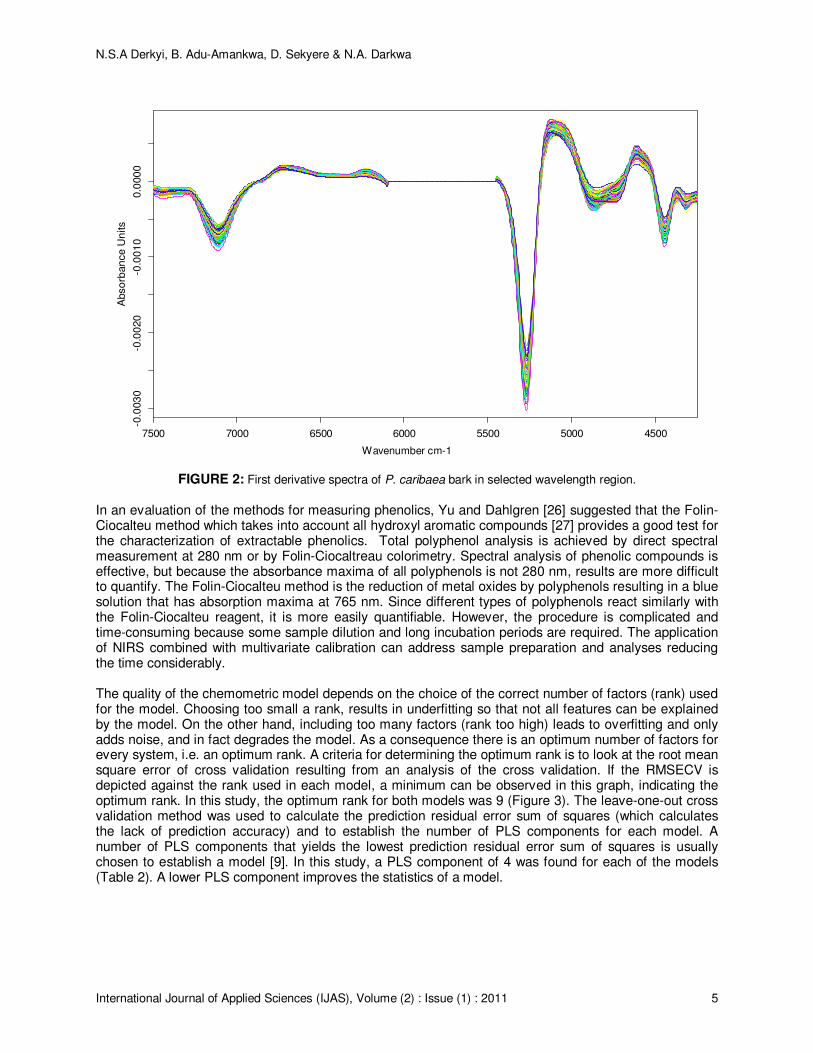
The optimal method of spectra processing (constant offset elimination, vector normalization, straight line subtraction, min-max normalization, multiplicative scatter correction, internal standard, first derivative and second derivative etc.) depends on the system studied. In this study, first derivative spectra processing with 15 point filter and second order polynomial at two frequency ranges (7500 – 6200 cm
-1 and 5500 –
4500 cm-1
) with the best positive correlation between the changes in the spectra and measured extractives and polyphenol contents data were chosen by the PLS algorithm (Fig. 2) to give the best results for the PLS calibration model. The best positive correlation between the changes in the spectra and measured data are in the frequency ranges with maximal absorption and the largest value for the correlation coefficient r
2.
N.S.A Derkyi, B. Adu-Amankwa, D. Sekyere & N.A. Darkwa
International Journal of Applied Sciences (IJAS), Volume (2) : Issue (1) : 2011 5
4500500055006000650070007500
-0.0
03
0-0
.00
20
-0.0
01
00.0
00
0
Abso
rban
ce
Un
its
Wavenumber cm-1
FIGURE 2: First derivative spectra of P. caribaea bark in selected wavelength region.
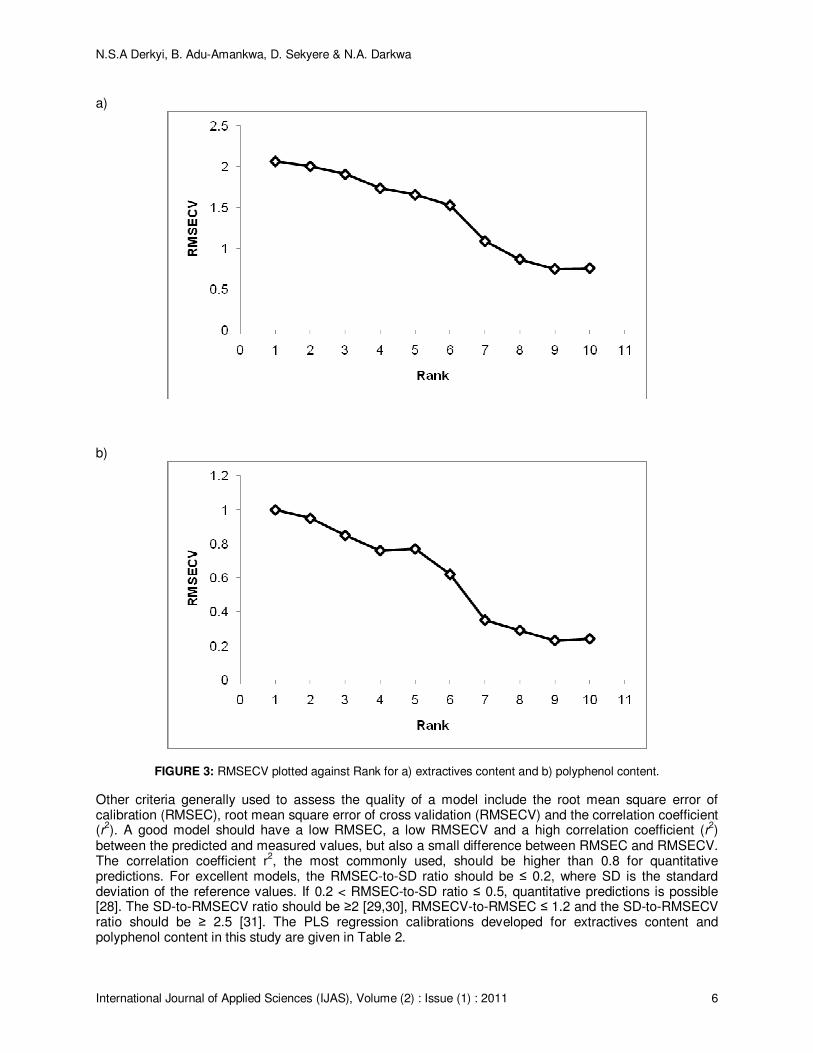
In an evaluation of the methods for measuring phenolics, Yu and Dahlgren [26] suggested that the Folin-Ciocalteu method which takes into account all hydroxyl aromatic compounds [27] provides a good test for the characterization of extractable phenolics. Total polyphenol analysis is achieved by direct spectral measurement at 280 nm or by Folin-Ciocaltreau colorimetry. Spectral analysis of phenolic compounds is effective, but because the absorbance maxima of all polyphenols is not 280 nm, results are more difficult to quantify. The Folin-Ciocalteu method is the reduction of metal oxides by polyphenols resulting in a blue solution that has absorption maxima at 765 nm. Since different types of polyphenols react similarly with the Folin-Ciocalteu reagent, it is more easily quantifiable. However, the procedure is complicated and time-consuming because some sample dilution and long incubation periods are required. The application of NIRS combined with multivariate calibration can address sample preparation and analyses reducing the time considerably. The quality of the chemometric model depends on the choice of the correct number of factors (rank) used for the model. Choosing too small a rank, results in underfitting so that not all features can be explained by the model. On the other hand, including too many factors (rank too high) leads to overfitting and only adds noise, and in fact degrades the model. As a consequence there is an optimum number of factors for every system, i.e. an optimum rank. A criteria for determining the optimum rank is to look at the root mean square error of cross validation resulting from an analysis of the cross validation. If the RMSECV is depicted against the rank used in each model, a minimum can be observed in this graph, indicating the optimum rank. In this study, the optimum rank for both models was 9 (Figure 3). The leave-one-out cross validation method was used to calculate the prediction residual error sum of squares (which calculates the lack of prediction accuracy) and to establish the number of PLS components for each model. A number of PLS components that yields the lowest prediction residual error sum of squares is usually chosen to establish a model [9]. In this study, a PLS component of 4 was found for each of the models (Table 2). A lower PLS component improves the statistics of a model.
N.S.A Derkyi, B. Adu-Amankwa, D. Sekyere & N.A. Darkwa
International Journal of Applied Sciences (IJAS), Volume (2) : Issue (1) : 2011 6
a)
b)
FIGURE 3: RMSECV plotted against Rank for a) extractives content and b) polyphenol content.
Other criteria generally used to assess the quality of a model include the root mean square error of calibration (RMSEC), root mean square error of cross validation (RMSECV) and the correlation coefficient (r
2). A good model should have a low RMSEC, a low RMSECV and a high correlation coefficient (r
2)
between the predicted and measured values, but also a small difference between RMSEC and RMSECV. The correlation coefficient r
2, the most commonly used, should be higher than 0.8 for quantitative
predictions. For excellent models, the RMSEC-to-SD ratio should be ≤ 0.2, where SD is the standard deviation of the reference values. If 0.2 < RMSEC-to-SD ratio ≤ 0.5, quantitative predictions is possible [28]. The SD-to-RMSECV ratio should be ≥2 [29,30], RMSECV-to-RMSEC ≤ 1.2 and the SD-to-RMSECV ratio should be ≥ 2.5 [31]. The PLS regression calibrations developed for extractives content and polyphenol content in this study are given in Table 2.
N.S.A Derkyi, B. Adu-Amankwa, D. Sekyere & N.A. Darkwa
International Journal of Applied Sciences (IJAS), Volume (2) : Issue (1) : 2011 7
Model N PLS Comp
RMSEC RMSECV RMSEC/SD SD/RMSECV RMSECV/RMSEC R2
EC (%)
PC (%)
110
110
04
04
0.65
0.21
0.72
0.23
0.26
0.17
3.36
5.13
1.10
1.09
0.91
0.96
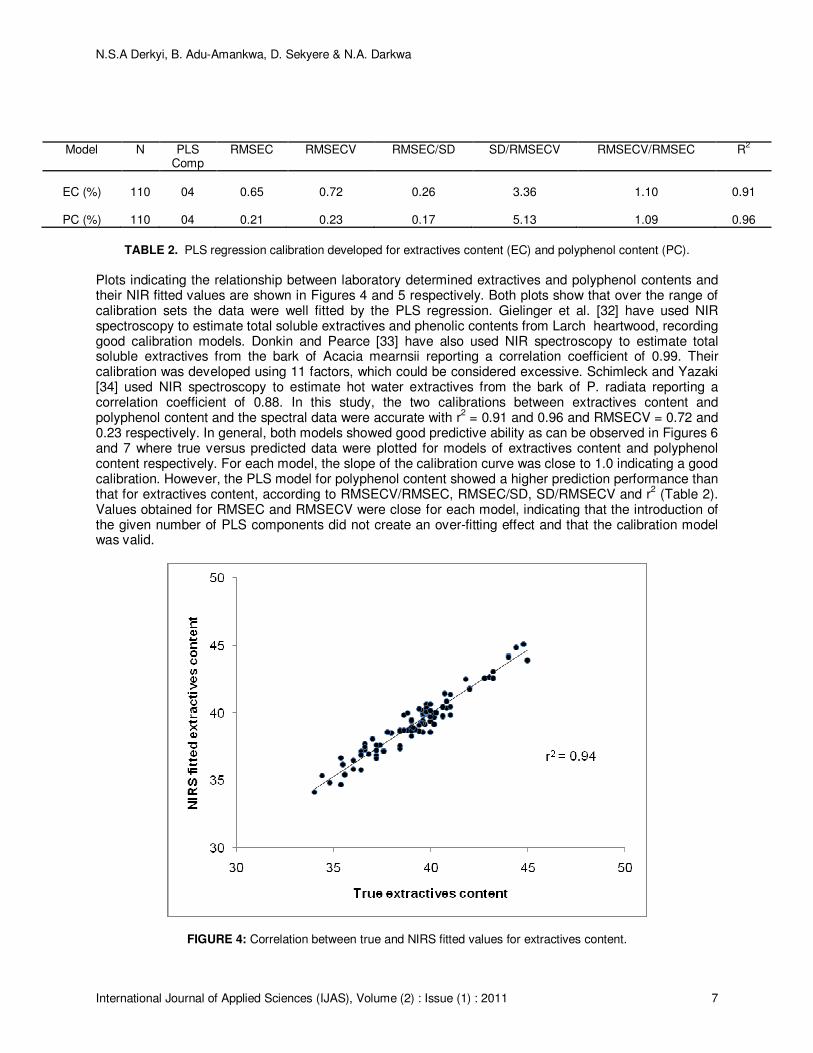
TABLE 2. PLS regression calibration developed for extractives content (EC) and polyphenol content (PC).
Plots indicating the relationship between laboratory determined extractives and polyphenol contents and their NIR fitted values are shown in Figures 4 and 5 respectively. Both plots show that over the range of calibration sets the data were well fitted by the PLS regression. Gielinger et al. [32] have used NIR spectroscopy to estimate total soluble extractives and phenolic contents from Larch heartwood, recording good calibration models. Donkin and Pearce [33] have also used NIR spectroscopy to estimate total soluble extractives from the bark of Acacia mearnsii reporting a correlation coefficient of 0.99. Their calibration was developed using 11 factors, which could be considered excessive. Schimleck and Yazaki [34] used NIR spectroscopy to estimate hot water extractives from the bark of P. radiata reporting a correlation coefficient of 0.88. In this study, the two calibrations between extractives content and polyphenol content and the spectral data were accurate with r
2 = 0.91 and 0.96 and RMSECV = 0.72 and
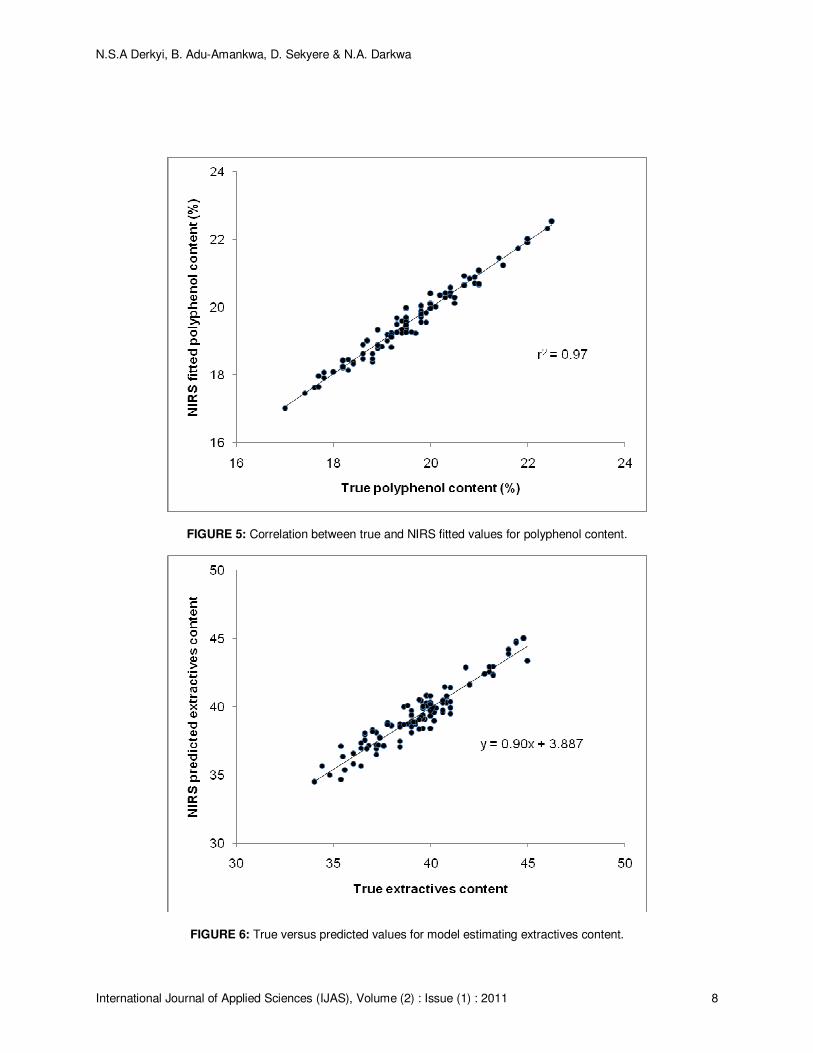
0.23 respectively. In general, both models showed good predictive ability as can be observed in Figures 6 and 7 where true versus predicted data were plotted for models of extractives content and polyphenol content respectively. For each model, the slope of the calibration curve was close to 1.0 indicating a good calibration. However, the PLS model for polyphenol content showed a higher prediction performance than that for extractives content, according to RMSECV/RMSEC, RMSEC/SD, SD/RMSECV and r
2 (Table 2).
Values obtained for RMSEC and RMSECV were close for each model, indicating that the introduction of the given number of PLS components did not create an over-fitting effect and that the calibration model was valid.
FIGURE 4: Correlation between true and NIRS fitted values for extractives content.
N.S.A Derkyi, B. Adu-Amankwa, D. Sekyere & N.A. Darkwa
International Journal of Applied Sciences (IJAS), Volume (2) : Issue (1) : 2011 8
FIGURE 5: Correlation between true and NIRS fitted values for polyphenol content.
FIGURE 6: True versus predicted values for model estimating extractives content.

N.S.A Derkyi, B. Adu-Amankwa, D. Sekyere & N.A. Darkwa
International Journal of Applied Sciences (IJAS), Volume (2) : Issue (1) : 2011 9
FIGURE 7: True versus predicted values for model estimating polyphenol content.
4. CONCLUSSION As the use of natural adhesives becomes more common, the need has arisen for an analytical method capable of rapidly and noninvasively assessing phenolic content in wood biomass. This study has demonstrated the high reliability of NIRS in determining extractives and polyphenolic contents in P. caribaea bark. These compounds have great significance in adhesives formulation, and the availability of NIRS to measure them may help adhesive technologist to develop improved adhesives through rapid, cost-effective and nondestructive NIRS analysis. By means of multivariate calibration techniques (PLS), relationships were established between reflectance spectra and extractives content and polyphenol content of Pinus caribaea bark. The first derivative spectra with PLS were found to provide the best predictions for the extractives and polyphenol contents of Pinus caribaea bark with a RMSECV of 0.72 and 0.23 and coefficient of determination (r
2) of 0.91 and 0.96 respectively. The non-destructive FT-NIR
measurements thus provided good estimation of the extractives content and polyphenol content of Pinus caribaea bark and could therefore be of practical importance.
5. REFERENCES 1. Y. Yazaki and W.E. Hillis. “Polyphenolic extractives of Pinus radiata bark”. Holzforschung, 31(1):20- 25, 1997 2. Y. Yazaki and W.E. Hillis. “Molecular size distribution of radiate pine bark extracts and its effects on properties”. Holzforschung, 34(1):125-130, 1980 3. A. Pizzi. “Pine tannin adhesives for particle board”. Holz Roh-Wekstoff, 40(1):293-301 1982 4. D.J. Jenkin. “Adhesives from Pinus radiata bark estraction”. In: International Symposium on Adhesion and Adhesives. Washington State University, Pullman, Washington, 1982 5. J.K. Woo, “Bark adhesives for particle board and plywood”. In International Symposium on Adhesion and Adhesives. Washington State University, Pullman, Washington, 1982
N.S.A Derkyi, B. Adu-Amankwa, D. Sekyere & N.A. Darkwa
International Journal of Applied Sciences (IJAS), Volume (2) : Issue (1) : 2011 10
6. V.J. Sealy-Fisher and A. Pizzi, “Increased pine tannins extraction and wood adhesives development by phlobaphenes minimization”. Holz Roh-Wekstoff. 50(1):212-220, 1992 7. A. Pizzi , E.P. von Leyser, J. Valenzulela and J.G. Clark. “The chemistry and development of pine tannin adhesives for exterior plywood”. Holzforschung 47(1):168-169, 1993 8. A. Pizzi , J. Valenzulela and C. Westmeyer. “Low formaldehyde emission, fast pressing pine and pecan tannin adhesives for exterior particleboard”. Holz Roh-Wekstoff, 52(1):311-315 1994 9. P. Geladi P and B.R. Kowalski, “Partial least squares regression: A tutorial”. Anal. Chim. Acta. 1986 10. R.J. Olson, P. Tomani, M. Karlsson, T. Josefsson, K. Sjoberg and C. Bjorklund, “Multivariate characterization of chemical and physical descriptors in pulp using NIRS”. Tappi J, 78(10):158-165, 1995 11. L.R. Schimleck, P.J. Wright, A.J. Michell and A.F.A. Wallis, “Near infrared spectra and chemical compositions of Eucalptus globules and E. nitens plantation woods”. Appita J, 50(1): 40-46, 1997 12. A. Marklund, J.B. Hauksson, U. Edlund and M. Sjostrom. “Multivariate data analysis based on orthogonal signal correction and near infrared spectroscopy”. Nord. Pulp Pap. Res. J, 14(2):140-148, 1999 13. B.G. Osborne, T. Fearn and P.H. Hindle. “Practical NIR Spectroscopy with Applications in Food and Beverage Analysis”. Longman Scientist and Technical, Harlow, UK. 1993 14. S. Wold. “Cross-validation estimation of the number of components in factor and principal components models”. Technometrics, 20(1):397-405, 1978 15. D. Betrand and E. Dufour. La spectroscopie infrarouge et ses applications analytiques. Collection sciences et technique agroalimentaires, édition Tec et Doc. 2000 16. L.R. Schimleck and A.J. Michell. “Determination of within-tree variation of kraft pulp yield using near infrared spectroscopy”. Appita J, 81(1):229-236, 1998 17. J.A. Wright, M.D. Birkett and M.J.T. Grambino. “Prediction of pulp yield and cellulose content from wood samples using near infrared reflectance spectroscopy”, Tappi J. 73(8):164- 166, 1990 18. Tappi test method T204 om-88, Solvent extractives of wood and pulp, 1997. 19. Singleton, V.L. and J.A. Jr. Rossi. “Colorimetry of total phenolics with phosphomolybdic- phosphotungstic acid reagents”. Am. J. Enol. Vitic., 16(1):144-158, 1965 20. A. Savitzky and M.J.E. Golay, “Smoothing and differentiation of data by simplified least squares Procedures”. Anal Chem, 36(1):1627-1639, 1964 21. F. Westad and H. Martens. “Variable selection in near infrared spectroscopy based on significance testing in partial least squares regression”. J. Near Infrared Spectrosc, 8(2):117-124, 2000 22. J.S. Shenk, J.J. Workmann, and M.O. Westerhaus. “Application of NIR spectroscopy to agricultural products”. In Handbook of Near Infrared Analysis. Ed by. D.A. Burns, E.W. Ciurczak. Marcel Dekker, New York. pp. 383-431 (1992) 23. K.H. Basset, C.H. Liang and R.H. Marchessault. “The infrared spectrum of crystalline polysaccharides, IX. The near infrared spectrum of cellulose”. J. Polym. Sci, 1(1):1687-1692 1963 24. F.E. Barton II and D.S. Himmelsbach. “Two-dimensional vibratiional spectroscopy II: Correlation of
N.S.A Derkyi, B. Adu-Amankwa, D. Sekyere & N.A. Darkwa
International Journal of Applied Sciences (IJAS), Volume (2) : Issue (1) : 2011 11
the absorptions of lignins in the mid- and near-infrared”. Appl. Spectrosc, 47(1): 1920-1925, 1993 25. A.J. Michell and L.R. Schimleck. “NIR spectroscopy of woods from Eucalyptus globules”. Appita J, 49(1):23-26, 1996 26. Z. Yu and R.A. Dahlgren. “Evaluation of methods for measuring polyphenols in conifer foliage”. Journal of Chemical Ecology, 26(1):2119-2140, 2000 27. L. Chapuis-Lardy, D. Contour-Ansel and F. Bernhard-Reversat. “High performance liquid chromatography of water-soluble phenolics in leaf litter of three Eucalyptus hybrids (Congo)”. Plant Science, 163(1):217-222, 2002 28. M.M. Couˆteaux, P. Rovira and B. Berg. “Near infrared reflectance spectroscopy for determination of organic matter fractions including microbial biomass in coniferous forest soils”. Soil Biology and Biochemistry, 35(1):1587-1600, 2003 29. C.W. Chang, D.A. Laird, M.J. Mausbach and C.R. Hurburgh. “Near infrared reflectance spectroscopy-principal components regression analyses of soil properties”. Soil Science Society of America Journal, 65(1):480-490, 2001 30. C. Chang and D.A. Laird. “Near-infrared reflectance spectroscopic analysis of soil C and N”. Soil Science, 167(1):110-116, 2002 31. G.W. Mathison, H. Hsu, R. Soofi-Siawash, G. Recinos-Diaz, E.K. Okine, J. Helm and P. Juskiw. “Prediction of composition and ruminal degradability characteristics of barley straw by near infrared reflectance spectroscopy”. Canadian Journal of Animal Science, 79(1):519-523, 1999 32. N. Gierlinger, M. Schwannminger, B. Hinterstoisser and R. Wimmer. “Rapid determination of heartwood extractives in Larix sp. by means of Fourier transform near infrared spectroscopy”. J. near infrared spectrosc, 10(1):203-214, 2002 33. M.J. Donkin and J. Pearce. “Tannin analysis by near infrared spectroscopy”. J. Soc. Leather Technol. Chem, 79(1):8-11, 1995 34. L.R. Schimleck and Y. Yazaki. “Analysis of Pinus radiata D. Don Bark by Near Infrared Spectroscopy”. Holzforscchung, 57(1):520-526, 2003