Embed Size (px)
Citation preview
Modelling and Managing Student Satisfaction: Use of student feedback to enhance learning experience
Vicky Marsh / Nai Li / Steph Lay/ Bart Rienties [email protected]
Modelling and Managing Student Satisfaction:
Use of student feedback to enhance learning experience
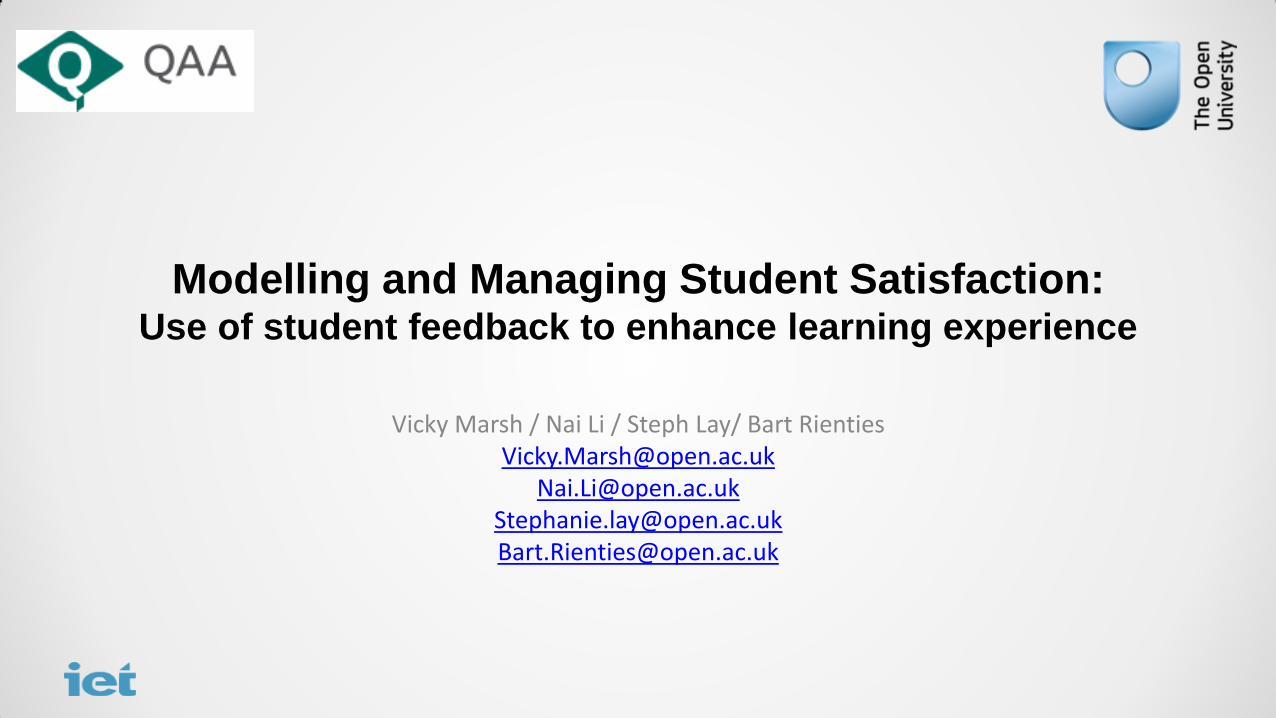
2 Research to Date
1 Overview of the Project
Case study: OU QA 3
Next steps 4
Background of QAA Study
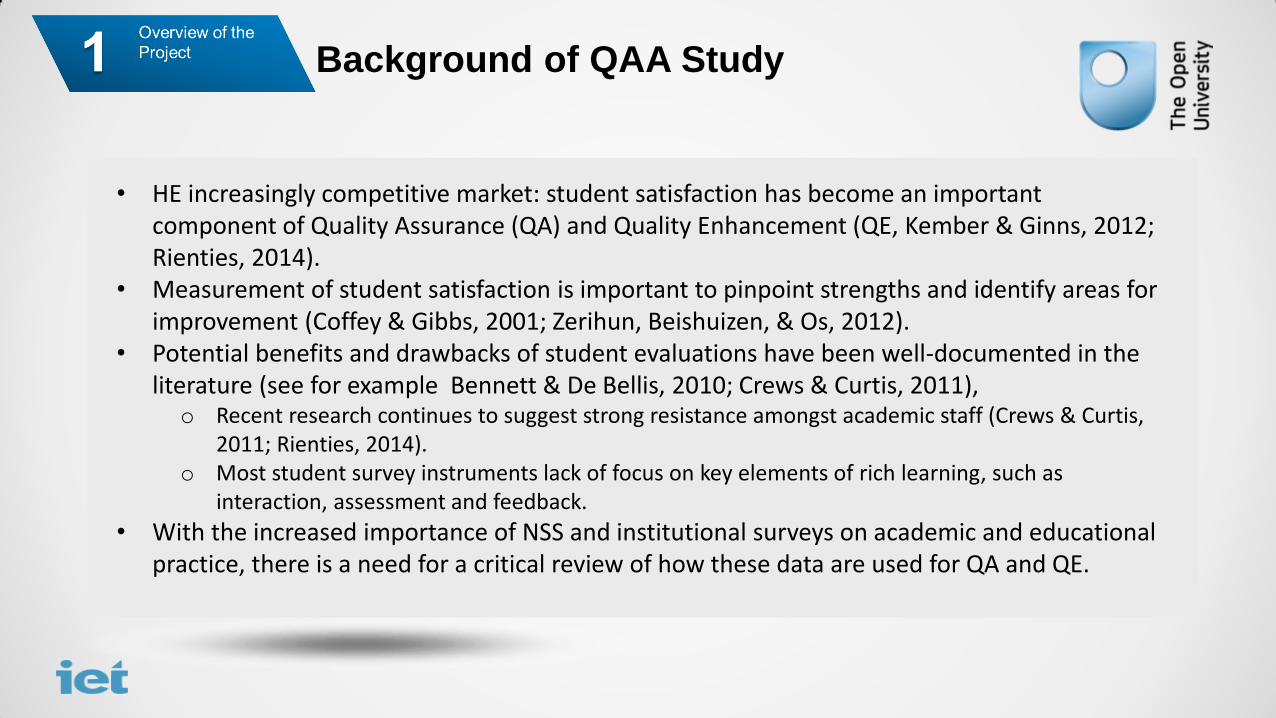
• HE increasingly competitive market: student satisfaction has become an important component of Quality Assurance (QA) and Quality Enhancement (QE, Kember & Ginns, 2012; Rienties, 2014).
• Measurement of student satisfaction is important to pinpoint strengths and identify areas for improvement (Coffey & Gibbs, 2001; Zerihun, Beishuizen, & Os, 2012).
• Potential benefits and drawbacks of student evaluations have been well-documented in the literature (see for example Bennett & De Bellis, 2010; Crews & Curtis, 2011), o Recent research continues to suggest strong resistance amongst academic staff (Crews & Curtis,
2011; Rienties, 2014). o Most student survey instruments lack of focus on key elements of rich learning, such as
interaction, assessment and feedback.
• With the increased importance of NSS and institutional surveys on academic and educational practice, there is a need for a critical review of how these data are used for QA and QE.
Key Questions of the Project
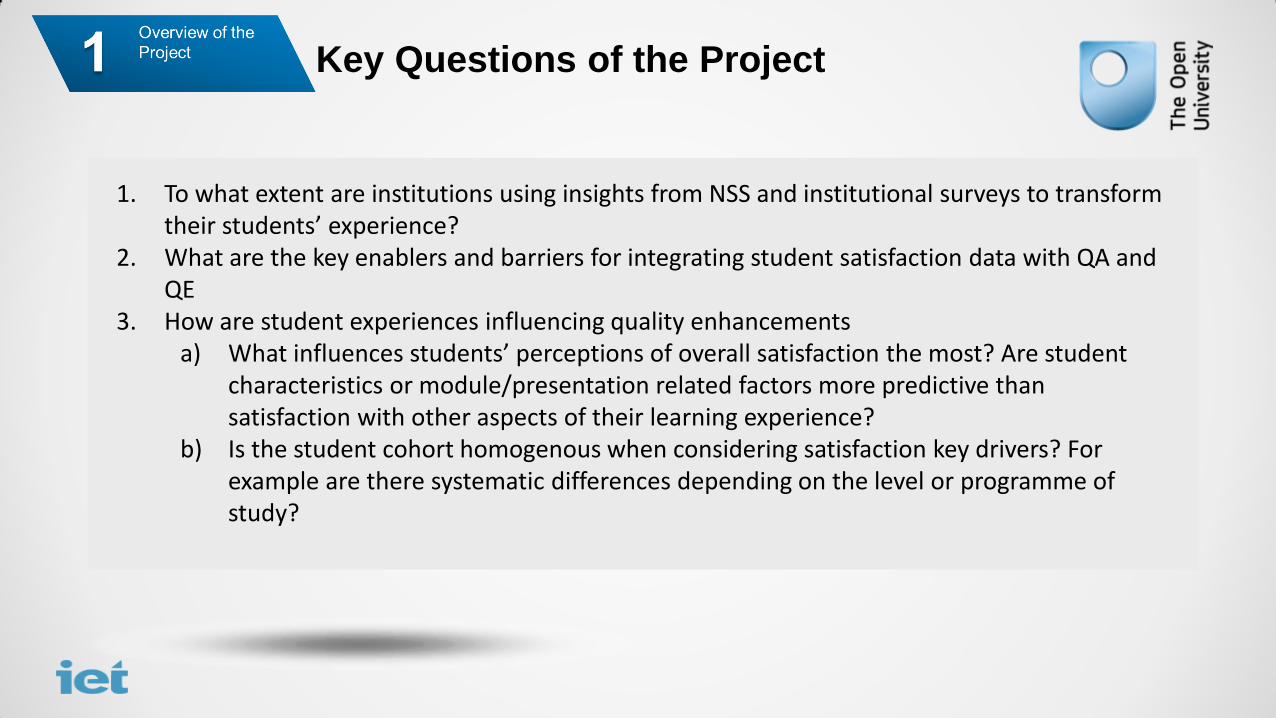
1. To what extent are institutions using insights from NSS and institutional surveys to transform their students’ experience?
2. What are the key enablers and barriers for integrating student satisfaction data with QA and QE
3. How are student experiences influencing quality enhancements a) What influences students’ perceptions of overall satisfaction the most? Are student
characteristics or module/presentation related factors more predictive than satisfaction with other aspects of their learning experience?
b) Is the student cohort homogenous when considering satisfaction key drivers? For example are there systematic differences depending on the level or programme of study?
Two Phases
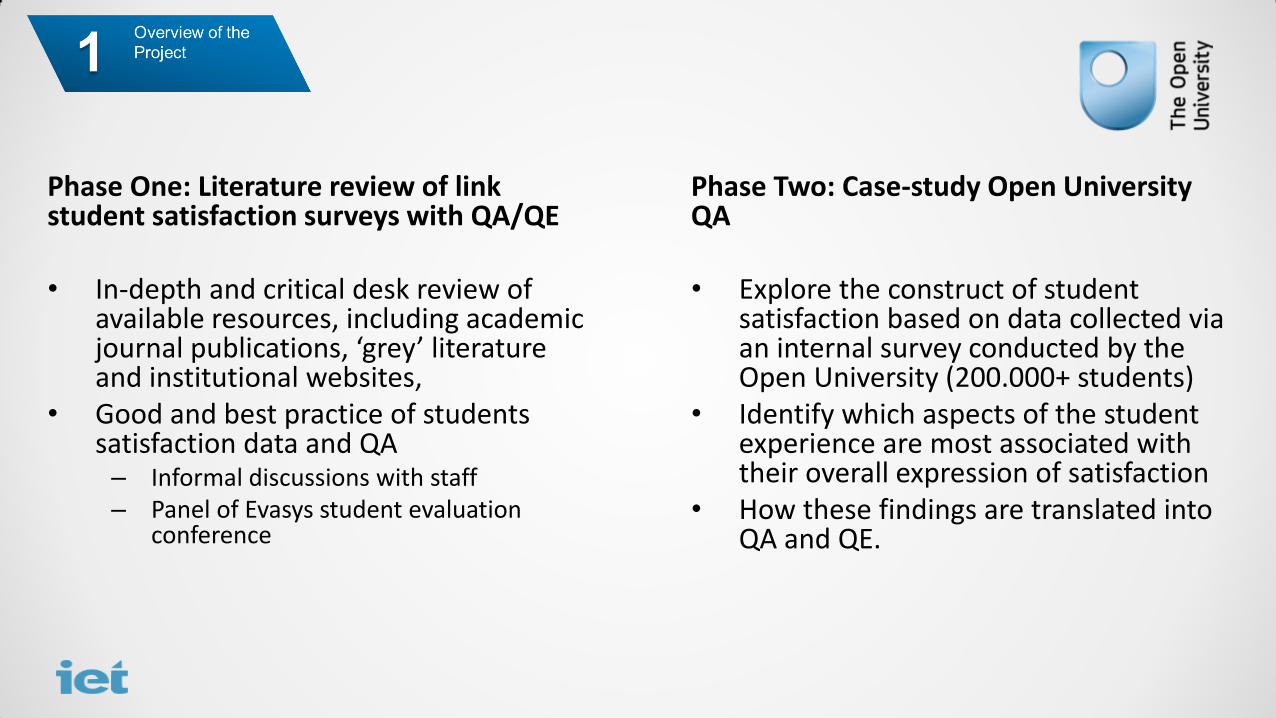
Phase One: Literature review of link student satisfaction surveys with QA/QE • In-depth and critical desk review of
available resources, including academic journal publications, ‘grey’ literature and institutional websites,
• Good and best practice of students satisfaction data and QA – Informal discussions with staff – Panel of Evasys student evaluation
conference
Phase Two: Case-study Open University QA • Explore the construct of student
satisfaction based on data collected via an internal survey conducted by the Open University (200.000+ students)
• Identify which aspects of the student experience are most associated with their overall expression of satisfaction
• How these findings are translated into QA and QE.
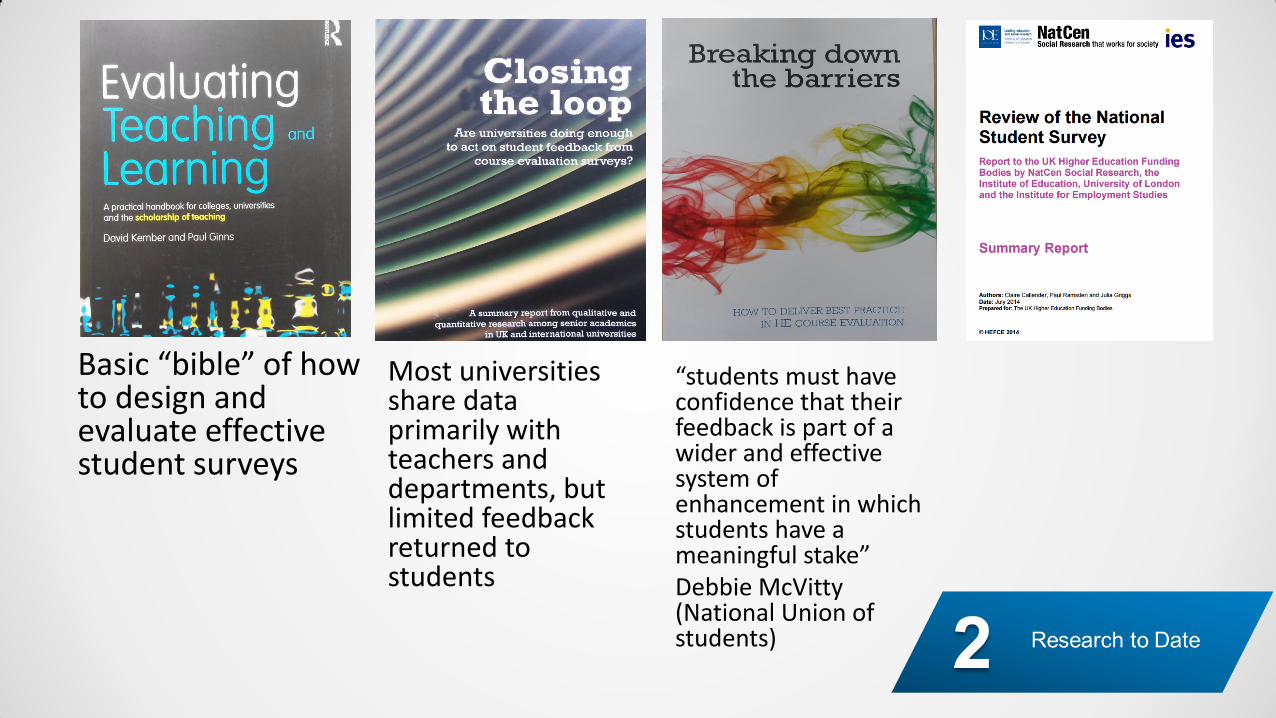
Basic “bible” of how to design and evaluate effective student surveys
Most universities share data primarily with teachers and departments, but limited feedback returned to students
“students must have confidence that their feedback is part of a wider and effective system of enhancement in which students have a meaningful stake” Debbie McVitty (National Union of students)

Key challenges for HE • How to provide student feedback
back to students (close-the-loop) • How to provide feedback to staff to
enhance their practice (academic development)
• How to provide feedback to senior management (professional development)
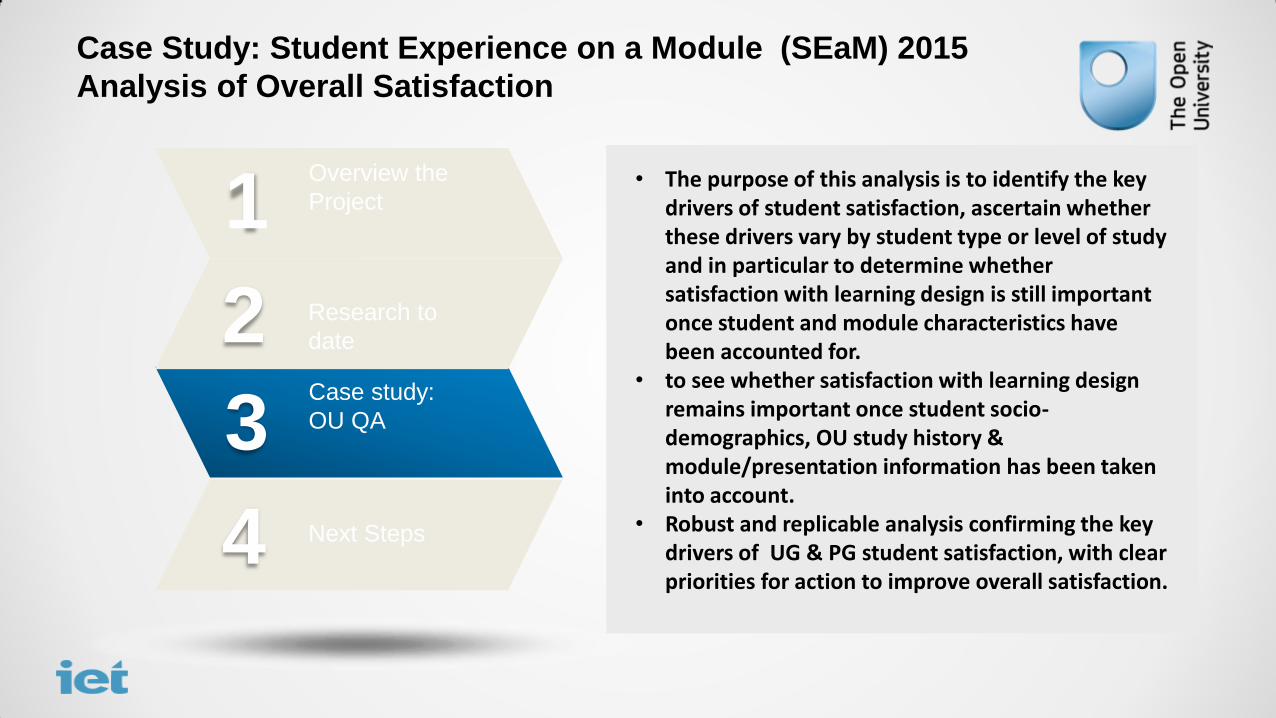
Case Study: Student Experience on a Module (SEaM) 2015
Analysis of Overall Satisfaction
• The purpose of this analysis is to identify the key drivers of student satisfaction, ascertain whether these drivers vary by student type or level of study and in particular to determine whether satisfaction with learning design is still important once student and module characteristics have been accounted for.
• to see whether satisfaction with learning design remains important once student socio-demographics, OU study history & module/presentation information has been taken into account.
• Robust and replicable analysis confirming the key drivers of UG & PG student satisfaction, with clear priorities for action to improve overall satisfaction.
Case study:
OU QA 3
Next Steps 4
Overview the
Project 1
Research to
date 2
10
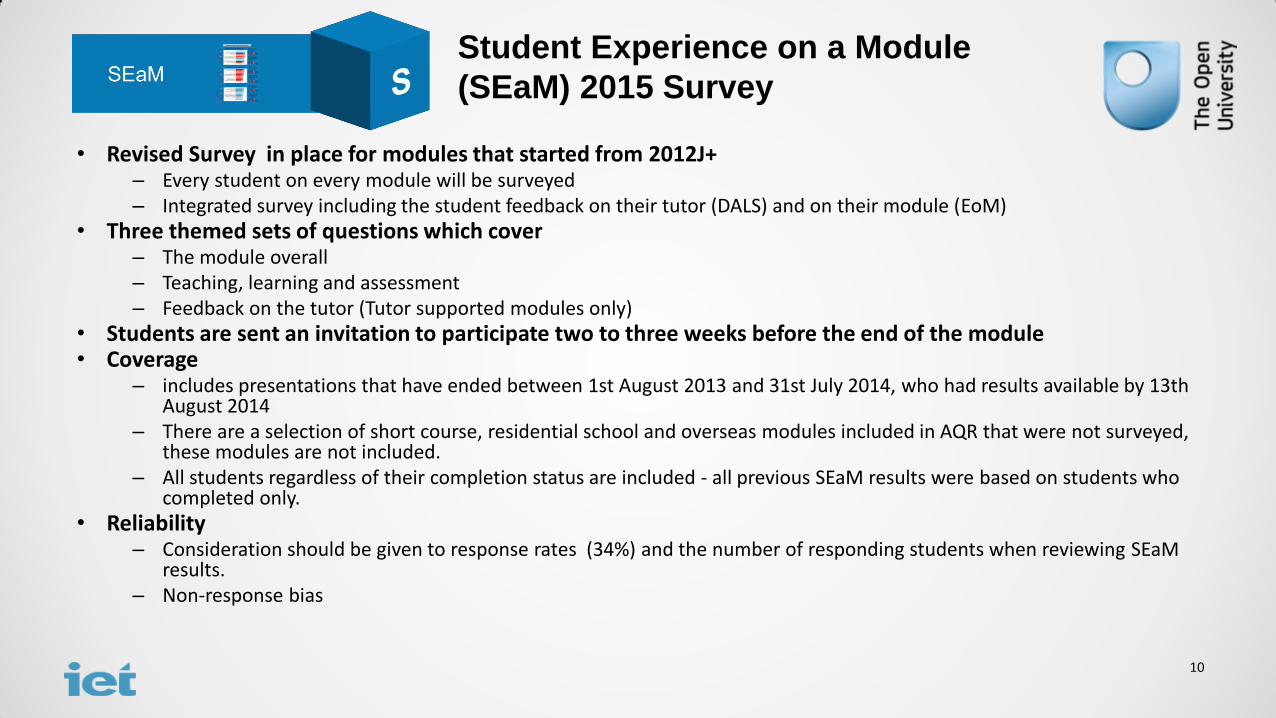
• Revised Survey in place for modules that started from 2012J+ – Every student on every module will be surveyed – Integrated survey including the student feedback on their tutor (DALS) and on their module (EoM)
• Three themed sets of questions which cover – The module overall – Teaching, learning and assessment – Feedback on the tutor (Tutor supported modules only)
• Students are sent an invitation to participate two to three weeks before the end of the module • Coverage
– includes presentations that have ended between 1st August 2013 and 31st July 2014, who had results available by 13th August 2014
– There are a selection of short course, residential school and overseas modules included in AQR that were not surveyed, these modules are not included.
– All students regardless of their completion status are included - all previous SEaM results were based on students who completed only.
• Reliability – Consideration should be given to response rates (34%) and the number of responding students when reviewing SEaM
results. – Non-response bias
Student Experience on a Module
(SEaM) 2015 Survey
Methodology (Logistic Regression)
& Validation
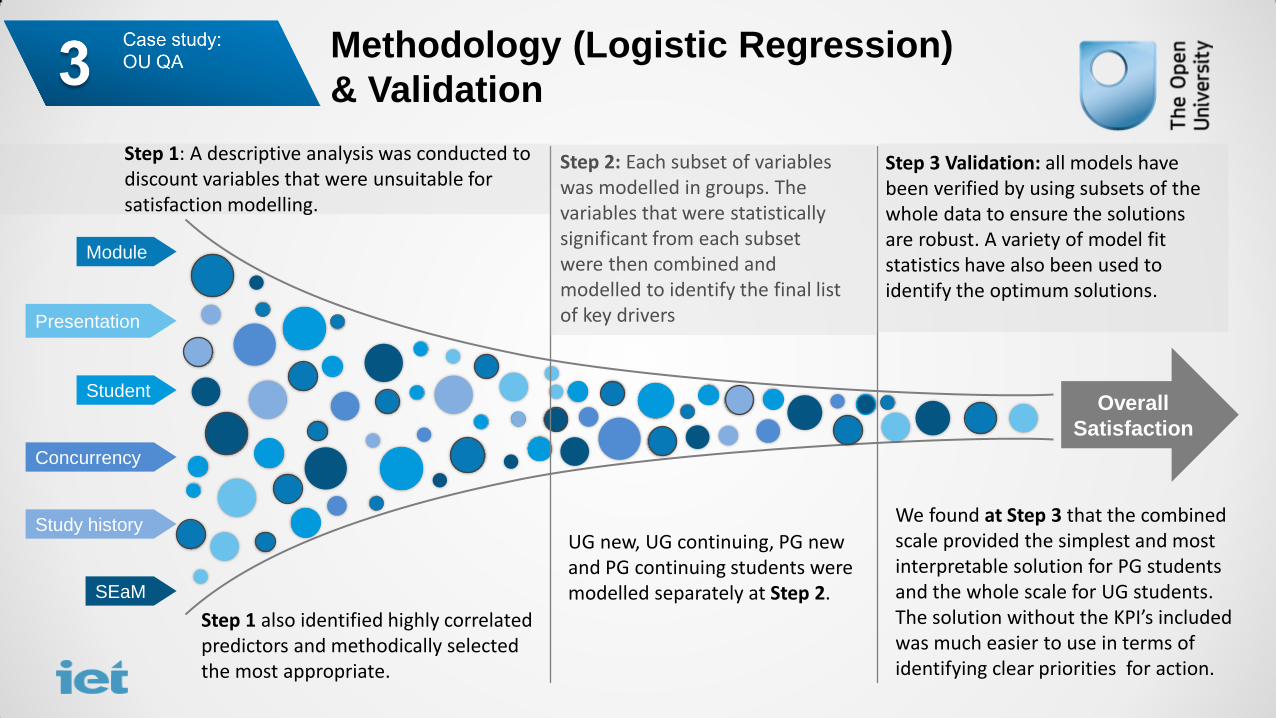
Step 1: A descriptive analysis was conducted to discount variables that were unsuitable for satisfaction modelling.
Step 1 also identified highly correlated predictors and methodically selected the most appropriate.
Module
Presentation
Student
Concurrency
Study history
Overall
Satisfaction
SEaM
UG new, UG continuing, PG new and PG continuing students were modelled separately at Step 2.
Step 2: Each subset of variables was modelled in groups. The variables that were statistically significant from each subset were then combined and modelled to identify the final list of key drivers
We found at Step 3 that the combined scale provided the simplest and most interpretable solution for PG students and the whole scale for UG students. The solution without the KPI’s included was much easier to use in terms of identifying clear priorities for action.
Step 3 Validation: all models have been verified by using subsets of the whole data to ensure the solutions are robust. A variety of model fit statistics have also been used to identify the optimum solutions.
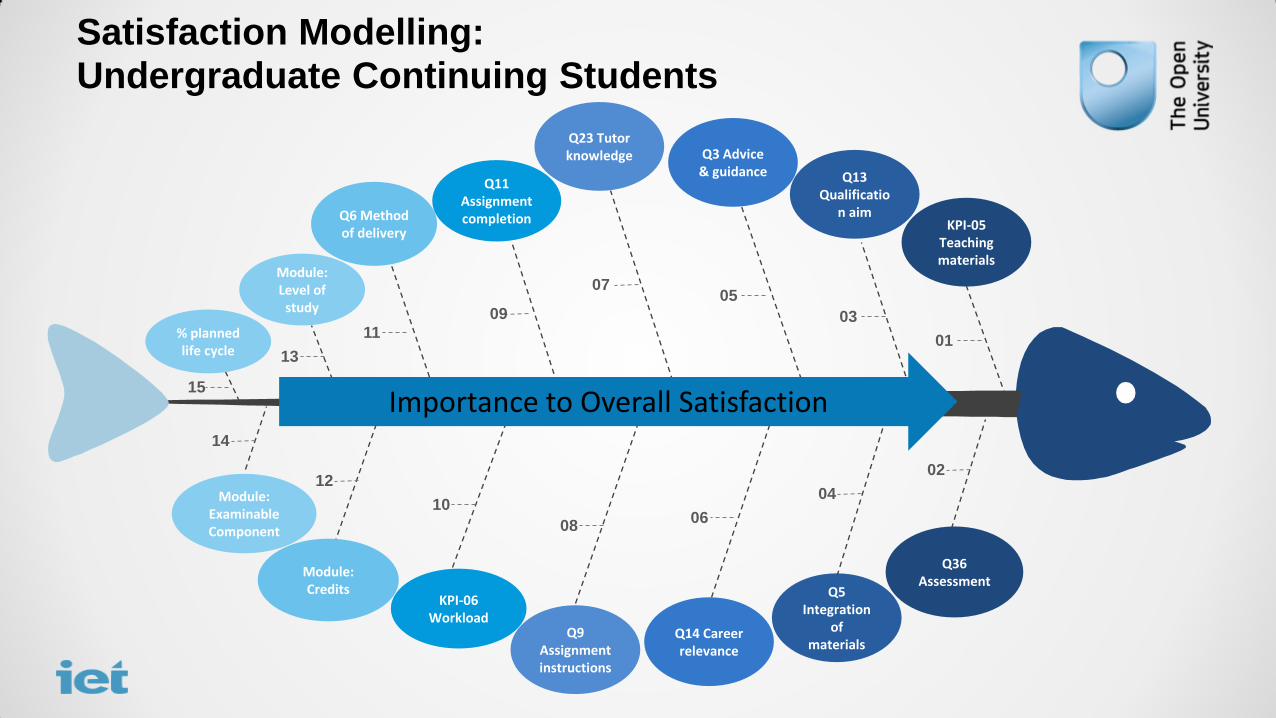
Satisfaction Modelling: Undergraduate Continuing Students
% planned life cycle
15
Module: Examinable Component
14
Module: Level of
study
13
Module: Credits
12
Q6 Method of delivery
11
Q11 Assignment completion
09
Q23 Tutor knowledge
07
Q3 Advice & guidance
05
Q13 Qualificatio
n aim
03
KPI-05 Teaching materials
01
KPI-06 Workload
10
Q9 Assignment instructions
08
Q14 Career relevance
06
Q5 Integration
of materials
04
Q36 Assessment
02
Importance to Overall Satisfaction
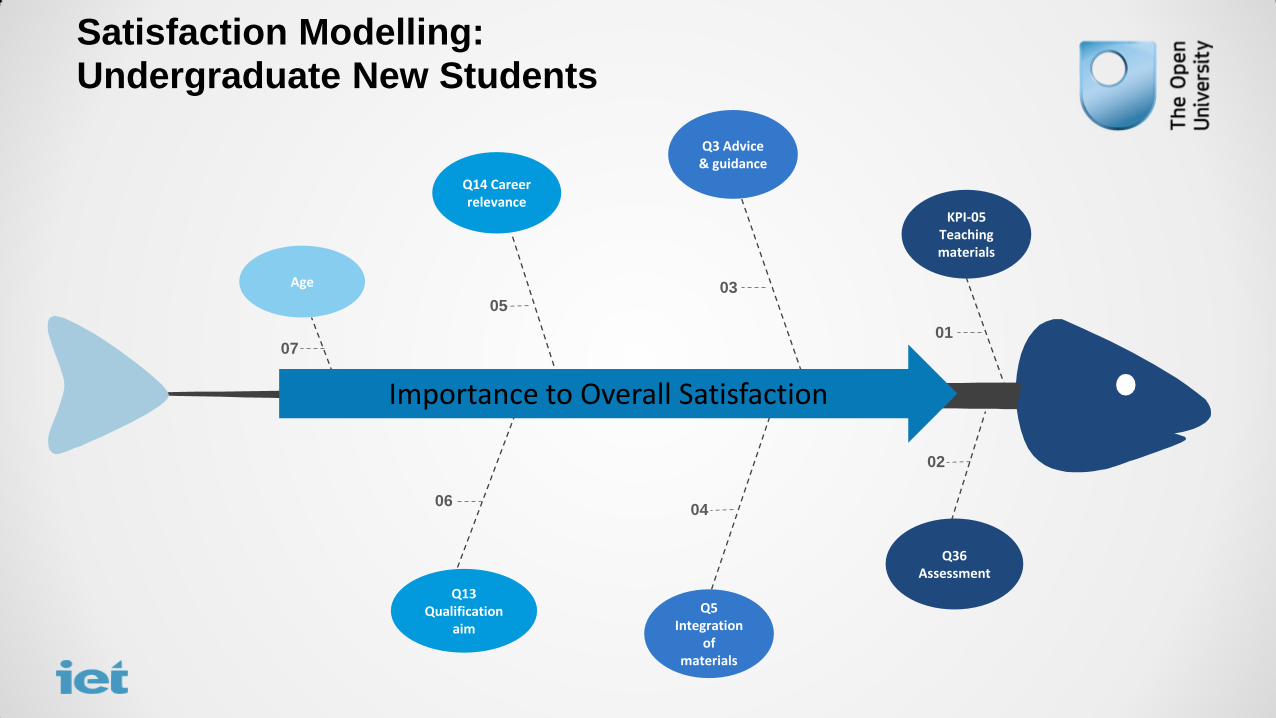
Satisfaction Modelling: Undergraduate New Students
Age
07
Q14 Career relevance
05
Q3 Advice & guidance
03
KPI-05 Teaching materials
01
Q13 Qualification
aim
06
Q5 Integration
of materials
04
Q36 Assessment
02
Importance to Overall Satisfaction
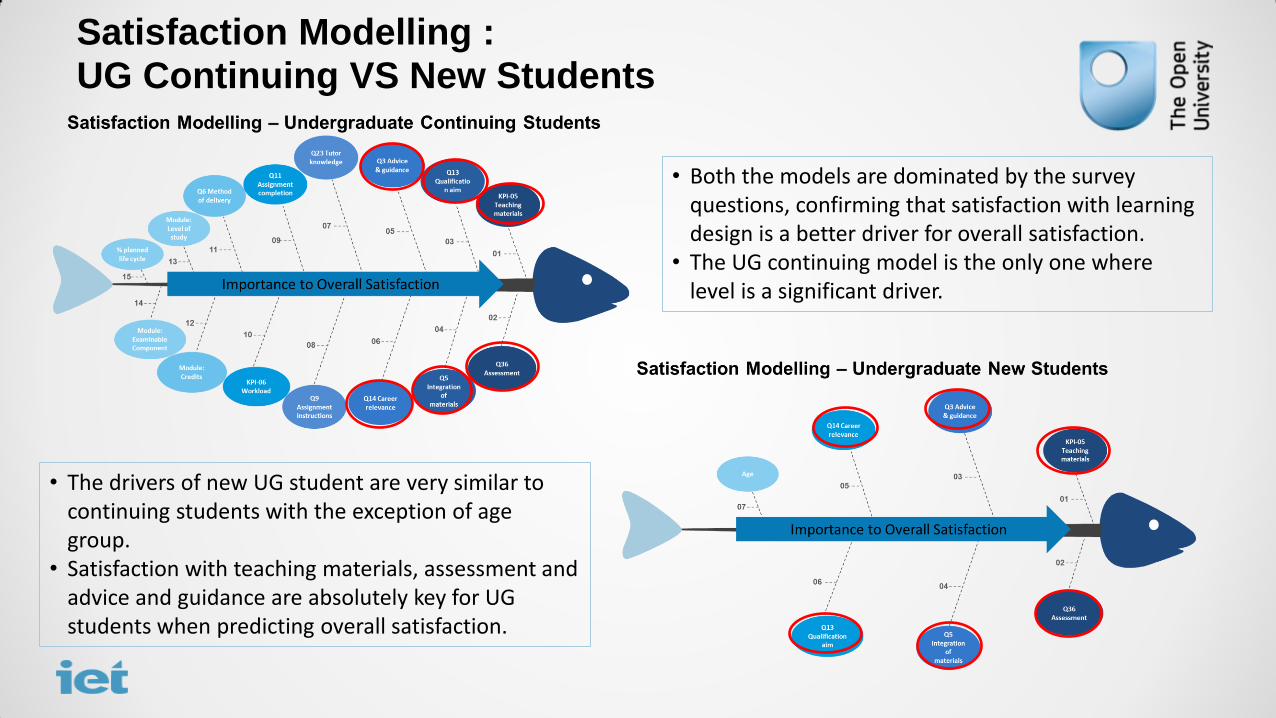
Satisfaction Modelling : UG Continuing VS New Students
• Both the models are dominated by the survey questions, confirming that satisfaction with learning design is a better driver for overall satisfaction.
• The UG continuing model is the only one where level is a significant driver.
• The drivers of new UG student are very similar to continuing students with the exception of age group.
• Satisfaction with teaching materials, assessment and advice and guidance are absolutely key for UG students when predicting overall satisfaction.
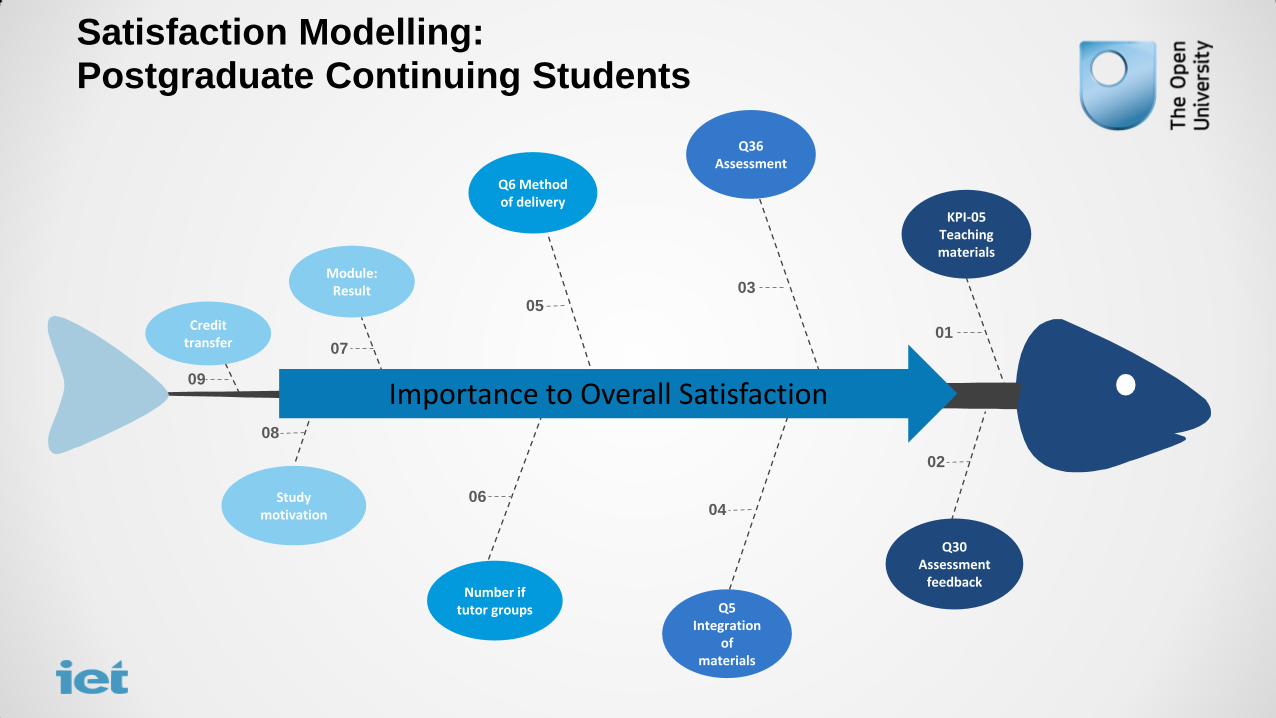
Satisfaction Modelling: Postgraduate Continuing Students
Credit transfer
09
Study motivation
08
Module: Result
07
Q6 Method of delivery
05
Q36 Assessment
03
KPI-05 Teaching materials
01
Number if tutor groups
06
Q5 Integration
of materials
04
Q30 Assessment
feedback
02
Importance to Overall Satisfaction
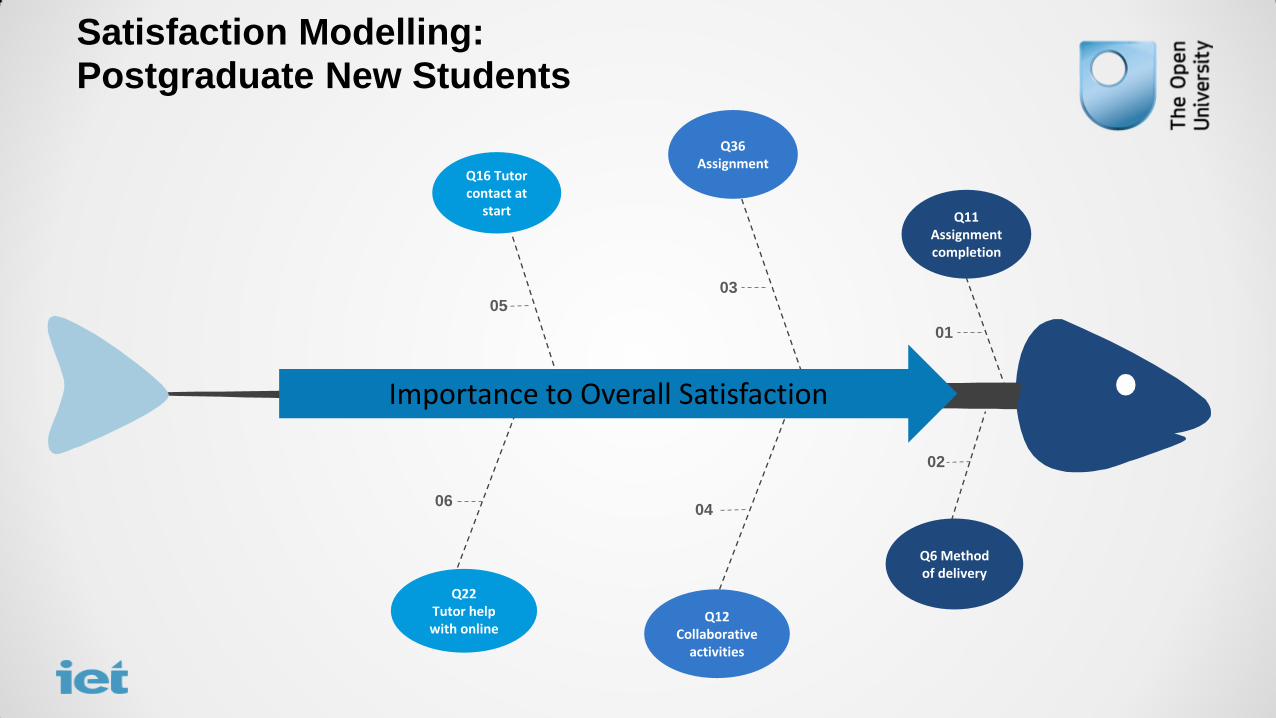
Satisfaction Modelling: Postgraduate New Students
Q16 Tutor contact at
start
05
Q36 Assignment
03
Q11 Assignment completion
01
Q22 Tutor help with online
06
Q12 Collaborative
activities
04
Q6 Method of delivery
02
Importance to Overall Satisfaction
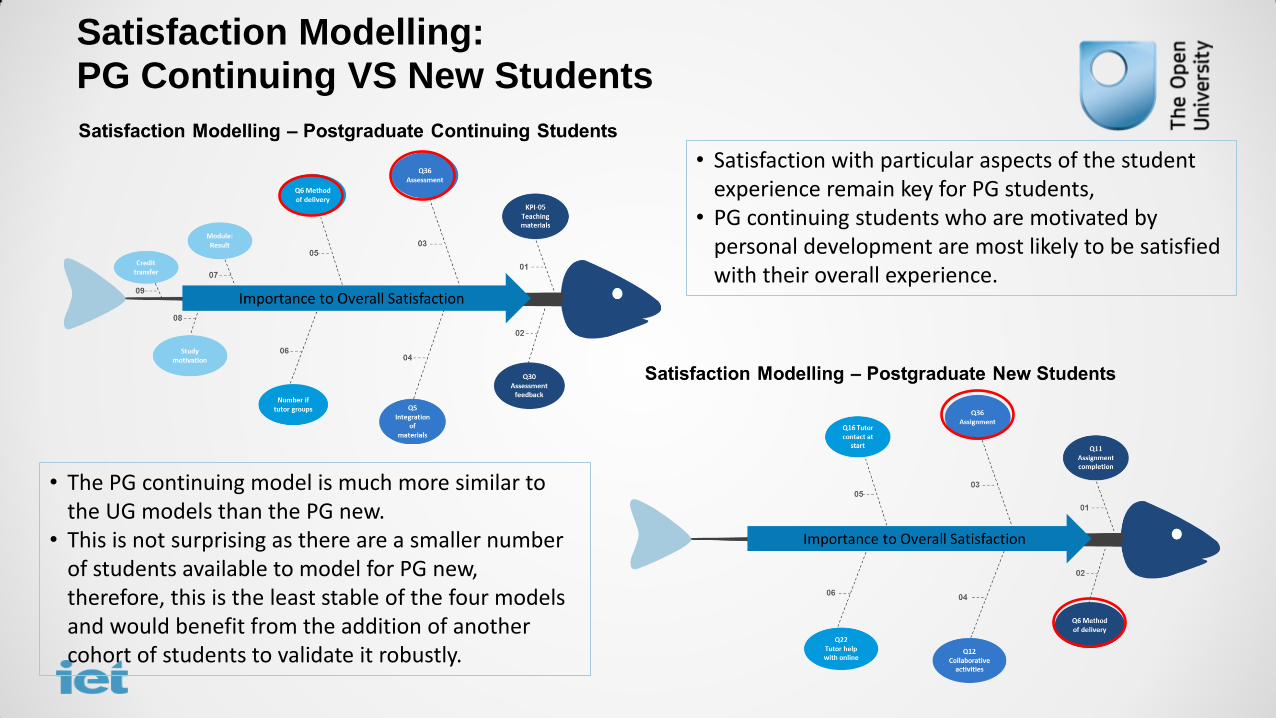
Satisfaction Modelling: PG Continuing VS New Students
• Satisfaction with particular aspects of the student experience remain key for PG students,
• PG continuing students who are motivated by personal development are most likely to be satisfied with their overall experience.
• The PG continuing model is much more similar to the UG models than the PG new.
• This is not surprising as there are a smaller number of students available to model for PG new, therefore, this is the least stable of the four models and would benefit from the addition of another cohort of students to validate it robustly.
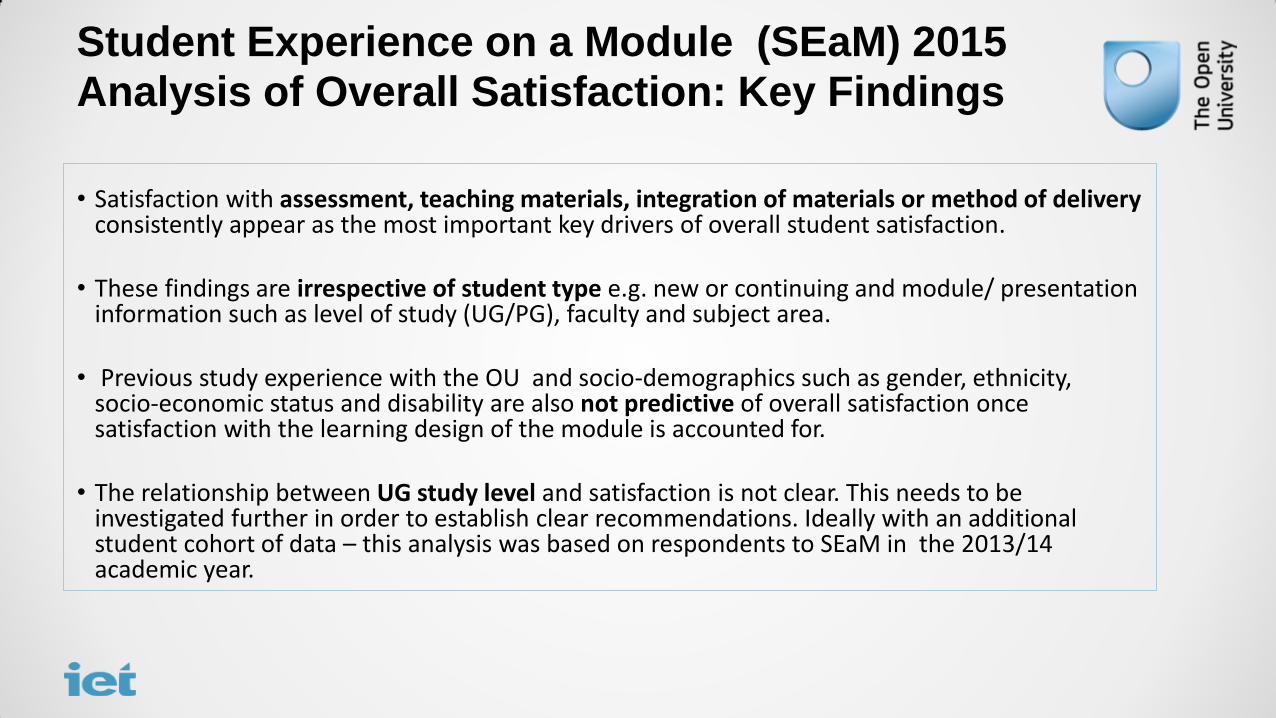
Student Experience on a Module (SEaM) 2015 Analysis of Overall Satisfaction: Key Findings
• Satisfaction with assessment, teaching materials, integration of materials or method of delivery consistently appear as the most important key drivers of overall student satisfaction.
• These findings are irrespective of student type e.g. new or continuing and module/ presentation
information such as level of study (UG/PG), faculty and subject area. • Previous study experience with the OU and socio-demographics such as gender, ethnicity,
socio-economic status and disability are also not predictive of overall satisfaction once satisfaction with the learning design of the module is accounted for.
• The relationship between UG study level and satisfaction is not clear. This needs to be
investigated further in order to establish clear recommendations. Ideally with an additional student cohort of data – this analysis was based on respondents to SEaM in the 2013/14 academic year.
Student Experience on a Module (SEaM) 2015
Analysis of Overall Satisfaction
• Add the SEaM survey questions to the pass rate model to verify the key drivers of pass compared to satisfaction.
• Further investigate the relationship between UG
level e.g. 1-3 and satisfaction. • Replicate the analysis for satisfaction, pass and
retention with the new cohort of SEaM data for 2014/15 in order to validate these findings.
• Disseminate the findings more widely.
Case study:
OU QA 3
Next steps 4
Overview the
Project 1
Research to
date 2