Embed Size (px)
Citation preview

NOTE TO USERS
This reproduction is the best copy available.

ANALYSIS OF CREATIVE AND EFFECTIVE TEACHING BEHAVIORS
OFUNIVERSITY INSTRUCTORS
_____________________________________________
A Dissertation
Presented to
The Faculty of the Graduate School
University of Missouri
_____________________________________________
In Partial Fulfillment
of the Requirements for the Degree
Doctor of Philosophy
_____________________________________________
by
Mollie S. Aschenbrener
Dr. Robert Terry, Jr., Dissertation Supervisor
MAY, 2008
UMI Number: 3371039
INFORMATION TO USERS
The quality of this reproduction is dependent upon the quality of the copy
submitted. Broken or indistinct print, colored or poor quality illustrations and
photographs, print bleed-through, substandard margins, and improper
alignment can adversely affect reproduction.
In the unlikely event that the author did not send a complete manuscript
and there are missing pages, these will be noted. Also, if unauthorized
copyright material had to be removed, a note will indicate the deletion.
______________________________________________________________
UMI Microform 3371039Copyright 2009 by ProQuest LLC
All rights reserved. This microform edition is protected against unauthorized copying under Title 17, United States Code.
_______________________________________________________________
ProQuest LLC 789 East Eisenhower Parkway
P.O. Box 1346 Ann Arbor, MI 48106-1346
The undersigned, appointed by the Dean of the Graduate School, have examined the
dissertation entitled:
ANALYSIS OF CREATIVE AND EFFECTIVE TEACHING BEHAVIORS OF
UNIVERSITY INSTRUCTORS
Presented by Mollie S. Aschenbrener
a candidate for the degree of Doctor of Philosophy
and hereby certify that in their opinion it is worthy of acceptance.
H. Robert Terry, Ph.D.
Robert M. Torres, Ph.D.
Bryan L. Garton, Ph.D.
Barbara K. Townsend, Ed. D.
DEDICATION
This work is dedicated to my family.
This sounds so easy, yet the past three years my family has made many, many
sacrifices to allow me to complete graduate school. Even on the worst days, I arrived
home to three sets of arms which never failed to remind me what is truly important in
life.
Ashton, Lauren and Gavynn Rose, thank you for all you have done to allow
mommy to become “Dr. Aschenbrener.” Moving two thousand miles away from friends
and family has not been easy, but we have found out our family is strong when we are
bonded by faith and love. While I have learned many things during the past three years,
nothing compares to what you teach me every day. Initials will fade and this dissertation
will become achieved, but my love for my children will live eternally. Thank you kids
for making life so much fun.
To my extended family, thank you for your prayers and support. Mike and
Ginger, thank you for understanding that God lead us here and thank you for supporting
us from so far away. To my sisters, thank you for everything! Much of what I learned
about children started with our “little girls” and I will always treasure those memories.
Robin, thanks for understanding and supporting my decision to attend school… again!
Anna, thanks for teaching me about patience and sacrifice as you take care of your little
ones. Polly, I simply cannot thank you enough for the countless phone calls and moral
support. I love you girls! Mom and dad, thanks for everything. Mom, your dedication
and work ethic are beyond reproach. Thanks for giving all you had to allow us
opportunities in life. Dad, thanks for giving me a love for the land and ties to an
amazingly large and strong family. And to my precious Meme, thanks for giving so

much of yourself to your family. Your love has supported me more than you will ever
know. I treasure our time together and know our hearts are bonded forever. I love you
all!
The real credit for this dissertation and completion of graduate school belongs to
my amazing husband. Sean, you have kept me grounded when I needed to be, yet
encouraged me every step along the way. You moved a business half way across the
country, raised the baby into a beautiful little girl and somehow managed to home school
Ashton and Lauren. I simply cannot tell you how gratefully I am, nor can I articulate
how much I appreciate your sacrifices. You are an amazing father and incredible
husband. After almost 12 years of marriage, I love you more today than the day I said “I
do.” Thank you for providing the spiritual foundation I needed at times during this
process and for reminding me that God always has a plan for us. Wherever we go next, I
want you to know, it’s your turn now coach!
ii
ACKNOWLEDGEMENTS
It is almost impossible to begin listing the tremendous number of individuals who
have contributed to the success of this project. I am extremely grateful for the support of
friends and neighbors, and of course, the tremendous efforts of the MU faculty.
Graduate school has created a unique environment for friendship. Somehow, it
seems like we, as graduate students are all on the same ship trying to learn to sail. This
relationship has created friendships I will cherish forever. David and Becki, I wish you
the very best next year as you begin the dissertation journey. David, I am amazed at your
accomplishments and willingness to serve others. Becki, I long to learn to flow like your
river! You are one of the most consistent individuals I have ever met and I truly value
the peace you seem to create for others. Misty and Ryan, I hope the final years of
graduate school continue to demonstrate your amazing potential. I look forward to seeing
what you offer the agricultural education community. Amy Jo Rae. Where do I begin?
This has been some ride! I am not sure what I would have done without you and your
sense of humor. The graduate school “hoop” will forever live in my mind! You are an
amazing talented researcher and devoted teacher. I have never met someone who is so
willing to say “yes” to any activity or special request. You have assisted more students
during your three years at MU than some individuals will serve in their lifetime. You
quickly showed how much you cared for my children and they will always remember you
and Clint. Words simply cannot express how much I appreciate your support during the
past three years!
To the faculty and staff in the Department of Agriculture Education, I wish to
thank each and every one of you. Miss Sandy and Miss Carol, you two have added so
much to my graduate school experience. Your consistent help, friendly smiles and kind
iii
encouragement made an indelible mark on the past three years. Thank you, thank you,
thank you for all you have done to help me. Dr. Norm, thank you for the encouragement
you provided during this experience. You define character and integrity. I am so
fortunate to know you and I am thankful for your wisdom. I simply cannot express how
much I respect you, Dr. Norm! Dr. Ulmer, my personal technology assistant, thank you
for the many random moments and the hours of help! I know you will do amazing things
at Texas Tech! Dr. Garton, I truly value the attributes you portray. Although we love to
tease you, your commitment to organization allows the department to function efficiently.
I have watched you demonstrate effective teaching characteristics in the classroom and in
the hallway. However, I am most awed by your genuine caring and concern for students.
You have an amazing ability to seek harmony and administer fairly and equitably. From
the classroom to the Upward basketball court, you practice what you preach! Dr. Torres,
I thought I knew what a great instructor you were before this year began. The
dissertation process has proven that you are a phenomenal teacher! I appreciate your
open door policy, but I will never forget the lessons you taught around the little table in
your office. You teach every moment of every day. I am awed by your ability to turn
complex research discourse into simple knowledge. You make people better just by
raising their own expectations and understanding of learning. Thank you for forcing me
to apply research beyond the classroom and challenging my knowledge more than any
former instructor. And finally, I owe so much of this project to you, Dr. Terry. There
have been many times I have wondered why I left a high school classroom that I loved.
And somehow, you always managed to point me in the right direction and allow me to
trust in what is yet to come. Watching you teach the past three years has been nothing
iv
short of inspirational. Your devotion to teaching and changing the lives of your students
is simply amazing. Your Kemp Teaching Award simply validates what so many of us
already knew; you are an outstanding instructor! However, it is the impact you have
made beyond the classroom that I will treasure the most. After studying creativity
intently for the past year, I can honestly say you are one of the most creative individuals I
have ever met! Watching you develop an idea or implement a teaching method has been
a tremendously positive experience for me. I remember hearing “Rob’s an idea guy.”
Your ideas are amazing. Thanks for sharing your ideas for this dissertation and being
willing to travel a difficult and tenuous path. Although the way, you have demonstrated
your faith, helped me when mine has been tested, and somehow managed to serve as an
example to many. Your physical stature pales only to the height of your Godly character.
I am so grateful for the opportunity to work with you!
v
TABLE OF CONTENTS
Dedication .......................................................................................................................... iii
Acknowledgments.............................................................................................................. iv
List of Tables ................................................................................................................... xiii
List of Figures ....................................................................................................................xv
Abstract ............................................................................................................................ xvi
Chapter
I. Introduction............................................................................................................. 1
Assessments of Creativity................................................................................. 2
Attributes of Creativity ..................................................................................... 4
Creativity in Education ..................................................................................... 6
Theoretical Framework..................................................................................... 6
Need for the Study ............................................................................................ 8
Statement of the Problem.................................................................................. 9
Purpose of the Study ....................................................................................... 10
Research Questions and Hypotheses ........................................................ 10
Definitions....................................................................................................... 13
Assumptions.................................................................................................... 15
Limitations ...................................................................................................... 15
II. Review of Literature ............................................................................................. 16
Definitions of Creativity ................................................................................. 16
Convergent Versus Divergent Thinking ......................................................... 17
Theories about Creativity................................................................................ 18
Behaviorist Theories ................................................................................. 19
Humanist and Developmental Theories.................................................... 19
Systems Theories ...................................................................................... 21
Relationship Between Creativity and Intelligence.................................... 24
Motivation................................................................................................. 25
vi
Teacher Role ............................................................................................. 26
Creative Outcomes.................................................................................... 27
Process and Problem Solving.................................................................... 28
Assessments of Creativity............................................................................... 30
Personality Oriented Assessment.............................................................. 31
Biographical Assessments ........................................................................ 32
Behavioral Assessments............................................................................ 32
Product Oriented Assessment ................................................................... 33
Self-reported Assessments ........................................................................ 34
Challenges for Assessing Creativity ............................................................... 35
Ways to Enhance Creativity............................................................................ 37
Barriers to Creativity....................................................................................... 39
Future Creativity Research ............................................................................. 40
Effective Teaching .......................................................................................... 41
Student Evaluation of Effective Instructors.............................................. 47
Creative teaching ...................................................................................... 48
Summary ......................................................................................................... 52
III. Methodology......................................................................................................... 54
Purpose of the Study ....................................................................................... 54
Research Questions and Hypotheses ........................................................ 54
Research Design.............................................................................................. 57
Population and Sampling ................................................................................ 58
Population ................................................................................................. 58
External validity........................................................................................ 59
Sampling ................................................................................................... 60
Instrumentation ............................................................................................... 61
Abbreviated Torrance Test for Adults (ATTA)........................................ 62
Creative and Effective Teaching Assessment........................................... 64
Demographic Data .................................................................................... 66
Validity and Reliability................................................................................... 66
vii
Validity ..................................................................................................... 66
Reliability........................................................................................................ 68
Abbreviated Torrance Test for Adults (ATTA)........................................ 68
Creative and effective teaching assessment.............................................. 69
Data Collection ............................................................................................... 71
Population of Instructors........................................................................... 72
Population of Students .............................................................................. 72
Data Analysis .................................................................................................. 74
Abbreviated Torrance Test for Adults (ATTA)........................................ 75
CETA ........................................................................................................ 75
IV. Findings ................................................................................................................ 80
Research Questions and Hypotheses ........................................................ 80
Findings Related to Research Question One .................................................. 83
Findings Related to Research QuestionTwo................................................... 84
Findings Related to Research QuestionThree................................................. 86
Findings Related to Research QuestionFour................................................... 88
Findings Related to Research QuestionFive ................................................... 90
Findings Related to Research QuestionSix..................................................... 91
Findings Related to Research QuestionSeven ................................................ 92
Findings Related to Research QuestionEight ................................................. 93
Findings Related to Research QuestionNine .................................................. 95
Findings Related to Hypothesis One............................................................... 97
Findings Related to Hypothesis Two.............................................................. 99
Findings Related to Hypothesis Three.......................................................... 101
Findings Related to Hypothesis Four............................................................ 102
V. Summary, Conclusions and Recommendations.................................................. 106
Summary ....................................................................................................... 106
Purpose of the Study ............................................................................... 106
Research Questions and Hypotheses ...................................................... 106
Limitations .............................................................................................. 109
viii
Research Design...................................................................................... 109
Population and Sampling ........................................................................ 110
Instrumentation ....................................................................................... 111
Validity and Reliability........................................................................... 113
Data Collection ....................................................................................... 114
Data Analysis .......................................................................................... 116
Findings ........................................................................................................ 118
Research QuestionOne............................................................................ 118
Research Question Two .......................................................................... 119
Research Question Three ........................................................................ 119
Research Question Four.......................................................................... 119
Research Question Five .......................................................................... 120
Research Question Six ............................................................................ 120
Research Question Seven........................................................................ 120
Research Question Eight......................................................................... 121
Research Question Nine.......................................................................... 121
Hypothesis One....................................................................................... 121
Hypothesis Two ...................................................................................... 122
Hypothesis Three .................................................................................... 122
Hypothesis Four ...................................................................................... 122
Conclusions, Recommendations and Implications ....................................... 123
Research Question One........................................................................... 123
Research Question Two .......................................................................... 123
Research Question Three ........................................................................ 123
Research Question Four.......................................................................... 124
Research Question Five .......................................................................... 125
Research Question Six ............................................................................ 126
Research Question Seven........................................................................ 127
Research Question Eight......................................................................... 128
Research Question Nine.......................................................................... 128
Hypothesis One....................................................................................... 129
ix
Hypothesis Two ...................................................................................... 129
Hypothesis Three .................................................................................... 130
Hypothesis Four ...................................................................................... 131
VI. References........................................................................................................... 132
VII. APPENDICES .................................................................................................... 138
APPENDIX A Creative and Effective Teaching Assessment Student
Instrument ............................................................................................... 138
APPENDIX B Creative and Effective Teaching Assessment Instructor
Instrument ............................................................................................... 145
APPENDIX C Panel of Experts ................................................................... 149
APPENDIX D First Student Electronic Mail Contact.................................. 151
APPENDIX E Second Student Electronic Mail Contact .............................. 154
APPENDIX F Third Student Electronic Mail Contact................................. 156
APPENDIX G Final Student Electronic Mail Contact ................................ 158
APPENDIX H First Instructor Electronic Mail Contact ............................. 160
APPENDIX I Second Instructor Electronic Mail Contact ........................... 162
APPENDIX J Final Instructor Electronic Mail Contact.............................. 165
VIII. VITA................................................................................................................... 167
x
LIST OF TABLES
Table Page
1 Normative Data for the Abbreviated Torrance Test (ATTA) ....................................... 63
2 Abbreviated Torrance Test for Adults Scoring ............................................................ 64
3 Cronbach’s Alpha Reliability Coefficients for CETA Pilot Test ................................ 71
4 Demographic Characteristics of Instructors (n = 40) ................................................. 84
5 Summated Scores for Instructors’ Self-Perceived Level of
Creative Teaching Behaviors (n = 40) ....................................................................... 85
6 Summated Norm Referenced Creativity (n = 40) ........................................................ 87
7 Summated Scores for Students Perceived Creative Teaching
Behaviors of Instructors (n = 40) .............................................................................. 89
8 Summated Scores for Students’ Perceived Effective Teaching (n = 40) ..................... 91
9 Pearson Product Moment Correlations for Students’ Perceived
Creative Teaching Behaviors (n = 40)......................................................................... 92
10 Pearson Product Moment Correlations for Students’ Perceived
Effective Teaching (n = 40) ....................................................................................... 93
11 Intercorrelational Matrix for Norm-Referenced Creativity (n = 40) ......................... 94
12 Simple Linear Regression of Norm Referenced Creativity (n = 40)........................... 95
13 Intercorrelational Matrix for Instructors’ Self-Perceived
Creativity (n = 40) ...................................................................................................... 96
14 Simple Linear Regression of Self-Perceived Creative Teaching
Behaviors (n = 40) ...................................................................................................... 97
15 Independent Samples t Test of Differences Between Disciplines
and Instructors’ Perceived Creative Teaching Behaviors.......................................... 98
16 Independent Samples t Test of Differences Between Disciplines
and Instructors’ Norm Referenced Creativity ........................................................... 98
17 Independent Samples t Test of Differences Between Disciplines
and Students’ Perceived Creative Teaching Behaviors of Instructors...................... 98
18 Independent Samples t Test of Differences Between Teaching
Experience and Instructors’ Perceived Creative Teaching Behaviors ..................... 99
xi
19 Independent Samples t Test of Differences Between Teaching
Experience and Instructors’ Norm-Referenced Creativity...................................... 100
20 Independent Samples t Test of Differences Between Teaching
Experience and Students’ Perceived Creative Teaching Behaviors
of Instructors ........................................................................................................... 100
21 Independent Samples t Test of Differences Between Sex and
Instructors’ Perceived Creative Teaching Behaviors ............................................. 101
22 Independent Samples t Test of Differences Between Sex and
Instructors’ Norm-Referenced Creativity................................................................ 102
23 Independent Samples t Test of Differences Between Sex and
Students’ Perceived Creative Teaching Behaviors of Instructors........................... 102
24 Independent Samples t Test of Differences Between Effective
Teaching and Instructors’ Perceived Creative Teaching Behaviors ...................... 103
25 Independent Samples t Test of Differences Between Effective
Teaching and Instructors’ Norm-Referenced Creativity......................................... 104
26 Independent Samples t Test of Differences Between Effective
Teaching and Students’ Perceived Creative Teaching Behaviors
of Instructors .......................................................................................................... 104
xii
LIST OF FIGURES
Figure Page
1 Measures of instructor creativity. ................................................................................. 9
2 Self-perceived creative teaching behaviors of CAFNR instructors. ........................... 86
3 Comparison of standardized, norm-referenced scores of the ATTA to CAFNR instructors’ ATTA scores ......................................................................... 88
4 Students Perceived Creative Teaching Behaviors of CAFNR Instructors.................. 90
xiii
ANALYSIS OF CREATIVE AND EFFECTIVE TEACHING BEHAVIORS OF
UNIVERSITY INSTRUCTORS
Mollie S. Aschenbrener
Robert Terry, Jr., Dissertation Supervisor
ACADEMIC ABSTRACT
The purpose of this study is to explain and predict creative and effective teaching
of university instructors. Specifically, the use of student evaluations, self-reported
teaching evaluations, and standardized creativity instruments were used to assess
instructor creativity. In addition, students’ perceptions of their instructor’s creativity in
teaching were compared with instructor’s self-reported creativity in teaching. The
creativity of instructors, as assessed by a standardized creativity instrument, was also
compared to the perceptions of effective teaching held by their students and the self-
reported instructor evaluations.
There were two populations identified for this study. The specific criteria for the
first population included instructors teaching all sections of undergraduate courses in the
College of Agriculture, Food and Natural Resources (CAFNR) at the University of
Missouri (MU), excluding seminar, research and special problems courses, in the 2007
fall semester (N= 44). The list of CAFNR instructors generated by the researcher through
the student course selection (myZou) was cross-referenced with the list generated by
CAFNR administration. The instructors who were identified as the subjects for the initial
segment of the study were also used to establish the frame for the student population.
The population for the student component of the study included all students
enrolled in College of Agriculture, Food and Natural Resources (CAFNR) courses being
taught by CAFNR instructors who had previously been identified as the population for
xiv
the instructor component of this study. Probabilistic sampling was used for the student
population. A response rate of fifty percent or a minimum number of 30 was required for
each cluster to be included in the population.
This study was descriptive correlational in nature. The use of a time and place
sample, as suggested by Oliver and Hinkle (1982), was justified because the instructor
population could be considered representative of future populations in CAFNR at MU.
Little relationship was found between instructors’ perceived creativity, norm-
referenced creativity, and students’ perceived creativity; however, both instructors and
students agreed that creative teaching behaviors occur in CAFNR courses. Further,
students suggested CAFNR instructors are effective teachers. A very high correlation was
found between students’ perceptions of creative teaching behaviors of instructors and
students’ perceptions of effective teaching. Creativity, as measured by the (Abbreviated
Torrance Test for Adults) ATTA, was substantially higher for participants than for norm-
referenced populations.
In addition, little differences were found between disciplines, sex, and teaching
experience and the three measures of creativity. Students’ perceptions of instructors’
creative teaching behaviors, however, were significantly different when compared to
students’ perceptions of effective and in-effective teachers.
Finally, only 1.9% of the variance in norm-referenced creativity was found to be
predicted by the linear combination of age, sex, and teaching discipline. Approximately
12% of the variance in self-perceived creativity could be accounted for by the linear
combination of age, sex, and teaching discipline.

xv
These findings suggest much of the variance in creativity is yet to be explained. In
addition, the construct of creativity and its relationship to teaching is multifaceted and
challenging to measure. Future research efforts may focus on the specific role(s)
creativity plays in effective teaching.
1
CHAPTER ONE
INTRODUCTION
Creativity has been described by such early philosophers as Plato and Aristotle
and championed as an important concept of study since John Dewey (Starko, 2005). Plato
suggested creativity relied on an external source and involved a mystic quality. However,
“Aristotle argued that creative processes must obey understandable natural laws” (Starko,
p. 47). John Dewey offered one of “the earliest contemporary models of creativity” (p.
40) through the problem solving model he developed in 1920 (Starko). More recently,
Guilford’s 1950 presidential address to the American Psychological Association APA)
resulted in creativity becoming the focus of considerable psychological research
(Bleedorn, 2003, 2005; Cropley, 2001; Fasko, 2000-2001; Mumford, 2003; Runco, 2000-
2001).
Despite historic references, defining creativity has been a difficult task (Baker et
al., 2001; Friedel& Rudd, 2005; Hocevar, 1981; Marksberry, 1963; Sternberg, 1999;
Starko, 2005). In fact, apparent ambiguous definitions of creativity have some researchers
concerned (Cropley, 2001; Plucker, Geghetto& Dow, 2004). “The lack of a common
definition is a major, debilitating weakness” (Plucker et al., p. 93). Plunker et al.
investigated over 90 articles from 2 leading creativity journals and found only 34 (38%)
that explicitly defined the term creativity. Thirty-seven (41%) offered an implied
definition, while 19 (21%) failed to offer any definition. They stated, “unless the
definitional problem is addressed, creativity research will continue to be impeded by lack
of direction, damaging mythologies and general misunderstanding” (Plunker et al., p. 92).
2
Torrance (1995), known as a leader in creative research, defined creativity as “the
process of forming ideas or hypotheses, testing hypotheses, and communicating the
results” (p. 23). Perkins (1988) defined creativity in terms of creative results, which are
both original and appropriate. “A creative person – a person with creativity- is a person
who fairly routinely produces creative results” (p.13). Maslow (1968) described creativity
as “a fundamental characteristic, inherent in human nature, a potentiality give to all or
most human beings at birth, which most often is lost or buried or inhibited as the person
gets enculturated” (p. 143). Starko (2005) defined creativity as a product or idea that is
original or novel to the individual creator. Appropriateness of creativity must take into
account the cultural context in which it is displayed (Starko). This is important given the
difference of creative expression between cultures, especially between Western and
Eastern interpretations (Starko).
Assessments of Creativity
If defining creativity is complex, assessing creativity may be an even greater
challenge. In fact, Hocevar (1981) stated, “perhaps no psychological concept has proven
to be as difficult to measure as creativity” (p. 450). As a result of numerous complex
creativity models, many types of creativity assessments have been developed (Feldhusen
& Eng Goh, 1995). Treffingler (1987) suggested creativity assessment is particularly
difficult, given test developers lack a single, unifying theory of creativity from which to
formulate assessments. Feldhusen and Eng Goh concluded, “most efforts to assess
creativity have focused on persons and their cognitive abilities, personality
characteristics, motivations or background experiences” (p. 235).
3
Torrance (1995) suggested creativity is “a process of becoming sensitive to
problems, deficiencies, gaps in knowledge, missing knowledge, missing elements,
disharmonies, and so on” (p. 6). The Torrance Tests of Creative Thinking (TTCT) was
created within an educational context (Anastasi, 1976). The TTCT contains 12 tests that
are grouped into three specific batteries. The batteries include: Thinking Creatively with
Words; Thinking Creatively with Pictures; and Thinking Creatively with Sounds and
Words (Anastasi, 1976). Each activity measures components of creativity. For example,
Thinking Creatively with Pictures uses drawings to assess fluency, originality,
elaboration, abstractness of titles, and resistance to closure.
Researchers have also examined self-reported measures of creativity (Ruscio,
Whitney & Amabile, 1998). In fact, Hocevar (1981) suggested, “perhaps the most easily
defensible way of identifying creative talent is in term of self-reported creative activities
and achievements” (p. 455). Hocevar acknowledged creativity can be valued by society
as important in a number of different fields. Self-reported measures may have an
additional advantage. The individual can provide the most information about creativity
because he or she knows themselves better than teachers, supervisors or peers (Hocevar).
“A useful way to measure creativity is to simply ask the subject. This is not a profound
position, but yet the procedure is rarely used” (Hocevar, p. 459). In addition, past
behavior is considered by some to be the best indicator of future creativity behavior
(Hocevar). Barron and Harrington (1981) explored more than 70 studies, finding
creativity tests often produced significant correlations with real life creative
performances.
4
As a result, some researchers have suggested multiple methods to assess the
creativity construct. “The most condemning problem associated with the measurement of
creativity is the lack of convergent validity among different methods. Since each method
is purported to be measuring creativity, it is reasonable to predict that they be correlated,
thus satisfying a minimum condition of convergent validity” (Hocevar, 1981, p. 457).
According to Hocevar, multiple methods of assessing creativity have had mixed results,
however, few studies have shown a correlation higher than .30. Therefore, a variety of
methods should be used to assess creativity.
Feldhusen and Goh (1995) stated: “Assessment of such a multidimensional
construct as creativity requires multiple channels of measurement such as tests and
inventories” (p. 240). Feldhusen and Goh also suggested that the three most effective
measures of creativity include “measures of ideational fluency, a person’s past creativity
achievements and activities, and an evaluation of current products” (p. 240).
Attributes of Creativity
Once thought of as only an artistic quality, creativity is sought after by engineers,
executives, and researchers (Anastasi, 1976). The call to investigate creativity was issued
through Guilford’s 1950 presidential address to the American Psychological Association
(Ai-Girl & Lai-Chong, 2004; Bleedorn, 2003, 2005; Cropley, 2001; Fasko, 2000-2001;
Mumford, 2003; Runco, 2000-2001; Sternberg, 2006). According to Marksberry (1963),
three basic premises outline conclusions of creativity research. First, there appears to be a
positive correlation between creativity and intelligence, although not by those of highest
intelligence. Second, there are levels or grades of creativity. Thus, there are some people
who are more creative than others, illustrating that creativity lies on a continuum. Third,
5
creativity is “a constellation of primary attitudes, psychomotor skills, and knowledges
which can vary with the different spheres of activity” (Marksberry, p. 7). Attitudes that
describe creativity include:
Curiosity about the environment, open-mindedness, wondering or inquiring about
things, objectivity, flexibility, intellectual playfulness and humor, indifference
toward conformity to many cultural stereotypes, willingness and eagerness to try
new ideas, willingness to work long hours over long periods of time, willingness
to be alone physically and figuratively, confidence in one’s own ability,
sensitivity to various sensory stimuli in the environment, and strong interests
(Marksberry, 1963, p. 7).
Cropley (2001) also suggested that creativity is a characteristic of all people, although to
differing degrees.
Some researchers suggest creativity lies on a continuum (Amabile, 1996;Cropley,
2001; Marksberry, 1963) ranging from sublime to everyday creativity (Cropley).
Cropleydescribed sublime creativity as those creative products that have been validated
and recognized in the world arena. For example, sublime creativity would define those
who have won a Nobel Prize, Pulitzer Prize or other such outstanding accomplishment
(Cropley). Some researchers believe there is an inclination to investigate these prominent
individuals to help explain the creative process (Feldhusen& Eng Goh, 1995). Everyday
creativity is a personal characteristic, regardless of creative product outcomes (Cropley).
It appears that sublime or everyday creativity can be enhanced and developed with
practice and encouragement (Cropley). If creativity can be taught, the need for an
educational perspective on creativity becomes apparent.
6
Creativity in Education
Since the late 1990s, creativity in education has been viewed as globally relevant
in ways never seen before (Craft, 2005). Torrance (1995) noted the changes in creativity
research and called it “A Quiet Revolution” (p. 3).The revolution has created challenges
and caused change, including a greater emphasis on promoting creativity of students and
rewarding the creativity of teachers (Craft). Focusing on teachers, Torrance called
creative teachers great teachers who are “involved in discovery, pushing the limits, taking
a step into the unknown” (p. 107), and engaging students in the process. This increased
emphasis on creativity, especially in education, can be linked to “Sputnikshock,” a time
after the Russian Sputnik spacecraft was launched. Educators in the United States
suddenly realized American students were falling behind (Torrance). More specifically,
students were being taught to apply only what they had already learned (Cropley 2001;
Torrance). As a result of the launching of Sputnik, the educational application of
creativity and creativity testing exploded onto the research horizon (Craft; Cropley;
Gowan, Khatena, & Torrance, 1981; Hocevar, 1981; Torrance).
Theoretical Framework
It is not surprising that creativity has been viewed through differing theoretical
lenses, given the complexity of defining creativity. For example, Starko (2005) identified
several theoretical frameworks for creativity, including psychoanalytical theories,
humanist and developmental theories, behaviorist or associationist theories, cognitive
theories and systems theories. Theorists ranging from Freud and Maslow to Guilford and
Gardner have developed creativity theories (Starko). Recently, the complexity of
7
measuring creativity has led some researchers to suggest multiple methods to assess the
creativity construct (Feldhusen&Goh, 1995).
Historically, Guilford’s (1956) intellect model became a foundation for labeling
components of divergent thinking as a means to assess creativity. In turn, divergent
thinking has become a major component of many assessments (Guildord; Hocevar, 1981;
Torrance, 1995). Three measurements of creativity, using divergent thinking, have been
identified as fluency, flexibility, originality, and elaboration (Guilford; Massialas&Zevin,
1967; Plunker et al., 2004; Starko, 2005; Torrance).
The measurement of creativity as a portion of divergent thinking resulted from
Guilford’s Structure of the Intellect (SOI) model (Starko, 2005). Guilford clearly saw
creativity as an intellectual function (Starko). Some researchers have suggested a creative
individual should demonstrate attributes of divergent thinking. Therefore, tests for
divergent thinking measure creativity (Guildord, 1956; Hocevar, 1981; Torrance, 1995).
Basic components to evaluate creativity include novelty and appropriateness (Starko,
2005). Many researchers suggest creativity is comprised of three factors, including:
novel, effective for others, and ethical or of some good for society (Cropley, 2001; Fox,
J., & Fox, R., 2000; MacKinnon, 1962; Torrance).
The educational impact of creativity has been championed by many researchers
(Anderson, 2002; Bleedron, 2003, 2005; Chambers, 1973; Crockenberg, 1972; Cropley,
1967, 2001; Esquivel, 1995; Fasko, 2000-01; Fox, J., & Fox, R., 2000; Gowan et al.,
1967; Hocevar, 1981; MacKinnon, 1962; Massialas&Zevin, 1967; Plunker et al.,
2004;Renzulli, 1992; Ruscio et al., 1998;Starko, 2005; Sternberg, 2006; Tan & Law,
2004;Torrance, 1995). More specifically, the connection between creativity and effective
8
teaching has been suggested by many researchers (Anderson, 2002; Bain,2004; Bleedron,
2003, 2005; Chambers, 1973; Croply, 1967, 2001; Davidovitch&Milgram, 2006;
Esquivel, 1995; Fasko, 2000-01; Milgram, 1979; Newcomb, McKracken and Warmbrod,
1993; Renzulli, 1992; Torrance, 1981, 1995).
Need for the Study
Renzulli (1992) postulated a developmental theory suggesting teachers are a key
component of developing creativity, both as mentors and role models. Fasko (2001)
summarized Renzulli’s cautions by suggesting, “Renzulli’s major concern was in how
educators can promote a disposition for creative production” (p. 322). Chambers (1973)
found college teachers could encourage creativity in students and that “students viewed
these teachers as being more accessible to them, committed to their field, enthusiastic,
and intellectually challenging” (Fasko, p. 322). However, can we identify these teachers
as creative teachers? If creative teaching is linked to effective teaching, can identifying
creative teachers identify effective teaching? And, if students identify creative teachers
as effective teachers, do instructors believe they are creative teachers?
Future creativity research in education has many possibilities. Sternberg (2006)
recently suggested, “… to the extend that creativity is in the interaction of person with
context, we need to concentrate as well on the attributes of the individual and the
individuals’ work relative to the environmental context” (p. 95). In addition, Mumford
(2003) posed this question: “Exactly what are the effects of creativity on the individual,
the people around him or her and the broader social system” (p. 117)? Esquivel (1995),
exploring the context of creativity and teaching, posed the question, “Do teachers need to
be creative themselves in order to be creative teachers” (p. 190)?
9
Research addressing these types of creativity questions appears to be lacking in
educational research, particularly in subject specific areas such as agricultural education.
Although a few preliminary creativity studies have been conducted in agricultural
education, (Aschenbrener et al., 2007; Baker et al., 2001; Friedel& Rudd, 2005), a
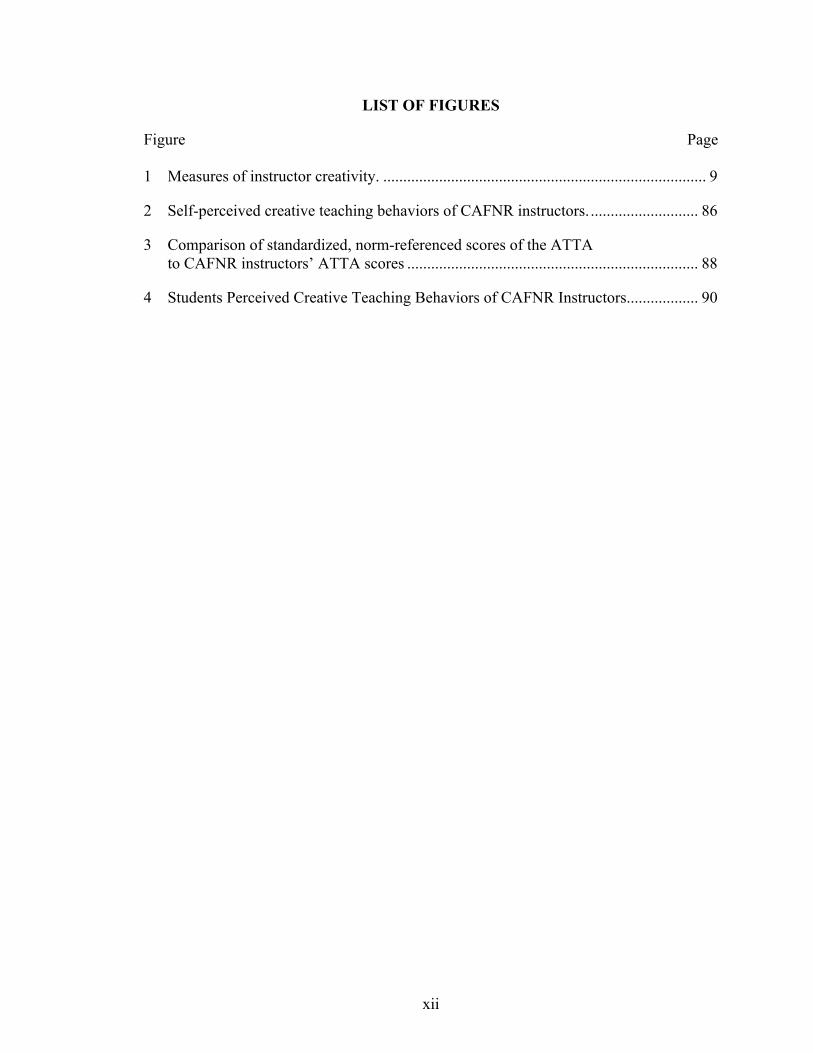
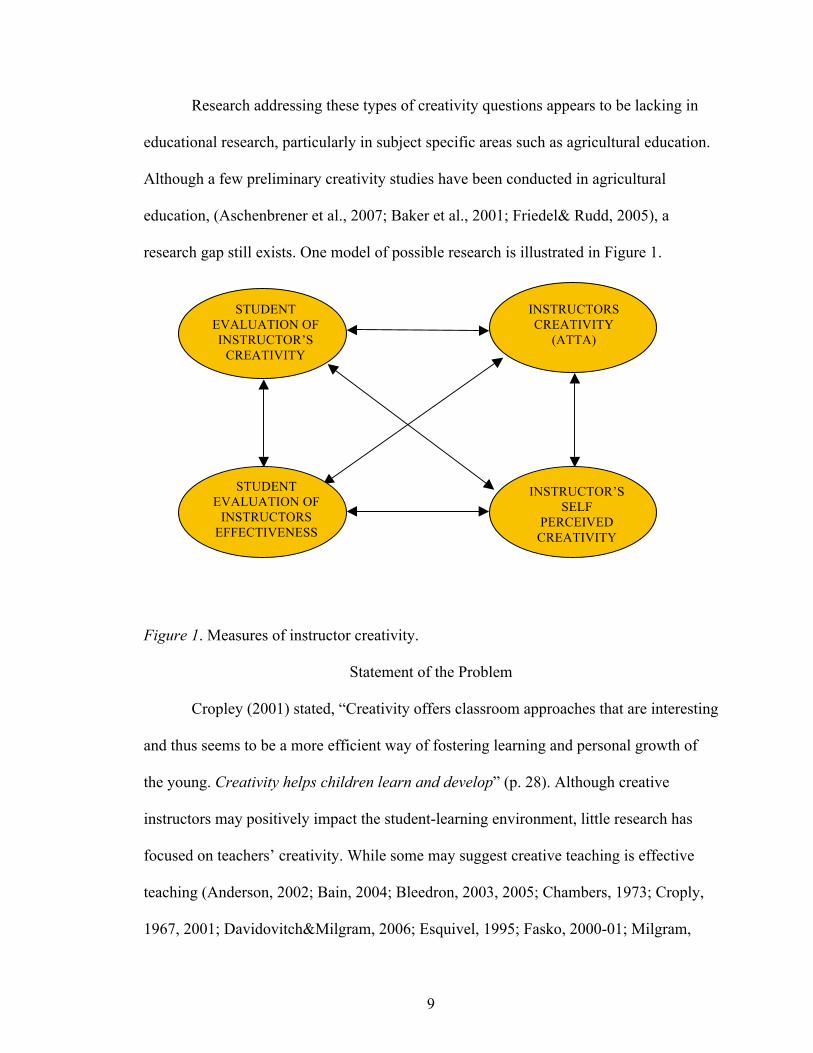
research gap still exists. One model of possible research is illustrated in Figure 1.
Figure 1. Measures of instructor creativity.
Statement of the Problem
Cropley (2001) stated, “Creativity offers classroom approaches that are interesting
and thus seems to be a more efficient way of fostering learning and personal growth of
the young. Creativity helps children learn and develop” (p. 28). Although creative
instructors may positively impact the student-learning environment, little research has
focused on teachers’ creativity. While some may suggest creative teaching is effective
teaching (Anderson, 2002; Bain, 2004; Bleedron, 2003, 2005; Chambers, 1973; Croply,
1967, 2001; Davidovitch&Milgram, 2006; Esquivel, 1995; Fasko, 2000-01; Milgram,
STUDENT
EVALUATION OF
INSTRUCTOR’S
CREATIVITY
INSTRUCTORS
CREATIVITY
(ATTA)
STUDENT
EVALUATION OF
INSTRUCTORS
EFFECTIVENESS
INSTRUCTOR’S
SELF
PERCEIVED
CREATIVITY
10
1979; Newcomb et al., 1993; Renzulli, 1992; Torrance, 1981, 1995), concrete measures
that define creative teachers appear to be lacking. Finally, research about creativity in
subject-specific areas such as agricultural education is also lacking.
Purpose of the Study
The purpose of this study was to explain and predict creative and effective
teaching of university instructors. Specifically, student evaluations, self-reported teaching
evaluations, and standardized creativity instruments were used to assess instructor
creativity. In addition, the students’ perceptions of their instructor’s creativity in teaching
were compared with instructor’s self-reported creativity in teaching. The creativity of
instructors, as assessed by a standardized creativity instrument, was also compared to the
perceptions of effective teaching held by their students and the self-reported instructor
evaluations.
Research Questions and Hypotheses
The following research questions and hypotheses guide this study and identify creativity
specifically in the context of instruction and teaching:
1. What are the demographic characteristics of College of Agriculture, Food and
Natural Resources (CAFNR) undergraduate instructors, including sex, years
of teaching experience, age, and teaching discipline?
2. What is the self-perceived level of creative teaching effectiveness of CAFNR
instructors?
3. What is the level of creativity (fluency, originality, elaboration and flexibility)
as measured by the ATTA, of CAFNR instructors?
11
4. What is the level of creative behaviors exhibited by CAFNR instructors, as
perceived by their students?
5. What is the level of teaching effectiveness of CAFNR instructors, as
perceived by their students?
6. What is the relationship between creative behaviors of CAFNR instructors, as
perceived by students, and effective teaching behaviors, as perceived by
students, instructors’ perceived creativity, and instructors’ norm-referenced
creativity?
7. What is the relationship between CAFNR instructors teaching effectiveness,
as perceived by students, and instructors’ perceived creativity, and instructors’
norm-referenced creativity?
8. What is the amount of variance in instructors’ creativity, as measured by the
ATTA, that is accounted for by their age, sex, teaching experience, and
discipline?
9. What is the amount of variance in instructors’ self-perceived creativity
teaching behaviors that is accounted for by their age, sex, teaching experience,
and discipline?
Hypotheses
1. Ho: There is no difference between instructors’ discipline (natural/physical
science or social science) and their level of creativity (student perception [y1],
instructors’ perceived [y2], and norm referenced [y3]).
H0·1.2.3: xy1.2.3 = 0
12
H1: Differences exist between discipline (natural/physical or social science) and
their level of creativity (student perception [y1], instructors’ perceived [y2], and
norm referenced [y3]).
H1·1.2.3: xy1.2.3 0
2. Ho: There is no relationship between instructors’ teaching experience and
level of creativity (student perception [y1], instructors’ perceived [y2], and
norm referenced [y3]).
H0·1.2.3: xy1.2.3 = 0
H1: There is a relationship between instructors’ teaching experience and level
of creativity (student perception [y1], instructors’ perceived [y2], and norm
referenced [y3]).
H2·1.2.3: xy1.2.3 0
3. Ho: There is no difference between instructors’ sex and their level of
creativity (student perception [y1], instructors’ perceived [y2], and norm
referenced [y3]).
H0·1.2.3: xy1.2.3 = 0
H1: Differences exist between instructors’ sex and their level of creativity
(student perception [y1], instructors’ perceived [y2], and norm referenced [y3]).
H3·1.2.3: xy1.2.3 0
13
4. Ho: There is no difference between instructors’ effective teaching as
perceived by students and level of creativity (student perception [y1],
instructors’ perceived [y2], and norm referenced [y3]).
H0·1.2.3: xy1.2.3 = 0
H1: Differences exist between instructors’ effective teaching as perceived by
students and level of creativity (student perception [y1], instructors’ perceived
[y2], and norm referenced [y3]).
H4·1.2.3: xy1.2.3 0
Definitions
Appropriate: The product of creativity must be useful and valued by society.
Consequence: Used in creativity research assessments, such as Torrance tests.
Participants are scored on the number and complexity of the answer to questions
such as “what would the consequence be if…”
Convergent thinking: Thinking of the correct answer.
Creativity: The intentional use of novel and original (to the creator) ideas to create
functional (appropriate) production of unique material with a corresponding cause
(reason), which is communicated to the external world.
Creative Thinking: the process of forming ideas or hypotheses, testing hypotheses, and
communicating the results
Divergent thinking: Thinking of multiple possible answers/ solutions to a specific
question.
Domain: Specific area of knowledge.
Effectiveness: Successfully working; achieving some end (aesthetic, artistic, spiritual,
14
winning, profit, etc.) (Cropley, 2001)
Elaboration: Ability to expand on an idea; adding details to clarify meaning.
Ethicality: Product, idea or action must not be destructive in behavior or selfish.
Natural/physical science: Those areas of study in the College of Agriculture, Food and
Natural Resources (CAFNR) at the University of Missouri (MU) that focus on
subjects that can be freely manipulated in experimental research Novelty: “A
creative product, course of action or idea necessarily departs form the
familiar” (Cropley, 2001, p. 6).
Flexibility: The ability to consider a situation from different points of view or to produce
numerous categories of responses.
Fluency: Thinking of countless ideas.
Novelty: “A creative product, course of action or idea necessarily departs form the
familiar” (Cropley, 2001, p. 6)
Originality: Novel responses.
Social science: Those areas of study in the College of Agriculture, Food and Natural
Resources(CAFNR) at the University of Missouri (MU) that focus on the
behaviors, organizations, institutions, societies and social interactions of human
subjects.
Uses: Used in creativity assessments such as those by Torrance. Participants indicate the
use of a particular item and are scored on the number and complexity of their
answers.
15
Assumptions
Creativity can be observed in a wide variety of fields and applied to different
contextual environments. For this study, it is assumed that creativity is applied only to the
context of instruction/ teaching. It is assumed that participants in this study answered
honestly and accurately reflected the creativity they evaluated. It is also assumed that
students possess enough knowledge of their instructors and general teaching effectiveness
to evaluate their instructors’ performance in the classroom. It is also assumed that
instructors provided accurate assessment of their own creative teaching behaviors.
Limitations
This study can only be applied to creativity measured and observed in the specific
context of instruction/ teaching. Additionally, limitations exist in the assessment of
creativity. It is important to identify the specific types of creativity tests used to measure
creativity as a domain of divergent thinking and self-perception. Given the complexity of
defining creativity, it is necessary to identify the limitations of applying findings to
indicate all creativity can be measured. In addition, the results of this study cannot be
generalized to any other group beyond CAFNR undergraduate instructors.
16
CHAPTER TWO
REVIEW OF LITERATURE
Chapter two is a review of literature related to creativity in teaching and effective
teaching. The review is organized into the following sections: Definitions of Creativity,
Convergent versus Divergent Thinking, Theories about Creativity, Assessments of
Creativity, Challenges for Assessing Creativity, Ways to Enhance Creativity, Barriers to
Creativity, Research, and Teaching Effectiveness.
Definitions of Creativity
Although research on the topic of creativity has existed for decades, concretely
defining creativity has been a difficult task (Baker et al., 2001; Friedel& Rudd, 2005;
Hocevar, 1981; Marksberry, 1963; Sternberg, 1999; Starko, 2005). Plucker et al. (2004)
investigated over 90 articles from two leading journals related to the study of creativity
and found that 34 (38%) explicitly defined the term creativity. Thirty-seven (41%)
offered an implicated definition, while 19 (21%) failed to offer any definition of the term.
Cropley (2001) suggested creativity must contain three primary elements, including:
1. Novelty (a creative product, course of action or idea necessarily departs from
the familiar);
2. Effectiveness (it works, in the sense that it achieves some end- this may be
aesthetic, artistic or spiritual, but may also be material such as winning or
making a profit);
3. Ethicality (the term ‘creative’ is not usually used to describe selfish or
destructive behavior, crimes, warmongering and the like). (p. 6)
17
However, to fully comprehend the theoretical frameworks that have been applied to
creativity requires a basic understanding of convergent and divergent thinking.
Convergent Versus Divergent Thinking
Guilford’s address to the American Psychological Association in 1950 is credited
for establishing the distinction between divergent and convergent thinking, especially as
the constructs apply to creativity (Cropley, 2001). According to Croply, convergent
thinking aligns with historic definitions of intelligence while divergent thinking suggests
novel and varied thought processes. While convergent thinking seeks the “single best”
answer to a given question and relies upon familiar, established techniques for acquiring
the “right” answer, divergent thinking requires examination of perspectives, multiple
answers and production of novel solutions (Cropley).
Hocevar (1981) stated that divergent thinking is the most common approach to
examining creativity. Although these tests are similar to traditional intelligence testing,
divergent thinking tests require multiple responses instead of a single correct answer
(Hocevar). Cognition also creates distinctions in creativity research. While researchers
have sought to determine the cognitive style that accounts for creativity, “There is no
single cognitive processing strategy that is uniquely favorable for creativity. The
relationship has come to be seen not as a matter of which strategies lead to it and which
do not, but rather of how various styles and strategies are connected to creativity”
(Cropley, 2001, p. 43). Cropley (1997) summarized the factors impacting creativity as the
“interaction of cognitive, affective, motivational and social/ personal factors” (p. 99).
Croply (1997) further outlined this interaction with the following statement:
18
Exposure to a rich variety of information lead not to anxiety and avoidance, but to
increased interest and desire for more information; information is not blindly
accepted (assimilated) and later regurgitated, but causes a reevaluation of the
situation in question and the formation of expanded or enriched configuration
(i.e., accommodation). Fascination, openness, and a “nose” for the incongruous
lead to ways of coming to grips with the situation that are marked by attention to
peripheral aspects of the information in question, willingness to try the
unexpected, search for the novel and so on. Possession of a fund of knowledge in
the area allows the individual to “feel” that a solution is near, to recognize a good
solution, and to experience the satisfaction of solving a problem (the problem
might be technical, scientific, philosophical, artistic, commercial, or whatever,
depending on the area in which creative is occurring ). Self-confidence yields the
courage to present the solution in a form understandable to the teacher and
classmates in the hope of convincing them and receiving recognition. Ultimately,
in the ideal case, the whole process culminates in the creator experiencing the
satisfaction of creative achievement (p. 101).
Theories about Creativity
The distinction between divergent thinking and convergent thinking may impact
the application of many theoretical frameworks. In fact, creativity has been viewed
through many different theoretical frameworks, including behaviorism, constructivism
and social constructivism (Starko, 2005).
19
Behaviorist Theories
Behaviorist such as Skinner (1972) viewed human actions to be the results of
stimulus and responses. Truly unique or original behaviors or ideas occur only as
inevitable products of an individual’s experience (Skinner). Skinner suggested artists
create because of the response or consequence of their action. Skinner also suggested
“certain kinds of consequences are said to “reinforce” in the sense that they make it more
likely to occur” (p. 335).
Behaviorists believe creativity is the product of reinforcement. The more
reinforcement, the more creative products should occur (Skinner, 1972; Starko, 2005).
Mednick (1962) also viewed creativity through stimulus and responses. Mednick viewed
experience and network of stimulus associations as the process of creativity andsuggested
that creativity is the result of remote, unrelated ideas that are connected to produce
creative ideas. Mednick used word-associations to illustrate his theory that creativity
resulted fromconnecting unrelated ideas, finding individuals who had diverse prior
experience with a stimulus were more likely to connect remote ideas about the stimulus.
Humanist and Developmental Theories
Humanist and developmental theorists have also addressed the concept of
creativity. Maslow (1968), Rogers (1962) and Gowan (1972) all saw creativity as part of
successful human development. Maslow (1954) suggested self-actualization as the top
level of his hierarchy of human needs, and postulated self-actualization should be
achieved by fully functioning human beings. Maslow further theorized there were two
types of creativity, the first being special talent creativity, which occurs “independent of
goodness or health of character” (p.35) and self-actualizing creativity. Maslow suggested
20
self-actualizing creativity resulted from good mental health and in the process of
acquiring self-actualization. One of Maslow’s famous statement on the subject of
creativity suggested “a first-rate soup is more creative than a second-rate painting…
cooking or parenthood or making a home could be creative while poetry need not be; it
could be uncreative” (Maslow, p. 136). However, Maslow believed people would do
everything creatively if they had a high level of self-actualization.
Rogers (1962) also saw creativity as the result of healthy growth of human beings.
His behaviorist approach suggested creativity resulted when novel products emerged
from the interaction of an individual and the environment. Rogers identified three
characteristics associated with creativity that allow interaction between the individual and
the environment. The first characteristic, referred to as openness to experience, suggested
an individual’s willingness to consider new ideas, tolerate ambiguity and view
experiences beyond conventional categories. Rogers also identified the internal locus of
evaluation, or the ability to rely on an individual’s own judgment, especially in
evaluating creative yields. Rogers’s third creativity included one’s ability to play with
ideas or concepts and imagine impossible combinations.
Gowan (1972) suggested additional cognitive stages that consisted of three-stage
cycles. Gowan saw creativity as the result of cognitive growth and identified creativity as
stage sixth of his cognitive stages.
Researchers have supported developmental theories of creativity (Vygotsky,
1960; Renzulli, 1992). Like Rogers (1962) and Maslow (1968), Vygotsky used three
stages to distinguish creativity. Vygotsky suggested the three stages occur during: (1)
childhood, where creative imagination begins; (2) adolescence, where imagination and
21
thought are brought together; and (3) adulthood, where mature creativity is controlled and
used in a purposeful manner. Formal schooling, inner speech, and thinking in concepts
influence the development of mature creativity, according to Vygotsky.
Vygotsky’developmental theory suggested creative imagination begins in children’s
figurative play. More specifically, Vygotsky proposed children’s symbolic play was the
catalyst to development of imagination. In addition, Vygotsky believed creativity was a
consciously developed mental function that requires adults to alter and merge ideas in
specific environments to generate creative products such as art, inventions or scientific
discoveries. Similar in some ways to the development approach, creativity research has
also been viewed through a systems theory.
Systems Theories
One possible theory that may approach this desired holistic approach could be a
systems approach. Systems approaches suggest creativity cannot be identified in a
vacuum, but rather as an interaction between the environment and the person (Starko,
2005). Although most systems approaches to creativity focus on extraordinary creativity,
the concept can be applied in a variety of situations. In general, systems theories suggest
there is interaction between cognitive, affective, motivational, and social/personal factors
(Cropley, 1997).
Systems theories also suggest the impact of the environment upon creative output
and inevitably involve human interaction (Starko, 2005). The environment can determine
the type of novelty produced and thus is an active recipient of what creative people offer
(Cropley, 2001). “Creativity cannot be properly understood in isolation from the social
22
context, for creativity is a special form of personal influence: The effective creator
profoundly alters the thinking habits of other human beings” (Simonton, 1988, p. 421).
Csikszentmihaly (1988) developed a systems model of creativity that included
three aspects: the person, the domain, and the field. Thus, creativity is an interaction
between product, person and environment (Starko, 2005). The field includes people who
can affect the structure of a domain (Starko). Creative products must be viewed by the
field as unique, but not too extreme to be considered a creative expression (Starko).
Individuals are judged and formed by the field (Starko). Gardner (1993) built upon
Csikszentmihaly’s model created his own theory of multiple intelligences.
Gardner (1993) suggested individuals are creative, but they create in a specific
field. “The creative individual is a person who regularly solves problems, fashions
products, or defines new questions in a domain in a way that is initially considered novel
but that ultimately becomes accepted in a particular cultural setting” (Gardner, p. 35).
Perhaps teaching can also be viewed through this setting. The teacher may be evaluated
by the field, which could include student evaluations, educational theories, and
administrative approval. Can teaching be considered a particular domain where creativity
can occur?
Systems approaches to creativity focus on the role of the environment (Starko,
2005), where creativity results from the interaction between an individual and their
surrounding environment (Csikszentmihalyi, 1996). Csikszentmihalyi (1988) created a
model of creativity where intellectual activity is considered creative achievement
(Plunker et al., 2004). Individuals create in a specific domain (Starko), and interact with
the environment, and product (Csikszentmihalyi, 1996). The environment determines the
23
types of novel, creative products that can be accepted and social settings determine the
level of innovation or acceptance of new ideas that may deviate from the norm.
The systems approach is further explained by Cropley (2001) who suggested that
creative thinking can be guided by the social setting and can be a reaction of the
motivations of the environment. However, the environmental influence on creativity is
not always acknowledged in creativity research (Plucker et al., 2004) despite some
aspects of environment having been positively related to creativity (Amabile, 1996;
Csikszentmihalyi, 1996; Plucker et al.). One environment researchers have explored is
the field of education.
The classroom, as a part of a student’s culture, is one environment that may foster
creativity if the environment can tolerate non-traditional and alternatives from the status
quo (Marksberry, 1963). Marksberry suggested the physical environment can also impact
creativity. A cheerful, colorful, challenging, and stimulating environment that invites
experimentation represents a creativity environment. Marksberry also suggested the
psychological safety found in the classroom environment is needed to foster creativity. In
addition, Marksberry stated that this requires the development of unconditional self-
worth. Students should have a more permissive environment, where movement is
encouraged and materials can be selected at will. The focus in a creative environment is
upon individual improvement instead of competition (Marksberry). Environment,
including within the classroom, has been a platform to observe creativity from an
intelligence perspective.
24
Relationship Between Creativity and Intelligence
Creativity has an interesting relationship with intelligence. Creativity has been
found to have a strong, positive correlation with intelligence (Cropley, 2001; Starko,
2005). These findings suggested the more intelligent one is, the higher the level of
creativity (Starko). However, this strong relationship is seen only for those who met the
minimum level of intelligence and up to approximately an IQ of 120 according to
Runco(1990) andStarko, or 130, according to Cropley. Interestingly, extremely intelligent
individuals may only display a moderate level of creativity and the relationship between
creativity and intelligence becomes somewhat weaker (Carson, Peterson, & Higgins,
2005; Crockenberg, 1972; Cropley; Starko). The concept of a threshold relationship
between intelligence and creativity is perhaps the most widely accepted theory in the
field of creativity research (Starko).
Intellectual abilities can also be viewed through Bloom’s (1956) Taxonomy of the
Cognitive Domain, including comprehension, application, analysis and evaluation
(Marksberry, 1963). Bloom stated that synthesis is one of the five skills needed for
reflection, critical thinking, or problem solving thinking. In addition, he called synthesis
the “category in the cognitive domain, which most closely provides for creative
behavior” (as cited in Marksberry, p. 8). Because no line can be drawn between analysis
and evaluation, critical thinking and creative thinking differ only slightly (Marksberry).
Psychomotor skills refer to the product created by effectively suing material and tools
(Marksberry).
Creativity also appears to require extensive knowledge of both general areas as
well as specific fields (Marksberry, 1963). Gardner (1993) applied his own theory of
25
multiple intelligences to creativity, finding people are creative in domain-specific ways
(Starko, 2005). Gardner viewed creativity not as a personality characteristic, but rather as
creative function in a specific area (Starko). Gardner identified seven intelligences,
including linguistic, logical-mathematical, spatial, musical, bodily-kinesthetic,
interpersonal and intrapersonal intelligences.
Motivation
Sternberg (2006) established a basic understanding for the role motivation plays
in creativity by stating: “Creativity is as much a decision about and an attitude toward
life as it is a matter of ability” (p. 93). In addition, Sternberg suggested creativity can be
seen in all people, but is frequently obvious in young children. Creativity “may be harder
to find in older children and adults because their creative potential has been suppressed
by a society that encourages intellectual conformity” (p. 93). Fasko (2000-2001)
suggested the effects of intrinsic and extrinsic motivators upon creativity can be applied
to any classroom and any grade level. Runco and Chand (1995) suggested motivation is
needed for creative thinking. Further, problem solving could assist intrinsic motivation in
individuals (Runco & Chand). From an educational perspective, Fasko suggested students
would be more motivated when choosing their own tasks. Intrinsic motivation favors
creativity and creative people complete a task because of their intrinsic motivation
(Fasko; Runco & Chand; Ruscio, Whitney & Amabile, 1998). Sternberg (2006)
suggested “people rarely do truly creative work in an area unless they really love what
they are doing and focus on the work rather than the potential rewards” (p. 89). Runco
and Chand proposed motivation to be an important component for creative thinking.
26
More specifically, the Runco and Chand (1995) model suggested problem finding
would encourage intrinsic motivation and therefore students would be more motivated if
they chose their own tasks. Hennessey and Amabile (1987) suggested intrinsic motivation
is subjective to situational events. “Situational events in one’s environment (e.g. school)
may affect one’s motivation on a task (e.g. problem solving)” (Fasko, 2000-2001). Davis
(1991) stated it is “important to help student metacognitively understand the topic of
creativity” (pg. 220). This “increased understanding of creativity would increase
creativity consciousness, demystify creativity and increase creative ideas and products”
(Fasko, p. 318).
There have also been cautions regarding creativity and motivation. For example,
Fasko(2000-2001) stated “educators must be aware that, if they implement an extrinsic
reward structure with these students, this will undermine their intrinsic motivation (p.
326). Given the focus on creativity and intrinsic motivation (Sternberg &Lubart, 1991;
Ruscio et al.; Hennessey &Amabile, 1996), Fasko concluded, “schools need to improve
their capacity for improving students’ intrinsic motivation” (p. 323). The connection
between student motivation and creativity is not the only educational application of
creativity research.
Teacher Role
Much of the educational research on creativity appears to focus on increasing and
analyzing the potential for student creativity; however, the teacher plays an integral role
in the development of student creativity. Several sources suggest a need for increased
teaching of creativity in schools, and especially in teacher education (Mack, 1987).
Sternberg (2006) suggested, “When student are taught in a way that fits how they think,
27
they do better in school. Children with creative or practical abilities, who are almost
never taught or assessed in a way that matches their pattern of abilities, may be at a
disadvantage in course after course, year after year” (p. 94). Sternberg and Lubart (1991)
advised teachers to give more long-term assignments to encourage and increase students’
tolerance for ambiguity. They further suggested teachers implore students to take more
risks with their new skills.
Torrance (1981) found increased motivation, concentration, curiosity, alertness,
and achievement could be observed when creative learning occurred. “Thus, creative
teaching can enhance learning” (Fasko, 2000-2001). In fact, Karnes, McCoy, Zehrbach,
Wollersheim, Clarizio, Costin, and Stanley (1961) found creativity was significantly
related to educational achievement. In addition, Karnes et al. suggested teachers were
most effective in stimulating creativity of their students when they, as teachers, modeled
divergent thinking.Cropley (2001) also suggested “creativity offers classroom approaches
that are interesting and thus seems to be a more efficient way of fostering learning and
personal growth in the young. Creativity helps children learn and develop” (p. 28).
Creative teachers tend to provide more support for creative students (Cropley, 1997).
Interestingly, Milgram (1979) found correlations between the level of creativity of
teachers and their students.
Creative Outcomes
Several researchers have focused on the creative outcome as defining creativity
and thus the creative product a measurement of creativity (Amabile, 1987; Carson et al.,
2005; Hasse, 2001; MacKinnon, 1962). The essence of creativity is found in the outcome
or product. Plucker et al. (2004) stated: “The criteria of a perceptible outcome is useful
28
because without observable and measurable evidence of some act, idea, or performance,
it is difficult to determine whether creativity has occurred” (p. 91). In addition, these
authors argued the presence of creativity can be inferred and evaluated through
producing, identifying and examining documentable artifacts, such as behaviors, ideas or
products (Plucker et al.). Carson et al. postulated, “creative achievement may be defined
as the sum of creative products generated by an individual in the course of his or her
lifetime” (p. 37). In addition, Carson et al. suggested creative products must meet two
basic criteria; products must be both novel and useful. However, other researchers
suggested creativity can best be explained as a process.
Process and Problem Solving
Marksberry (1963) suggested that creativity could be measured by how an
individual approaches a problem, not by the outcome. The creative process could thus be
divided into four stages: (1) preparation; (2) incubation; (3) insight, illumination or
inspiration; and (4) verification, elaboration, perfecting and evaluation (Marksberry). The
preparation period may vary in length, but in general, it begins when there becomes a
strong desire to begin an activity. In includes all life experiences and it may include
intense times of trial and error to solve a problem (Marksberry). Incubation is the time
when “deep” thinking searches for solutions. It is unconscious activity, which is often
frustrating and may require changes in activity (Marksberry). During the period of
insight, inspiration or illumination occurs when the solution is discovered and begins to
be captured. The final stage can be defined as verification, elaboration, perfecting or
evaluation. This stage checks and re-checks the solution to the problem. In reality, these
29
stages often overlap and may occur many times in the creative process (Marksberry). The
creative process can occur at any time during the problem-solving process (Marksberry).
Problem solving has been tied to creativity since Guilfords’s research in the
1950’s (Cropley, 2001). Dewey’s 1920 model of problem solving was one of the earliest
models of creativity. “Dewey described the process of problem solving in five logical
steps: (a) a difficulty is felt, (b) the difficulty is located and defined, (c) possible
solutions are considered, (d) consequences of these solutions are weighted and (e) one of
the solution is accepted” (as cited in Starko, 2005, p. 25). Wallas (1926) also supported
the Dewey model, but added unconscious processing, or the “aha!” moment. Wallas
identified preparation, incubation, illumination (the “aha” moment), and verification. Ai-
Girl & Lai-Chong (2004) suggested the creative process consists of three stages,
including hypothesis formation, hypothesis testing, and communication of results. The
Torrance model (1995) also described logical stages, including:
1. Identifying problems and challenges
2. Recognizing and stating the important problem
3. Producing alternative solutions
4. Evaluating alternative solutions
5. Planning to put solutions into use (p. 236)
Theaction stage included in the Torrance model was noticeably absent from the Dewey
and Wallas models (Starko). However, this suggests something must be accomplished or
put into action to be considered creative (Starko).
Multiple theoretical frameworks have been applied simultaneously to the study of
creativity. Indeed, divergent thinking alone is too simple of an approach to creativity
30
(Cropley, 1997). In fact, Cropley stated “…affective, motivational, personal, and social
factors in creative behavior … has implied and supported a holistic approach, holistic
both with regard to the psychological elements of creativity and also with regard to the
stages of the creative process” (p. 98).
With such a wide array of theoretical backgrounds, it may be important to find
similarities between creativity theories offered by decades of researchers. Creativity
appears to demand time, persistence, motivation, and a knowledge base. Although some
theorists believed insight is a requirement of the creative person, others disagree (Starko,
2005). However, “most theorists do postulate strategies, processes, or habits of mind that
make creative ideas more likely. These may include generating analogies, defining
problems, or looking for multiple solutions. It is possible that such strategies can be
taught and improved”(Starko, p. 66).Thus, there are some basic foundations within
creativity research which allow one to move beyond definitions and theories to creativity
assessment.
Assessments of Creativity
Creativity assessments seek to identify the creative person. Cropley (2001) calls
this an “exciting adventures” (p. 52) in creativity research. However, Hocevar (1981)
suggested creativity is the most difficult psychological concept to measure. This
identification occurs through calculating scores on instruments believed to assess creative
potential, or by “demonstrated creative behavior” (Cropley, p. 52). Creativity tests may
have appeared as early as 1915, and many more were developed between World War I
and World War II (Cropley, 1997). Following Guilford’s 1950 address, some
psychologists developed tests of divergent thinking (Croply, 1997). The Alternative Uses
31
test, Product Improve test and Consequences test became well know assessments in the
1950s and 1960s. Torrance integrated all of these tests into what is today referred to as
the Torrance Tests of Creative Thinking (TTCT) (Cropley, 1997). “To this day, the
Torrance Tests of Creative Thinking remains the most widely used assessments of
creative talent” (Sternberg, 2006, p. 87). The Torrance tests became a prototypical
assessment that measured divergent thinking, or thinking that deterred from more
conventional approaches and created unusual answers (Cropley). These tests asked
participants to identify uses, consequences, product improvement, fluency, flexibility and
originality, based on simple situations (Cropley). However, not all researchers animatedly
support creativity testing. A number of concerns and criticisms of creativity tests have
arisen during the past few decades of creativity research.
Multiple methods of measuring creativity have allowed assessments to be
classified as test oriented, personality oriented or product oriented (Dacey, 1989). In
addition, Amabile (1996) further defined creativity test-oriented assessments as
personality tests, biographical tests, and behavioral assessments.
Personality Oriented Assessment
Personality inventories are one example of creativity assessments. Amabile
(1996) suggested there are two basic types of personality inventories. The first type
created creativity scales, such as Gough’s (1979) Creative Personality Scale. Gough’s
Adjective Check List resulted after 18 of 30 adjectives were positively correlated to
creativity. The second type of personality assessments, according to Amabile, focus only
on identification of “traits characteristic of creative individuals” (p. 22). The “What Kind
of Person Are You?” test developed by Torrance and Khatena (1970) is an example of
32
the second type of personality assessment. This type of assessment was “specifically
designed to assess creativity” (Amabile, p. 23) and requires participants to selected
appropriate self-described adjectives in a forced choice format (Amabile).
Biographical Assessments
According to Amabile (1996), biographical inventories were developed on
“intuitive basis and refined thorough testing samples of individuals rated high in
creativity and those rated low or average” (p. 23). Childhood, interests, hobbies,
experiences, family history, educational history, leisure activities, physical characteristics
are some examples biographical inventories have sought to identify (Amabile).
Biographical assessments have been developed based on the assumption that past
experiences determine current behavior (Hocevar, 1981). While assessments have been
developed for industrial settings (Hocevar), it appears biographical assessments have
limited applications in past creativity educational research.
Behavioral Assessments
Perhaps the most well known of all types of creativity assessments, behavioral
assessments are the “typical creativity test” identified in creativity research (Amabile,
1996 p. 24). While most creativity tests are similar to the TTCT in content,
administration, form and scoring, questions still arise to the meaning of creativity tests
(Amabile). Amabile suggested:
Creative performance emerges from three necessary components, from
combinations of innate skills, learned abilities, and task attitudes. Any given
creativity test might tap one or more of those abilities or dispositions, but it is
33
most unlikely that a single test will tap all the elements of the three components in
a general way (p. 25).
It is also important to note that extraneous influences may impact test
performance. For example, several studies found participant scores on creativity tests
improved merely by telling them they were taking a creativity test (Amabile, 1996).
Wallach and Kogan (1965) proposed tests should be given in a less restrictive, even
game-like manner without time constraints (Amabile; Cropley, 1997; 2001). Finally, it
must be noted that creativity tests measure more than established differences in individual
creative abilities and attitudes. In fact, performance may also include social and
contextual factors (Amabile).
Product Oriented Assessment
Assessing the creative product is another approach to measuring creativity. While
the concept of assessing the creative product is appealing in theory, few researchers have
ventured into this direction (Amabile, 1996). Product oriented assessment becomes
challenging because it is difficult to quantify what determines a creative product. Indeed,
several researchers suggest the creative product may be initially rejected before becoming
valued by society (Cropley, 1997; 2001). Experts or judges may also be used to assess
creative products (Amabile). While this may be subjective in nature, the process of
selecting expertshas produced interesting results. MacKinnon (1962) asked a panel of
experts, composed of five professors of architecture, to rate and nominate the 40 most
creative architects in the United States. Although the panel could potentially nominated
200 different individuals, only 86 were nominated. This showed substantial agreement
among experts. MacKinnon also requested 11 editors of the top architectural journals to
34
rate the creativity of the 64 nominated architects. The same architects were asked to rate
themselves and the additional 63 architects in the study. MacKinnon suggested:
Since the editors’ ratings of the creativity of the architects correlated +.88 with the
architects’ own ratings, it is clear that under certain conditions and for certain
groups it is possible to obtain remarkable agreement about the relative
creativeness of individual member of a profession and thus meet the first
requirement for an effective study of creative person (p. 486).
Hocevar (1981) cautioned “the judges in product studies vary from experts to
non-experts, and the criteria vary from diverse definitions of creativity to social
recognitions (i.e. rewards, publications, etc.). Further, subjective judgments are usually
made on what products to choose and in what situation they will be obtained” (p.454).
As a result, creativity products are represented by very specific samples of
behavior (Hocevar, 1981). MacKinnon (1962) suggested successfully determining traits
of highly creative individuals in a specific field requires sampling a wide range of
individuals within the profession and a wide variety of distinguishing characteristics.
Thus, a “range of talent sufficiently wide to be fairly representative of the profession as a
whole” (MacKinnon, p. 487) can be identified. Product assessments have also been
examined through self-reported assessments.
Self-reported Assessments
Self-reported instruments are yet another method of creativity assessments.
Hocevar (1981) suggested, “A useful way to measure creativity is to simply ask the
subject. This is not a profound position, but yet the procedure is rarely used” (p. 459).
35
Perkins (1981) suggested immediate self-reports, or descriptions by the creators
during the creative process, or immediately after, are a more reliable method to
understand the creative process. According to Perkins, the process of creativity is not as
important as the purpose. People create for a purpose (Starko, 2005). Because past
behavior appears to be the best indicator of future behavior (Hocevar, 1981), it would
appear past creative behavior can predict future creative endeavors.
To measure self-reported past creative achievement, Carson et al.(2005) created
the Creative Achievement Questionnaire (CAQ). Believing that creative
accomplishments are best assessed in a domain-specific manner, the CAQ identified
several specific creative endeavors (Carson et al.).
Perhaps Hocevar (1981) stated it best: “despite the voluminous literature on the
measurement of creativity, a simple and straightforward inventory of creative
achievement and activities appears to be more defensible that the more commonly used
methods” (p. 459). Although self-reported assessments, have illustrated appropriate face
validity (Hocever), these measures may face the challenge of determining which
activities and accomplishments qualify as creative. However, assessing creativity may
have many such challenges.
Challenges for Assessing Creativity
There are a number of challenges associated with creativity assessment. For
example, the subjective nature of scoring creativity tests becomes a concern for the
validity of creativity assessments (Amabile, 1996). “For some scoring procedures, results
must depend on the test scorer’s intuitive assessment of what is creative, and not
according to objective criteria of novelty, appropriateness, satisfyingness, and so on”
36
(Amabile, p. 28). Croply (1997) pointed out many creativity tests have been challenged
on their low face validity. Construct validity has been questioned by empirical research
and creates a greater concern because many creativity instruments are validated against
one another (Amabile). Inter-rater reliability can be questioned when different judges are
used to assess creativity (Hocevar, 1981). In addition, discriminate validity of judgments
may provide a challenge for creativity research (Hocevar). In other words, judges may
struggle to “distinguish creativity from other constructs such as intelligence,
achievement, competence, etc.” (Hocevar,p. 456).
Testing for creativity is not without its critics. Some research has suggested
that“many of the creativity tests assess such narrow ranges of abilities that it is
inappropriate to label a particulate test performance as generally indicative of creativity”
(Amabile, 1996, p. 27). Further, judges may struggle to discern dimensions of creativity
(Hocevar, 1981). These type of assessments do not measure what we think of as
creativity (Hocevar) and “because they seem to have little in common with the kind of
mental activities involved in painting the Mona Lisa or writing, for example, Gone with
the Wind” (Cropley, 1997, p. 104).
Yet another challenge with creativity assessments is the lack of differentiation
among creative performances (Hocevar, 1981). “Intuitively, it is plausible that a person
who is creative in one area has neither the time, ability, nor the motivation to be creative
in other areas” (Hocevar, p. 457). This is compounded by the challenge of predicting
creativity in diverse areas, which feasibly would require different instruments (Hocevar).
According to Hocevar, the greatest problem with creativity measurement is the absence
of convergent validity among assessment methods. Individuals have been ranked
37
differently when multiple methods of assessing creativity have been employed (Hocevar).
Carson et al. (2005) suggested: “many measures rely on subjective ratings from either
expert or non-expert judges” (p.39). Because multiple raters are usually required to
establish validity, the training and compensation can be both lengthy and costly (Carson
et al.).
Despite these challenges, Hocevar (1981) suggested recent creativity research
recognizes both divergent thinking and convergent thinking are required for creative
production. The result has led to many new creativity assessments (Cropley, 1997).
Amabile (1996) cautioned that creativity tests were designed to detect individual
differences and are appropriate for these purposes. Amabile suggested, however, that
while some creativity tests have been criticized, assessments based on creative
accomplishments and creative products are more appropriate to measure creativity.
Ways to Enhance Creativity
Plucker et al. (2004) suggested that potential applications of creativity are well
documented in research spawning over many decades. However, the prospective
applications are seldom fulfilled. “Our knowledge of creativity- and thinking and learning
in general- has advanced over the past several decades, but our strategies for enhancing
creativity have changed very little” (Plucker et al., p. 83). Weisberg’s (1988) research
offered two methods to enhance creativity: (1) develop expertise by allowing experiences
to draw upon past experience; and (2) boost determination and commitment, which is
accomplished by allowing repeated attempts after initial failure.
In the education field, Cropley (1997) suggested teachers should “consider
information, special ways of thinking about it, inventiveness in finding solutions, ability
38
to evaluate ideas, ability and willingness to communicate solution to others, and
evaluation of solutions in the context of the real world” (p. 89). More specifically,
Cropley identified 10 conclusions on the relationship between cognition and creativity
and suggested teachers should encourage the following:
1. Possession of a fund of general knowledge
2. Knowledge of one or more special fields
3. An active imagination
4. Ability to recognize, discover, or invent problems
5. Skill at seeing connections, overlaps, similarities, and logical implications
(convergent thinking)
6. Skill at making remote associations, bisociating, accepting primary process
material, forming new gestalts, etc (divergent thinking)
7. Ability to think up many ways to solve problems
8. A preference for accommodating rather than assimilating
9. Ability and willingness to evaluate their own work
10. Ability to communicate their results to other people. (p. #)
The ability to enhance creativity of teachers has also been the focus of some
research (Milgram, 1979; Davidovitch&Milgram, 2006). In fact, Davidovitch and
Milgram suggested that determining the creativity of pre-service and in-service educators
and enhance the creative thinking of these teachers is a worthwhile endeavor. However,
to accomplish this goal, it may be necessary to identify barriers to creativity, which must
be overcome.
39
Barriers to Creativity
Decades of research on creativity have resulted since Guilford’s 1950 address.
Creativity has been driven by a wide array of theories and models. Assessment of
creativity has been attempted for almost 60 years, and yet, researchers cannot agree on
one concept or definition of creativity. Hocevar (1981) suggested the most apparent
challenge associated with measuring creativity is the absence of convergent validity
among the multiple assessments methodologies. Hocevar also suggested creativity
assessments should be correlated in order to establish convergent validity. According to
Hocevar, multiple methods of assessing creativity have had mixed results, however, few
studies have shown a correlation higher than .30. This suggests the need to assess
creativity using a variety of methods and correlate creativity measures.
Research of teacher creativity appears to be limited. While some may suggest that
creative teaching is effective teaching (Anderson, 2002; Bain, 2004; Bleedron, 2003,
2005; Chambers, 1973; Croply, 1967, 2001; Davidovitch&Milgram, 2006; Esquivel,
1995; Fasko, 2000-01; Milgram, 1979; Newcomb et al., 1993; Renzulli, 1992; Torrance,
1981, 1995), concrete measures that define creative teachers appear to be lacking in the
literature.
Cropley (2001) stated: “Creativity offers classroom approaches that are
interesting and thus seems to be a more efficient way of fostering learning and personal
growth of the young. Creativity helps children learn and develop” (p. 28). Identifying
characteristics of creative behavior of instructors is needed to establish the impact of
creativity in the classroom environment. In addition, creativity research in subject-
40
specific areas such as agricultural education appears to be lacking. The call to continue
creativity research is evident, however.
Future Creativity Research
Sternberg (2006) stated “… to the extent that creativity is in the interaction of
person with context, we need to concentrate as well on the attributes of the individual and
the individual’s work relative to the environmental context” (p. 95). With this in mind,
perhaps education offers the greatest potential for creativity research. Researchers such as
Cropley (2001) suggested, “since all people are capable of developing their abilities,
knowledges, skills, attitudes, and personal properties in a creative direction…” (p. 28)
“What is more desperately needed is a shift of focus from research and testing to a
broader application of actual teaching strategies that stimulate interest in a creative use of
the mind as a motivator to the learning of content “ (Swartz and Parks, 1994).
In addition, Bleedron (2005) suggested that acquiring knowledge and information
is valuable, however, not the only criterion. Education also provides “positive self-
concepts, creative problem-solving skills, capacities for higher-order thinking,
responsibility, empathy for differences, talents for teamwork, independent judgment and
whatever contributes to effective, engaged citizenship” (p. 26). “Teacher education
courses need to equip teachers with skills for teaching course content through creative
exercise of the mind. Enlightened teachers do it well as an automatic practice of their
profession. All teachers need to be well schooled in the art” (Bleedron, p.26). Thus, the
need for effective teachers becomes paramount.
41
Effective Teaching
Effective teaching has been the subject of considerable research (Buchanan, 1997;
Miller et al., 1989; Newcomb et al., 1993; Nicholls, 2002; Reid and Johnstone, 1999;
Roberts & Dyer, 2004; Rosenshine&Furst, 1971; Westmeyer, 1988). Effective teaching
has been the focus of considerable research with great reason. As Buchanan (1997)
stated: “great professors profoundly affect those they teach way beyond their college
years; their contribution often resonate throughout the entire course of their students’
lives” (p. xviii). However, similar to creativity, effective teaching may be difficult to
define, perhaps due to the multiple perspectives which comprise effective teaching
(Young, & Shaw, 1999).
Reid and Johnstone (1999) identified six components to good teaching, including
approachability, clarity, depth of knowledge, interaction, interest and organization.
However, Reid and Johnstone found differences between the order of these six
components when examined from student and instructor perspectives. Specifically,
students ranked interest above depth of knowledge, but instructors reversed this ranking
(Reid &Johnstone). In addition, students ranked approachability above interaction while
instructors ranked interaction above approachability. Further, students ranked clarity
higher and thus more important than did instructors.
Similarly, Feldman (1976) found clarity and stimulating student interest were
highly related to good teaching. Feldman also suggested effective instructors were
knowledgeable about their content, prepared and organized for class and were
enthusiastic. Young and Shaw (1999) investigated over nine hundred university students
in an attempt to define effective teachers. They found “effective communication, a
42
comfortable learning atmosphere, concern for student learning, student motivation, and
course organization were found to be highly related, as a group, to the criterion measure
of teacher effectiveness” (Young & Shaw, p. 682). However, students also indicated the
value of the course was a strong predictor of teacher effectiveness (Young & Shaw). In
fact, Young and Shaw found the “worth of a course for the university students was the
most important predicator of teacher effectiveness” (p. 683). These researchers suggested
that regardless of course content, effective teachers assumed the responsibility for making
the course valuable for the students. Further, Young and Shaw concluded that students
rated effective teachers high on important variables of their study (value of the course,
effective communication, a comfortable learning atmosphere, concern for student
learning, student motivation, and course organization). However, students did not rate
instructors equally high on all of the important characteristics. “It appears that effective
teacher can compensate for deficiencies in one or two areas by demonstrating outstanding
skills in other areas” (p. 683).
Nicholls (2002) also outlined specific criteria to determine the quality of teaching.
These include:
Lecturers have clear aims and learning outcomes for their teaching session;
students are aware of these aims and learning outcomes; lecturers have a secure
command of the subject matter being taught; teaching sessions have suitable and
achievable content; teaching activities are well chosen an dare focused on
promoting learning outcomes; and teaching task are presented in ways that
engage, motivate and challenge all students, allowing individual learning and
progress to be made (p. 145).
43
In addition, Nicholls outlined elements of effective teaching in higher education.He
suggested teaching must have:
A clear purpose and a strategy for achieving it; is firmly structured with a
beginning, a middle and end, yet with the possibility of being varied to take
account of opportunities which arise unexpectedly; takes account of students’
prior learning; takes account of differences in students’ ability; offers a variety of
teaching strategies; challenges students’ perceptions and ways of thinking;
generates a dynamic and motivating atmosphere which allows students to become
involved and achieve; demands high standards; and provides a learning
environment that encourage students to participate and actively learn ( p. 146).
However, these components of effective teaching are not new. In fact, Rosenshine and
Furst (1971) outlined many of the same principles.
Rosenshine and Furst (1971) studied eleven variables that described effective
teaching. The first five variables identified had the most conclusive results. Rosenshine
and Furst found the top five variables associated with effective teaching included clarity,
variability, enthusiasm, task-oriented and/or businesslike behavior, and student
opportunity to learn criterion material.
Clarity was addressed as the clarity of a teacher’s presentation. Specifically,
Rosenshine and Furst (1971) described effective teachers who demonstrated clarity
“spent less time answering student questions, phrased questions so that they were
answered the first time without additional information or additional questions
interspersed before the student responded, or used fewer vagueness word such as ‘some’,
44
‘many’, ‘of course’ and ‘a little’” (p. 44). Clarity may be similar to organization, which
has demonstrated positive relationships with student achievement (Rosenshine&Furst).
Effective teachers use variability, or a variety of teaching methods during lessons.
Rosenshine and Furst (1971) suggested variability can be observed through “a teacher’s
flexibility in procedure, weather the teacher was adaptable or inflexible, and the amount
of extra equipment, books, displays, resource materials, and student activities” (p. 45).
Correlational studies have indicated a positive relationship between student achievement
and variety of instruction occur (Rosenshine&Furst).
While enthusiasm may be difficult to describe, Rosenshine and Furst (1971)
suggested enthusiastic teachers are those who use movement, gestures and voice
inflections. Task-oriented behavior may best be described as achievement oriented
teachers “concerned that students learn something rather than that students enjoy
themselves” (p. 47).
Rosenshine and Furst (1971) also indicated effective teachers are those who
provide students the opportunity to learn the material. The relationship between the
material covered in the class and class criterion scores were examined to define students’
opportunity to learn criterion material (Rosenshine& Furst). “Overall, the correlations
between measure of opportunity to learn and student achievement are positive, significant
and consistent” (p. 48).
Newcomb et al. (1993) identified thirteen principles of effective teaching. The
first principle suggested that “the subject matter to be learned possesses meaning,
organization, and structure that is clear to students, learning proceeds more rapidly and is
45
retained longer” (p. 26). Newcomb et al. suggested that meaning, sequencing, structure
and clarity are addressed in this first principle.
The second principle suggested by Newcomb et al. (1993) was “readiness is a
prerequisite for learning” (p. 29). The “subject matter and learning experiences must be
provided that begin where the learner is” (p. 29). Newcomb et al. suggested effective
teachers who demonstrate this principle “go to great links to learn about their students”
(p. 29), such as learning about student interests, dreams, prior knowledge in the subject
matter, and parental expectations. Further, a concern for students and their ability or
readiness to learn new material requires instructors to know students on an individual
basis.
Several effective teaching principles suggested by Newcomb et al. (1993) involve
motivation. Effective teaching principles identified by Newcomb et al. which address
motivation include principles three through six, including: “students must be motivated to
learn and learning activities should be provided that take into account the wants, needs,
interests, and aspirations of students” (p. 30); “success is a strong motivating force” (p.
32); and “students are motivated when they attempt tasks that fall in a range of challenge
such that success is perceived to be possible but not certain” (p. 33). Simply put, effective
teachers are those who motivate students to achieve in the learning environment.
Newcomb et al. suggested student motivation is directly tied to teacher enthusiasm and
the interest teachers create for a subject. Teacher enthusiasm has been positively
associated with student achievement and can be observed through a teacher’s
“movements, gestures, and voice inflections” (Newcomb et al., p. 31). According to

46
Newcomb et al., student interest can be achieve in a variety of ways, but must be directed
by the teacher.
The seventh through ninth principle suggested by Newcomb et al. (1993)
addressed reward and reinforcement. Principle seven, “when students have knowledge of
their learning process, performance will be superior to what it would have been without
such knowledge” (Newcomb et al., p. 33) addressed the need to provide feedback for
students. Principle eight, “behaviors that are reinforced (rewarded) are most likely to be
learned” (Newcomb et al., p. 34) suggested behavioral skills can best be learned “if the
correct performance of the skills is rewarded” (Newcomb et al., p. 35). Principle nine
states: “to be most effective (reinforcement) must follow as immediately as possible the
desired behavior and be clearly connected with that behavior by the student” (Newcomb
et al., p. 36). An effective teacher must help students make the connection between
behavior and the mastery of skills or knowledge (Newcomb et al.).
Newcomb et al. (1993) also identified techniques of teaching as components of
the principles of teaching and learning, including principles ten through thirteen.
Principle ten suggested “directed learning is more effective than undirected learning”
(Newcomb et al., p. 36). Thus teachers must assume the responsibility for the teaching
and learning process (Newcomb et al.). The eleventh principle shared byNewcomb et al.
suggested “to maximize learning, students should ‘inquire into’ rather than ‘be instructed
in’ the subject matter. Problem-oriented approaches to teaching improve learning” (p.
37). While teachers must direct and supervise the learning environment, effective
teachers allow students to use their own activities and study to retain knowledge
(Newcomb et al., 1993).
47
Newcomb et al. also suggested the importance of variability as a component of
student inquiry. In addition, problem-oriented instruction requires students to inquire into
the subject matter and requires effective teachers to use questioning techniques to
facilitate student inquires (Newcomb et al.). Principle twelve suggested“students learn
what they practice” (Newcomb et al., p. 39). Practice is defined as application of
cognitive and attitudinal skills, as well as psychomotor skills (Newcomb et al.). However,
Newcomb et al. cautioned students can practice error instead of success. Thus, it is
imperative that effective teachers monitor student learning to achieve the desired
outcomes. Finally, Newcomb et al. suggested “supervised practice that is most effective
occurs in a functional educational experiment” (p. 40) as their thirteenth principle.
Teachers may optimize student learning by creating opportunities for students to practice
in real-life or closely simulated situations (Newcomb et al.).
Student Evaluation of Effective Instructors
While researchers have generated many ideas of effective teaching, student
evaluations may provide the most accurate measure of teacher effectiveness (Young &
Shaw, 1999). Student evaluations have received considerable research attention (Cohen,
1981; Feldman, 1989; Young & Shaw). “Overall, the research on teacher effectiveness
indicates a moderate positive relationship between student ratings of instructors and
student achievement” (Young & Shaw, p. 672). In addition, McKeachie (1983) suggested
“students will continue to be those most affected by teaching. Therefore, student ratings
will continue to be useful” (p. 1224). If student ratings can identify effective teacher
characteristics, can students also identify creative instruction?
48
Creative teaching
One component of effective teaching may well be viewed as creative teaching.
Some researchers have suggested “the study of the teacher’s role in creative teaching may
be subsumed under the broad category of the ‘teacher effectiveness’ research, which
documents the impact that teacher have on student learning in general” (Esquivel, 1995).
However, Milgram (1979) stated, “although few studies of the relationship exist, creative
teacher behavior probably makes for more effective teaching” (p. 125). Torrance (1995)
suggested the “great creative teacher is an interesting and important phenomenon and
deserves serious study and discussion” (p. 58). In addition, Torrance believed the
intention of creative teaching is to create a responsible environmentthat captures teacher
enthusiasm, and supports appreciation of individual differences. While reflecting on great
teachers, Anderson (2002) suggested, “the most fundamental risk these teachers accept is
found in their willingness to confront both success and failure in the interest of teaching
better. They risk themselves in being responsible for their work. In this way, they are not
so different from creative artist in other arenas” (p. 35). In addition, Torrance (1981)
suggested signs that creative learning has occurred include increased motivation,
awareness, inquisitiveness, concentration, and accomplishment. However, Torrance also
suggested creative teachers are relatively unstudied.
Chambers (1973) suggested college teachers could encourage the creativity of
their students. In addition, “students viewed these teachers as being more accessible to
them, committed to their field, enthusiastic, and intellectually challenging” (Fasko,
p. 322). Beidler (1997) reflected on many years in the professoriate and offered personal
characteristics of good teachers, including the following: desire to be good teachers; take
49
risks; have positive attitudes; devote time to their students; personally care for students;
seek to increase the confidence of their students; challenge themselves and their students;
motivate students; do not trust student evaluations; and listen to their students.
In addition, Croply (1967) referred to creative teachers as “resourceful, flexible
and willing to get off the beaten track” (p. 96). Croply also suggested creative teachers
are able to form positive relationships with students, including highly creative students.
Torrance (1995) stated that creative teachers were great teachers who involved students
in the process of learning. Creative teachers involve students in the discovery of
knowledge and encourage students to push limits and explore the unknown (Torrance).
According to Torrance, the truly creative teacher does not desire to become principal or
superintendent, because this type of teacher does not work for status or power. Instead,
the creative teacher “works in order to live with himself: the freedom to create is his
greatest reward” (Torrance, p. 14).
Torrance (1995) also suggested the creative teacher may offer alternative ideas
that differ from other teachers and from some traditional educational beliefs. The creative
teacher is often unlikely to change their opinion easily, and may be challenging for an
administrator (Torrance). In fact, Torrance suggested creative teachers “may be difficult
to hold to routine and become restless under conventional restraint” (p. 14). Creative
teachers often work best when given a difficult, challenging problem or when they can
become deeply engrossed in a specific project (Torrance). However, the creative teacher
may disregard protocol and may even try a new idea without seeking official permission
(Torrance).
50
Bleedron (2005) stated “teachers of excellence and insight who go beyond the
established curricula are likely to recognize special creative-thinking talents in students
and provide opportunities for their recognition and reward. Such teachers will be the ones
who will be remembered for a student’s lifetime, with gratitude for their mentoring” (p.
26).
Fasko (2000-01) postulated, “creative teaching can enhance learning” (p. 320).
How can creative teaching influence learning? A few examples can be found when
comparing effective teaching theories with creativity theories. For example, Newcomb et
al. (1993) suggested “effective teaching involves more than what the teacher does in the
classroom and the laboratory. Teaching that is creative, interesting, and challenging to
students and results in students achieving a high level of masterly begins with a course of
study that make sense to students” (p. 26). Anderson (2002) suggested creative work
requires passion, just like teaching. “A teacher’s passion is infectious and easily
engenders the student’s interest. When a teacher’s passion for his subject matter is
genuine and committed, it shows itself and transforms students; they too become
believers in its importance” (p.47).
Fasko (2000-2001) suggested students would be more motivated if they choose
their own tasks, making the task meaningful for the learner. This is similar to Newcomb
et al.’s (1993) first principle of teaching and learning which suggested “subject matter to
be learned possesses meaning…” (p. 26). In addition, Fasko suggested educators “devote
more time to problem-finding skills to communicate to student that this ability is as
important as problem solving” (p. 318). Similarly, Newcomb et al. suggested students
should inquire into learning. “To maximize learning, students should inquire into rather
51
that be instructed in the subject matter. Problem-oriented approaches to teaching improve
learning” (Newcomb et al., p. 37).
Student interest can be “created or strengthened by developing suspense, using the
novel or unexpected and using humor” (Newcomb et al., 1993, p. 31). Could this
teaching practice be directly related to the originality construct identified as a key
component of creativity? What does creative teaching look like? Anderson (2002)
cautioned creative teaching does not mean a teacher may do anything they please. In fact,
creative classroom teaching requires an understanding of successful practices and a
historical understanding of the disciple. “Teachers can be more genuinely creative when
they are familiar with both traditional pedagogical practices and the skills, methods, and
histories of their disciplines” (Anderson, p. 37). Anderson further cautioned that creative
teachers must assume a heavy responsibility and know when their approaches are failing
as well as when they are succeeding.
Effective teaching has also been linked to student creativity. Chambers (1973)
studied individuals who had completed doctoral programs and given evidence of highly
creative research. After being nominated as creative scholars, participants assessed their
former teachers who both facilitated and hindered their creative development. Chambers
found teachers who facilitated the creative development of students were more likely to
encourage students to contribute to the topics covered in the class, welcomed different or
unorthodox views in the classroom, and rewarded student creativity.
In addition, instructors sited by participants as fostering creative development
were usually well prepared for class, did not rely on assigned texts for lecture content,
and were considered more available to students outside of the classroom (Chambers,
52
1973). Students also suggested these instructors “strongly encouraged student
participation in class discussions” (Chambers, p. 330), seemed primarily concerned that
general principles were understood, and “appeared to be greatly concerned with
stimulating students to want to learn more on their own and they encouraged students to
do independent study” (Chambers, p. 330). Perhaps as a result, students appeared to
regard creativity facilitating instructors as outstanding scholars who possessed prominent
national research reputations. Finally, facilitating teachers were considered to be highly
enthusiastic about their subject as well as about learning and “demonstrated their own
originality and creativity” (Chambers, p. 330).
Perhaps Anderson (2002) summarized the need for effective and creative teachers
the best when he stated “as a culture we need to develop a genuine respect for the art of
teaching and to develop a demand for the kinds of creative teaching we have enjoyed”
(p. 47).
Summary
While creativity has been a difficult construct to define, it has been the topic of
considerable research. The challenge of defining creativity results in difficulty assessing
creativity. However, creativity has been viewed through a wide range of theoretical
frameworks. Researchers from many theoretical backgrounds have supported the
application of creativity in education. Student motivation, student achievement and
students’ creative products have been explored. It appears the creativity tests created by
Torrance are still a standard within educational creativity research. In addition, multiple
methods of evaluating creativity may be the best approach to evaluating creativity.
Creativity may be evaluated through the teaching and learning process. Creative teaching
53
is often considered a component of effective teaching. Effective teaching may be viewed
through the characteristics described by Rosenshine and Furst (1971). In addition, student
evaluations of effective teaching have been the focus of educational research. Some
researchers suggest student evaluations may provide the most accurate measure of
teacher effectiveness (Young & Shaw, 1999).
54
CHAPTER III
METHODOLOGY
This chapter is a presentation of the methodology used to collect and analyze data.
Specifically, the research design, population and sampling are addressed. In addition,
instrumentation, including validity and reliability, are discussed. Finally, a summary of
the data analysis for each research question is presented.
Purpose of the Study
The purpose of this study was to explain and predict creative and effective
teaching of university instructors. Specifically, student evaluations, self-reported teaching
evaluations, and standardized creativity instruments were used to assess instructor
creativity. In addition, the students’ perceptions of their instructor’s creativity in teaching
were compared with instructor’s self-reported creativity in teaching. The creativity of
instructors, as assessed by a standardized creativity instrument, was also compared to the
perceptions of effective teaching held by their students and the self-reported instructor
evaluations.
Research Questions and Hypotheses
The following research questions and hypotheses guide this study and identify creativity
specifically in the context of instruction and teaching:
1. What are the demographic characteristics of College of Agriculture, Food and
Natural Resources (CAFNR) undergraduate instructors, including sex, years
of teaching experience, age, and teaching discipline?
2. What is the self-perceived level of creative teaching effectiveness of CAFNR
instructors?
55
3. What is the level of creativity (fluency, originality, elaboration and flexibility)
as measured by the ATTA, of CAFNR instructors?
4. What is the level of creative behaviors exhibited by CAFNR instructors, as
perceived by their students?
5. What is the level of teaching effectiveness of CAFNR instructors, as
perceived by their students?
6. What is the relationship between creative behaviors of CAFNR instructors, as
perceived by students, and effective teaching behaviors, as perceived by
students, instructors’ perceived creativity, and instructors’ norm-referenced
creativity?
7. What is the relationship between CAFNR instructors teaching effectiveness,
as perceived by students, and instructors’ perceived creativity, and instructors’
norm-referenced creativity?
8. What is the amount of variance in instructors’ creativity, as measured by the
ATTA, that is accounted for by their age, sex, teaching experience, and
discipline?
9. What is the amount of variance in instructors’ self-perceived creativity
teaching behaviors that is accounted for by their age, sex, teaching experience,
and discipline?
56
Hypotheses
1. Ho: There is no difference between instructors’ discipline (natural/physical
science or social science) and their level of creativity (student perception [y1],
instructors’ perceived [y2], and norm referenced [y3]).
H0·1.2.3: xy1.2.3 = 0
H1: Differences exist between discipline (natural/physical or social science)
and their level of creativity (student perception [y1], instructors’ perceived
[y2], and norm referenced [y3]).
H1·1.2.3: xy1.2.3 0
2. Ho: There is no relationship between instructors’ teaching experience and
level of creativity (student perception [y1], instructors’ perceived [y2], and
norm referenced [y3]).
H0·1.2.3: xy1.2.3 = 0
H1: There is a relationship between instructors’ teaching experience and level
of creativity (student perception [y1], instructors’ perceived [y2], and norm
referenced [y3]).
H2·1.2.3: xy1.2.3 0
3. Ho: There is no difference between instructors’ sex and their level of
creativity (student perception [y1], instructors’ perceived [y2], and norm
referenced [y3]).
H0·1.2.3: xy1.2.3 = 0
57
H1: Differences exist between instructors’ sex and their level of creativity
(student perception [y1], instructors’ perceived [y2], and norm referenced [y3]).
H3·1.2.3: xy1.2.3 0
4. Ho: There is no difference between instructors’ effective teaching as
perceived by students and level of creativity (student perception [y1],
instructors’ perceived [y2], and norm referenced [y3]).
H0·1.2.3: xy1.2.3 = 0
H1: Differences exist between instructors’ effective teaching as perceived by
students and level of creativity (student perception [y1], instructors’ perceived
[y2], and norm referenced [y3]).
H4·1.2.3: xy1.2.3 0
Research Design
This study was descriptive-correlational in nature. “Correlational research seeks
to examine the strength and direction of relationships among two or more variable” (Ary,
Jacobs, &Razavieh, 2002, p. 25) and are widely used in educational research. “The
degree of relationship is expressed as a correlation coefficient” (Gay &Airasian, 2000).
Ary et al. suggested “information gained from such correlational studies is especially
useful when trying to understand a complex construct or to build a theory about some
behavioral phenomenon” (p. 25). Variables used for this type of research must be chosen
after a careful review of the literature and based upon theory, prior research or the
researcher’s personal observations (Ary et al.). Caution should also be taken to ensure the
appropriate indicators of constructs are explored and that instruments have appropriate
validity and reliability to address the constructs (Ary et al.). Error may occur if
58
correlations are considered causation (Ary et al.). Although a correlation is necessary for
causation, correlations cannot be considered causation (Ary et al.). Additional limitations
occur through interpretation. Interpretation must include sample size, magnitude of the
correlation coefficient, and both the statistical significance as well as the practical
significance (Ary et al.).
Population and Sampling
Population
Two populations were identified for this non-experimental study. Two
populations were needed to represent both instructors and students as specified in the
research questions.
Instructors
The specific criteria for the instructor population included instructors teaching all
sections of CAFNR undergraduate courses, excluding seminar, research and special
problems courses, during the 2007 fall semester (N= 44). Instructors teaching multiple
courses or multiple sections of the same course were randomly selected to represent one
section of each specific course. For the population of instructors, selection error, or the
error resulting from selection of participants, was addressed by confirming participants
who met the desired criteria through the CAFNR administration. The list of CAFNR
instructors generated by the researcher through the student course selection (myZou) was
cross referenced with the list generated by CAFNR administration to further prevent
selection error. Instructors who were identified as the subjects for the initial segment of
the study were also used to establish the frame for the student population.
59
Students
The population for the student component of the study included all students
enrolled in CAFNR courses being taught by CAFNR instructors who had previously been
identified as the population for the instructor component of this study. Specifically, all
students enrolled in undergraduate courses taught by CAFNR instructors during the fall,
2007 semester at the University of Missouri, excluding seminar, topics or problems
courses, were selected as the student population. Selection error was addressed by
securing students enrolled in CAFNR courses through the official University of Missouri
registration system (myZou) to prevent selection error.
External validity
Ary et al. (2002) suggested external validity “refers to the generalizability or
representativeness of the findings” (p. 296). Threats to external validity, including frame
error, were addressed. Dillman (2007) suggested that challenges can be faced when
developing a frame using electronic mail because certain individuals may not have an
internet address or an individual may have many e-mail accounts. In addition, Dillman
suggested e-mail addresses have not been developed in a standardized way, making the
potential for greater frame error to occur. To address these concerns, the frame for both
populations included electronic mail accounts assigned by MU for students and faculty
members. In addition, to ensure participants chosen for this study included all CAFNR
faculty who met the criteria for subject selection, the frame was selected from a list of all
faculty and instructors provided by the CAFNR dean’s office. This list was considered
reliable for the purpose of constructing a potential frame for the study because the dean’s
office had the most accurate and current list of faculty.
60
The use of a cluster sampling for this study also limited the possibility of selection
error. All students in the courses taught by participating instructors were accessed
through MU’s registration system, known asmyZou. This system was considered to be
both accurate and reliable to develop the frame for the student population, thus reducing
the potential of frame error.
Sampling
Instructors
A time and place sample was conducted for instructors teaching undergraduate
CAFNR courses during the Fall 2007 semester. The use of a time and place sample, as
suggested by Oliver and Hinkle (1982), was justified as the instructor population could be
considered representative of future populations in CAFNR at the University of Missouri.
The time and place sample resulted in 44 instructors who met the criteria. Because all
members of the population were included in the study, sampling procedures were not
imposed. As a result, the treat of sampling error was not a consideration in this study.
Students
Probabilistic sampling was used for the student population. Because students were
considered an intact group, cluster sampling was considered appropriate for this
population. “Individuals constitute a cluster insofar as they are alike with respect to
characteristics relevant to the variables of the study” (Ary et al., 2002, p. 168). As
suggested by Ary et al., all members of each cluster were included in the sample.
Attempting to equate members within each cluster, courses were selected where the
cluster represented a minimum of twenty-five students. Because many CAFNR students
had multiple CAFNR instructors, there was a need to eliminate duplicate representation.
61
Therefore, students were arranged by cluster and assigned to a specific cluster. Students
with multiple classes were placed into clusters based upon class size. An effort was made
to assign students with multiple classes to the cluster with the lowest student enrollment.
This was done to preserve as many clusters as possible. Students were only allowed to be
a member of one cluster and could only complete the questionnaire on one CAFNR
instructor. After duplicate classes and students were removed, a minimum number of 15
students were then required for the cluster to be included in the student population of this
study. This procedure resulted in 44 qualifying classes. To ensure the accepting sample
approximated members of each cluster, a response rate of fifty percent or a minimum
number of 30 was required for each cluster to be included in the population. Cluster
sampling was utilized for the student population. All students identified as in-tact groups
of CAFNR instructors were included in the sample. As a result, the threat of sampling
error was eliminated in this study.
Instrumentation
Two separate data collection instruments were used to assess the creativity of
instructors in the CAFNR at the MU. The Abbreviated Torrance Test for Adults was used
as an established, standardized measure of creativity. Due to copyright restrictions, a
copy of the Abbreviated Torrance Test for Adults is not contained in the appendices. A
researcher developed questionnaire (Appendix A) was used to assess the teaching
effectiveness and creative teaching of instructors, as perceived by students. A researcher
developed questionnaire (Appendix B) was used to assess instructors’ self-perceived
creative teaching behaviors. Finally, demographic data was collected directly from the
instructor population.
62
Abbreviated Torrance Test for Adults (ATTA)
The ATTA is comprised of “four norm-referenced abilities and fifteen criterion-
referenced creativity indicators” (Goff & Torrance, 2002, p. 1). The norm-referenced
areas included fluency, originality, elaboration, and flexibility. The criterion-referenced
creativity indicators included the following (Goff & Torrance, p. 2): verbal responses,
which included richness and colorfulness of imagery, emotions and feelings, future
orientation and humor, conceptual incongruity and provocative questions; and figural
responses, which included openness and resistance to premature closure, unusual
visualization and different perspectives, movement and/or sound, richness and/or
colorfulness of imagery, abstractness of titles, context or the environment for object and
articulateness in telling story, combination and synthesis of two or more figures, internal
visual perspective, expressions of feelings and emotions, and fantasy.
Raw scores from the four norm-referenced measures were converted to
normalized scaled score, allowing the “assessment of the four measures on a comparable
score scale” (Scholastic, p. 2). The resulting scaled score is a 9-point scale, ranging from
11 through 19. Table 1(Goff & Torrance, 2002) shows the percentage of adults who are
identified by each score.
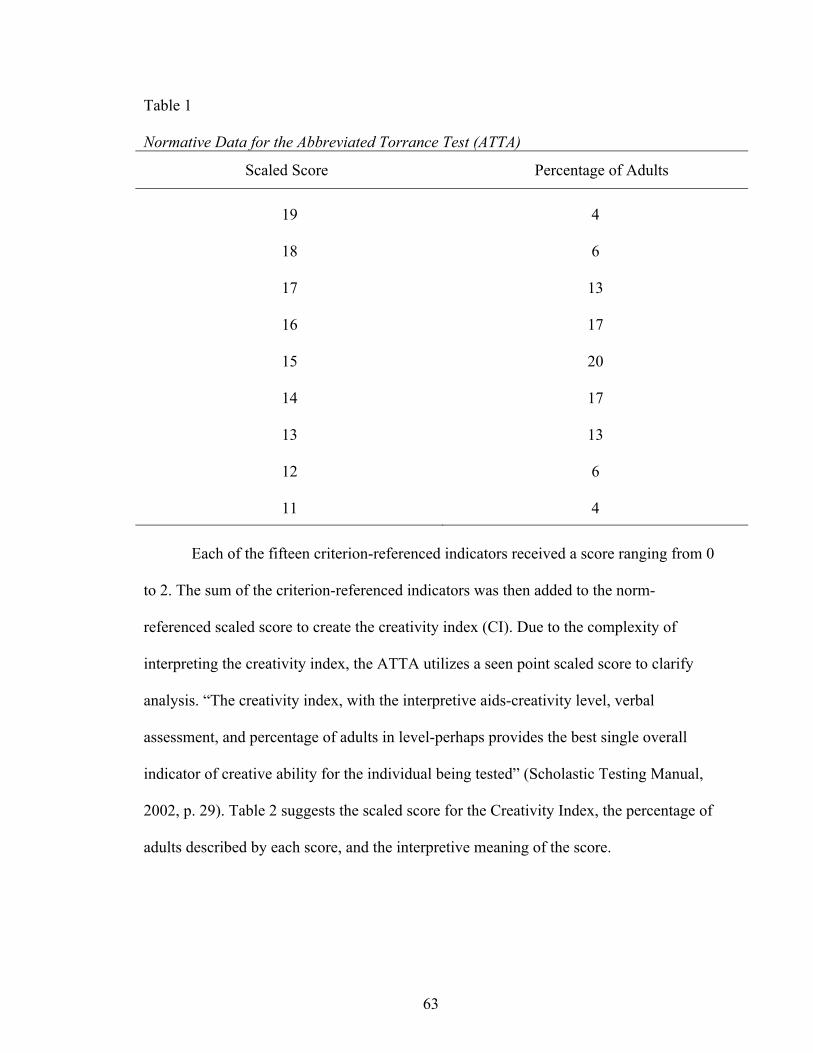
63
Table 1 Normative Data for the Abbreviated Torrance Test (ATTA)
Scaled Score
Percentage of Adults
19 4
18 6
17 13
16 17
15 20
14 17
13 13
12 6
11 4
Each of the fifteen criterion-referenced indicators received a score ranging from 0
to 2. The sum of the criterion-referenced indicators was then added to the norm-
referenced scaled score to create the creativity index (CI). Due to the complexity of
interpreting the creativity index, the ATTA utilizes a seen point scaled score to clarify
analysis. “The creativity index, with the interpretive aids-creativity level, verbal
assessment, and percentage of adults in level-perhaps provides the best single overall
indicator of creative ability for the individual being tested” (Scholastic Testing Manual,
2002, p. 29). Table 2 suggests the scaled score for the Creativity Index, the percentage of
adults described by each score, and the interpretive meaning of the score.
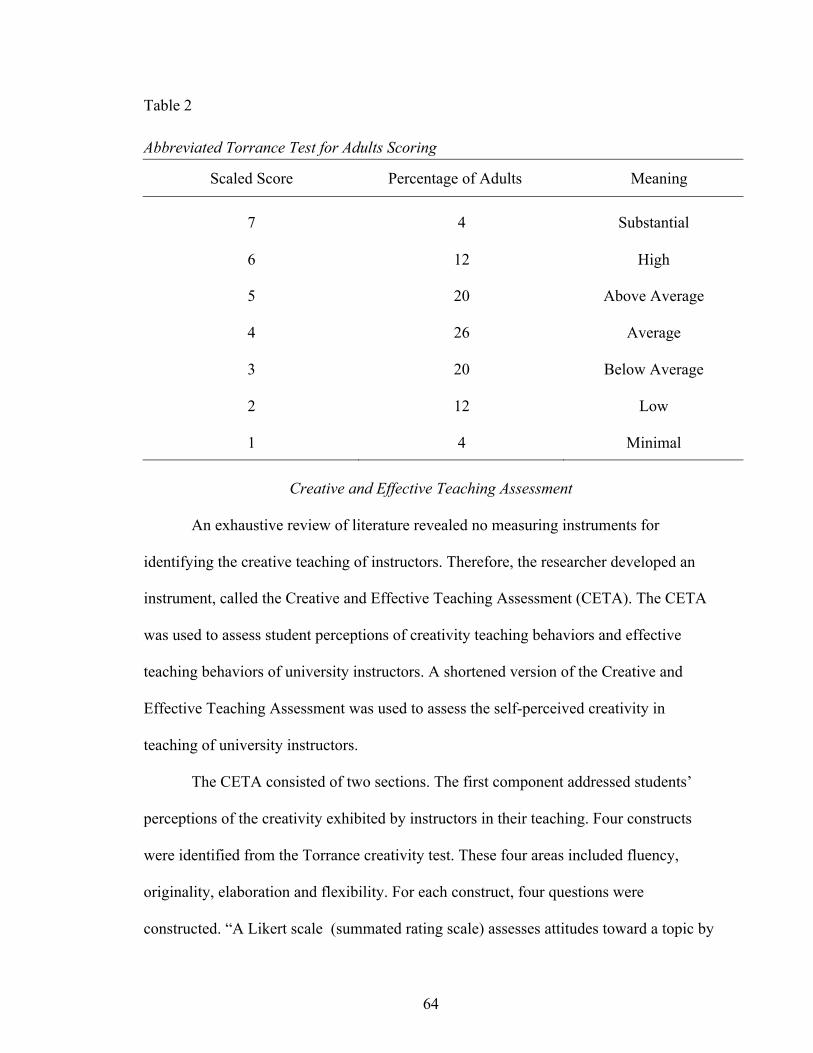
64
Table 2
Abbreviated Torrance Test for Adults Scoring
Scaled Score Percentage of Adults
Meaning
7 4 Substantial
6 12 High
5 20 Above Average
4 26 Average
3 20 Below Average
2 12 Low
1 4 Minimal
Creative and Effective Teaching Assessment
An exhaustive review of literature revealed no measuring instruments for
identifying the creative teaching of instructors. Therefore, the researcher developed an
instrument, called the Creative and Effective Teaching Assessment (CETA). The CETA
was used to assess student perceptions of creativity teaching behaviors and effective
teaching behaviors of university instructors. A shortened version of the Creative and
Effective Teaching Assessment was used to assess the self-perceived creativity in
teaching of university instructors.
The CETA consisted of two sections. The first component addressed students’
perceptions of the creativity exhibited by instructors in their teaching. Four constructs
were identified from the Torrance creativity test. These four areas included fluency,
originality, elaboration and flexibility. For each construct, four questions were
constructed. “A Likert scale (summated rating scale) assesses attitudes toward a topic by
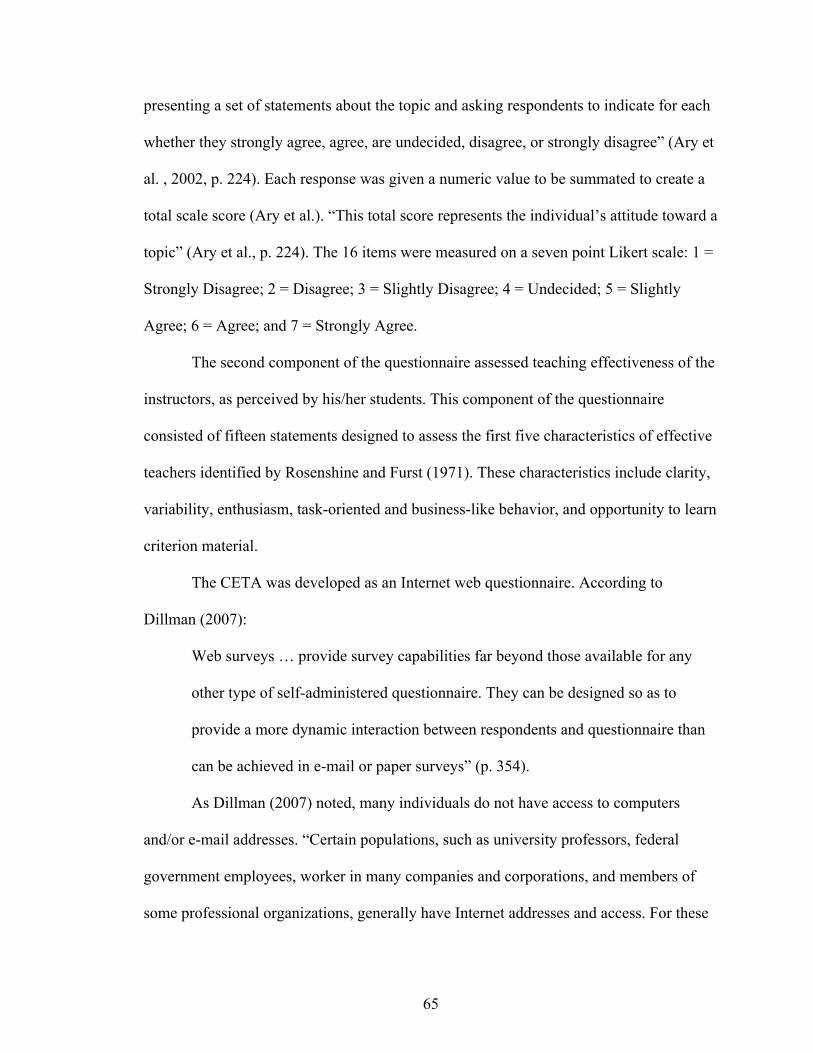
65
presenting a set of statements about the topic and asking respondents to indicate for each
whether they strongly agree, agree, are undecided, disagree, or strongly disagree” (Ary et
al. , 2002, p. 224). Each response was given a numeric value to be summated to create a
total scale score (Ary et al.). “This total score represents the individual’s attitude toward a
topic” (Ary et al., p. 224). The 16 items were measured on a seven point Likert scale: 1 =
Strongly Disagree; 2 = Disagree; 3 = Slightly Disagree; 4 = Undecided; 5 = Slightly
Agree; 6 = Agree; and 7 = Strongly Agree.
The second component of the questionnaire assessed teaching effectiveness of the
instructors, as perceived by his/her students. This component of the questionnaire
consisted of fifteen statements designed to assess the first five characteristics of effective
teachers identified by Rosenshine and Furst (1971). These characteristics include clarity,
variability, enthusiasm, task-oriented and business-like behavior, and opportunity to learn
criterion material.
The CETA was developed as an Internet web questionnaire. According to
Dillman (2007):
Web surveys … provide survey capabilities far beyond those available for any
other type of self-administered questionnaire. They can be designed so as to
provide a more dynamic interaction between respondents and questionnaire than
can be achieved in e-mail or paper surveys” (p. 354).
As Dillman (2007) noted, many individuals do not have access to computers
and/or e-mail addresses. “Certain populations, such as university professors, federal
government employees, worker in many companies and corporations, and members of
some professional organizations, generally have Internet addresses and access. For these
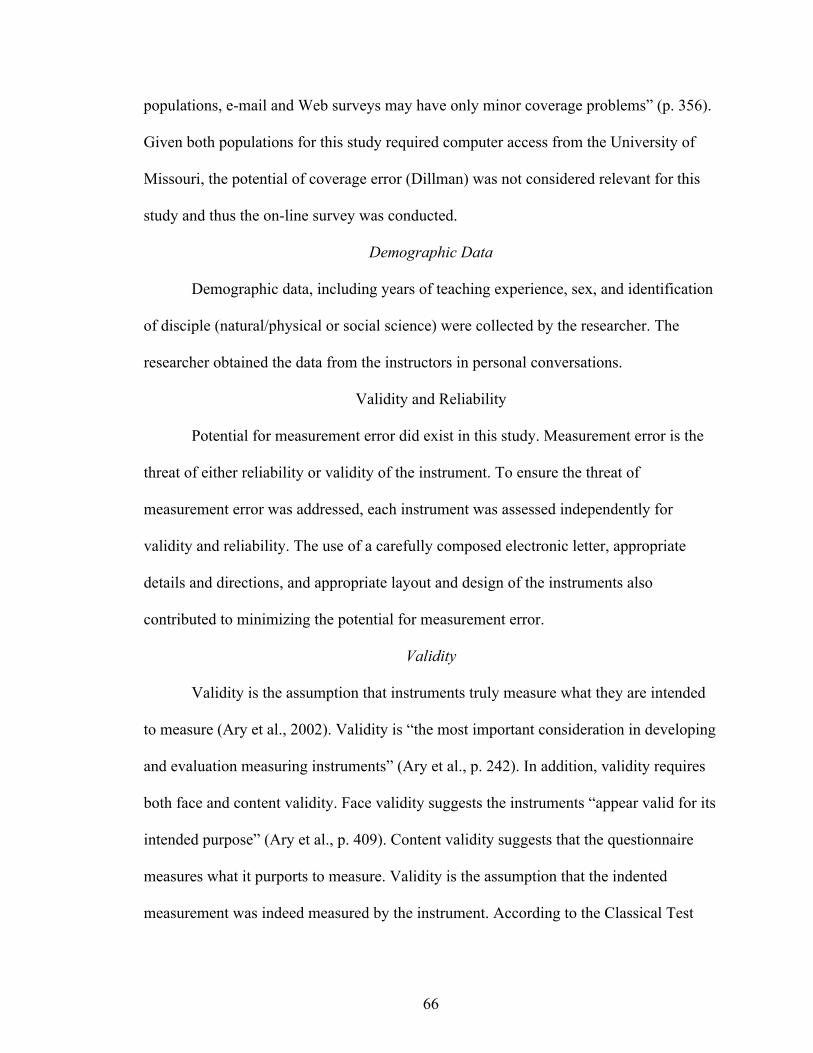
66
populations, e-mail and Web surveys may have only minor coverage problems” (p. 356).
Given both populations for this study required computer access from the University of
Missouri, the potential of coverage error (Dillman) was not considered relevant for this
study and thus the on-line survey was conducted.
Demographic Data
Demographic data, including years of teaching experience, sex, and identification
of disciple (natural/physical or social science) were collected by the researcher. The
researcher obtained the data from the instructors in personal conversations.
Validity and Reliability
Potential for measurement error did exist in this study. Measurement error is the
threat of either reliability or validity of the instrument. To ensure the threat of
measurement error was addressed, each instrument was assessed independently for
validity and reliability. The use of a carefully composed electronic letter, appropriate
details and directions, and appropriate layout and design of the instruments also
contributed to minimizing the potential for measurement error.
Validity
Validity is the assumption that instruments truly measure what they are intended
to measure (Ary et al., 2002). Validity is “the most important consideration in developing
and evaluation measuring instruments” (Ary et al., p. 242). In addition, validity requires
both face and content validity. Face validity suggests the instruments “appear valid for its
intended purpose” (Ary et al., p. 409). Content validity suggests that the questionnaire
measures what it purports to measure. Validity is the assumption that the indented
measurement was indeed measured by the instrument. According to the Classical Test
67
Theory, validity attempts to minimize the systematic, non-random error. The validity of
this study was enhanced by the use of a standardized instrument.
Abbreviated Torrance Test for Adults (ATTA)
The Torrance Tests of Creative Thinking (TTCT) “is the most widely used and
most researched creativity test” (Goff & Torrance, 2002, p. 36). The ATTA was
developed from the TTCT and both content and face validity have been established by
the Scholastic Testing Service (Goff & Torrance). Although some research suggests the
validity of the Torrance tests may be in question, (Amabile, 1996; Cropley, 1997, 2001;
Runco, 2005), longitudinal studies suggest validity isnot a concern (Cropley, 1997, 2001;
Torrance, 1995).
Creative and effective teaching assessment
Validity for the CETA was established by a panel of experts (Appendix C) to
refine and validate the instrument. The panel of experts was composed of four individuals
including two content experts and two instrumentation experts. The panel was asked to
review the online questionnaire for both content and construct validity. Specifically, the
panel of experts reviewed the 16 statements on the questionnaire which addressed the
four constructs identified by Torrance as measurements of creativity and assess the
statements for clarity. In addition, the panel viewed the second part of the questionnaire
to ensure the clarity of the effective teaching characteristics. Finally, the panel reviewed
the on-line questionnaire for face validity. Each item on the instrument was reviewed for
validity and suggestions for grammatical changes from the panel were incorporated into
the questionnaire.
68
Reliability
Reliability was also established for the instruments used in this study. Reliability
is “concerned with the extent to which the measure would yield consistent results each
time it is used” (Ary et al., 2002, p. 227). “Test reliability relates to the consistency with
which a test actually measures what it is assessing” (Scholastic Testing Manual, 2002, p.
33). Reliability suggests an instrument offers consistent measurement (Ary et al., 2002)
“Test reliability relates to the consistency with which a test actually measures what it is
assessing” (Scholastic Testing Manual, p. 33). Error can be either random or systematic
(non-random). Random error consists of any factors that randomly affect the
measurement of the variable. This type of error results from pure chance and cannot be
controlled (Ary et al., 2002). Conversely, non-random error occurs through factors that
systematically affect measurement of the variable. Non-random error refers to irrelevant
variance that can be controlled (Ary et al.). In accordance with recommendations of
Salant and Dillman (1994), reliably was not determined for demographic characteristics
because demographic characteristics produce little measurement error.
Abbreviated Torrance Test for Adults (ATTA)
The ATTA was used as a standardized instrument to measure creativity. The
ATTA instrument is considered more reliable when used to determine individual
differences in creativity (Amabile, 1996). Ary et al. (2002) suggested the need to
establish intra-rater reliability when ratings are made by an individual researcher. In
addition, Ary et al. suggested an inter-rater reliability coefficient of .70 or higher is
considered acceptable for rating scales” (p. 232). According to the Scholastic Testing
Manual (2002), reliability for the ATTA was derived by using the Kuder-Richardson 21
69
(KR21) reliability coefficient. The KR21 reliability coefficients for the ATTA were:
“fluency = .45; originality = .38; elaboration = .84; flexibility = .38 and total creativity
indicators = .69” (Goff & Torrance, p. 35). Addressing the reliability coefficients of the
ATTA, the ATTA scoring manual (Goff & Torrance) stated: “abbreviated administration
(a short assessment) was given precedence over increased reliability of part-scores, i.e.
more time and activities generally increase reliability” (p. 34).
Creative and effective teaching assessment
To address and account for non-random error, reliability was estimated by
conducting a pilot test of the CETA instrument. Gall, Gall, and Borg (2003) suggested
the following:
The pilot test should include a sample of individuals from the populations from
which you plan to draw your respondents. Also, the pilot-test form of the
questionnaire should provide space for respondents to make criticisms and
recommendations for improving the questionnaire (p. 230).
Therefore, in accordance with recommendations from Gall et al. (2003), the
questionnaire was administered to a sample of 47 students at MU who had similar
characteristics as the population, but not selected to participate in the study. In addition,
the pilot test version of instrument included a question designed to solicit feedback about
the instrument. The instructor pilot was conducted by university faculty from colleges of
agriculture across the nation. This population was selected because it closely resembled
the population of CAFNR instructors.
Cronbach’s alpha was computed to determine the internal reliability of the
instrument for both the instructor and student pilot tests. Cronbach’s alpha was selected
70
for the reliability estimate, as the CETA consisted of summated scale (Ary et al., 2002).
Sample size differed for the two groups due to missing data, resulting in a minimum of
36 student responses and a minimal of 28 instructor responses for the respected pilot
tests. The student pilot test resulted in a Cronbach’s alpha level of .97 (n = 37) for the
entire instrument. The internal reliability for the instructor effectiveness construct
measure by the student pilot was .92 (n = 38). The student pilot for the four creativity
constructs resulted in a Cronbach’s alpha of .96 (n = 38). Each of the four creativity
constructs was evaluated for reliability (see Table 3). The Cronbach’s alpha for fluency
( = .81; n =39), flexibility ( = .87; n = 40), originality ( = .89; n =38), and elaboration
( = .89; n = 40) were each deemed acceptable reliability levels. For the instructor pilot
test, the Cronbach’s alpha for the four creative constructs was .84 (n = 28), which
suggested the instrument offered internal consistency in measuring the intended
variables. Each individual construct was also examined (see Table 3). The reliability
coefficient for the instructor pilot included fluency ( = .46; n = 30), flexibility ( = .74;
n = 28), originality ( = .77; n = 29), and elaboration ( = .68; n = 29). Ary et al.
suggested an inter-rater reliability coefficient of .70 or higher is considered acceptable for
rating scales” (p. 232). However, Nunnally (1962) suggested reliability estimates of .50-
.60 may be high enough in the early stages of research.
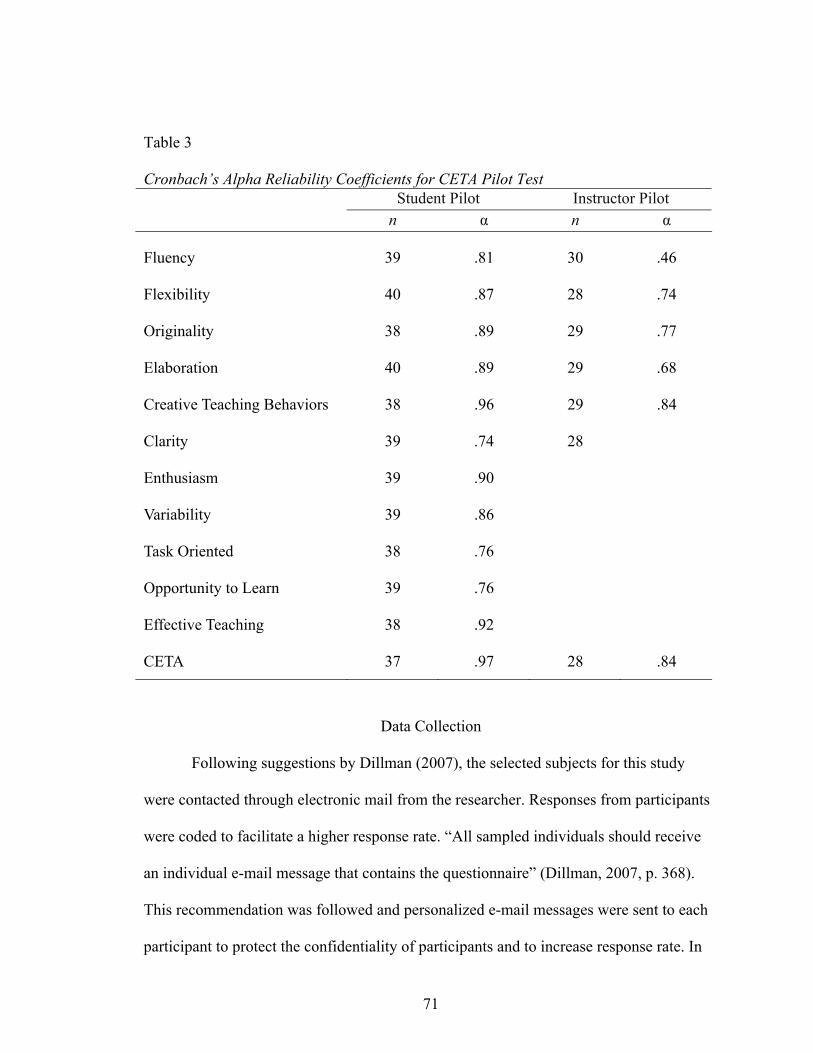
71
Table 3 Cronbach’s Alpha Reliability Coefficients for CETA Pilot Test
Student Pilot Instructor Pilot
n n
Fluency 39 .81 30 .46
Flexibility 40 .87 28 .74
Originality 38 .89 29 .77
Elaboration 40 .89 29 .68
Creative Teaching Behaviors 38 .96 29 .84
Clarity 39 .74 28
Enthusiasm 39 .90
Variability 39 .86
Task Oriented 38 .76
Opportunity to Learn 39 .76
Effective Teaching 38 .92
CETA 37 .97 28 .84
Data Collection
Following suggestions by Dillman (2007), the selected subjects for this study
were contacted through electronic mail from the researcher. Responses from participants
were coded to facilitate a higher response rate. “All sampled individuals should receive
an individual e-mail message that contains the questionnaire” (Dillman, 2007, p. 368).
This recommendation was followed and personalized e-mail messages were sent to each
participant to protect the confidentiality of participants and to increase response rate. In
72
addition, six $25 gift certificates were used to encourage participation. Dillman (2007)
suggested the time between contacts should be “shorted from one week to two or three
days in order to increase the likelihood that the recipient will connect the memory of the
first contact with the second” (p. 368).
Population of Instructors
The initial contact with population of instructors was through electronic mail. The
first correspondence and invitation to participate in the study was sent on January 8,
2008. A total of 44 instructors were identified in the population. One instructor left for
sabbatical and was unable to participate in the study. Of the remaining 43 instructors, 22
responded to the first correspondence. A follow-up invitation, as well as the invitation to
participate in the standardized instrument component of the study, was sent on January
14, 2008. A third and final follow-up electronic mailing was sent on January 18, 2008.
The instructors were invited to attend one of five meetings to complete the ATTA
assessment. Refreshments and a drawing for CAFNR apparel were given to increase
attendance. Personal follow-up was made with instructors who did not attend the
scheduled assessment times. Through these procedures, data were collected from 40
instructors, yielding a response rate of 91%.
Population of Students
The population of students was first contacted through electronic mail on
December 18, 2007 with a request to participate in the study. The electronic letter was
personalized to increase response rate and included a direct link to the questionnaire. In
addition, the course instructor was listed and the students were assigned a personal code
number, which was also indicated in the contact letter. Students were asked to access the
73
direct link to the questionnaire, enter their code and complete the instrument based upon
the instructor indicated in the electronic contact letter. A total of 1674 students were
contacted and 350 responded after the first request. A second request to participate in the
study was sent to the students on December 21, 2007. A total of 252 students responded
following the second contact. A third request for participants was sent on January 2,
2008. A total of 268 students responded to the third contact. Finally, participants from
clusters which had less than 30 or less than 50% response rate were identified and a forth
contact was made. Total students responses (n = 921) yielded 40 student clusters. A final
response rate of 55% was recorded. However, 15 student electronic mail boxes were full
and failed to receive the invitations to participate. The adjusted response rate was 73.8%.
Data were collected through the use of an on-line survey instrument given to
students at the conclusion of the fall, 2007 semester. Students were invited to participate
in the study through an electronic letter. Gall et al. (2003) suggested “the major problem
with anonymous questionnaires is that follow-ups to improve the return rate are
impossible” (p. 227). One solution is to incorporate a code for each student and check off
each participant after they respond (Gall et al.). For this reason, participants within each
cluster were coded to match the instructor evaluated by the student and to allow follow-
up to reduce non-response error. Clusters for each class were used to generate a
summative evaluation for each instructor. Specifically, the four construct areas of
creativity measured by the first part of the questionnaire were summated and a creativity
score for each instructor was created. In addition, the second portion of the questionnaire
was summated to indicate the total effectiveness of instructors, as perceived by their
students.
74
The instructors also completed the ATTA, which was administered following the
directions included in the test manual of the standardized instrument. The test consisted
of three timed activities. As directed by the administration manual, the participants were
given three minutes to complete each component of the ATTA. The instruments were
coded for later use. Scoring of the ATTA followed procedures outlined in the ATTA test
manual. The researcher had prior experience in scoring the ATTA (Aschenbrener et al.,
2006). In addition, intra-rater reliability was addressed by having only one person score
the ATTA. Each of the three activities was assessed for fluency, originality, elaboration
and flexibility.
Data Analysis
Data from the instructors were analyzed using Statistical Package for the Social
Sciences (SPSS) for Windows. Correlations were conducted between instructor
creativity, as measured by the ATTA. In addition, these scores were correlated with data
from the student population.
According to Ary et al. (2002), “Pearson coefficient is appropriate for use when
the variables to be correlated are normally distributed and measure on an interval or
ration scale” (p. 358). Correlations were calculated between and among the four
constructs identified in the first part of the questionnaire. Correlations were also
calculated between the summated creativity score of the instructors and the student’s
perceive instructor teaching effectiveness. Finally, the perceived effectiveness of the
instructors and the perceived creativity of instructors were correlated with the ATTA.
75
Abbreviated Torrance Test for Adults (ATTA)
The summated scores for each of the creativity constructs comprising the ATTA
were recorded and converted to a scaled score, as directed by the ATTA manual. The
ATTA scoring guide facilitated collecting the verbal responses, figural responses, and
norm-referenced measures. Finally, a Creativity Index for each participant was calculated
after summating the scores on the ATTA instrument. This allowed a norm-referenced
assessment of instructor’s creativity to be established.
CETA
Miller (1998) suggested “the most common analysis is conducted with the
Pearson product moment correlation coefficient (r) because it is used when both variables
are interval or ration in scale or measurement” (p. 4). However, Miller cautioned that two
assumptions must be met before Pearson’s correlation should be implemented. Data
should be analyzed to assure linearity and access homoscedasticity (Miller). The alpha
level was set a priori at .05. Davis (1971) conventions were used to evaluate the
correlations. The magnitude of the correlation (r) of 1.0 is considered perfect, .70-.99 is
considered very high, .50 - .69 is substantial, .30-.49 is moderate, .10-.29 is low and .01-
.09 is considered negligible (Davis). Data analysis for each research question was
conducted depending on the type of data and nature of the question.
Research question one sought to determine the demographic data of instructors,
including sex, years of teaching experience, age, and teaching discipline. Basic
descriptive statistics were used to summarize these data.
Research question two sought to determine the self-perceived level of creative
teaching effectiveness of instructors. Summated, interval data from the CETA were
76
described using a grand mean representative of the 16 items. Standard deviations were
used to describe the range and variance of the measure.
Research question three sought to determine the level of norm referenced creativity
(fluency, originality, elaboration and flexibility, as measured by the ATTA) of
instructors. Data were scored using the standardized assessment procedures indicated in
the ATTA manual (Goff & Torrance, 2002). Summated, interval data from the ATTA
were described using a grand mean representative of the four constructs. Standard
deviations were used to describe the range and variance of the measure.
Research question four sought to determine the level of creative behaviors
exhibited by instructors, as perceived by their students. Summated, interval data from the
CETA were described using a grand mean representative of the 16 items. Standard
deviations were used to describe the range and variance of the measure
Research question five sought to determine the level of effectiveness of instructors,
as perceived by their students. Summated, interval data from the CETA were described
using a grand mean representative of the 16 items. Standard deviations were used to
describe the range and variance of the measure.
Research question six sought to determine the relationship between creative
teaching behaviors of instructors, as perceived by students, and effective teaching
behaviors, as perceive by students, instructors’ perceived creativity, and instructors’
norm-referenced creativity. Because all data were considered interval in nature, Pearson
product moment correlations were used to analyze these data.
Research question seven sought to determine the relationship between instructor
effectiveness, as perceived by students, and instructors’ perceived creativity, and
77
instructors’ norm-referenced creativity assessments. The data, being interval in nature,
were analyzed using Pearson’s correlation.
Research questions eight sought to determine the amount of variance in norm
referenced creativity, as measured by the ATTA, accounted for by age, sex, experience,
and discipline. A simple linear regression model was calculated to determine the amount
of variance in the dependent variable, norm referenced creativity, which could be
accounted for by the independent variables of age, sex, experience, and discipline.
Research questions nine sought to determine the amount of variance in self-
perceived creative teaching behaviors, as measured by the CETA, accounted for by age,
sex, experience, and discipline. A simple linear regression model was calculated to
determine the amount of variance in the dependent variable, self-perceived creative
teaching behaviors, which could be accounted for by the independent variables of age,
sex, experience, and discipline.
The null hypothesis for the first hypothesis was there was no difference between
discipline in which the instructor taught, classified as either natural/biological science or
social science, and level of creativity as measured by student perceptions, instructor’s
perceptions, and a norm referenced assessment. The researcher created a forced
dichotomy by evaluating the content of the class to make the determination between
natural/biological and social science. Because this hypothesis compared nominal data
with interval data, a point biserial coefficient was calculated, in accordance with
recommendations by Miller (1998).
The null hypothesis for hypothesis two was that no differences existed between
experience and level of creativity (student perception, instructor’s perceived, and norm
78
referenced). Instructor experience, which was nominal data, was and forced into a
dichotomy containing experienced (five years of teaching or greater) and novice (less
than five years of teaching). Five years of teaching experience was chosen to distinguish
between novice and veteran teaching experience because that is the experience level at
which CAFNR classifies faculty for its annual teaching awards. CAFNR classifies novice
instructors as those with five years or less of experience. Therefore, this study followed
CAFNR’s distinction between novice and veteran instructors and forced teaching
experience into a dichotomous variable to examine hypotheses two. Levene’s Test for
equality of variances was conducted. Then, independent samples t-test was conducted to
determine if there was a significant difference between experience and creativity (as
measured by student perceptions of instructor’s level of creativity, instructor’s self-
perceived level of creativity and instructor’s norm referenced level of creativity).
Null hypothesis three stated that no differences existed between sex and level of
creativity as measured by student perceptions, instructor’s perceptions, and norm
referenced assessment. Levene’s test for equality of variances was conducted to assure
equal variances could be assumed. Finally, independent t-tests were conducted to
determine if differences existed.
Null hypothesis four stated that no relationship existed between effective teaching
as perceived by students and level of creativity as measured by student perception,
instructor’s perception, and a norm referenced assessment. All summated data for this
research question were considered interval in nature. Student responses to the effective
teaching component of the CETA were forced into a dichotomy to allow differences to be
tested. Instructors identified as effective teachers (coded 0) scored 5.0 or higher on the
79
seven-point Likert scale, indicating students agreed or strongly agreed on the summated
effective teaching component of the CETA. Arguably, scores indicating students agree or
strongly agree where chosen to represent effective teaching and thus scores below five
were considered reflective of ineffective teaching, as perceived by students. After
evaluating Levene’s Test for equality of variances, independent samples t-tests were
conducted to assess differences.
80
CHAPTER FOUR
FINDINGS
This chapter presents the results of the data analyzed to accomplish the purpose of
this study and addresses the nine research questions and four hypotheses.
The purpose of this study was to explain and predict creative and effective
teaching of university instructors. Specifically, student evaluations, self-reported teaching
evaluations, and standardized creativity instruments were used to assess instructor
creativity. In addition, instructors’ creative teaching behaviors, as perceived by students
were compared with instructors’ self-reported creative teaching behaviors. The creativity
of instructors, as assessed by a standardized creativity instrument, was also compared to
the perceptions of effective teaching held by students and instructors’ self-perceived
creative teaching behaviors.
Research Questions and Hypotheses
The following research questions and hypotheses guide this study and identify creativity
specifically in the context of instruction and teaching:
1. What are the demographic characteristics of College of Agriculture, Food and
Natural Resources (CAFNR) undergraduate instructors, including sex, years
of teaching experience, age, and teaching discipline?
2. What is the self-perceived level of creative teaching effectiveness of CAFNR
instructors?
3. What is the level of creativity (fluency, originality, elaboration and flexibility)
as measured by the ATTA, of CAFNR instructors?

81
4. What is the level of creative behaviors exhibited by CAFNR instructors, as
perceived by their students?
5. What is the level of teaching effectiveness of CAFNR instructors, as
perceived by their students?
6. What is the relationship between creative behaviors of CAFNR instructors, as
perceived by students, and effective teaching behaviors, as perceived by
students, instructors’ perceived creativity, and instructors’ norm-referenced
creativity?
7. What is the relationship between CAFNR instructors teaching effectiveness,
as perceived by students, and instructors’ perceived creativity, and instructors’
norm-referenced creativity?
8. What is the amount of variance in instructors’ creativity, as measured by the
ATTA, that is accounted for by their age, sex, teaching experience, and
discipline?
9. What is the amount of variance in instructors’ self-perceived creativity
teaching behaviors that is accounted for by their age, sex, teaching experience,
and discipline?
Hypotheses
1. Ho: There is no difference between instructors’ discipline (natural/physical
science or social science) and their level of creativity (student perception [y1],
instructors’ perceived [y2], and norm referenced [y3]).
H0·1.2.3: xy1.2.3 = 0
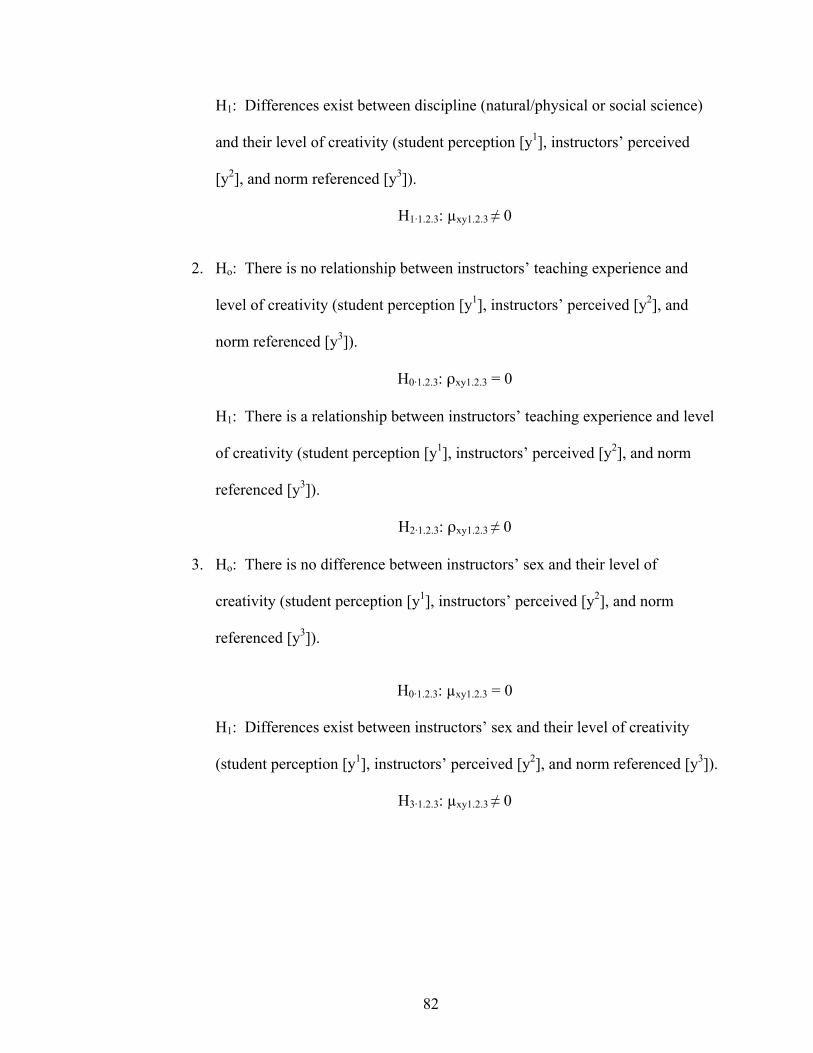
82
H1: Differences exist between discipline (natural/physical or social science)
and their level of creativity (student perception [y1], instructors’ perceived
[y2], and norm referenced [y3]).
H1·1.2.3: xy1.2.3 0
2. Ho: There is no relationship between instructors’ teaching experience and
level of creativity (student perception [y1], instructors’ perceived [y2], and
norm referenced [y3]).
H0·1.2.3: xy1.2.3 = 0
H1: There is a relationship between instructors’ teaching experience and level
of creativity (student perception [y1], instructors’ perceived [y2], and norm
referenced [y3]).
H2·1.2.3: xy1.2.3 0
3. Ho: There is no difference between instructors’ sex and their level of
creativity (student perception [y1], instructors’ perceived [y2], and norm
referenced [y3]).
H0·1.2.3: xy1.2.3 = 0
H1: Differences exist between instructors’ sex and their level of creativity
(student perception [y1], instructors’ perceived [y2], and norm referenced [y3]).
H3·1.2.3: xy1.2.3 0
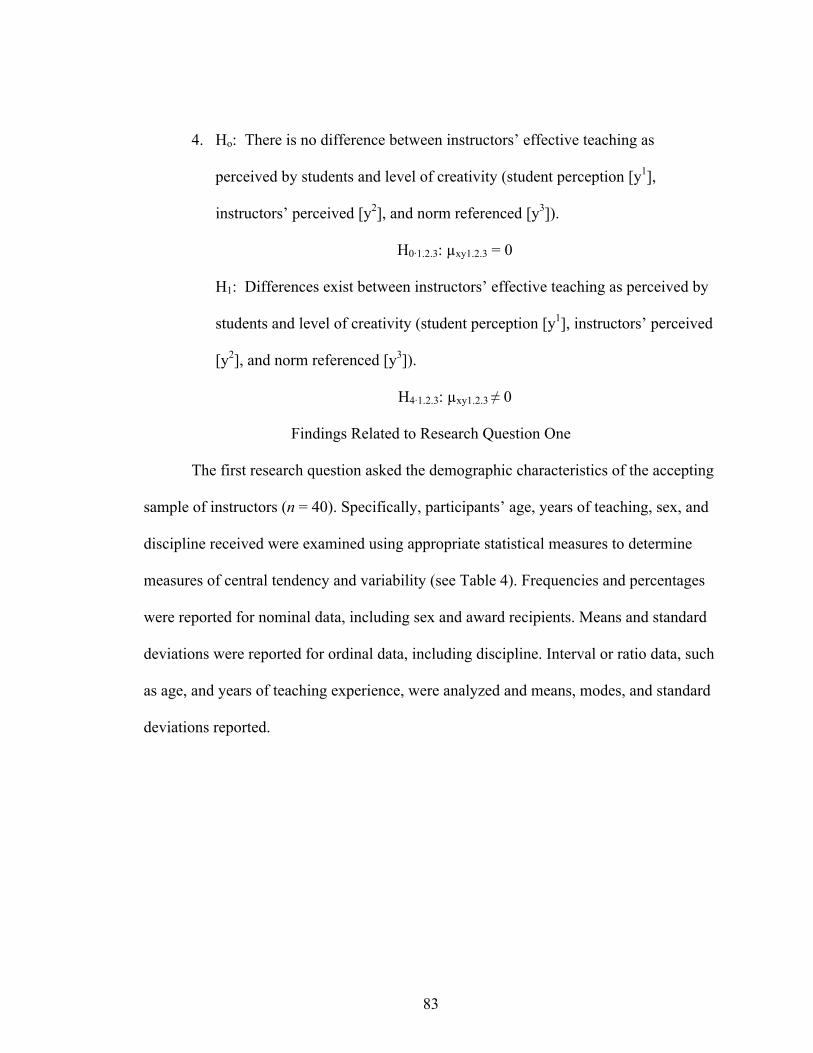
83
4. Ho: There is no difference between instructors’ effective teaching as
perceived by students and level of creativity (student perception [y1],
instructors’ perceived [y2], and norm referenced [y3]).
H0·1.2.3: xy1.2.3 = 0
H1: Differences exist between instructors’ effective teaching as perceived by
students and level of creativity (student perception [y1], instructors’ perceived
[y2], and norm referenced [y3]).
H4·1.2.3: xy1.2.3 0
Findings Related to Research Question One
The first research question asked the demographic characteristics of the accepting
sample of instructors (n = 40). Specifically, participants’ age, years of teaching, sex, and
discipline received were examined using appropriate statistical measures to determine
measures of central tendency and variability (see Table 4). Frequencies and percentages
were reported for nominal data, including sex and award recipients. Means and standard
deviations were reported for ordinal data, including discipline. Interval or ratio data, such
as age, and years of teaching experience, were analyzed and means, modes, and standard
deviations reported.
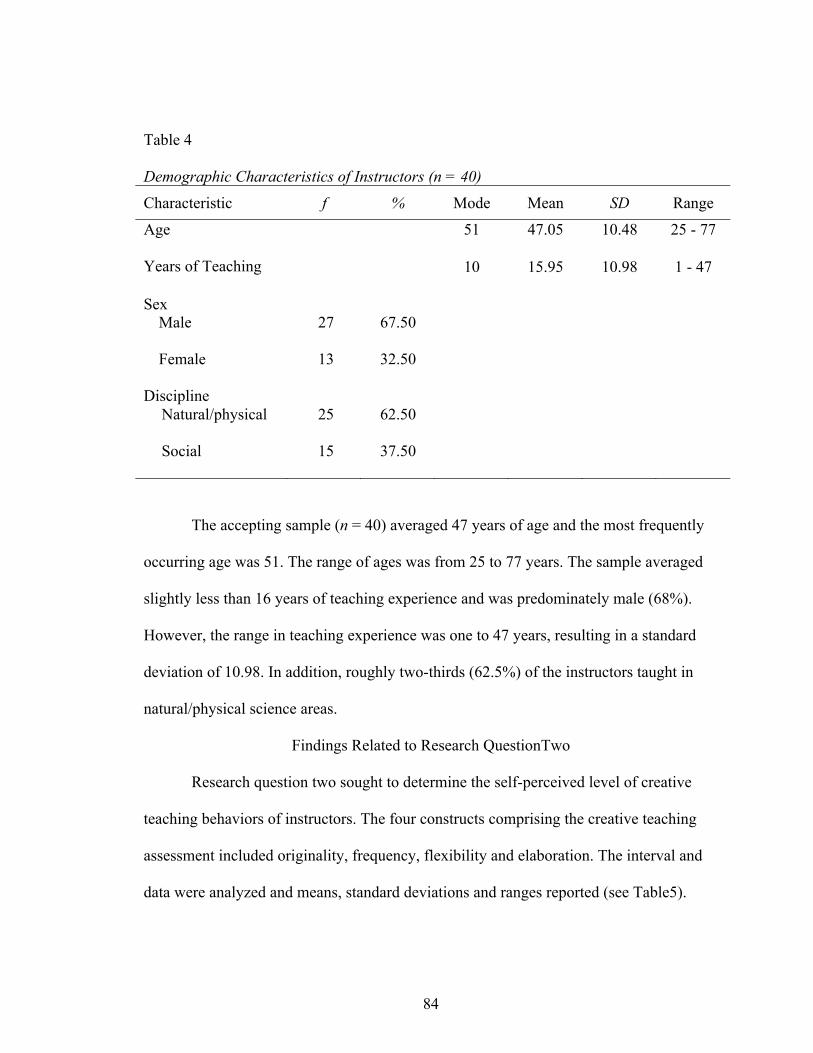
84
Table 4 Demographic Characteristics of Instructors (n = 40)
Characteristic f % Mode Mean SD Range
Age 51 47.05 10.48 25 - 77
Years of Teaching 10 15.95 10.98 1 - 47
Sex
Male 27 67.50
Female 13 32.50
Discipline Natural/physical
Social
25
15
62.50
37.50
The accepting sample (n = 40) averaged 47 years of age and the most frequently
occurring age was 51. The range of ages was from 25 to 77 years. The sample averaged
slightly less than 16 years of teaching experience and was predominately male (68%).
However, the range in teaching experience was one to 47 years, resulting in a standard
deviation of 10.98. In addition, roughly two-thirds (62.5%) of the instructors taught in
natural/physical science areas.
Findings Related to Research QuestionTwo
Research question two sought to determine the self-perceived level of creative
teaching behaviors of instructors. The four constructs comprising the creative teaching
assessment included originality, frequency, flexibility and elaboration. The interval and
data were analyzed and means, standard deviations and ranges reported (see Table5).
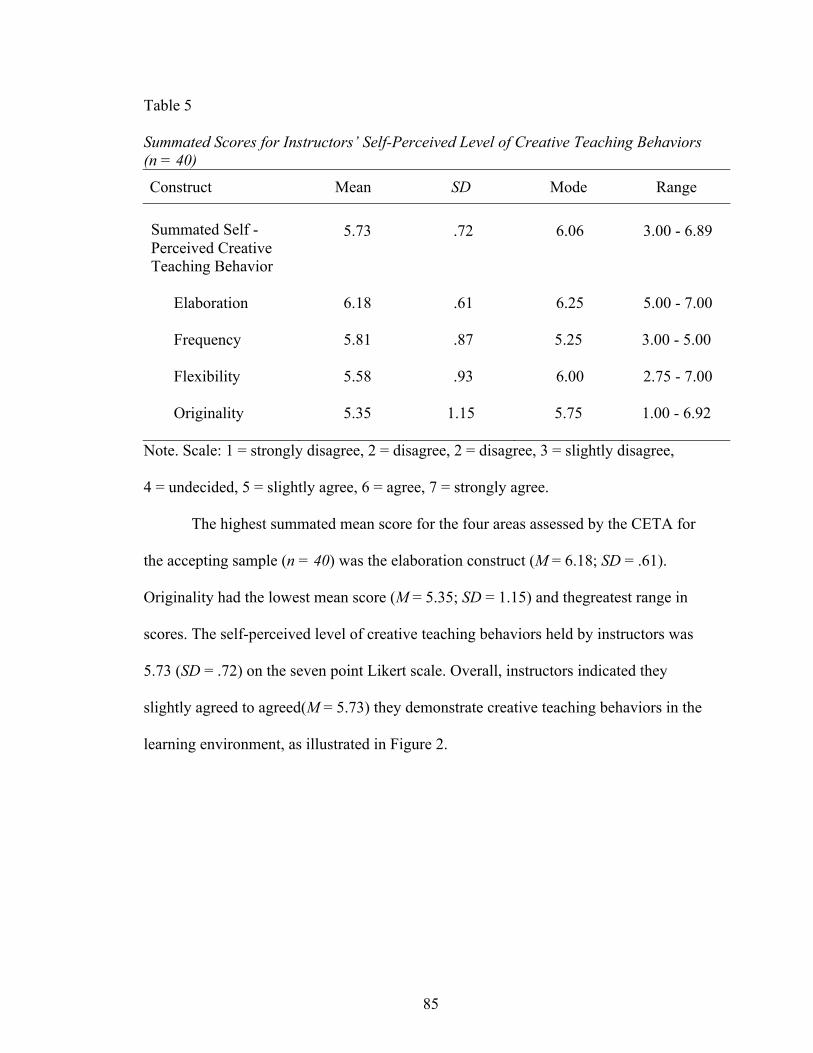
85
Table 5 Summated Scores for Instructors’ Self-Perceived Level of Creative Teaching Behaviors
(n = 40)
Construct Mean SD Mode Range
Summated Self -Perceived Creative Teaching Behavior
5.73 .72 6.06 3.00 - 6.89
Elaboration
6.18
.61
6.25
5.00 - 7.00
Frequency
5.81
.87
5.25
3.00 - 5.00
Flexibility 5.58 .93 6.00 2.75 - 7.00
Originality 5.35 1.15 5.75 1.00 - 6.92
Note. Scale: 1 = strongly disagree, 2 = disagree, 2 = disagree, 3 = slightly disagree,
4 = undecided, 5 = slightly agree, 6 = agree, 7 = strongly agree.
The highest summated mean score for the four areas assessed by the CETA for
the accepting sample (n = 40) was the elaboration construct (M = 6.18; SD = .61).
Originality had the lowest mean score (M = 5.35; SD = 1.15) and thegreatest range in
scores. The self-perceived level of creative teaching behaviors held by instructors was
5.73 (SD = .72) on the seven point Likert scale. Overall, instructors indicated they
slightly agreed to agreed(M = 5.73) they demonstrate creative teaching behaviors in the
learning environment, as illustrated in Figure 2.
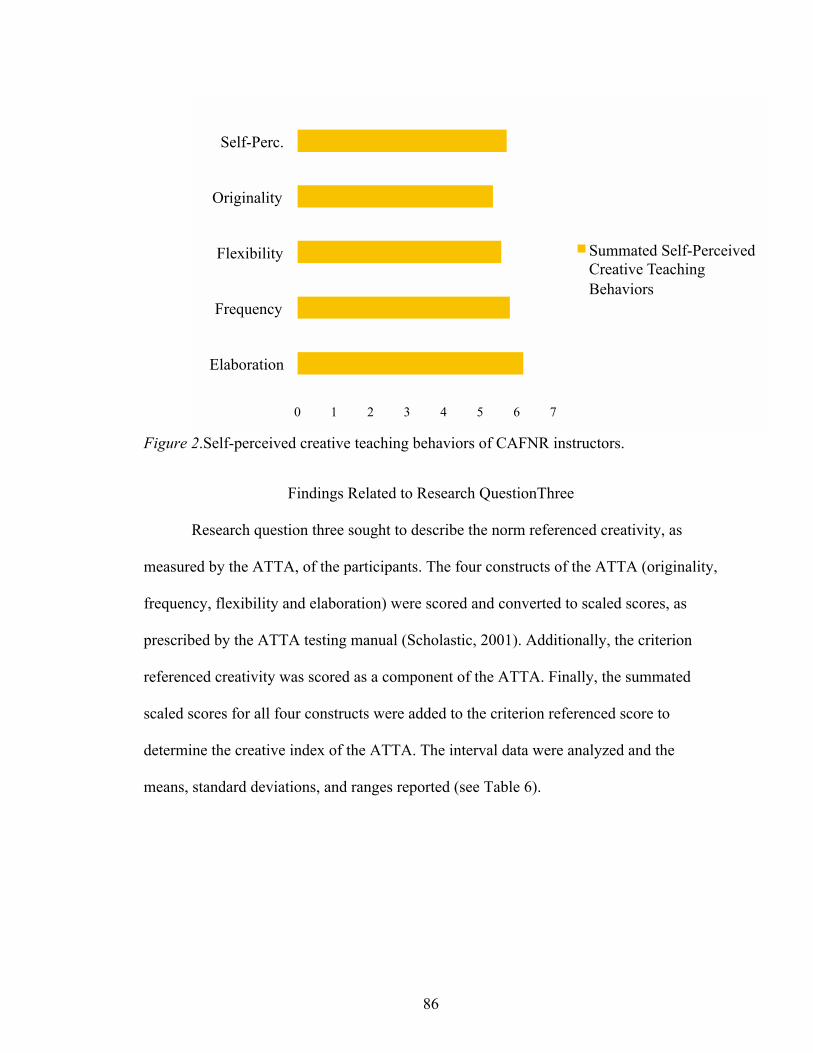
86
Figure 2.Self-perceived creative teaching behaviors of CAFNR instructors.
Findings Related to Research QuestionThree
Research question three sought to describe the norm referenced creativity, as
measured by the ATTA, of the participants. The four constructs of the ATTA (originality,
frequency, flexibility and elaboration) were scored and converted to scaled scores, as
prescribed by the ATTA testing manual (Scholastic, 2001). Additionally, the criterion
referenced creativity was scored as a component of the ATTA. Finally, the summated
scaled scores for all four constructs were added to the criterion referenced score to
determine the creative index of the ATTA. The interval data were analyzed and the
means, standard deviations, and ranges reported (see Table 6).
0 1 2 3 4 5 6 7
Elaboration
Frequency
Flexibility
Originality
Self-Perc.
Summated Self-Perceived
Creative Teaching
Behaviors
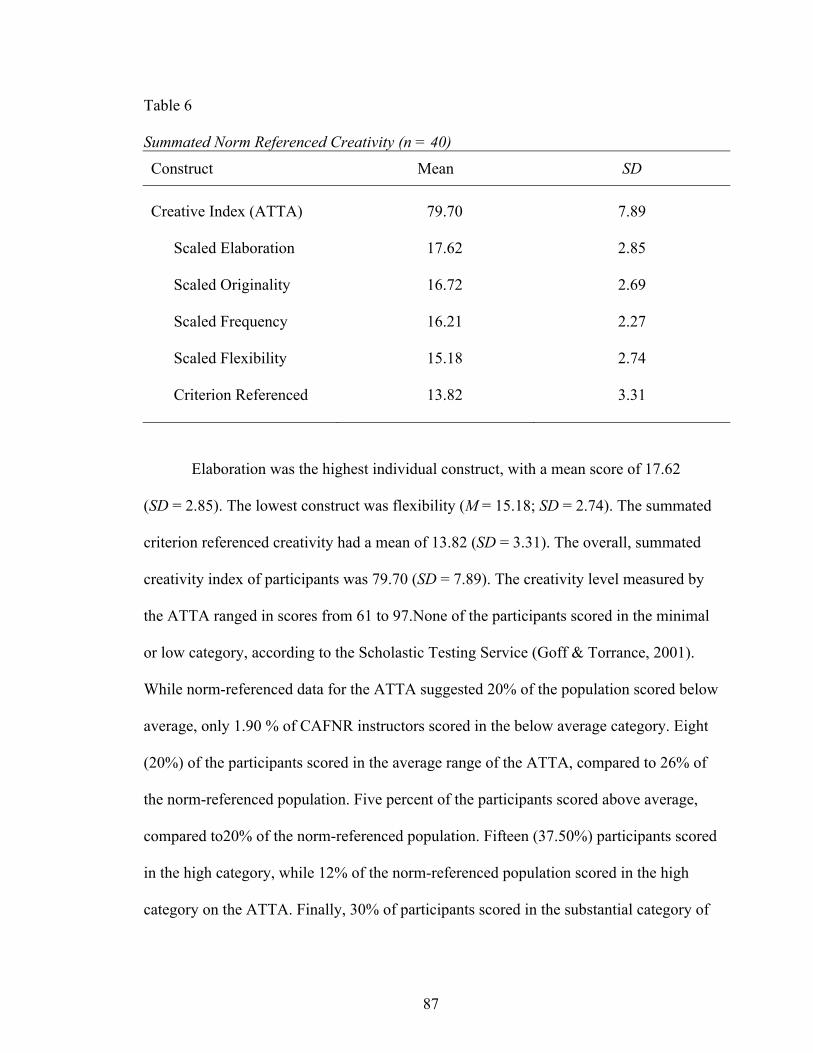
87
Table 6 Summated Norm Referenced Creativity (n = 40)
Construct Mean SD
Creative Index (ATTA) 79.70 7.89
Scaled Elaboration
17.62
2.85 Scaled Originality
16.72
2.69
Scaled Frequency 16.21 2.27
Scaled Flexibility 15.18 2.74
Criterion Referenced 13.82 3.31
Elaboration was the highest individual construct, with a mean score of 17.62
(SD = 2.85). The lowest construct was flexibility (M = 15.18; SD = 2.74). The summated
criterion referenced creativity had a mean of 13.82 (SD = 3.31). The overall, summated
creativity index of participants was 79.70 (SD = 7.89). The creativity level measured by
the ATTA ranged in scores from 61 to 97.None of the participants scored in the minimal
or low category, according to the Scholastic Testing Service (Goff & Torrance, 2001).
While norm-referenced data for the ATTA suggested 20% of the population scored below
average, only 1.90 % of CAFNR instructors scored in the below average category. Eight
(20%) of the participants scored in the average range of the ATTA, compared to 26% of
the norm-referenced population. Five percent of the participants scored above average,
compared to20% of the norm-referenced population. Fifteen (37.50%) participants scored
in the high category, while 12% of the norm-referenced population scored in the high
category on the ATTA. Finally, 30% of participants scored in the substantial category of
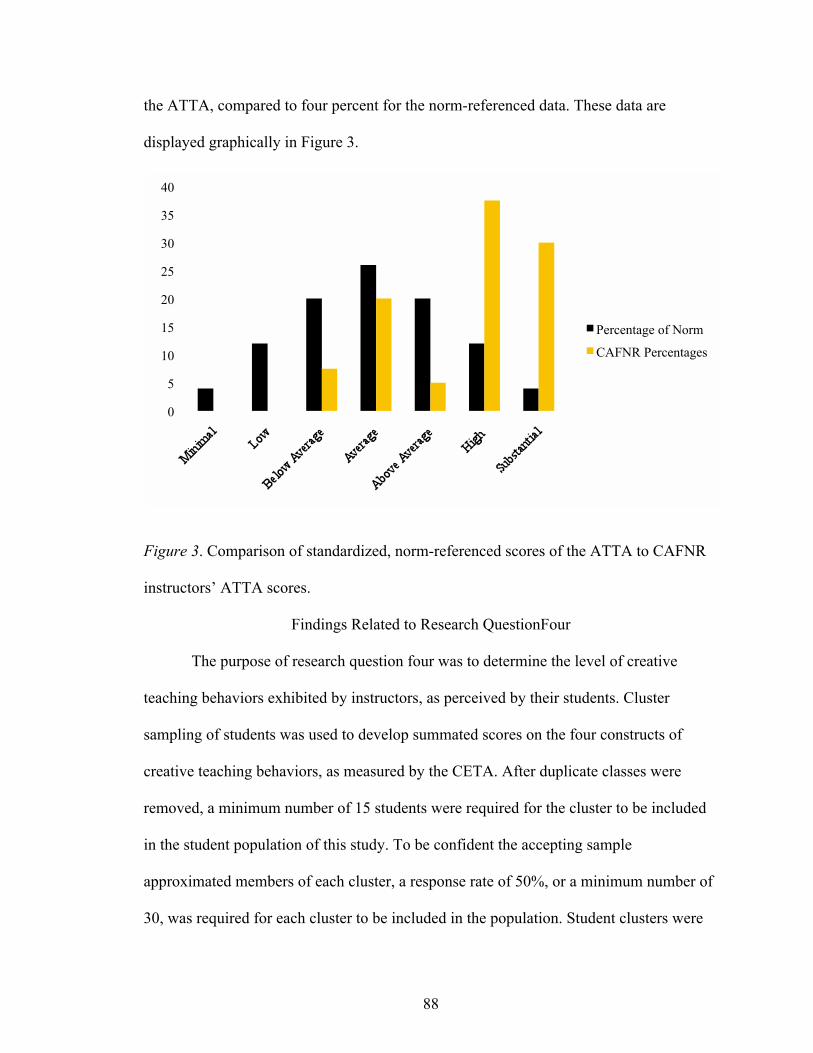
88
the ATTA, compared to four percent for the norm-referenced data. These data are
displayed graphically in Figure 3.
Figure 3. Comparison of standardized, norm-referenced scores of the ATTA to CAFNR
instructors’ ATTA scores.
Findings Related to Research QuestionFour
The purpose of research question four was to determine the level of creative
teaching behaviors exhibited by instructors, as perceived by their students. Cluster
sampling of students was used to develop summated scores on the four constructs of
creative teaching behaviors, as measured by the CETA. After duplicate classes were
removed, a minimum number of 15 students were required for the cluster to be included
in the student population of this study. To be confident the accepting sample
approximated members of each cluster, a response rate of 50%, or a minimum number of
30, was required for each cluster to be included in the population. Student clusters were
0
5
10
15
20
25
30
35
40
Percentage of Norm
CAFNR Percentages
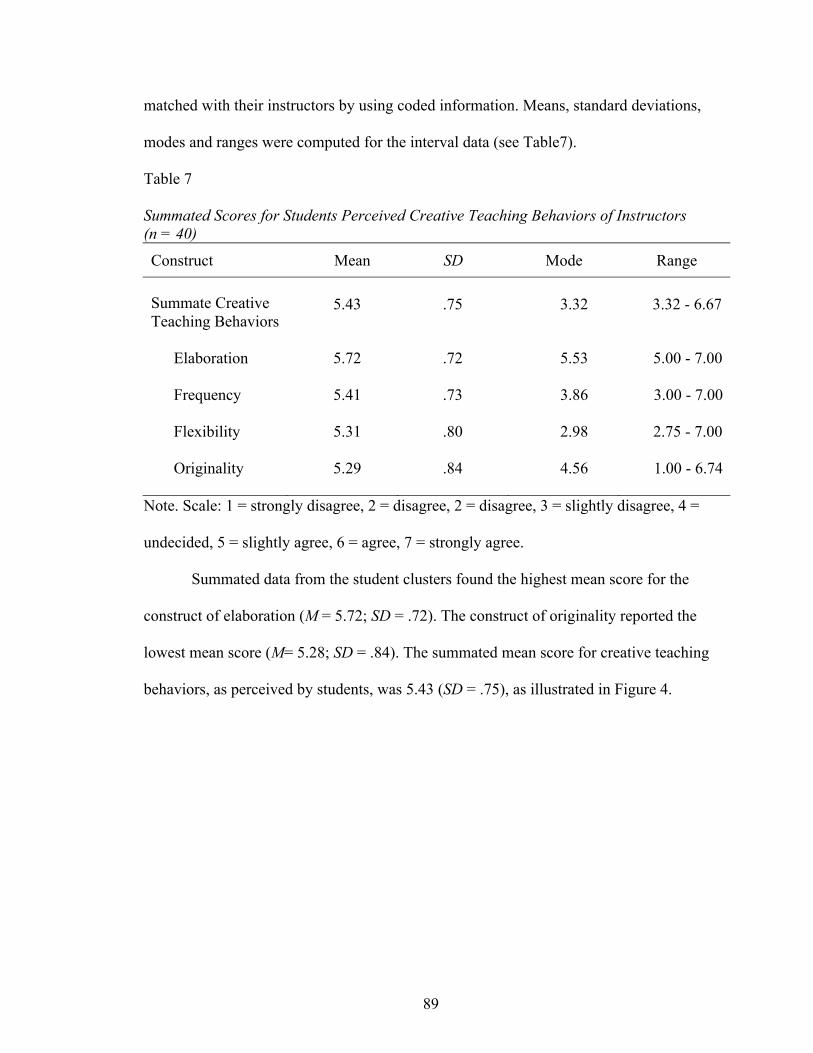
89
matched with their instructors by using coded information. Means, standard deviations,
modes and ranges were computed for the interval data (see Table7).
Table 7 Summated Scores for Students Perceived Creative Teaching Behaviors of Instructors
(n = 40)
Construct Mean SD Mode Range
Summate Creative Teaching Behaviors
5.43 .75 3.32 3.32 - 6.67
Elaboration
5.72
.72
5.53
5.00 - 7.00
Frequency 5.41 .73 3.86 3.00 - 7.00
Flexibility 5.31 .80 2.98 2.75 - 7.00
Originality 5.29 .84 4.56 1.00 - 6.74
Note. Scale: 1 = strongly disagree, 2 = disagree, 2 = disagree, 3 = slightly disagree, 4 =
undecided, 5 = slightly agree, 6 = agree, 7 = strongly agree.
Summated data from the student clusters found the highest mean score for the
construct of elaboration (M = 5.72; SD = .72). The construct of originality reported the
lowest mean score (M= 5.28; SD = .84). The summated mean score for creative teaching
behaviors, as perceived by students, was 5.43 (SD = .75), as illustrated in Figure 4.
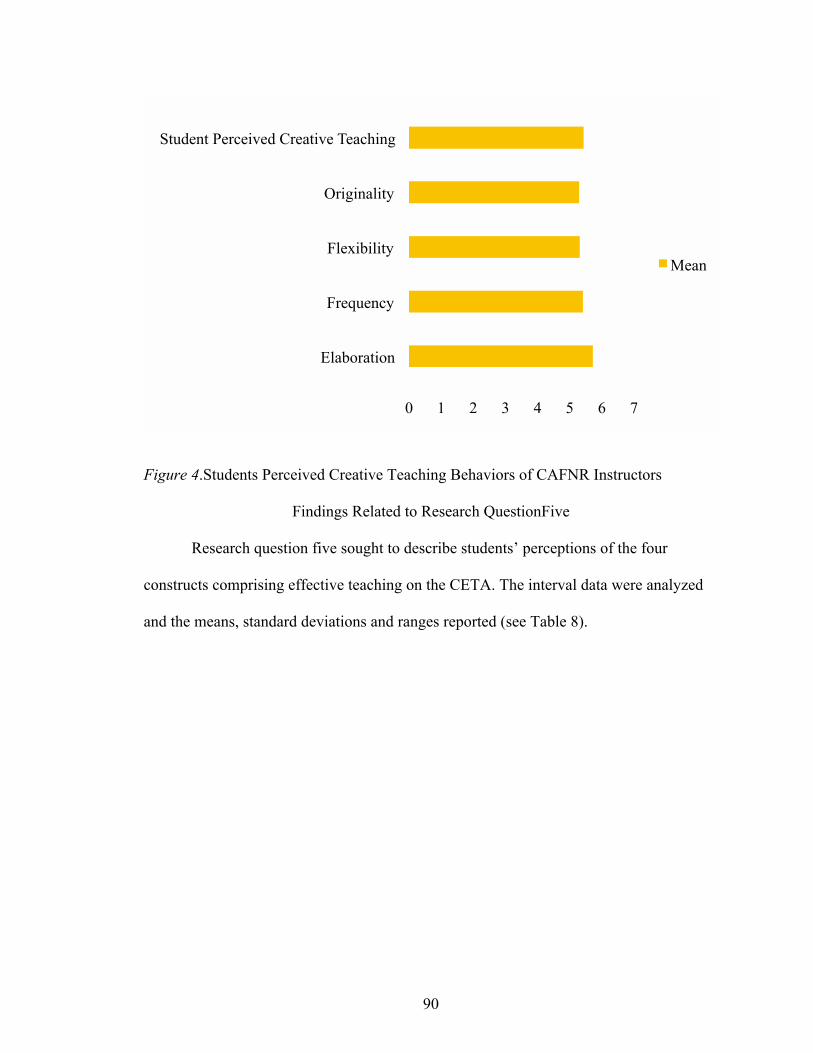
90
Figure 4.Students Perceived Creative Teaching Behaviors of CAFNR Instructors
Findings Related to Research QuestionFive
Research question five sought to describe students’ perceptions of the four
constructs comprising effective teaching on the CETA. The interval data were analyzed
and the means, standard deviations and ranges reported (see Table 8).
0 1 2 3 4 5 6 7
Elaboration
Frequency
Flexibility
Originality
Student Perceived Creative Teaching
Mean
91
Table 8 Summated Scores for Students’ Perceived Effective Teaching (n = 40)
Construct Mean SD Mode Range
Self- Perceived Effective Teaching
5.64 .69 3.80 3.80 - 6.82
Enthusiasm
5.87
.71 4.27 4.27 - 6.90
Task Oriented 5.83 .53 5.38 4.47 - 6.79
Opportunity to Learn 5.64 .70 6.48 3.53 - 6.88
Clarity 5.58 .85 6.43 3.37 - 6.88
Variability 5.23 .90 3.07 3.07 - 6.81
Note. Scale: 1 = strongly disagree, 2 = disagree, 2 = disagree, 3 = slightly disagree, 4 =
undecided, 5 = slightly agree, 6 = agree, 7 = strongly agree.
Students rated enthusiasm to be the most frequently occurring construct of
effective teaching (M = 5.87; SD = .71). Variability reported the lowest mean score (M =
5.23; SD = .90) for effective teaching, as perceived by students. Overall, students slightly
agreed to agreed CAFNR instructors were effective teachers (M = 5.64; SD = .69).
Students slightly agreed to agreed that CAFNR instructors effectively demonstrated each
of the five effective teaching characteristics.
Findings Related to Research QuestionSix
Research question six sought to describe the relationship between creative
teaching behaviors of instructors, as perceived by students, and students’ perceptions of
effective instructors, instructor’s perceived creativity, and instructors’ norm referenced
creativity. Data were considered interval in nature, thus Pearson product moment
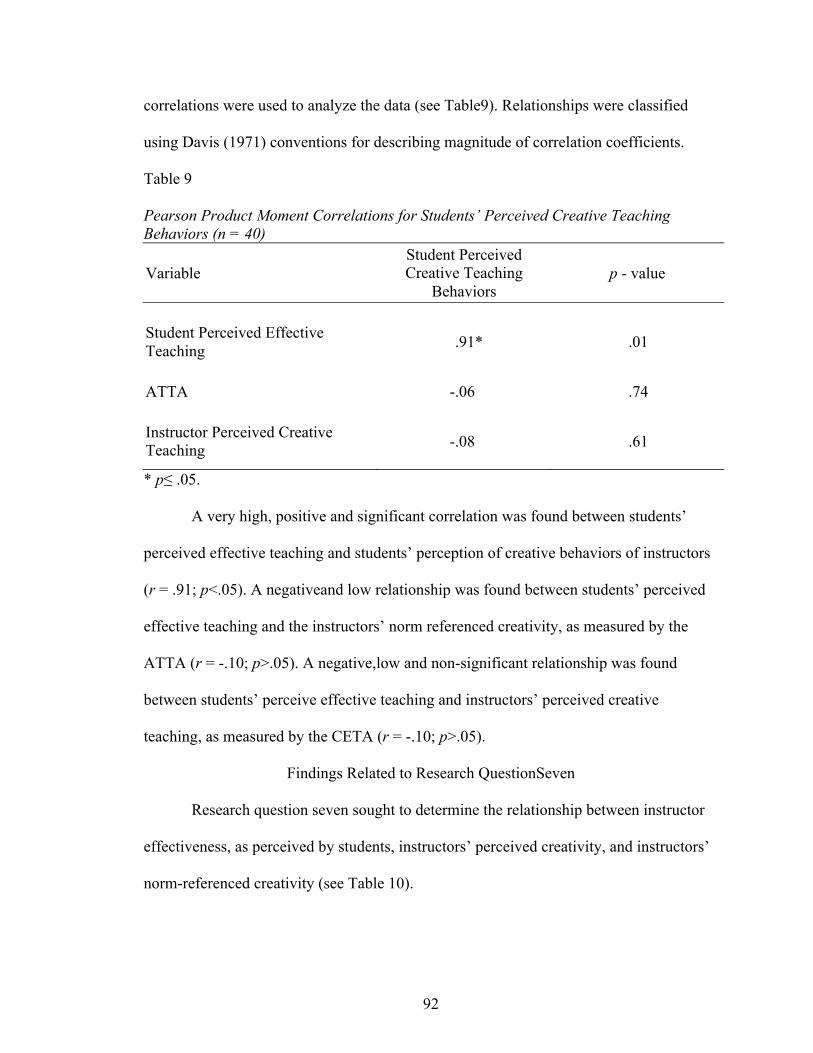
92
correlations were used to analyze the data (see Table9). Relationships were classified
using Davis (1971) conventions for describing magnitude of correlation coefficients.
Table 9 Pearson Product Moment Correlations for Students’ Perceived Creative Teaching
Behaviors (n = 40)
Variable Student Perceived Creative Teaching
Behaviors p - value
Student Perceived Effective Teaching
.91*
.01
ATTA
-.06 .74
Instructor Perceived Creative Teaching
-.08 .61
* p .05.
A very high, positive and significant correlation was found between students’
perceived effective teaching and students’ perception of creative behaviors of instructors
(r = .91; p<.05). A negativeand low relationship was found between students’ perceived
effective teaching and the instructors’ norm referenced creativity, as measured by the
ATTA (r = -.10; p>.05). A negative,low and non-significant relationship was found
between students’ perceive effective teaching and instructors’ perceived creative
teaching, as measured by the CETA (r = -.10; p>.05).
Findings Related to Research QuestionSeven
Research question seven sought to determine the relationship between instructor
effectiveness, as perceived by students, instructors’ perceived creativity, and instructors’
norm-referenced creativity (see Table 10).
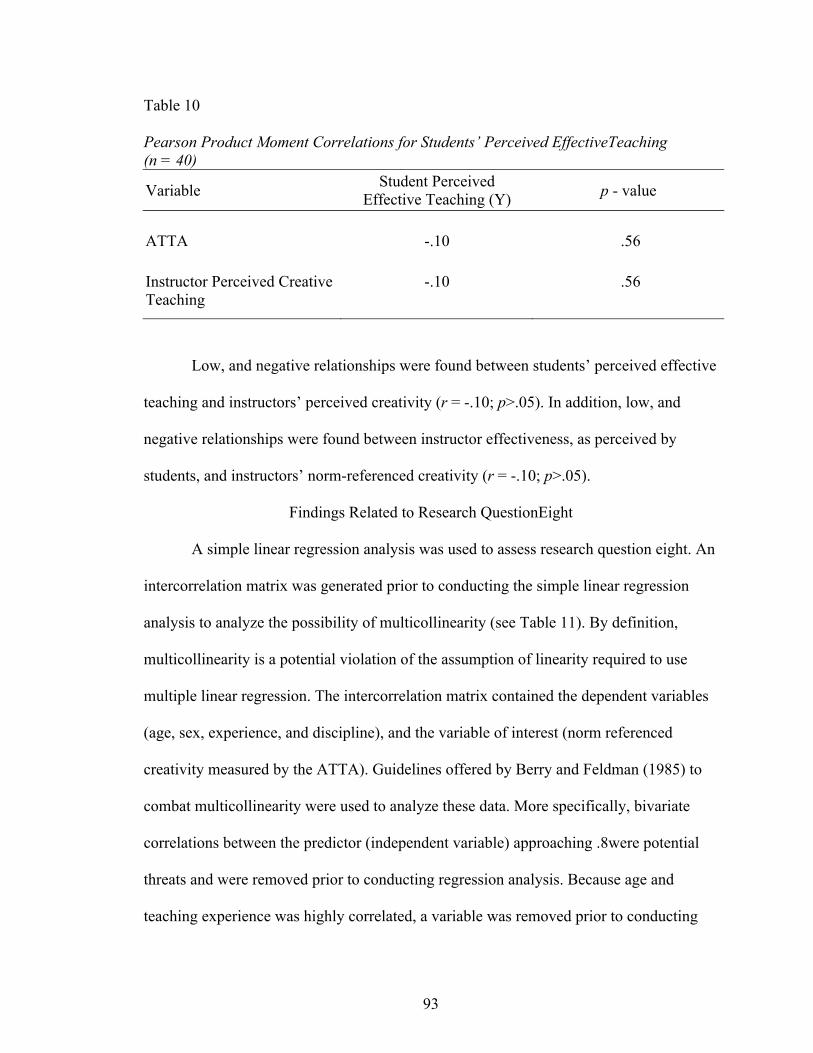
93
Table 10 Pearson Product Moment Correlations for Students’ Perceived EffectiveTeaching
(n = 40)
Variable Student Perceived
Effective Teaching (Y) p - value
ATTA
-.10
.56
Instructor Perceived Creative Teaching
-.10 .56
Low, and negative relationships were found between students’ perceived effective
teaching and instructors’ perceived creativity (r = -.10; p>.05). In addition, low, and
negative relationships were found between instructor effectiveness, as perceived by
students, and instructors’ norm-referenced creativity (r = -.10; p>.05).
Findings Related to Research QuestionEight
A simple linear regression analysis was used to assess research question eight. An
intercorrelation matrix was generated prior to conducting the simple linear regression
analysis to analyze the possibility of multicollinearity (see Table 11). By definition,
multicollinearity is a potential violation of the assumption of linearity required to use
multiple linear regression. The intercorrelation matrix contained the dependent variables
(age, sex, experience, and discipline), and the variable of interest (norm referenced
creativity measured by the ATTA). Guidelines offered by Berry and Feldman (1985) to
combat multicollinearity were used to analyze these data. More specifically, bivariate
correlations between the predictor (independent variable) approaching .8were potential
threats and were removed prior to conducting regression analysis. Because age and
teaching experience was highly correlated, a variable was removed prior to conducting
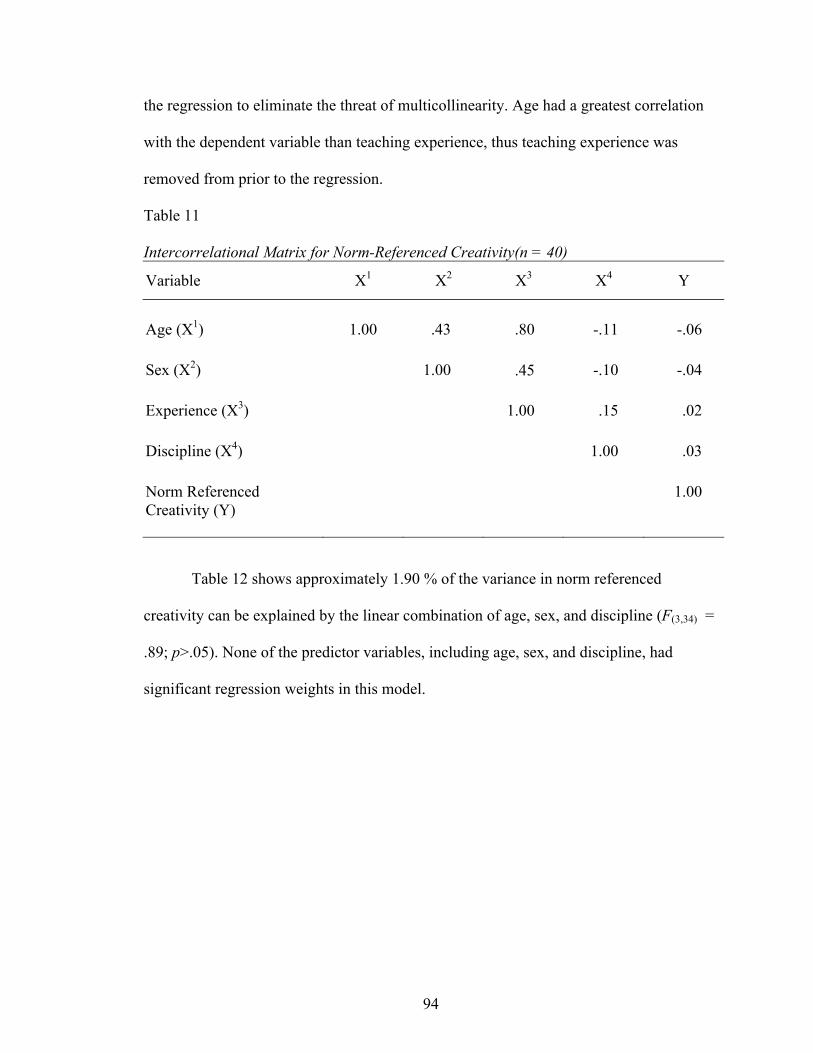
94
the regression to eliminate the threat of multicollinearity. Age had a greatest correlation
with the dependent variable than teaching experience, thus teaching experience was
removed from prior to the regression.
Table 11 Intercorrelational Matrix for Norm-Referenced Creativity(n = 40)
Variable X1 X2 X3 X4 Y
Age (X1)
1.00
.43
.80
-.11
-.06
Sex (X2)
1.00 .45
-.10
-.04
Experience (X3) 1.00 .15 .02
Discipline (X4) 1.00 .03
Norm Referenced Creativity (Y)
1.00
Table 12 shows approximately 1.90 % of the variance in norm referenced
creativity can be explained by the linear combination of age, sex, and discipline (F(3,34) =
.89; p>.05). None of the predictor variables, including age, sex, and discipline, had
significant regression weights in this model.
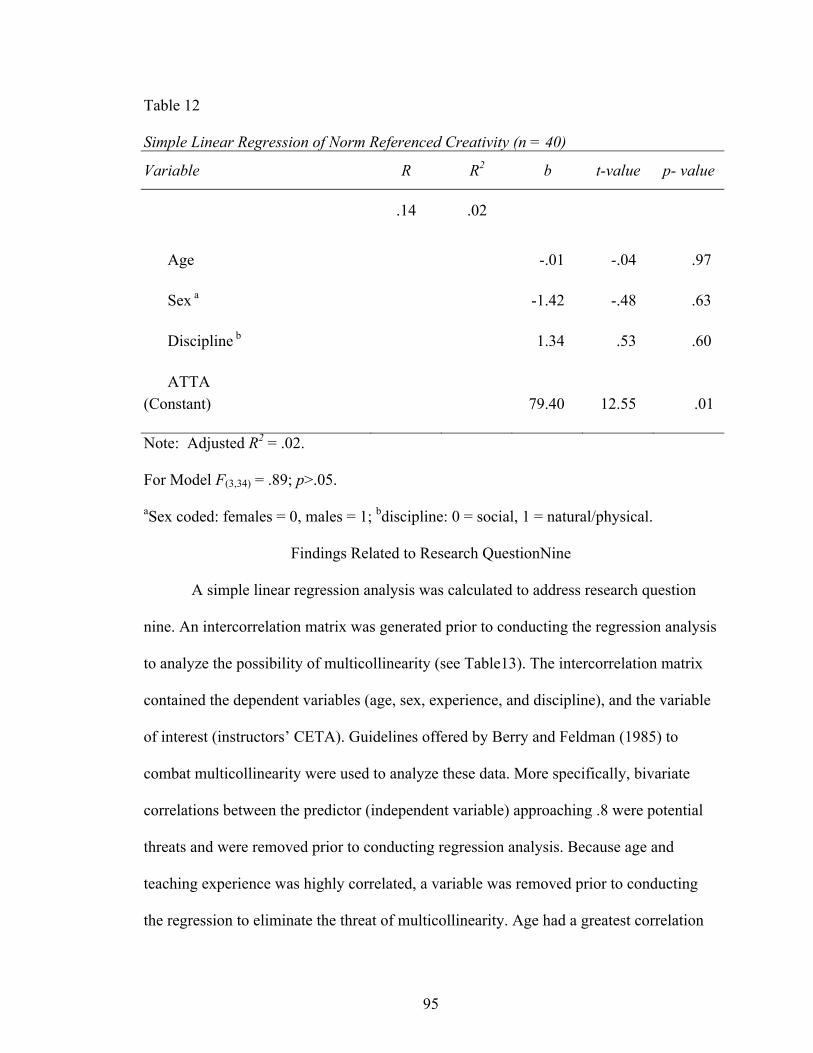
95
Table 12
Simple Linear Regression of Norm Referenced Creativity (n = 40)
Variable R R2
b t-value p- value
.14 .02
Age -.01 -.04 .97
Sex a -1.42 -.48 .63
Discipline b 1.34 .53 .60
ATTA
(Constant) 79.40 12.55 .01
Note: Adjusted R2 = .02.
For Model F(3,34) = .89; p>.05.
aSex coded: females = 0, males = 1; bdiscipline: 0 = social, 1 = natural/physical.
Findings Related to Research QuestionNine
A simple linear regression analysis was calculated to address research question
nine. An intercorrelation matrix was generated prior to conducting the regression analysis
to analyze the possibility of multicollinearity (see Table13). The intercorrelation matrix
contained the dependent variables (age, sex, experience, and discipline), and the variable
of interest (instructors’ CETA). Guidelines offered by Berry and Feldman (1985) to
combat multicollinearity were used to analyze these data. More specifically, bivariate
correlations between the predictor (independent variable) approaching .8 were potential
threats and were removed prior to conducting regression analysis. Because age and
teaching experience was highly correlated, a variable was removed prior to conducting
the regression to eliminate the threat of multicollinearity. Age had a greatest correlation
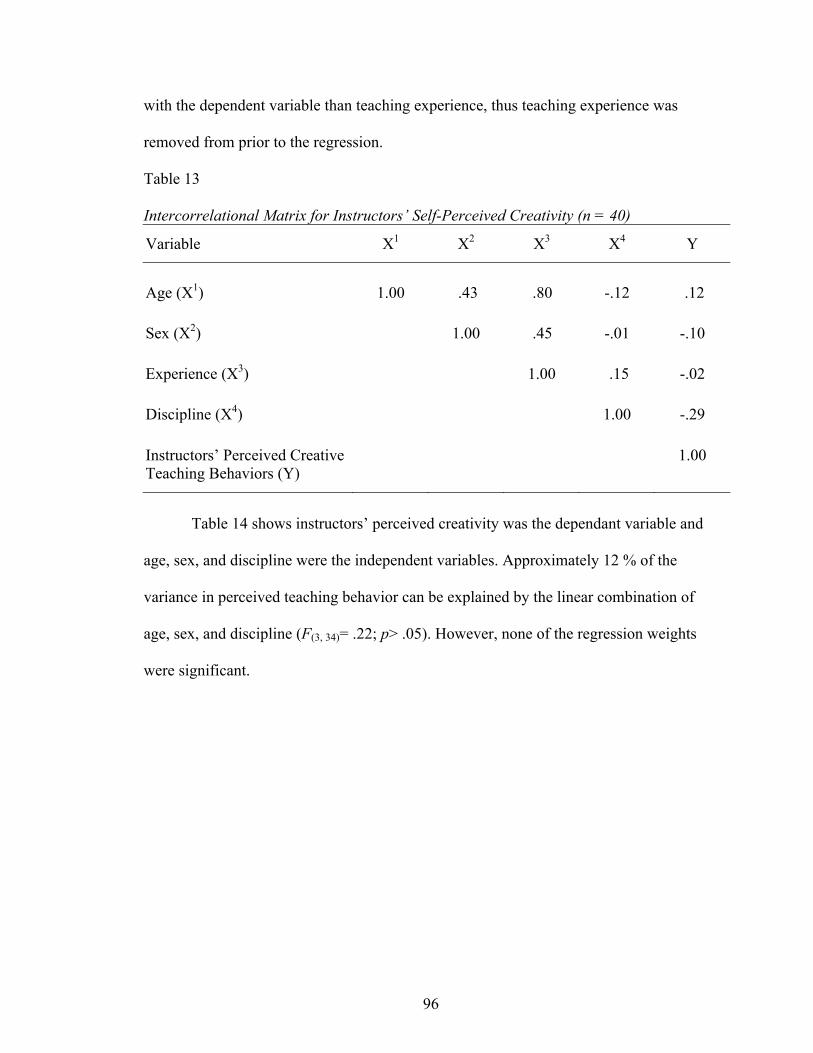
96
with the dependent variable than teaching experience, thus teaching experience was
removed from prior to the regression.
Table 13 Intercorrelational Matrix for Instructors’ Self-Perceived Creativity (n = 40)
Variable X1 X2 X3 X4 Y
Age (X1)
1.00
.43
.80
-.12
.12
Sex (X2)
1.00
.45
-.01
-.10
Experience (X3) 1.00 .15 -.02
Discipline (X4) 1.00 -.29
Instructors’ Perceived Creative Teaching Behaviors (Y)
1.00
Table 14 shows instructors’ perceived creativity was the dependant variable and
age, sex, and discipline were the independent variables. Approximately 12 % of the
variance in perceived teaching behavior can be explained by the linear combination of
age, sex, and discipline (F(3, 34)= .22; p> .05). However, none of the regression weights
were significant.
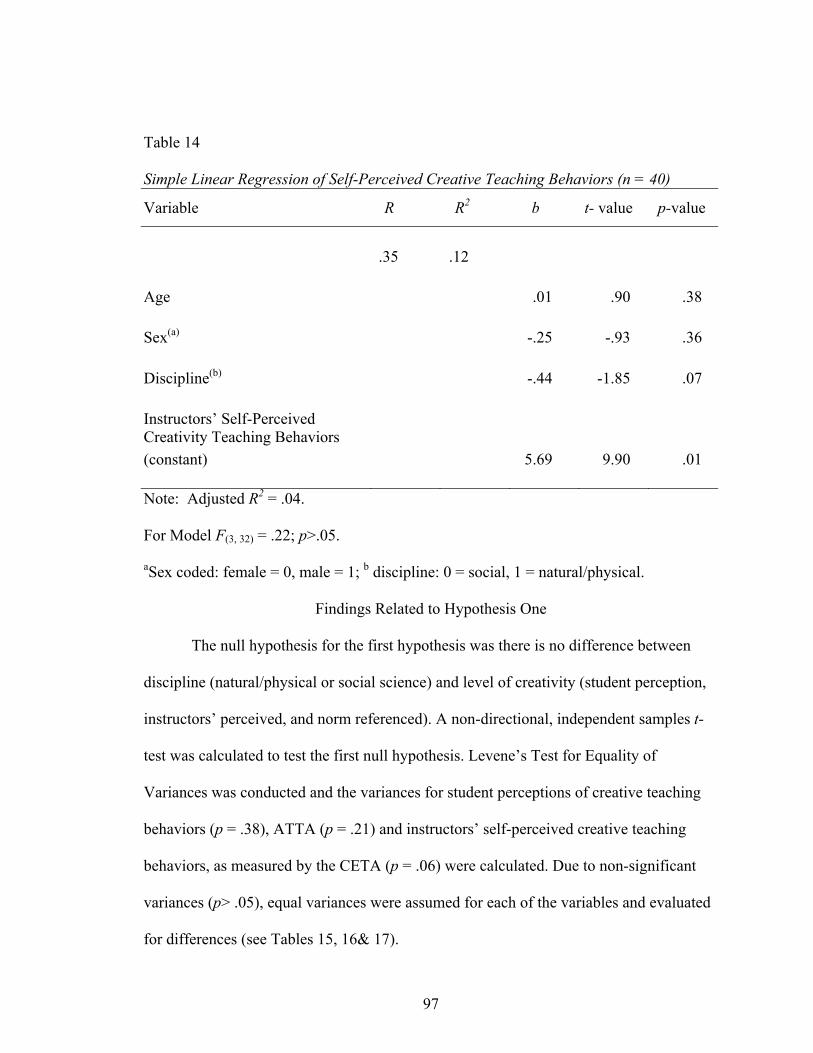
97
Table 14 Simple Linear Regression of Self-Perceived Creative Teaching Behaviors (n = 40)
Variable R R2
b t- value p-value
.35 .12
Age .01 .90 .38
Sex(a) -.25 -.93 .36
Discipline(b) -.44 -1.85 .07
Instructors’ Self-Perceived Creativity Teaching Behaviors
(constant) 5.69 9.90 .01
Note: Adjusted R2 = .04.
For Model F(3, 32) = .22; p>.05.
aSex coded: female = 0, male = 1; b discipline: 0 = social, 1 = natural/physical.
Findings Related to Hypothesis One
The null hypothesis for the first hypothesis was there is no difference between
discipline (natural/physical or social science) and level of creativity (student perception,
instructors’ perceived, and norm referenced). A non-directional, independent samples t-
test was calculated to test the first null hypothesis. Levene’s Test for Equality of
Variances was conducted and the variances for student perceptions of creative teaching
behaviors (p = .38), ATTA (p = .21) and instructors’ self-perceived creative teaching
behaviors, as measured by the CETA (p = .06) were calculated. Due to non-significant
variances (p> .05), equal variances were assumed for each of the variables and evaluated
for differences (see Tables 15, 16& 17).
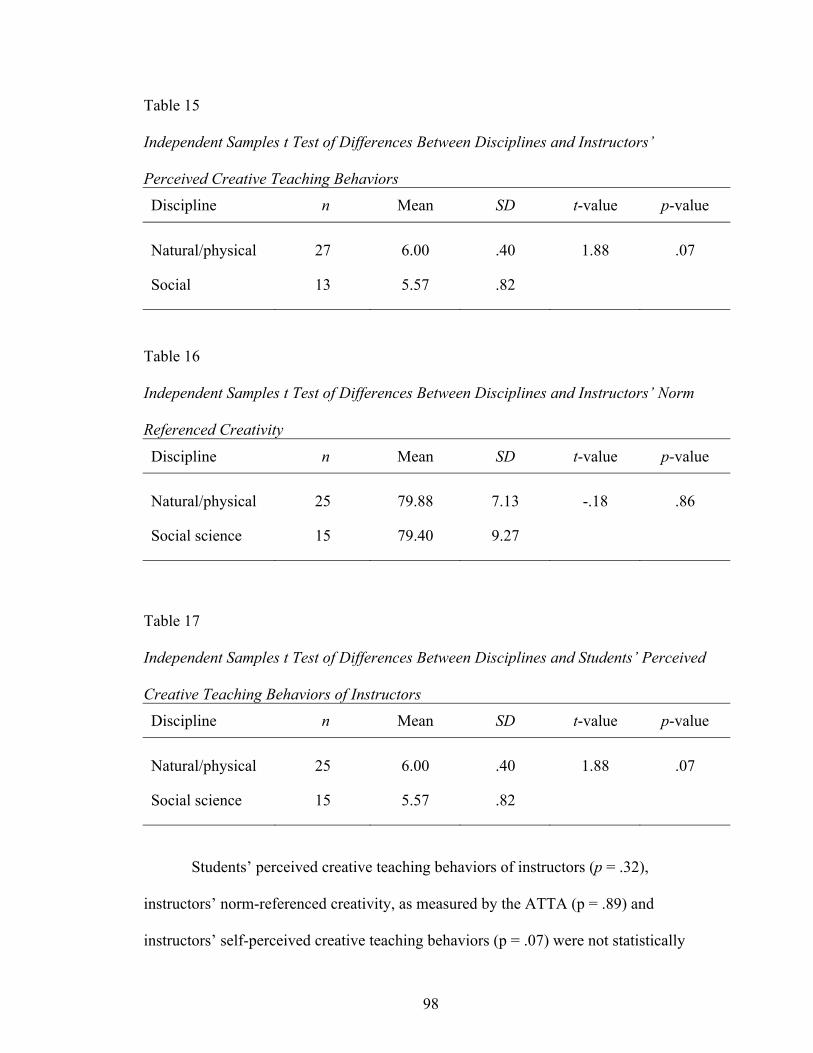
98
Table 15 Independent Samples t Test of Differences Between Disciplines and Instructors’
Perceived Creative Teaching Behaviors
Discipline n Mean SD t-value p-value
Natural/physical
27
6.00
.40
1.88
.07
Social 13 5.57 .82
Table 16 Independent Samples t Test of Differences Between Disciplines and Instructors’ Norm
Referenced Creativity
Discipline n Mean SD t-value p-value
Natural/physical
25
79.88
7.13
-.18
.86
Social science 15 79.40 9.27
Table 17 Independent Samples t Test of Differences Between Disciplines and Students’ Perceived
Creative Teaching Behaviors of Instructors
Discipline n Mean SD t-value p-value
Natural/physical
25
6.00
.40
1.88
.07
Social science 15 5.57 .82
Students’ perceived creative teaching behaviors of instructors (p = .32),
instructors’ norm-referenced creativity, as measured by the ATTA (p = .89) and
instructors’ self-perceived creative teaching behaviors (p = .07) were not statistically
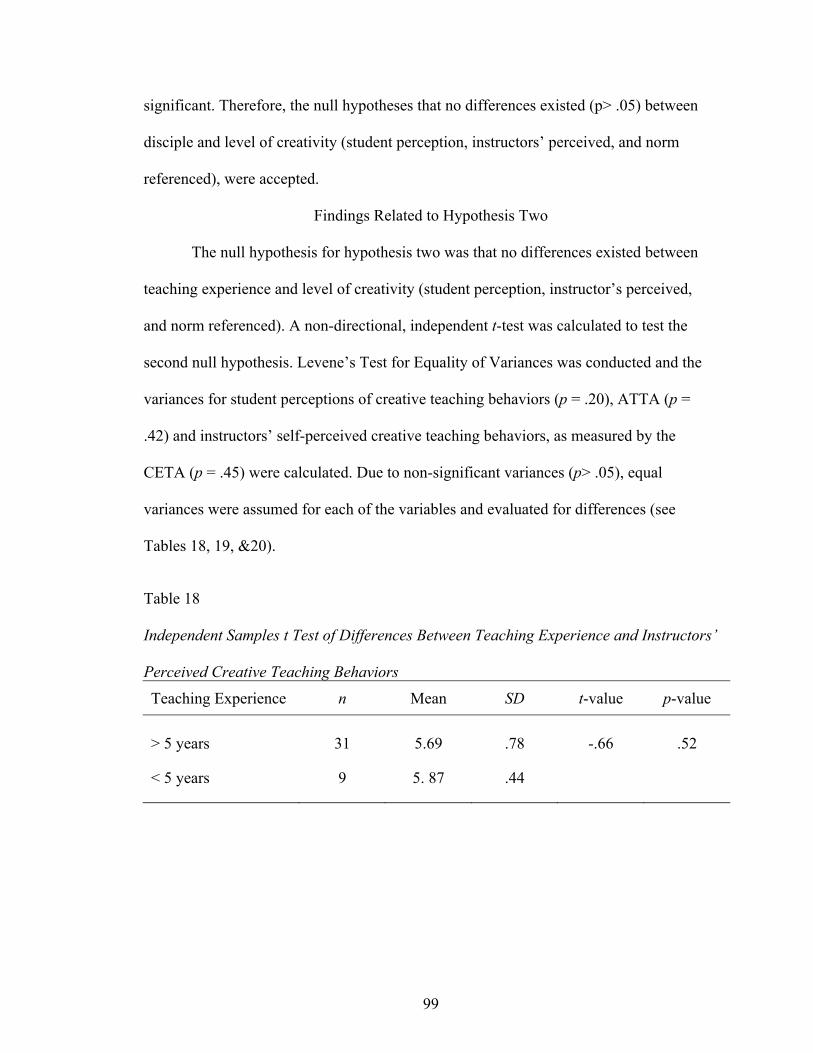
99
significant. Therefore, the null hypotheses that no differences existed (p> .05) between
disciple and level of creativity (student perception, instructors’ perceived, and norm
referenced), were accepted.
Findings Related to Hypothesis Two
The null hypothesis for hypothesis two was that no differences existed between
teaching experience and level of creativity (student perception, instructor’s perceived,
and norm referenced). A non-directional, independent t-test was calculated to test the
second null hypothesis. Levene’s Test for Equality of Variances was conducted and the
variances for student perceptions of creative teaching behaviors (p = .20), ATTA (p =
.42) and instructors’ self-perceived creative teaching behaviors, as measured by the
CETA (p = .45) were calculated. Due to non-significant variances (p> .05), equal
variances were assumed for each of the variables and evaluated for differences (see
Tables 18, 19, &20).
Table 18 Independent Samples t Test of Differences Between Teaching Experience and Instructors’
Perceived Creative Teaching Behaviors
Teaching Experience n Mean SD t-value p-value
> 5 years
31
5.69
.78
-.66
.52
< 5 years 9 5. 87 .44
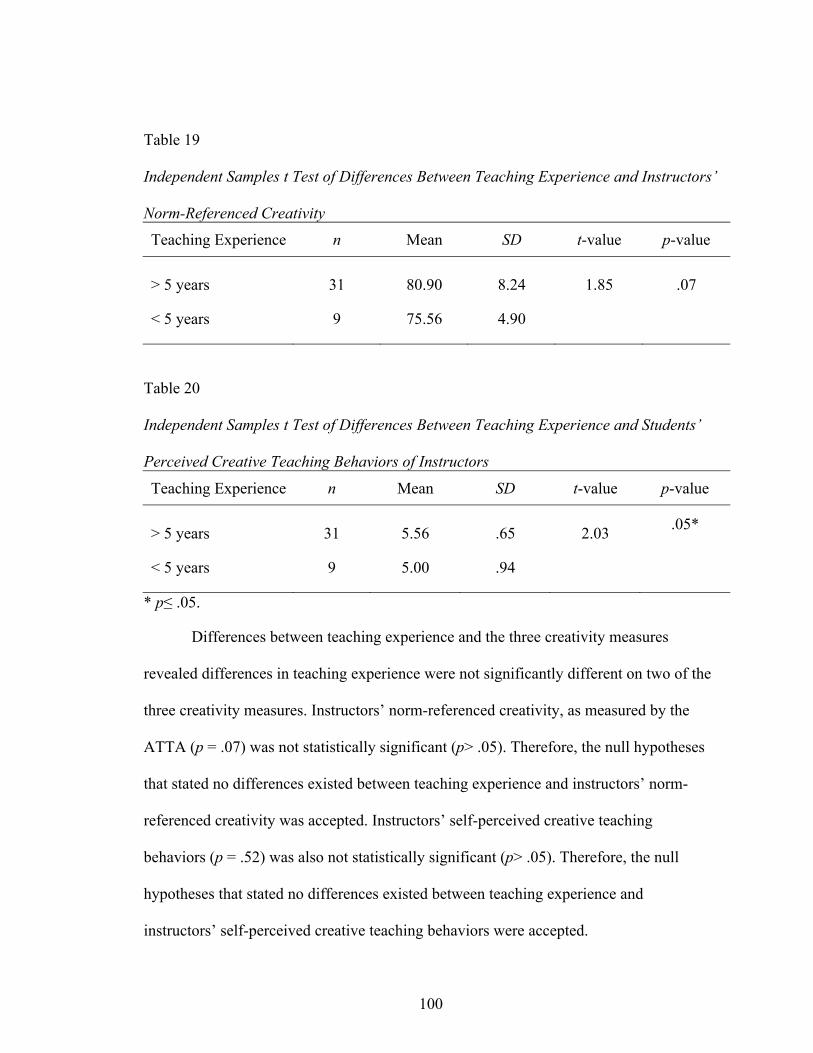
100
Table 19 Independent Samples t Test of Differences Between Teaching Experience and Instructors’
Norm-Referenced Creativity
Teaching Experience n Mean SD t-value p-value
> 5 years
31
80.90
8.24
1.85
.07
< 5 years 9 75.56 4.90
Table 20 Independent Samples t Test of Differences Between Teaching Experience and Students’
Perceived Creative Teaching Behaviors of Instructors
Teaching Experience n Mean SD t-value p-value
> 5 years
31
5.56
.65
2.03
.05*
< 5 years 9 5.00 .94
* p .05.
Differences between teaching experience and the three creativity measures
revealed differences in teaching experience were not significantly different on two of the
three creativity measures. Instructors’ norm-referenced creativity, as measured by the
ATTA (p = .07) was not statistically significant (p> .05). Therefore, the null hypotheses
that stated no differences existed between teaching experience and instructors’ norm-
referenced creativity was accepted. Instructors’ self-perceived creative teaching
behaviors (p = .52) was also not statistically significant (p> .05). Therefore, the null
hypotheses that stated no differences existed between teaching experience and
instructors’ self-perceived creative teaching behaviors were accepted.
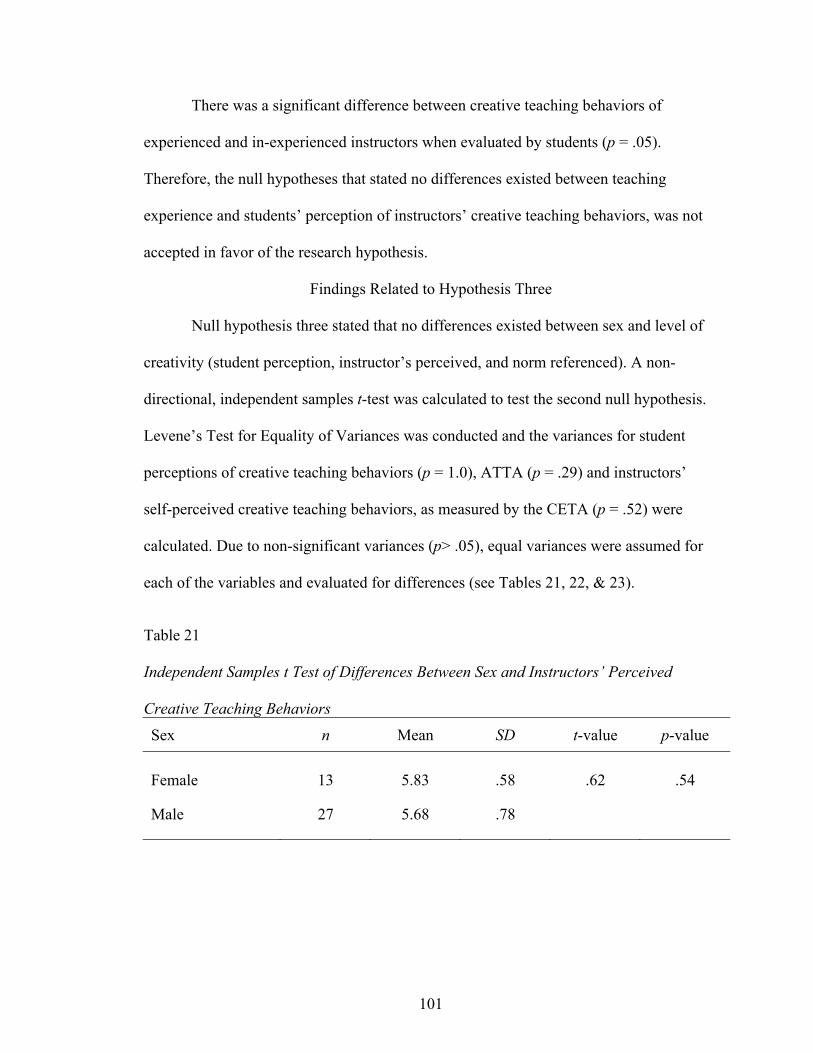
101
There was a significant difference between creative teaching behaviors of
experienced and in-experienced instructors when evaluated by students (p = .05).
Therefore, the null hypotheses that stated no differences existed between teaching
experience and students’ perception of instructors’ creative teaching behaviors, was not
accepted in favor of the research hypothesis.
Findings Related to Hypothesis Three
Null hypothesis three stated that no differences existed between sex and level of
creativity (student perception, instructor’s perceived, and norm referenced). A non-
directional, independent samples t-test was calculated to test the second null hypothesis.
Levene’s Test for Equality of Variances was conducted and the variances for student
perceptions of creative teaching behaviors (p = 1.0), ATTA (p = .29) and instructors’
self-perceived creative teaching behaviors, as measured by the CETA (p = .52) were
calculated. Due to non-significant variances (p> .05), equal variances were assumed for
each of the variables and evaluated for differences (see Tables 21, 22, & 23).
Table 21 Independent Samples t Test of Differences Between Sex and Instructors’ Perceived
Creative Teaching Behaviors
Sex n Mean SD t-value p-value
Female
13
5.83
.58
.62
.54
Male 27 5.68 .78
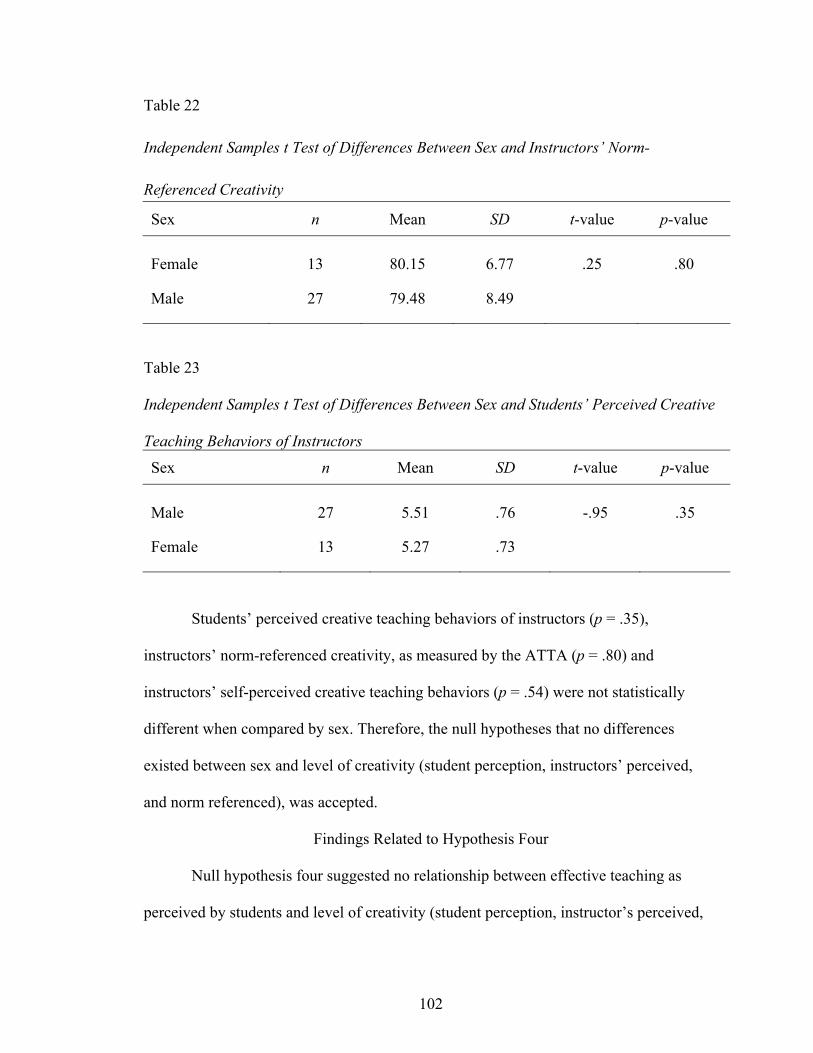
102
Table 22
Independent Samples t Test of Differences Between Sex and Instructors’ Norm-
Referenced Creativity
Sex n Mean SD t-value p-value
Female
13
80.15
6.77
.25
.80
Male 27 79.48 8.49
Table 23 Independent Samples t Test of Differences Between Sex and Students’ Perceived Creative
Teaching Behaviors of Instructors
Sex n Mean SD t-value p-value
Male
27
5.51
.76
-.95
.35
Female 13 5.27 .73
Students’ perceived creative teaching behaviors of instructors (p = .35),
instructors’ norm-referenced creativity, as measured by the ATTA (p = .80) and
instructors’ self-perceived creative teaching behaviors (p = .54) were not statistically
different when compared by sex. Therefore, the null hypotheses that no differences
existed between sex and level of creativity (student perception, instructors’ perceived,
and norm referenced), was accepted.
Findings Related to Hypothesis Four
Null hypothesis four suggested no relationship between effective teaching as
perceived by students and level of creativity (student perception, instructor’s perceived,
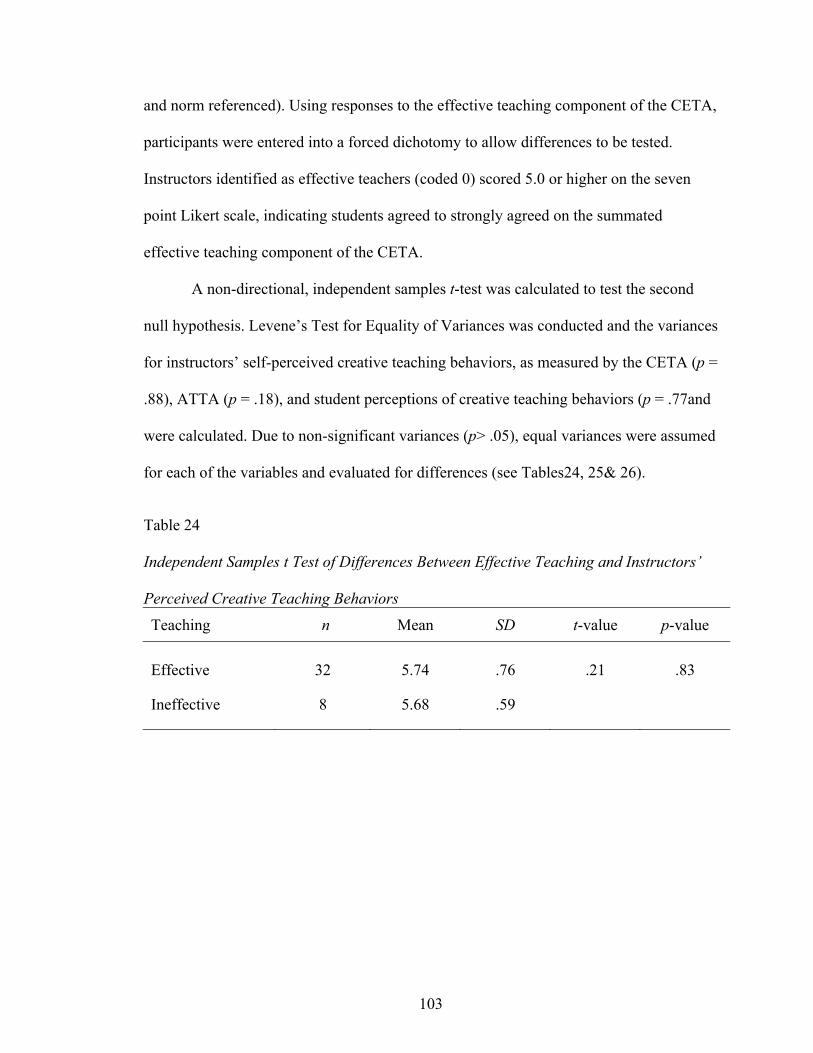
103
and norm referenced). Using responses to the effective teaching component of the CETA,
participants were entered into a forced dichotomy to allow differences to be tested.
Instructors identified as effective teachers (coded 0) scored 5.0 or higher on the seven
point Likert scale, indicating students agreed to strongly agreed on the summated
effective teaching component of the CETA.
A non-directional, independent samples t-test was calculated to test the second
null hypothesis. Levene’s Test for Equality of Variances was conducted and the variances
for instructors’ self-perceived creative teaching behaviors, as measured by the CETA (p =
.88), ATTA (p = .18), and student perceptions of creative teaching behaviors (p = .77and
were calculated. Due to non-significant variances (p> .05), equal variances were assumed
for each of the variables and evaluated for differences (see Tables24, 25& 26).
Table 24 Independent Samples t Test of Differences Between Effective Teaching and Instructors’
Perceived Creative Teaching Behaviors
Teaching n Mean SD t-value p-value
Effective
32
5.74
.76
.21
.83
Ineffective 8 5.68 .59
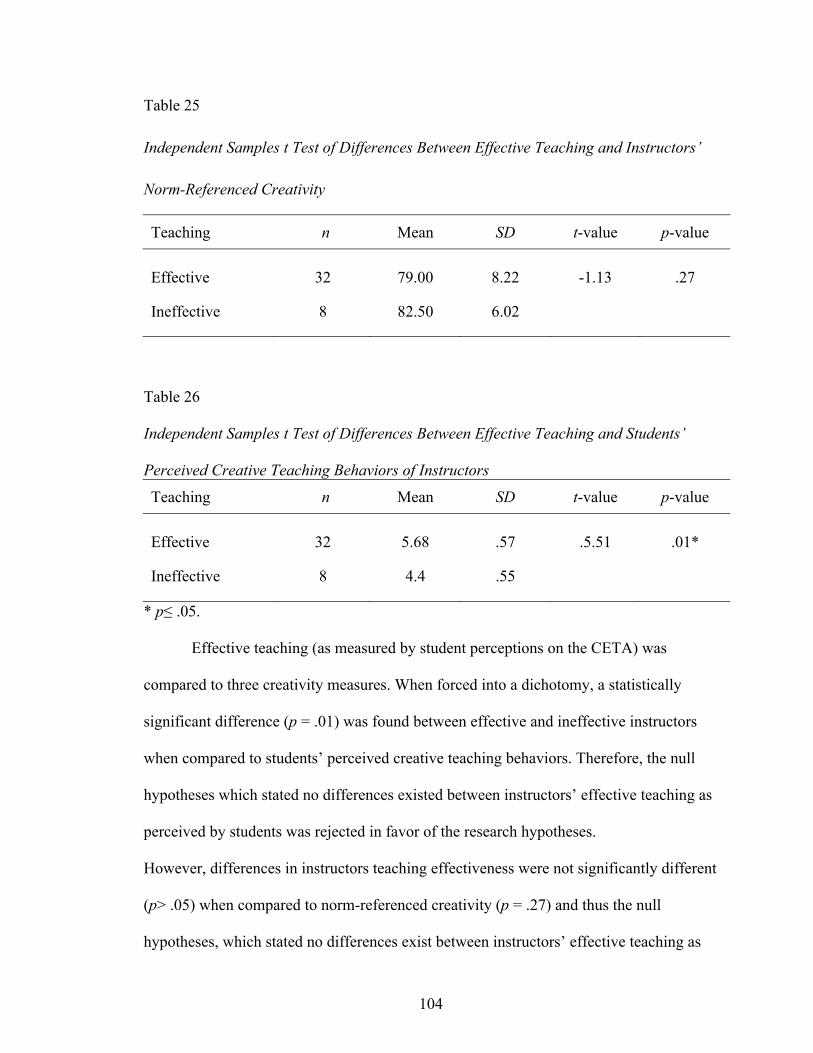
104
Table 25
Independent Samples t Test of Differences Between Effective Teaching and Instructors’
Norm-Referenced Creativity
Teaching n Mean SD t-value p-value
Effective
32
79.00
8.22
-1.13
.27
Ineffective 8 82.50 6.02
Table 26 Independent Samples t Test of Differences Between Effective Teaching and Students’
Perceived Creative Teaching Behaviors of Instructors
Teaching n Mean SD t-value p-value
Effective
32
5.68
.57
.5.51
.01*
Ineffective 8 4.4 .55
* p .05.
Effective teaching (as measured by student perceptions on the CETA) was
compared to three creativity measures. When forced into a dichotomy, a statistically
significant difference (p = .01) was found between effective and ineffective instructors
when compared to students’ perceived creative teaching behaviors. Therefore, the null
hypotheses which stated no differences existed between instructors’ effective teaching as
perceived by students was rejected in favor of the research hypotheses.
However, differences in instructors teaching effectiveness were not significantly different
(p> .05) when compared to norm-referenced creativity (p = .27) and thus the null
hypotheses, which stated no differences exist between instructors’ effective teaching as
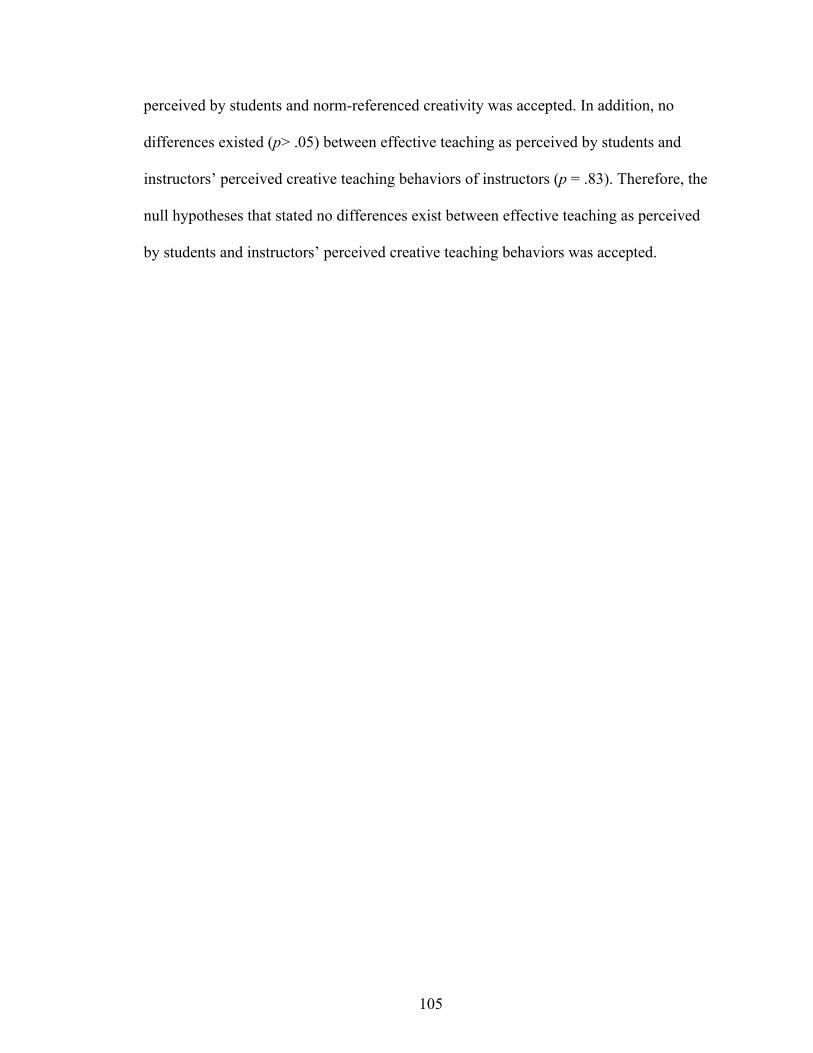
105
perceived by students and norm-referenced creativity was accepted. In addition, no
differences existed (p> .05) between effective teaching as perceived by students and
instructors’ perceived creative teaching behaviors of instructors (p = .83). Therefore, the
null hypotheses that stated no differences exist between effective teaching as perceived
by students and instructors’ perceived creative teaching behaviors was accepted.
106
CHAPTER FIVE
SUMMARY, CONCLUSIONS AND RECOMMENDATIONS
This chapter is a presentation of the procedures and methodology used to
accomplish the purposes of the study. It contains a discussion of the research design,
subjects of the study, instrumentation, data collection and data analysis procedures.
Summary
Purpose of the Study
The purpose of this study was to explain and predict creative and effective
teaching of university instructors. Specifically, student evaluations, self-reported teaching
evaluations, and standardized creativity instruments were used to assess instructor
creativity. In addition, the students’ perceptions of their instructor’s creativity in teaching
were compared with instructor’s self-reported creativity in teaching. The creativity of
instructors, as assessed by a standardized creativity instrument, was also compared to the
perceptions of effective teaching held by their students and the self-reported instructor
evaluations.
Research Questions and Hypotheses
The following research questions and hypotheses guide this study and identify
creativity specifically in the context of instruction and teaching:
1. What are the demographic characteristics of College of Agriculture, Food and
Natural Resources (CAFNR) undergraduate instructors, including sex, years
of teaching experience, age, and teaching discipline?
2. What is the self-perceived level of creative teaching effectiveness of CAFNR
instructors?
107
3. What is the level of creativity (fluency, originality, elaboration and flexibility)
as measured by the ATTA, of CAFNR instructors?
4. What is the level of creative behaviors exhibited by CAFNR instructors, as
perceived by their students?
5. What is the level of teaching effectiveness of CAFNR instructors, as
perceived by their students?
6. What is the relationship between creative behaviors of CAFNR instructors, as
perceived by students, and effective teaching behaviors, as perceived by
students, instructors’ perceived creativity, and instructors’ norm-referenced
creativity?
7. What is the relationship between CAFNR instructors teaching effectiveness,
as perceived by students, and instructors’ perceived creativity, and instructors’
norm-referenced creativity?
8. What is the amount of variance in instructors’ creativity, as measured by the
ATTA, that is accounted for by their age, sex, teaching experience, and
discipline?
9. What is the amount of variance in instructors’ self-perceived creativity
teaching behaviors that is accounted for by their age, sex, teaching experience,
and discipline?
Hypotheses
1. Ho: There is no difference between instructors’ discipline (natural/physical
science or social science) and their level of creativity (student perception [y1],
instructors’ perceived [y2], and norm referenced [y3]).
108
H0·1.2.3: xy1.2.3 = 0
H1: Differences exist between discipline (natural/physical or social science)
and their level of creativity (student perception [y1], instructors’ perceived
[y2], and norm referenced [y3]).
H1·1.2.3: xy1.2.3 0
2. Ho: There is no relationship between instructors’ teaching experience and
level of creativity (student perception [y1], instructors’ perceived [y2], and
norm referenced [y3]).
H0·1.2.3: xy1.2.3 = 0
H1: There is a relationship between instructors’ teaching experience and level
of creativity (student perception [y1], instructors’ perceived [y2], and norm
referenced [y3]).
H2·1.2.3: xy1.2.3 0
3. Ho: There is no difference between instructors’ sex and their level of
creativity (student perception [y1], instructors’ perceived [y2], and norm
referenced [y3]).
H0·1.2.3: xy1.2.3 = 0
H1: Differences exist between instructors’ sex and their level of creativity
(student perception [y1], instructors’ perceived [y2], and norm referenced [y3]).
H3·1.2.3: xy1.2.3 0
109
4. Ho: There is no difference between instructors’ effective teaching as
perceived by students and level of creativity (student perception [y1],
instructors’ perceived [y2], and norm referenced [y3]).
H0·1.2.3: xy1.2.3 = 0
H1: Differences exist between instructors’ effective teaching as perceived by
students and level of creativity (student perception [y1], instructors’ perceived
[y2], and norm referenced [y3]).
H4·1.2.3: xy1.2.3 0
Limitations
This study can only be applied to creativity measured and observed in the specific
context of instruction. Additionally, limitations exist in the assessment of creativity. It is
important to identify the specific types of creativity tests used to measure creativity as a
domain of divergent thinking and self-perception. Given the complexity of defining
creativity, it is necessary to identify the limitations of applying findings to indicate all
creativity can be measured. In addition, the results of this study cannot be generalized to
any other group beyond CAFNR undergraduate instructors.
Research Design
This study was descriptive correlational in nature. Correlational research is widely
used in education research and “seeks to examine the strength and direction of
relationships among two or more variable” (Ary et al., 2002, p. 25). Ary et al. suggested
“information gained from such correlational studies is especially useful when trying to
understand a complex construct or to build a theory about some behavioral phenomenon”
(p. 25). Interpretation of correlations must include sample size, magnitude of the
110
correlation coefficient, and both the statistical significance as well as the practical
significance (Ary et al.).
Population and Sampling
Two populations were identified for this non-experimental study. To establish an
accurate frame recommended by Dillman (2007), the frame for both populations included
electronic mail accounts assigned by the University of Missouri for students and faculty
members. The frame was selected from a reliable list of all faculty and instructors
provided by the CAFNR dean’s office.
Instructor Population
The specific criteria for the first population included instructors teaching all
sections of CAFNR undergraduate courses, excluding seminar, research and special
problems courses, in the 2007 fall semester (N= 44). The instructors identified as the
subjects for the initial segment of the study were also used to establish the frame for the
student population.
Student Population
The population for the student component of the study included all students
enrolled in College of Agriculture, Food and Natural Resources (CAFNR) courses being
taught by CAFNR instructors who had previously been identified as the population for
the instructor component of this study.
Instructor Sampling
A time and place sample was conducted for instructors teaching undergraduate
CAFNR courses during the fall, 2007 semester. The use of a time and place sample, as
suggested by Oliver and Hinkle (1982) was justified as the instructor population could be
111
considered representative of future populations in CAFNR at the University of Missouri.
The population resulted in 43 instructors who met the criteria. Because all members of
the population were included in the study, sampling procedures were not imposed. As a
result, the treat of sampling error was not a consideration in this study.
Student Sampling
Probabilistic sampling was used for the student population. Because students were
considered an intact group, cluster sampling was considered appropriate for this
population. “Individuals constitute a cluster insofar as they are alike with respect to
characteristics relevant to the variables of the study” (Ary et al., 2002, p. 168). As
suggested by Ary et al., all members of each cluster were included in the sample. To
account for cluster size, courses were selected where the cluster represented a minimum
of twenty-five students. Students were arranged by cluster and assigned to a specific
cluster if they had more than one CAFNR course. To be confident the accepting sample
approximated members of each cluster, a response rate of 50% or a minimum number of
30 responses was required for each cluster to be included in the population. All students
identified as intact groups of CAFNR instructors were included in the sample,
eliminating the treat of sampling error.
Instrumentation
Two separate data collection instruments were used to assess the creativity of
instructors in CAFNR at MU. The Abbreviated Torrance Test for Adults (ATTA) was
used as an established, standardized measure of creativity. A researcher developed
questionnaire (Appendix A) was used to assess the teaching effectiveness and creative
teaching of instructors, as perceived by students. A researcher developed questionnaire
112
(Appendix B) was used to assess instructors’ self-perceived creative teaching behaviors.
Finally, demographic data were collected directly from the instructor population.
Abbreviated Torrance Test for Adults (ATTA)
The ATTA is comprised of four norm-referenced areas, including fluency,
originality, elaboration, and flexibility. In addition, criterion-referenced creativity
indicators comprised the ATTA, including verbal responses, and figural responses
After combining the norm-referenced scaled scores with the criterion-referenced
creativity indictors, a creativity index was created. The creativity index was then
compared to normed data from the Scholastic Testing Service (Goff & Torrance).
Creative and Effective Teaching Assessment
A researcher-developed instrument, called the Creative and Effective Teaching
Assessment (CETA) was developed and used to assess students’ perceptions of creative
and effective teaching behaviors of their university instructors. A shortened version of the
CETA was used to assess the self-perceived creative teaching behaviors of CAFNR
instructors.
The CETA questionnaire consisted of two sections. The first part addressed
students’ perceptions of the creativity exhibited by instructors in their teaching. Four
constructs were identified from the Torrance creativity test. These four areas included
fluency, originality, elaboration and flexibility. For each construct, four questions were
constructed. Each response was given a numeric value to be summated to create a total
scale score (Ary et al.). The 16 items were measured on a seven point Likert scale: 1 =
Strongly Disagree; 2 = Disagree; 3 = Slightly Disagree; 4 = Undecided; 5 = Slightly
Agree; 6 = Agree; and 7 = Strongly Agree.
113
The second component of the questionnaire assessed effectiveness of the
instructors, as perceived by their students. This part of the questionnaire consisted of 15
questions designed to assess the top 5 characteristics of effective teachers identified by
Rosenshine and Furst (1971). These characteristics included the following: clarity;
variability; enthusiasm; task-oriented/ businesslike behavior; and opportunity to learn
criterion material.The CETA was developed as an Internet web survey. Dillman’s (2007)
recommendations for online data collection procedures were followed.
Validity and Reliability
Validity is the assumption that instruments measure what they intend to measure
(Ary et al., 2002). Validity is “the most important consideration in developing and
evaluation measuring instruments” (Ary et al., p. 242). In addition, validity requires both
face and content validity. Face validity requires instruments to “appear valid for its
intended purpose” (Ary et al., p. 409). Content validity suggests the questionnaire
measures what it purports to measure.
The use of a standardized instrument, the ATTA, addressed concerns for validity
and reliability. The Scholastic Testing Service (Goff & Torrance, date) previously
established both validity and reliability.
Validity and reliability for the CETA were addressed by the use of both a panel of
experts and a pilot test group. The CETA questionnaire was examined from the panel of
experts (Appendices A &B), who made suggestions and improvements to the instrument.
Next, the CETA was administered to a sample of 47 students MU who had similar
characteristics as the population. A Cronbach’s alpha was computed to determine the
internal reliability of the instrument for both the instructor and student pilot tests. For the
114
student pilot test, a Cronbach’s alpha level of .97 (n = 37) was found for the entire
instrument. The internal reliability for the instructor effectiveness construct measure by
the student pilot was .92 (n = 38). The student pilot for the four creativity constructs
resulted in a Cronbach’s alpha of .96 (n = 38). The four creativity constructs were
evaluated for reliability. The Cronbach’s alpha for fluency ( = .81; n =39), flexibility (
= .87; n = 40), originality ( = .89; n =38), and elaboration ( = .89; n = 40) were each
deemed acceptable reliability levels. The instructor pilot test’s Cronbach’s alpha for the
four creative constructs was .84 (n = 28), which suggested the instrument offered internal
consistency in measuring the intended variables. Each individual construct was also
examined, including the following: fluency ( = .46; n = 30); flexibility ( = .74; n = 28);
originality ( = .77; n = 29); and elaboration ( = .68; n = 29).
Data Collection
Student Population
The student population was first contacted with an electronic mail message on
December 18, 2007, with a request to participate in the study (Appendix D). The
electronic letter was personalized to increase response rate and included a direct link to
the questionnaire. In addition, the course instructor was listed and the students were
assigned a personal code number, which was also indicated in the contact letter. Students
were asked to access the direct link to the questionnaire, enter their code and complete
the instrument based upon the instructor indicated in the electronic contact letter. A total
of 1674 students were contacted and 350 responded after the first request. Dillman (2007)
suggested the time between contacts should be “shorted from one week to two or three
days in order to increase the likelihood that the recipient will connect the memory of the
115
first contact with the second” (p. 368). Therefore, a second request to participate in the
study was sent to the students on December 21, 2007 (Appendix E). A total of 252
students responded following the second contact. A third request for participants was sent
on January 2, 2008 (Appendix F). A total of 268 students responded to the third contact.
Finally, participants from clusters which had less than 30 or less than 50% response rate
were identified and a forth contact was made (Appendix G). Fifty-one students responded
to the final contact. A final response rate of 55% was recorded. However, 15 student
electronic mail boxes were full and failed to receive the invitations to participate. The
adjusted response rate was 73.80 %. The student responses yielded 40 clusters which
comprised the final student accepting population.
Instructor Population
The initial contact with instructor population was also through electronic mail
(Appendix H). The first correspondence and invitation to participate in the study was sent
on January 8, 2008. A total of 44 instructors were identified in the population. One
instructor left for sabbatical and was unable to participate in the study. Three instructors
did not agree to participate and were removed from the study. Of the remaining 40
instructors, 22 responded to the first correspondence. A follow-up invitation, as well as
the invitation to participate in the standardized instrument component of the study, was
sent on January 14, 2008 (Appendix I). A third and final follow-up electronic mailing
was sent on January 18, 2008 (Appendix J). The instructors were invited to attend one of
five meetings to complete the ATTA assessment. Refreshments and a drawing for
CAFNR apparel were given to increase attendance. Personal follow-up was made with
116
instructors who did not attend the scheduled assessment times. Through these procedures,
data were collected for 40 instructors.
Data Analysis
The methods used for data analysis for each research question was selected based
upon the type of data and nature of the question.
Research question one sought to determine the demographic data of instructors,
including sex, years of teaching experience, age, and teaching discipline. Basic
descriptive statistics were used to summarize these data.
Research question two sought to determine the self-perceived level of creative
teaching effectiveness of instructors. Summated, interval data from the CETA were
described using a grand mean representative of the 16 items. Standard deviations were
used to describe the range and variance of the measure.
Standard deviations were used to describe the range and variance of the measure for
research questions three through five. Research question three sought to determine the
level of norm referenced creativity of instructors. Summated, interval data from the
ATTA were described using a grand mean representative of the four constructs. Research
question four sought to determine the level of creative behaviors exhibited by instructors,
as perceived by their students. Summated, interval data from the CETA were described
using a grand mean representative of the 16 items. Research question five sought to
determine the level of effectiveness of instructors, as perceived by their students.
Summated, interval data from the CETA were described using a grand mean
representative of the 16 items.
117
Research question six sought to determine the relationship between creative
behaviors of instructors, as perceived by students, effective teaching behaviors of
instructors, as perceived by students, instructors’ perceived creativity, and instructors’
norm-referenced creativity. Pearson product moment correlations were used to analyze
the interval data.
Research question seven sought to determine the relationship between instructor
effectiveness, as perceived by students, and instructors’ perceived creativity, and
instructors’ norm-referenced creativity. The interval data were analyzed using Pearson’s
correlation.
Research question eight sought to determine the amount of variance in norm
referenced creativity, as measured by the ATTA, accounted for by age, sex, experience,
and discipline. A simple linear regression model was calculated to determine the amount
of variance in norm referenced creativity accounted for by age, sex, experience, and
discipline.
Research question nine sought to determine the amount of variance in self-
perceived creative teaching behaviors, as measured by the CETA, accounted for by age,
sex, experience, and discipline. A simple linear regression model was calculated to
determine the amount of variance in self-perceived creative teaching behaviors accounted
for by age, sex, experience, and discipline.
The null hypothesis for the first hypothesis was there was no difference between
discipline (natural/physical or social science) and level of creativity (student perception,
instructors’ perceived, and norm referenced). This hypothesis compared nominal and
interval data; therefore, a point-biserial coefficient was calculated.
118
The null hypothesis for hypothesis two was that no differences existed between
experience and level of creativity (student perception, instructor’s perceived, and norm
referenced). Instructor experience was nominal data and forced into a dichotomy
containing experienced (five years of teaching or greater) and novice (less than five years
of teaching). Therefore, a point-biserial coefficient was calculated and used to compare
student perceptions of instructor’s level of creativity, instructor’s self-perceived level of
creativity and instructor’s norm referenced level of creativity.
Null hypothesis three stated that no differences existed between sex and level of
creativity (student perception, instructor’s perceived, and norm referenced). A point-
biserial correlation was calculated to compare the nominal and interval data.
Null hypothesis four suggested no relationship between effective teaching as
perceived by students and level of creativity (student perception, instructor’s perceived,
and norm referenced). A Pearson product-moment correlation was calculated for the
summated, interval data.
Findings
Research QuestionOne
Research question one sought to identify demographic characteristics of CAFNR
instructors. CAFNR instructors were predominately male and averaged 47 years of age.
The participants averaged slightly less than 16 years of teaching experience. However,
teaching experienced ranged from one to 47 years. Roughly two-thirds (62.5%) of
instructors taught in the natural/biological science disciplines.
119
Research Question Two
Research question two sought to determine the self-perceived level of creative
teaching behaviors used by instructors. The mean for self-perceived creative teaching
behaviors of CAFNR instructors was 5.73. Elaboration was the most highly ranted of the
four creativity constructs. Originality was the lowest ranked construct, yet it yielded the
greatest range.
Research Question Three
Research question three asked the norm-referenced creativity of participants, as
measured by the ATTA. Elaboration was the highest individual construct, while the
lowest construct was flexibility. The overall, summated creativity index of participants
was 79.69, with a range in scores from 61 to 97. This score was higher than the normed
score provided by Scholastic Testing Services (Goff &Torrance, 2002).
Research Question Four
Research questionfour determined students’ perceptions of creative teaching
behaviors of their CAFNR instructors. Data from the creativity component of the CETA
was summated and each of the four constructs were analyzed. The perceived creative
teaching behaviors held by students resulted in a summated mean of 5.43 on a scale
ranging from one to seven. Students rated behaviors associated with the creative
construct of elaboration highest, although this construct also had the greatest range.
Originality was the construct rated lowest by the students.
Research question four determined students’ perceptions of creative teaching
behaviors of their CAFNR instructors. Data from the creativity component of the CETA
was summated and each of the four constructs was analyzed. The perceived creative
120
teaching behaviors held by students resulted in a summated mean of 5.43 on a scale
ranging from one to seven. Students rated behaviors associated with the creative
construct of elaboration highest, although this construct also had the greatest range.
Originality was the construct rated lowest by the students.
Research Question Five
Research question five determined students’ perception of effective teaching, as
measured by the CETA. Students agreed that their teachers used all five of the
characteristics of effective teaching evaluated by the CETA. Comparatively, students
rated enthusiasm highest and variability lowest.
Research Question Six
The purpose of research question six was to determine the relationship between
students’ perceptions of their teacher’s effectiveness and students’ perceptions of their
teacher’s creative teaching behaviors, norm-referenced creativity and the instructors’
perceived creative teaching behaviors. Students’ perception of effective teaching and
students’ perception of creative teaching behaviors were positively and significantly
correlated. However, a negative, negligible and non-statistically signification relationship
was found between students’ perceived effective teaching and the instructors’ norm
referenced creativity, as measured by the ATTA. Additionally, a negative, negligible and
non-significant relationship was found between students’ perceive effective teaching and
instructors’ perceived creative teaching, as measured by the CETA.
Research Question Seven
Research question seven determined the relationship between students’
perceptions of instructor effectiveness and instructors’ perceived creativity and
121
instructors’ norm-referenced creativity. Negligible and negative relationships were found
between students’ perceived effective teaching and measures of instructor creativity.
Research Question Eight
Research question eight asked the amount of variance in norm-referenced
creativity that could be explained by age, sex, discipline, and teaching experience.
Approximately 1.90 % of the variance in norm referenced creativity can be predicted by
the variables. However, none of the predictor variables had significant regression weights
in this study.
Research Question Nine
Research question nine determined the amount of variance in the instructors’
perceived creativity that can be explained by age, sex, discipline, and teaching
experience. Approximately 12 % of the variance in perceived teaching behavior can be
predicted by these variables. However, the model was not significant, as none of the
independent variables had significant regression weights.
Hypothesis One
The null hypothesis for the first hypothesis stated no differences existed between
discipline (natural/physical or social science) and level of creativity (student perception,
instructors’ perceived, and norm referenced). Students’ perceived creative teaching
behaviors of instructors, instructors’ norm-referenced creativity, as measured by the
ATTA and instructors’ self-perceived creative teaching behaviors were not statistically
significant.
122
Hypothesis Two
The null hypothesis for hypothesis two stated that no differences existed between
teaching experience and level of creativity (student perception, instructor perception, and
a norm referenced assessment). Instructors’ norm-referenced creativity, as measured by
the ATTA and instructors’ self-perceived creative teaching behaviors were not
statistically significant. However, there was a significant difference between creative
teaching behaviors of experienced and in-experienced instructors when evaluated by
students.
Hypothesis Three
Null hypothesis three stated that no differences existed between sex and level of
creativity (student perception, instructor perception, and a norm referenced assessment).
Students’ perceptions of the creative teaching behaviors of instructors, instructors’ norm-
referenced creativity, as measured by the ATTA, and instructors’ self-perceived creative
teaching behaviors were not statistically different when compared by sex.
Hypothesis Four
Null hypothesis four stated no relationship existed between effective teaching as
perceived by students and level of creativity (student perception, instructor perception,
and a norm referenced assessment). Effective teaching was compared to three creativity
measures. When forced into a dichotomy, a statistically significant difference was found
between effective and ineffective instructors when compared to students’ perceptions of
creative teaching behaviors. However, differences were not significantly different
between the two groups when compared to norm-referenced creativity and instructors’
perceived creative teaching behaviors of instructors.
123
Conclusions, Recommendations and Implications
The profile of a CAFNR teacher is: a middle-aged male who has taught courses
he describes as being in the natural/physical sciences for nearly sixteen years. These
characteristics must be taken into consideration when developing and delivering faculty
in-service programs intended to enhance the creativity and teaching effectiveness of this
group.
Research Question One
Research question one sought to determine demographic data and therefore, no
grounds for recommendations are suggested.
Research Question Two
CAFNR instructors believe they are creative in their teaching. Of the four
creativity constructs, instructors use elaboration most in their teaching and are least likely
to use originality in that same context. Considering the presence of creative teaching
behaviors, it can be concluded that instructors value creativity as a component of
teaching.
Although instructors believe they use creative teaching behaviors, can we identify
specific behaviors of creativity in teaching? Further research should include qualitative
methods to observe and record behaviors instructors use related to creativity. In addition,
training to help instructors learn to promote and embrace creative teaching practices may
be implemented to increase the occurrence of these creative teaching behaviors.
Research Question Three
Overall, CAFNR instructors have a high level of creativity, as measured by the
ATTA. It is interesting to note CAFNR instructors scored highest on the elaboration
124
construct of the ATTA. This conclusion matches the finding yielded from the self-
perceived creativity assessment described above. It is also important to note participants
did not follow the standardized curve typically seen on the norm-referenced instrument.
Rather, CAFNR instructors were screwed to the right, with the majority of participants
scored above average, high or substantial on the ATTA (72.50 %).
Another consideration in evaluating the results of the ATTA is that it may not be
the most accurate measure of university instructors, due to the lack of variance in the
population. Is this due to a higher intelligence of university faculty? While creativity has
been found to have a strong, positive correlation with intelligence (Cropley, 2001; Starko,
2005), there does appear to be a drop in creativity scores for highly intelligent
individuals. Extremely intelligent individuals may only display a moderate level of
creativity (Carson, Peterson, & Higgins, 2005; Crockenberg, 1972; Cropley; Starko).
Could the problem solving nature of research account for the difference? Problem solving
has been linked to creativity by many researchers (Croply, 2001; Dewey, 1920; Guilford,
1959; Marksberry, 1963; Starko, 2005; Torrance, 1995). In addition, Bain (2004)
suggested that teaching is a performance art. If teaching is an art and creativity
considered to be a critical component of art (Bain), does this suggest teachers should be
creative? Could the difference in ATTA scores be accounted for by the creative nature of
teaching?
Research Question Four
In general, students perceive that CAFNR instructors demonstrate creative
teaching behaviors. However, the range in scores indicates that students varied
considerably in their perceptions of instructor creativity in the classroom. Considering the
125
range of scores associated with student perceptions of instructors’ use of creative
teaching behaviors, it is apparent that students are capable of evaluating creativity in the
classroom. This conclusion is a valuable step in research about creativity of teachers.
Documentation of students’ perceptions of creative teaching does not appear to be
available in previous literature.
In addition, students agreed with their instructors regarding the presence of
creative teaching behaviors. Elaboration, frequency, flexibility, and originality constructs
are rated in the same order for both instructors’ perceived and students’ perceived
creative teaching behaviors. Instructors’ reported slightly more agreement with the
frequency of creative behaviors than did students. This suggests a slight difference in
perception between the two populations. Would qualitative data support these finding?
The CETA could be expanded to include qualitative data designed to determine instructor
behaviors that impact student perceptions of creative teaching.
Research Question Five
Students believe their instructors are effective teachers. Students agreed that their
instructors displayed clarity, variability, opportunity to learn, task oriented, and
enthusiasm in their teaching. Enthusiasm was the most frequently reported effective
teaching construct demonstrated by CAFNR faculty while variability was least observed
by students. These findings suggest that students generally believe their teachers
demonstrate enthusiasm in the classroom. The ranking of the variability construct
suggests students may not be exposed to a variety of instructional methods.
While students agreed that CAFNR instructors demonstrated effective teaching
characteristics, the range in scores also suggests students vary in their perceptions of
126
instructors. This indicates students can discern between effective and in-effective
instruction. If students can, in fact, differentiate between effective and in-effective
instructors, what behaviors do they identify as most important to effective teaching? It is
also interesting to note student perceptions of clarity demonstrated in the learning
environment. Variability and clarity had the greatest range in scores, which again
suggests students are capable of distinguishing when effective teaching behaviors occur.
Could high levels of agreement with some constructs, such as enthusiasm, actually reduce
other areas, such as clarity? Additional research should be conducted to determine which
methods instructors use in the learning environment. Defining and identify teaching
methods which improve clarity should also be the focus of future research. Finally,
faculty development programs should be designed to address increasing variability and
clarity in the learning environment.
Research Question Six
Students consider creative instructors to be effective instructors. The strong,
positive correlation between these two variables found in this study supports previous
findings comparing creative and effective teachers (Anderson, 2002; Bain, 2004;
Bleedron, 2003, 2005; Chambers, 1973; Croply, 1967, 2001; Davidovitch & Milgram,
2006; Esquivel, 1995; Fasko, 2000-01; Milgram, 1979; Newcomb et al., 1993; Renzulli,
1992; Torrance, 1981, 1995).
Hocevar (1981) suggested that the most effective method to evaluate creativity is
to ask the subjects. However, instructors’ perceived creativity did not produce a strong
correlation with effective teaching. Therefore, these findings appear to contradict
previous research.
127
Creative teaching behavior constructs should be compared to each characteristic
of effective teaching to provide more specific methods to improve effective teaching.
Research Question Seven
There is not a relationship between students’ perceptions of effective teaching and
instructor creativity. The negligible and negatively correlated relationships found
between these variables suggest differences exist between perceptions of effective
teaching held by students and instructors. If students perceive that creative teaching is
effective teaching, then identifying instructor creativity becomes paramount. Increasing
the creative teaching behaviors of instructors could thus lead to more effective teaching
in the eyes of the students.
This research should be replicated to determine if effective teaching, as perceived
by students, consistently differs from the self-perceived creative teaching behaviors of
university instructors. What methods do effective teachers, as perceived by students,
employ in the classroom and are these methods recognized by instructors? Can
instructors become more effective for students by increasing their creative approach to
teaching? Research should also be conducted to determine instructor’s perceptions of
effective teaching.
There is not a relationship between the ATTA and perceptions of creative
teaching behaviors. Thus, the ATTA is not an accurate measure of creative teaching
behaviors. Interesting, the ATTA was negatively correlated with both student and
instructor perceptions. The lack of agreement suggests there is little support for continued
use of the ATTA to measure creative teaching behaviors. While the ATTA has been
documented to support overall creativity, it appears creative teaching may be a more
128
difficult construct to measure. Hocevar (1981) and Feldhusen and Goh (1995) suggested
multiple methods to examine creativity. “Since each method is purported to be measuring
creativity, it is reasonable to predict that they be correlated, thus satisfying a minimum
condition of convergent validity” (Hocevar, p. 457). However, findings from this study
did not support the convergent validity suggested by Hocevar.
Research Question Eight
The negative correlation between age and norm-referenced creativity conflicts
with data that suggests creativity typically decreases around kindergarten, but usually
increases later in life (Starko, 2005). Also surprising is the negative relationship between
teaching experience and award recipients. This finding suggests instructors may not
become more effective in the classroom by simply increased experience. Thus, there is
additional support for faculty training that addresses the teaching and learning process.
Little variance in the ATTA could be accounted for by demographic data. Well
over 90 % of the variance in norm-referenced creativity remains unaccounted for and
should be considered the topic of future research.
Research Question Nine
While only 12% of the variance in instructors’ perceive creative teaching
behaviors could be explained by the demographic data, more variance was accounted for
than by the ATTA. What other factors might account for the variance in ATTA scores?
These findings are surprising, given the vast research on the ATTA instrument (Torrance,
1995). The majority of the variance remains unexplained and should be the subject of
future research.
129
Hypothesis One
Creativity does not appear to vary between natural/physical and social science
disciplines. Therefore, the null hypotheses that no differences existed between disciple
and level of creativity (student perception, instructors’ perceived, and norm referenced),
was accepted.
All three measures of creativity failed to show significant differences, suggesting
disciple is not a factor to consider when addressing creativity of university instructors.
Perhaps due to the research environment found in both natural/physical and social
sciences within CAFNR, creativity does not appear to differ. It would appear appropriate
to address all instructors, regardless of discipline, in future research. In addition,
educational opportunities to enhance creativity may be appropriately targeted to both
natural/physical and social science disciplines.
The consistency of creativity across disciplines may also provide new areas for
understanding between the vastly different disciplines. In addition, the ability to enhance
effective teaching by increasing creative teaching behaviors should be examined. Do
differences in effective teaching occur between disciplines? If creativity does not appear
to vary between disciplines, would measures to enhance creative teaching behaviors be
effective in both disciplines?
Hypothesis Two
Teaching experience does not impact the self-perceived or norm-referenced
creativity of CAFNR instructors. It would seem appropriate to consider all instructors in
future efforts to enhance creativity. However, there was a significant difference between
students’ perceived creative teaching behaviors of CAFNR instructors and the experience
130
of these instructors. Therefore, the null hypotheses that no differences existed between
teaching experience and level of creativity was rejected.
Students suggest instructors with more than five years of teaching experience
exhibit more creative teaching behaviors. Because students are the ultimate consumer of
education offered by instructors, this is an important finding. Further research should
address what specific behaviors experienced instructors demonstrated in the classroom
which led to the significant differences in student perceptions of creative teaching
behaviors. Again, it is important to consider the differences between instructors’
perceptions and students’ perceptions. Additionally, would student perceptions of
creative teaching be consistent with creative behaviors identified by instructors?
Additional qualitative and quantitative research may shed light on these behaviors.
Hypothesis Three
Creativity does not appear to differ between sex. Therefore, the null hypotheses
that no differences existed between sex and level of creativity was accepted. Sex does not
appear to be a significant factor when examining creativity of CAFNR instructors. The
apparent absence of a gender gap suggests both groups could be addressed by similar
professional development opportunities regarding creativity. It is important to note that
sex and teaching disciples are the only areas where the three creativity measures appear
to have similar rankings for the creativity constructs. However, does effective teaching
differ by sex? Would female students differ in their perceptions of effective teaching than
their male counterparts? Further research should address the differences between sex and
effective teaching.
131
Hypothesis Four
Effective instructors, as perceived by students, do not appear to differ when
compared to instructors’ self-perceived creative teaching behaviors and norm-referenced
creativity. However, because there was a significant difference between students’
perceived creative teaching behaviors of effective and ineffective instructors. Therefore,
the null hypothesis was rejected in favor of the research hypothesis. This finding suggests
the creativity of effective instructors, as perceived by students, cannot be linked to
instructors’ perceived creative teaching behaviors or the ATTA. Thus, neither of these
instruments would be suggested to evaluate effective teaching.
However, the creative teaching behaviors of CAFNR instructors, as perceived by
students, did differ between effective instructors. This suggests students were capable of
identifying effective instructors and supports the previous findings that effective teaching
is closely related to creative instruction. This finding also supports the value students
place upon creativity. If effective teaching is directly related to creative teaching, then
more creative instructors may be more effective for students. Replication of this research
should be conducted to support the findings between student perceptions of creative
teaching behaviors demonstrated by instructors and student perceptions of effective
teaching.
132
REFERENCES
Ai-girl, T.,& Lai-Chong, L. (2004). Creativity for teachers. Singapore: Marshall Cavendish International.
Amabile, T. (1996). Creativity in context. Boulder, CO: Westview Press Harper Collins Publishers.
Amabile, T. (1987). The motivation to be creative. In S.Isaksen, Frontiers in creativity
research: Beyond the basics (pp. 223-254). Buffalo, NY: Bearly Limited.
Anastasi, A. (1976). Pychological testing. New York: Macmillan Publishing.
Anderson, D. (2002). Creative teachers: Risk, responsibility and love. Journal of
Education, 183 (1), 33-48.
Ary, E., Jacobs, L.C., & Razavieh, A. (2002). Introduction to research in education (6th ed.). Belmont, CA: Wadsworth/Thomson Learning.
Aschenbrener, M.A., Terry, R., Torres, R.M., & Smith, A.R. (2007). Creativity and job satisfaction. American Association of Agricultural Educators National Research
Conference. Minneapolis, MN.
Bain, K. (2004). What the best college teachers do. Massachusetts: Harvard University Press.
Baker, M., Rudd, R., & Pomeroy, C. (2001). Relationships between critical and creative thinking. Journal of Southern Agricultural Education, 51(1), 173-188.
Beidler, P. (1997). What makes a good teacher. In J. Roth, Inspiring teaching. Carnegie
professors of the year speak (pp. 2-12). Bolton, MA: Anker Publishing Company.
Berry, W.D.,& Feldman, S. (1985). Multiple regression in practice. Newbury Park, CA: SAGE Publications.
Bleedorn, B. (2003). An educational track for creativity & other quality thinking
processes. Lanham, Maryland: The Scarecrow Press, Inc.
Bleedron, B. (2005). Education is everybody's business. Lanham, Maryland: Rowman & Littlefield Education.
Bloom, B. (1956). Taxonomy of educational objectives: The classification of educational
goals handbook I: Cognitive domain. New York: Longmans, Green & Co.
Buchanan, P. (1997). Inspiring teaching. (J. Roth, Ed.) Bolton, MA: Anker Publishing Company, Inc.
133
Carson, S H., Peterson, J.B., & Higgins, D.M. (2005). Reliability, validity and factor structure of the creative achievement questionnaire. Creativity Research Journal,
17 (1), 37-50.
Chambers, J. (1973). College teachers: Their effect on creativity of students. Journal of
Educational Psychology, 65 (3), 326-334.
Craft, A. (2001). An analysis of research and literature on creativity in education. Report prepared for the Qualifications and Curriculum Authority.
Craft, A. (2005). Creativity in schools: Tensions and dilemmas. New York: Routledge.
Crockenberg, S. (1972). Creativity tests: A boon or boondoggle for education. Review of
Educational Research, 42 (1), 27-45.
Cropley, A. (1967). Creativity. London: Longmans, Green & Co LTD.
Cropley, A. (2001). Creativity in education & Learning. Bodmin, Cornwall: RoutledgeFalmer.
Csikszentmihalyi, M. (1996). Creativity: Flow and the psychology of discovery and
invention. New York: Harper Collins.
Csikszentmihalyi, M. (1988). Society, culture, and person: A systems view of creativity. In R. S. (Ed.), The nature of creativity (pp. 325-339). New York: Cambridge University Press.
Dacey, J. (1989). Fundementals of creative thinking. Lexington, MA: Lexington.
Davidovitch, N., & Milgram, R.M. (2006). Creative thinking as a predictor of teacher effectiveness in higher education. Creativity Research Journal, 18 (3), 385-390.
Davis, J. (1971). Elementary survey analysis. Englewood, New Jersey: Prentice-Hall.
Dillman, D. (2007). Mail and internet surveys: The tailored design method (2 ed.). Hoboken, New Jersey: John Wiley & Sons, Inc.
Esquivel, G. (1995). Teacher behaviors that foster creativity. Educational Psychology
Review, 7 (2), 185-202.
Fasko, D. J. (2000-2001). Education and creativity. Creativity Research Journal, 13 (3 & 4), 317-327.
Feldhusen, J.F., & Goh, E. E. (1995). Assessing and accessing creativity: An integrative review of theory, research, and development. Creativity Reserach Journal, 8 (3), 231-147.
Feldman, K. (1976). The superior college teacher from the student's view. Research in
Higher Education, 5, 243-288.
134
Foster, J. (1971). Creativity and the teacher. London: Macmillam Ed. LTD.
Fox, J.,& Fox, R. (2000). Exploring the nature of creativity. Dobuque, IA: Kendall/Hunt Publishers.
Friedel, C.,& Rudd, R. (2005). Creative thinking and learning styles in undergraduate agriculture students. National AAAE Reserach Conference, (pp. 199-211).
Gall, M.D., Gal, J.P., & Borg, W.R. (2003). Educational Research: An introduction (7th ed.). Boston: Pearson Education.
Gardner, H. (1993). Multiple intelligences. The theory in practice. New York: Basic Books.
Gay, I.R., & Airasian, P. (2000). Competencies for analysis and application (Sixth ed.). Upper Saddle River, New Jersey: Prentice-Hall, Inc.
Goff, K.,& Torrance, E.P. (2002). Abbreviated Torrance test for adults manual. Illinoise: Scholastic Testing Service.
Gough, H. (1979). A creative personality scale for the adjective check list. Journal of
Personality and Social Psychology, 37 (8), 1398-1405.
Gowan, J. (1972). Development of the creative individual. San Diego, CA.: R.R. Knapp.
Gowan, J.C., Khatena, J.,& Torrance, E.P. (1967). Creativity: Its educational
implications. Dubuque, Iowa: Kendall/Hunt Publishing Company.
Guilford, J. (1950). Creativity. American Psychologist, 444-454.
Hasse, C. (2001). Institutional creativity: The relational zone of proximal development. Culture & Psychology, 7 (2), 199-221.
Hennessey, B.A.,& Amabile, T.M. (1987). Creativity in learning. Washington D.C.: NEA Professional Library.
Hocevar, D. (1981). Measurement of creativity: Review and critique. Journal of
Personality Assessment, 45 (5), 450-464.
Karnes, M.B., McCoy, G.F., Zehrbach, R.R., Wollersheim, J.P., Clarizio, H.F., Costin, L., & Stanley, L.S. (1961). Factors associated with underachievement and
overachievement of intellectually gifted children. Champaign, IL: Champaign Community Unit Schools.
Mack, R. (1987). Are methods of enhancing creativiity being taught in teacher education programs, as perceived by teacher educators and students? Journal of Creative
Behavior, 21, 22-23.
135
MacKinnon, D. (1962). The nature and nurture of creative talent. American Psychologist,
17, 484-95.
MacKinnon, D. (1962). The nature and nurture of creative talent. American Psychologis,
17, 484-495.
Marksberry, M. L. (1963). Foundations of creativity. New York: Harper & Row.
Maslow, A. (1968). Towards a psychology of being (2nd ed.). Princeton, New Jersey: Van Nostrand.
Massialas, B.G., & Zevin, J. (1983). Mulabar, Florida: Robert E. Krieger Publishing Company.
McKeachie, W. (1983). The role of faculty evaluation in enhancing college teaching. National Forum, 63 (1), 37-39.
Mednick, S. (1962). The associative basis of the creative process. Psychological Review,
69 (3), 220-232.
Milgram, R. (1979). Perceptions of teacher behavior in gifted and nongifted children. Journal of Educational Psychology, 71 (1), 125-128.
Miller, L.E. (1998). Appropriate analysis. Journal of Agricultural Education, 39 (2), 1-10.
Miller, W.W., Kahler, A. A., & Rheault, K. (1999). Profile of the effective vocational agriculture teacher. Journal of Agricultural Education, 30 (2), 33-40.
Mumford, M. (2003). Where have we been, where are we going? Taking stock in creativity research. Creativity Research Journal, 15 (2), 107-120.
Newcomb, L.H., McCracken, J.D., & Warmbrod, J.R. (1993). Danville, Illinois: Interstate Publishers.
Nicholls, G. (2002). Developing teaching and learning in higher education. New York: Routledge Falmer.
Oliver, J.,& Hinkle, D. (1982). Occupational educational research: Selecting statistical procedures. Journal of Studies in Technical Careers, 4 (3), 199 - 207.
Perkins, D. (1994). Creativity: Beyond the Darwinian paradigm. In M. B. (Ed.), Dimensions of creativity (pp. 119-142). Cambridge, MA: MIT Press.
Perkins, D. (1981). The mind's best work. Cambridge, MA: Harvard University Press.
Perkins, D. (1988). The possibility of invention. In R. S. (Ed.), The nature of creativity (pp. 362-385). New York: Cambridge University Press.
136
Plucker, J.A., Beghetto, R.A., & Dow, G.T. (2004). Why isn't creativity more important to educational psychologists? Potentials, pitfalls, and future directions in creativity research. Educational Psychologist, 39 (2), 83-96.
Reid, D.J.,& Johnstone, M. (1999). Improving teaching in higher education: Student and teacher perspectives. Educational Studies, 269-281.
Renzulli, J. (1992). A general theory for the development of creative productuvuty through the pursuit of ideal acts of learning. Gifted Child Quarterly, 36, 170-182.
Roberts, T.G & Dyer, J. E. (2004). Characteristics of effective agriculture teachers. Journal of Agricultural Education, 45 (4), 82-95.
Rogers, C. (1962). Toward a theory of creativity. In S. P. Harding, A source book for
creative thinking. New York: Scribner's.
Rosenshine, B. & Furst, N. (1971). Research on teacher performance criteria. In O. S. (Ed.), Research in Teacher Education (pp. 37-72). Englewood Cliffs, NJ: Prentice Hall.
Runco, M. A. (1997). The Creativity research handbook (Vol. 1). Cresskill, New Jersey: Hampton Press.
Runco, M.A., & Chand, I. (1995). Cognition and creativity. Educational Psychology
Review, 7, 243-267.
Ruscio, J., Whitney, D.M., & Amabile, T.M. (1998). Looking inside the fishbowl of creativity: verbal and behavioral predictors of creative performance. Creativity
Research Jouranl, 11 (3), 243-263.
Salant, P. & Dillman, D.A. (1994). How to conduct your own survey: Leading
professionals give you proven techniques for getting reliable results. New York: John Wiley.
Simonton, D. (1988). Creativity, leadership, and chance. In R. (Ed.), The nature of
creativity (pp. 386-426). New York: Cambridge University Press.
Skinner, B. (1972). Cummulative record. A selection of papers (3rd ed.). New York: Meredith Corporation.
Skinner, B. (1972). Cumulative record: A selection of papers (3rd ed.). Englewood Cliffs, NJ: Prentice-Hall.
Starko, A. (2005). Creativity in the classroom: Schools of curious delight (third ed.). Mahwah, New Jersey: Lawrence Erlbaum Associates.
Sternberg, R. (1999). Handbook of creativity. (R. Sternberg, Ed.) New York: Cambridge University Press.
137
Sternberg, R. (2006). The nature of creativity. Creativity Research Journal, 18 (1), 87-98.
Sternberg, R.J.,& Lubart, T.I. (1991). An investement theory of creativity and its development. Human Development, 34, 1-32.
Swartz, R.,& Parks, S. (1994). Infusing the teaching of critical and creative thinking into
content instruction: A lesson design handbook for the elementary grades. Pacific Gove, CA: Critical Thinking Press and Software.
Tan, A.G., & Law,L.C. (2004). Creativity for teachers. Singapore: Marshall Cavendish International.
Torrance, E. (1981). Creative teaching makes a difference. In J. K. J.C. Gowan, Creativity: Its educational implications (2nd ed., pp. 99-108). Dubuque, IA: Kendall/Hunt.
Torrance, E. (1995). Why fly? A philosophy of creativity. Norwood, New Jersey: Ablex Publishing Corporation.
Torrance, E.P.,& Khatena, J. (1970). What kind of person are you? Gifted Child
Quarterly, 14, 71-75.
Vygotsky, L. (1960). Imagination and its development in childhood. In L. V. (Ed.), The
development of higher mental function (pp. 327-362). Moscow: Izdatel'stvo Academii Pedagogicheskikh Nauk RSFSR .
Wallach, M.S., & Kogan, N. (1965). Modes of thinking in young children: A study of the
creativity - intelligence distinction. New York: Holt, Reinhart & Winston.
Wallas, G. (1926). The art of thought. New York: Harcourt Brace.
Weisberg, R. (1986). Creativity: Genius and other myths. New York: Freeman.
Weisberg, R. (1988). Problem solving and creativity. In R. S. (Ed.), The nature of
creativity (pp. 148-176). New York: Cambridge University Press.
Westmeyer, P. (1988). Effective teaching in adult and higher education. Springfield, Illinois: Charles C. Thomas.
Young, S.,& Shaw, D.G. (1999). Profiles of effective college and university teachers. The
Journal of Higher Education, 70 (6), 670-686.
138
APPENDICES
APPENDIX A
Creative and Effective Teaching Assessment Student Instrument
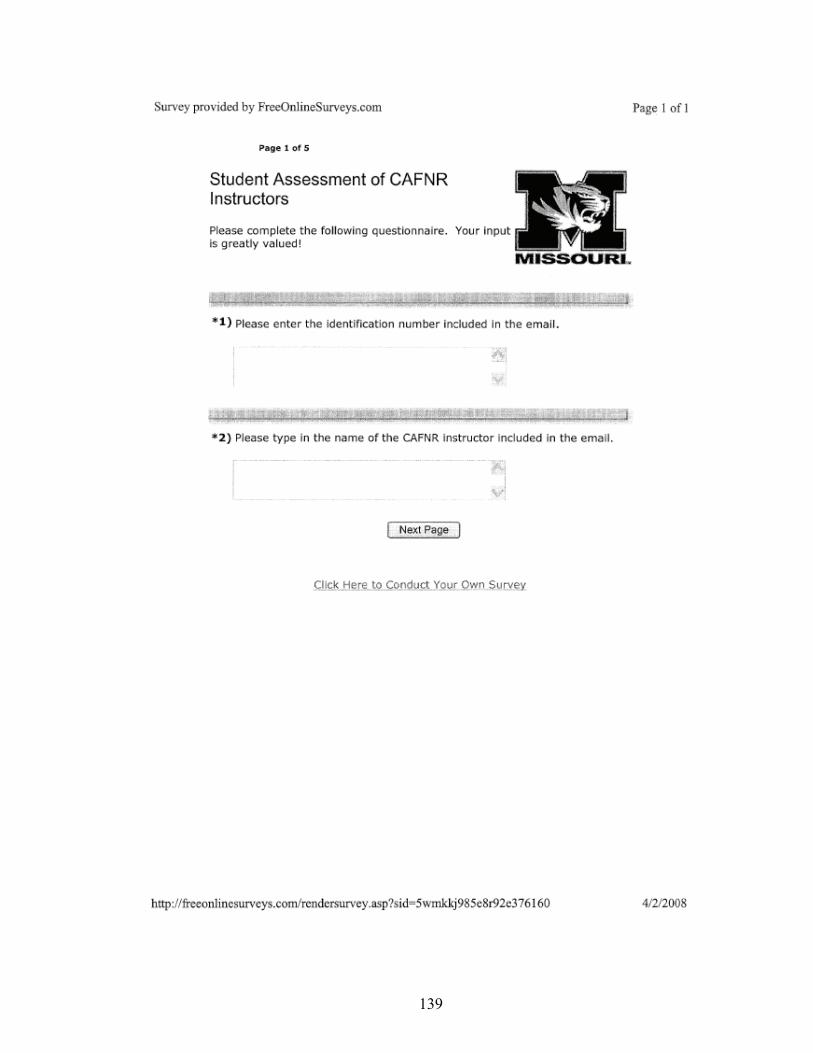
139
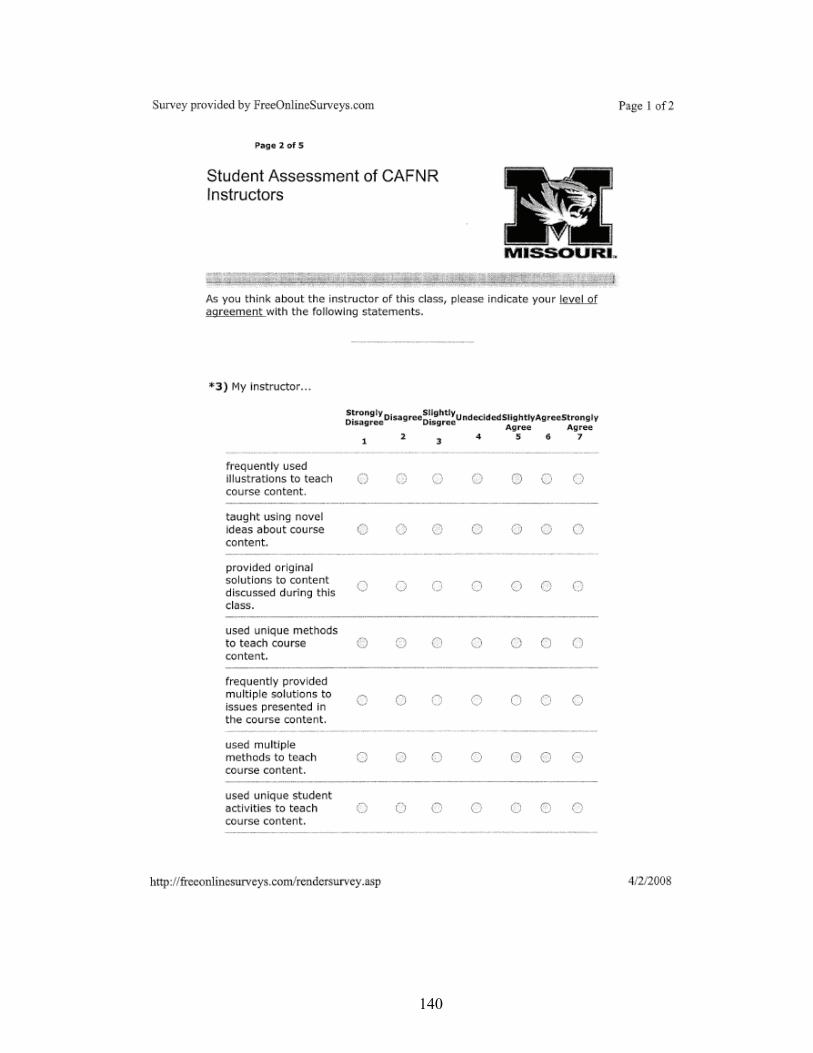
140

141

142

143
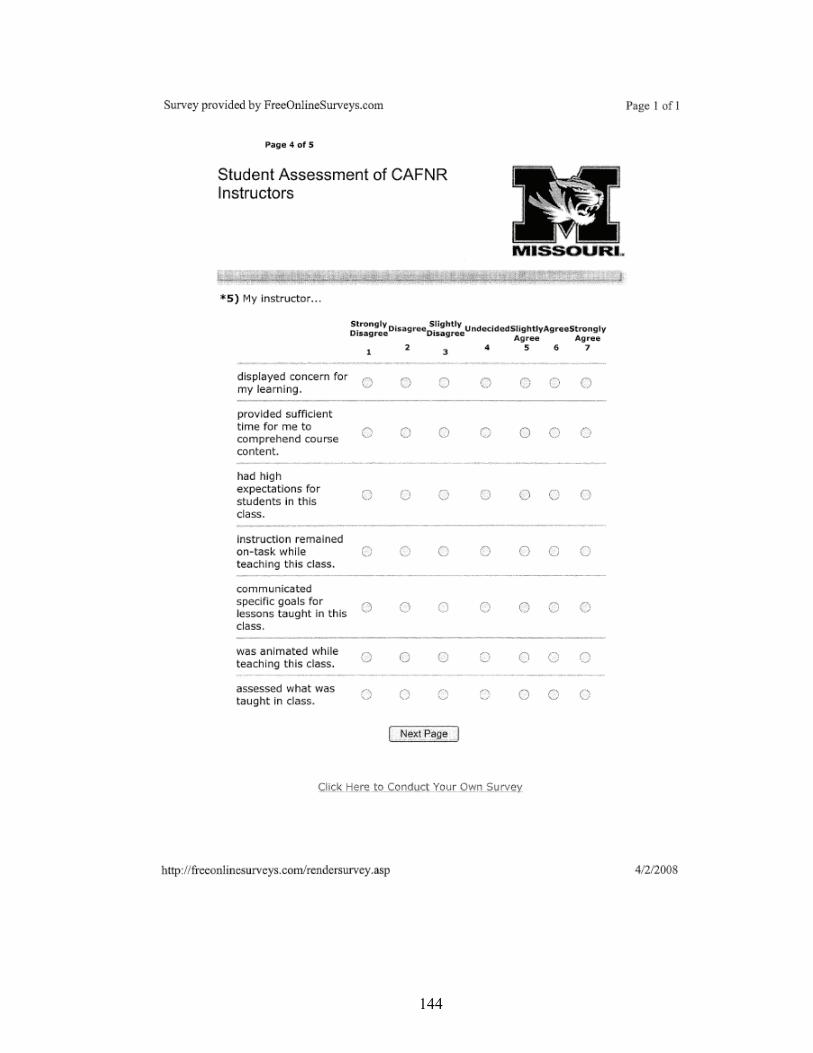
144
145
APPENDIX B
Creative and Effective Teaching Assessment Instructor Instrument
146
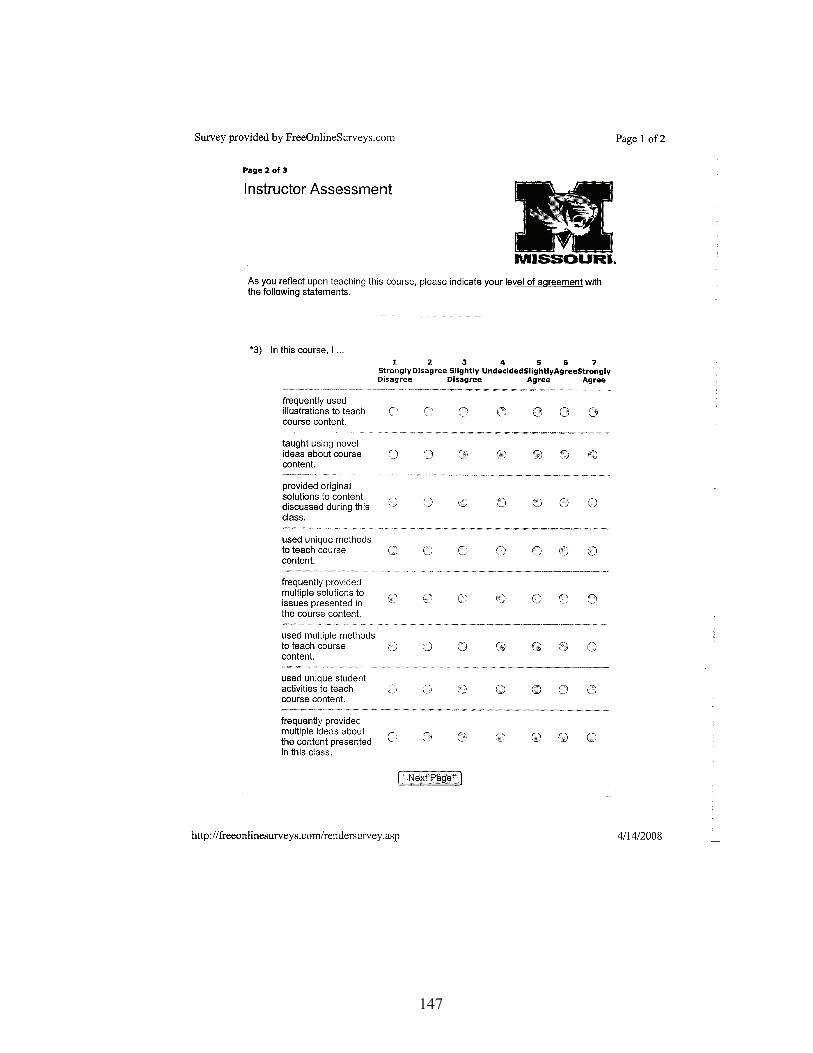
147
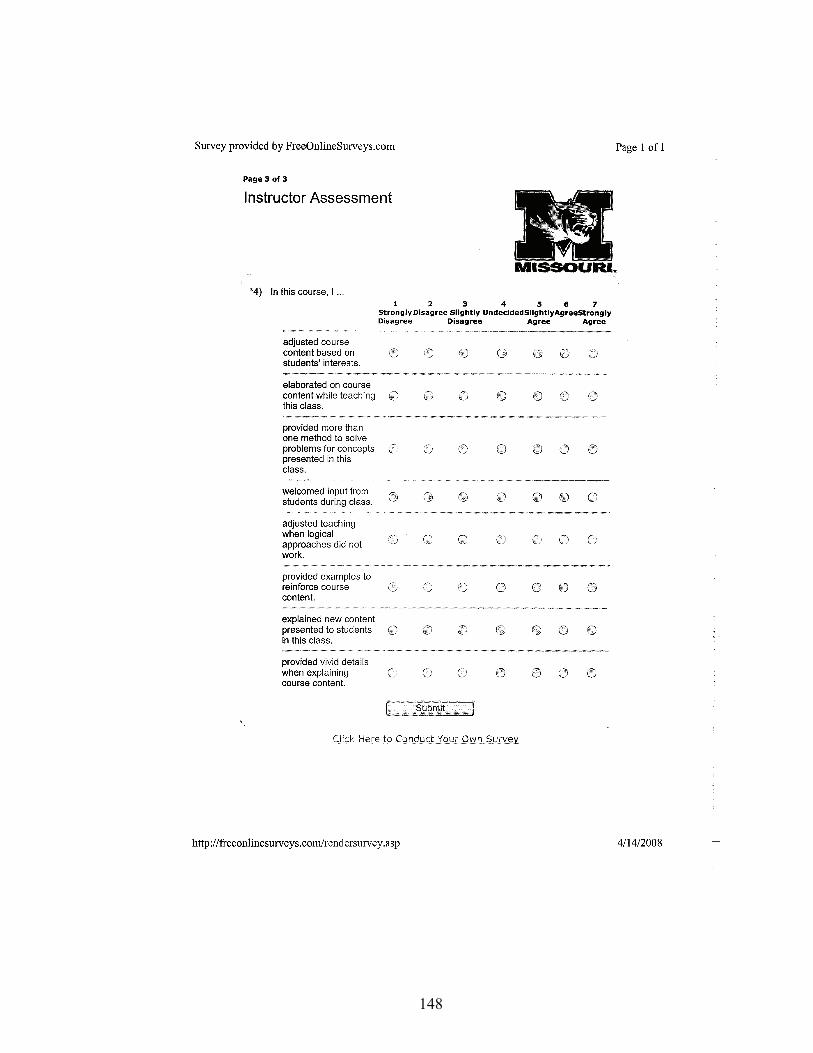
148

149
APPENDIX C
Panel of Experts
150
Panel of Experts Consisted of:
Dr. Bryan Garton, Data Analysis
Dr. Rob Terry, Content Expert
Dr. Robert Torres, Data Analysis
Dr. Jonathan Ulmer, Content Expert
151
APPENDIX D
First Student Electronic Mail Contact
152
Dear «Student_Name»:
The College of Agriculture, Food and Natural Resources is committed to providing
Mizzou students with high quality instruction. As a CAFNR student, you have the
opportunity to provide feedback on the teaching effectiveness of your CAFNR
instructors.
What are we asking? We would like you to complete a short (less than 10 minute)
questionnaire on «Instructors_Name»and your experience in the «Course».
At the bottom of this email there is a code number that you will use on the questionnaire.
The number will not be used to match you with your responses to the questionnaire
beyond this initial contact. Your responses to this study will remain completely
confidential. Only summated, group data will be reported. Please respond to each
question openly and honestly without reservation. While you are not obligated to
participate in this study, your responses are very important. You may contact me if you
desire a copy of the results of this research.
Your participation in this study is strictly voluntary and you may choose not to
participate. If you wish not to participate in this study please respond back to this email
with “not participating” in the subject line. Your refusal to participate will involve no
penalty or loss of benefits to which you might otherwise be entitled. However, if you
choose to participate, you will be entered in a drawing to win one of three $50 Visa
Cash Cards that can be used wherever you like! If you should have any questions about
this research project please feel free to contact me at [email protected] or (573) 673-
1887. You may also contact Dr. Rob Terry at (573) 884-7375. For additional information
153
regarding human participation in research, please feel free to contact the University of
Missouri - Columbia Campus IRB Office at (573) 882-9585.
Thank you for your interest in this important study and I look forward to receiving your
responses. Now, please go to the link provided below which will direct you to the
questionnaire.
http://FreeOnlineSurveys.com/rendersurvey.asp?sid=5wmkkj985e8r92e376160
Code number: «Code»
Mollie Aschenbrener CAFNR Graduate Teaching Assistant
154
APPENDIX E
Second Student Electronic Mail Contact
155
Dear student name Happy holidays! I hope you are enjoying the holiday season and the break from school. A few days ago I asked you to complete a questionnaire regarding your CAFNR instructor. Your participation is needed for the successful completion of this research. Here’s all you have to do. Please take a few minutes to complete a questionnaire aboutInstructor and your experience in course. You will find a link to the questionnaire at the bottom of this email. Please use the following code number on the questionnaire:code. Be assured that your response to will remain confidential and your participation is voluntary. Remember, if you do participate, you will be entered in a drawing to win one of six $25 Visa Cash Cards that can be used wherever you like! If you have any questions about this research project please contact me at [email protected] or (573) 882-2200 or contact Dr. Rob Terry at [email protected] or (573) 884-7375. Simply go to the link below to complete the questionnaire as soon as possible. http://FreeOnlineSurveys.com/rendersurvey.asp?sid=5wmkkj985e8r92e376160 Mollie Aschenbrener Department of Agricultural Education University of Missouri

156
APPENDIX F
Third Student Electronic Mail Contact
157
Dear Student Name Happy New Year! I hope you are enjoying the holiday season and the break from school. Last week I asked you to complete a questionnaire regarding one of your CAFNR instructors. Your insight is extremely valuable and your participation is vital for our study. Here’s all you have to do. Please take a few minutes to complete a questionnaire aboutInstructorand your experience in Course You will find a link to the questionnaire at the bottom of this email. Please use the following code number on the questionnaire:100. Be assured that your response to will remain confidential and your participation is voluntary. Remember, if you do participate, you will be entered in a drawing to win one of six $25 Visa Cash Cards that can be used wherever you like! If you have any questions about this research project please contact me at [email protected] or (573) 882-2200 or contact Dr. Rob Terry at [email protected] or (573) 884-7375. Simply go to the link below to complete the questionnaire as soon as possible. http://FreeOnlineSurveys.com/rendersurvey.asp?sid=5wmkkj985e8r92e376160 Mollie Aschenbrener Department of Agricultural Education University of Missouri
158
APPENDIX G
Final Student Electronic Mail Contact
159
I realize this is a very busy time of year, but if you could please complete the on-line
questionnaire as well, I would greatly appreciate your help!
The on-line instrument can be accessed at the web site listed below. Please confine your
reflect to your teaching in Ag Journ 3210as you complete the questionnaire.
Please enter the following code when you begin the questionnaire: 108. Of course you
are not obligated to participate and no penalties will result should you choose not to
participate. However, your support is greatly appreciated!
If you have any questions, please contact Mollie Aschenbrener at [email protected]
or 882-2200 or Dr. Rob Terry at [email protected] or 884-7375.
Thank you for your interest in this important study. We look forward to your completed
response by Friday, January 11, 2008. Please go to the web link provided below which
will direct you to the questionnaire.
http://FreeOnlineSurveys.com/rendersurvey.asp?sid=5t8kviqn80tx3er380613 Mollie Aschenbrener Graduate Researcher University of Missouri IRB Disclosure: Your participation in this study is voluntary. If you choose not to participate, please reply to this email and type “not participating” in
the subject line. Your refusal to participate will result in no penalty or loss of benefits to which you might otherwise be entitled. For
additional information regarding human subjects research, contact the University of Missouri Campus IRB Office at (573) 882-9585.
160
APPENDIX H
First Instructor Electronic Mail Contact
161
Dear (name)
Happy New Year!
A few weeks ago, Dr. Vaughn and I contact you regarding a CAFNR instructor study we
are trying to complete. At this time, I would again request your assistance.
What do we need? About 15 minutes of your time. The first component of the study is an
on-line questionnaire which will require about 5 minutes. The second component will
require ten minutes to complete a standardized instrument.
The on-line instrument can be accessed at the web site listed below. Simply enter this
code when you begin the questionnaire: (code). Of course you are not obligated to
participate and no penalties will result should you choose not to participate. However,
your support is greatly appreciated!
Please contact Mollie Aschenbrener if you have any questions ([email protected] or
882-2200) or Dr. Rob Terry ([email protected] or 882-).

162
APPENDIX I
Second Instructor Electronic Mail Contact

163
Good morning (name)!
Recently I contacted you regarding the CAFNR instructor study I am working on with
Dr. Vaughn. Will you please participate in the second component of the study?
The standardized creativity instrument will require ten minutes, and I will provide
refreshments and the opportunity to win CAFNR merchandise! I can meet with you
individually, or you can join us for refreshments at any of the following times and
locations:
Location: Date: Time:
Natural Resources, room Tuesday, January 15th 9:30 a.m.
Ag 2-30 Thursday, January 17th 10:00 a.m.
Ag Econ
Animal Science Wednesday, January 16th 2:00 p.m.
AE 213 Wednesday, January 16th 9:30 a.m.
Ag Building
Eckles Hall
I realize this is a very busy time of year, but if you could please complete the on-line
questionnaire as well, I would greatly appreciate your help!
The on-line instrument can be accessed at the web site listed below. Please confine your
reflect to your teaching in Ag Journ 3210as you complete the questionnaire.
164
Please enter the following code when you begin the questionnaire: 108. Of course you
are not obligated to participate and no penalties will result should you choose not to
participate. However, your support is greatly appreciated!
If you have any questions, please contact Mollie Aschenbrener at [email protected]
or 882-2200 or Dr. Rob Terry at [email protected] or 884-7375.
Thank you for your interest in this important study. We look forward to your completed
response by Friday, January 11, 2008. Please go to the web link provided below which
will direct you to the questionnaire.
http://FreeOnlineSurveys.com/rendersurvey.asp?sid=5t8kviqn80tx3er380613 Mollie Aschenbrener Graduate Researcher University of Columbia IRB Disclosure: Your participation in this study is voluntary. If you choose not to participate, please reply to this email and type “not participating” in
the subject line. Your refusal to participate will result in no penalty or loss of benefits to which you might otherwise be entitled. For
additional information regarding human subjects research, contact the University of Missouri Campus IRB Office at (573) 882-9585.
165
APPENDIX J
Final Instructor Electronic Mail Contact
166
Good morning (name)!
Recently I contacted you regarding the CAFNR instructor study I am working on with
Dr. Vaughn. Will you please participate in the second component of the study?
The standardized creativity instrument will require ten minutes, and I will provide
refreshments and the opportunity to win CAFNR merchandise! I can meet with you
individually, or you can join us for refreshments at any of the following times and
locations:
Location: Date: Time:
Natural Resources, room Tuesday, January 15th 9:30 a.m.
Ag 2-30 Thursday, January 17th 10:00 a.m.
Ag Econ
Animal Science Wednesday, January 16th 2:00 p.m.
AE 213 Wednesday, January 16th 9:30 a.m.
Ag Building
Eckles Hall
Thank you again for your willingness to participate!
Mollie Aschenbrener Graduate Researcher University of Missouri
167
VITA
Mollie Aschenbrener is a native of Pendleton, Oregon and spent most of her
childhood involved in the agricultural industry. Mollie was an active 4-H and FFA
member and served the Oregon FFA Association as State Secretary in 1988-89. Mollie
thanks her grandparents and parents for instilling a love of agriculture and fostering her
devotion to the agriculture community. Mollie attended California Polytechnic State
University in San Luis Obispo, California, where she obtained a bachelors degree in
agriculture business, certification as a secondary agricultural instructor and a masters
degree in agricultural science.
After college, Mollie served as an agricultural science instructor and FFA advisor
at Paso Robles High School in Paso Robles, California for eleven years. She left the high
school classroom to pursue a doctoral degree at the University of Missouri (MU) in
Columbia, Missouri. While at MU, Mollie served as an instructor in both the College of
Education and Department of Agricultural Education. Mollie received her Ph.D. in
Agricultural Education from the University of Missouri in 2008.