Embed Size (px)
Citation preview
Octopamine neurons mediate �ight-induced
modulation of visual processing in Drosophila
melanogaster
Thesis by
Marie P. Suver
In Partial Ful�llment of the Requirements
for the Degree of
Doctor of Philosophy
California Institute of Technology
Pasadena, California
2014
(Defended June 13, 2013)

ii
© 2014
Marie P. Suver
All Rights Reserved

iii
In memory of my grandmother, Patricia Louise Staggs.
iv
Acknowledgments
First I would like to thank my advisor Michael Dickinson, whose advice and support
over the years I am grateful for. Michael inspires a thoughtful, creative and rigorous
approach to science and I am incredibly fortunate to have spent this time in his lab.
I would also like to thank my committee members for their useful comments,
criticisms and time: Thanos Siapas, Pietro Perona, Paul Sternberg, and Markus
Meister. Thanks to David Anderson for input over the years as well.
Akira Mamiya performed the calcium imaging experiments presented in Chap-
ter 2, and tested many exciting theories about the e�ect of wind stimuli and visual
responses in octopamine neurons not presented here. I owe a huge thanks to Anne
Sustar, who provided the image of the Tdc2-Gal4 line presented in Chapter 2, of-
fered expert help and advice for acquiring genetic reagents, setting up crosses, and
immunohistochemistry procedures.
I am also very grateful to Dr. Edward Kravitz and the members of his lab who
provided the octopamine Gal4 driver lines presented in Chapter 3. Dr. Bun Chan
generated the octopamine neuron enhancer trap lines, and Dr. Kyle Gobrogge gen-
erated a number of e�ector lines for single cell manipulations and was a consistently
cheery and helpful collaborator.
Thanks to Floris van Breugel, who performed the free �ight experiments discussed
in the conclusion with great enthusiasm. Thanks also to Bettina Schnell, who aided
in the design of these free �ight experiments, and whose no-fuss approach to electro-
physiology is always refreshing.
I would also like to thank my friend and colleague Peter Weir, for lively discussions,
collaborations, and great company.
v
I owe a debt of of gratitude to my patch clamp physiology instructors, Gwyneth
Card and Gaby Maimon. Gwyneth was a wise and patient teacher, and Gaby o�ered
intellectual guidance and technical support throughout the project. Allan Wong
also o�ered advice throughout my time at Caltech, particularly in instruction in
molecular genetics, from the most basic to advanced techniques. Alice Robie was
helpful in navigating life in the lab and at Caltech, as were the rest of my former lab
mates from Caltech, who I was lucky to work alongside and enjoy many discussions
with over lunch in the sun: Jasper Simon, Sawyer Fuller, Francisco Zabala, Andrew
Straw, Wyatt Kor�, Matthias Wittlinger, Rosalyn Sayaman, Will Dickson, Peter
Polidoro, and Martin Peek. I am also excited to be part of the newest incarnation
of the Dickinson lab currently at the University of Washington. Excluding those
already acknowledged, this includes some transplants from Caltech, Michael Elzinga
and Sweta Agrawal, as well as a talented new bunch of individuals: Max Sizemore,
Florian Muijures, Johan Melis, Steve Safarik, Eatai Roth, Thad Lindsey, TimWarren,
Irene Kim, Samantha Williams and Ainul Huda. I have already learned so much from
working with these individuals. I am lucky to have had not one, but two incredible
sets of lab mates to work with.
I would like to thank my mom and dad, Michele and Chris, and my siblings, Max,
Edward, Molly and Claire. I am blessed with the coolest family in the world and
am grateful for the cheers, support, and inspiration they have provided over many
years. Many thanks to the rest of my family and friends for your encouragement - I
am lucky to have too many to list!
Lastly, I thank my husband Trevor, for his endless support, love, and motivation.
vi
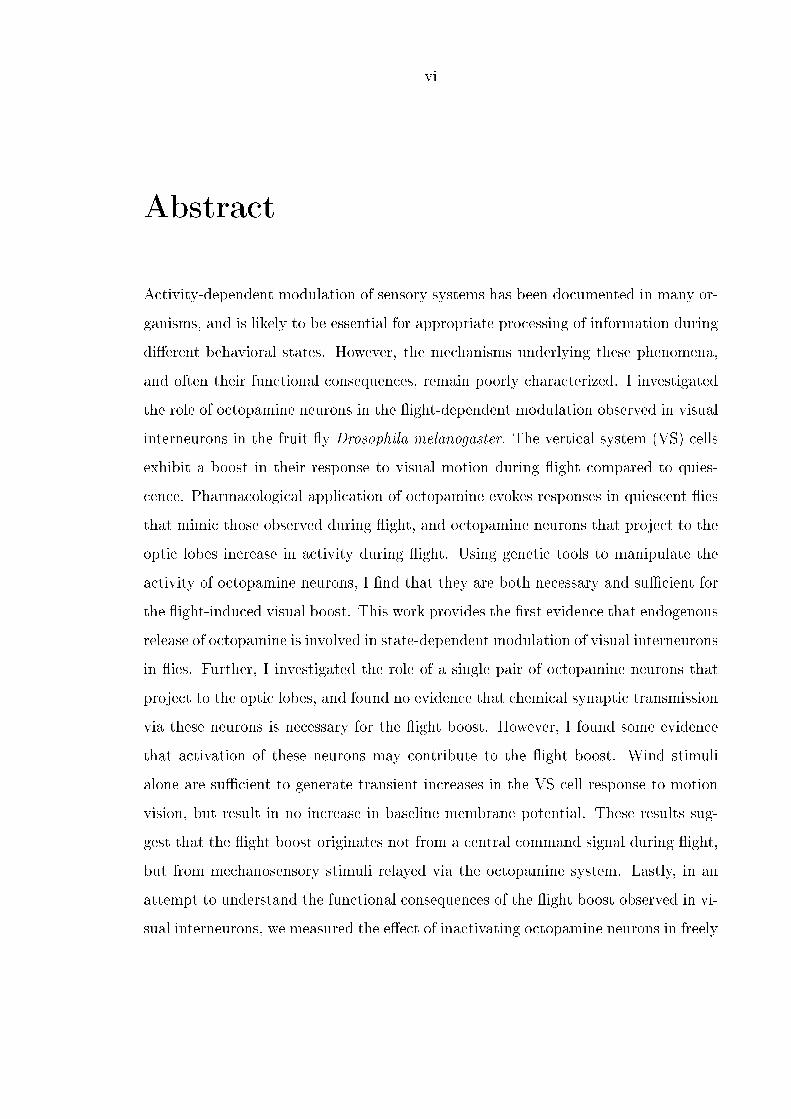
Abstract
Activity-dependent modulation of sensory systems has been documented in many or-
ganisms, and is likely to be essential for appropriate processing of information during
di�erent behavioral states. However, the mechanisms underlying these phenomena,
and often their functional consequences, remain poorly characterized. I investigated
the role of octopamine neurons in the �ight-dependent modulation observed in visual
interneurons in the fruit �y Drosophila melanogaster. The vertical system (VS) cells
exhibit a boost in their response to visual motion during �ight compared to quies-
cence. Pharmacological application of octopamine evokes responses in quiescent �ies
that mimic those observed during �ight, and octopamine neurons that project to the
optic lobes increase in activity during �ight. Using genetic tools to manipulate the
activity of octopamine neurons, I �nd that they are both necessary and su�cient for
the �ight-induced visual boost. This work provides the �rst evidence that endogenous
release of octopamine is involved in state-dependent modulation of visual interneurons
in �ies. Further, I investigated the role of a single pair of octopamine neurons that
project to the optic lobes, and found no evidence that chemical synaptic transmission
via these neurons is necessary for the �ight boost. However, I found some evidence
that activation of these neurons may contribute to the �ight boost. Wind stimuli
alone are su�cient to generate transient increases in the VS cell response to motion
vision, but result in no increase in baseline membrane potential. These results sug-
gest that the �ight boost originates not from a central command signal during �ight,
but from mechanosensory stimuli relayed via the octopamine system. Lastly, in an
attempt to understand the functional consequences of the �ight boost observed in vi-
sual interneurons, we measured the e�ect of inactivating octopamine neurons in freely

vii
�ying �ies. We found that �ies whose octopamine neurons we silenced accelerate less
than wild-type �ies, consistent with the hypothesis that the �ight boost we observe in
VS cells is indicative of a gain control mechanism mediated by octopamine neurons.
Together, this work serves as the basis for a mechanistic and functional understanding
of octopaminergic modulation of vision in �ying �ies.
viii
Contents
Acknowledgments iv
Abstract vi
1 Introduction 1
1.1 The visual system of the �y . . . . . . . . . . . . . . . . . . . . . . . 1
1.2 Electrophysiology in the behaving �y . . . . . . . . . . . . . . . . . . 12
1.3 Neuromodulation in insect sensory systems . . . . . . . . . . . . . . . 14
1.3.1 The role of octopamine in locust �ight and escape behavior . . 16
1.3.2 Modulation of visual interneurons in �ies . . . . . . . . . . . . 17
1.4 Thesis overview . . . . . . . . . . . . . . . . . . . . . . . . . . . . . . 18
2 Octopamine neurons mediate �ight-induced modulation of visual in-
terneurons in Drosophila 19
2.1 Introduction . . . . . . . . . . . . . . . . . . . . . . . . . . . . . . . . 19
2.2 Experimental procedures . . . . . . . . . . . . . . . . . . . . . . . . . 20
2.2.1 Animals . . . . . . . . . . . . . . . . . . . . . . . . . . . . . . 20
2.2.2 Whole cell patch clamp recordings . . . . . . . . . . . . . . . . 20
2.2.3 Visual display and stimuli . . . . . . . . . . . . . . . . . . . . 22
2.2.4 Pharmacology . . . . . . . . . . . . . . . . . . . . . . . . . . . 23
2.2.5 Immunohistochemistry . . . . . . . . . . . . . . . . . . . . . . 23
2.2.6 Calcium imaging . . . . . . . . . . . . . . . . . . . . . . . . . 24
2.2.7 Data analysis and statistics . . . . . . . . . . . . . . . . . . . 24
2.3 Results . . . . . . . . . . . . . . . . . . . . . . . . . . . . . . . . . . . 26
ix
2.3.1 Flight-dependent modulation of VS cell response amplitude de-
pends on temporal frequency of motion . . . . . . . . . . . . . 26
2.3.2 Bath application of octopamine reproduces �ight e�ects in qui-
escent �ies . . . . . . . . . . . . . . . . . . . . . . . . . . . . . 27
2.3.3 Octopaminergic neurons with optic lobe projections show an
increase in activity during �ight . . . . . . . . . . . . . . . . . 29
2.3.4 Activation of octopamine neurons causes an increase in VS cell
responses to motion . . . . . . . . . . . . . . . . . . . . . . . . 32
2.3.5 Inactivation of octopamine neurons abolishes �ight-
dependent visual response increase . . . . . . . . . . . . . . . 36
2.4 Discussion . . . . . . . . . . . . . . . . . . . . . . . . . . . . . . . . . 39
3 Genetic manipulation of the lobula-plate projecting octopamine neu-
rons 45
3.1 Introduction . . . . . . . . . . . . . . . . . . . . . . . . . . . . . . . 45
3.2 Experimental procedures . . . . . . . . . . . . . . . . . . . . . . . . . 46
3.2.1 Animals . . . . . . . . . . . . . . . . . . . . . . . . . . . . . . 47
3.2.2 Whole cell patch clamp recordings . . . . . . . . . . . . . . . . 47
3.3 Results . . . . . . . . . . . . . . . . . . . . . . . . . . . . . . . . . . . 48
3.3.1 Blocking chemical synaptic transmission in the octopamine neu-
ron OA-AL2i1 has no e�ect on �ight boost . . . . . . . . . . . 48
3.3.2 Heat induces an increase in VS cell responses to motion in
UAS>stop>dTrpA1 control �ies . . . . . . . . . . . . . . . . 50
3.3.3 Genetic background and the e�ect of heat on VS cell responses 50
3.4 Discussion . . . . . . . . . . . . . . . . . . . . . . . . . . . . . . . . . 55
4 Mechanosensory input and the �ight boost 58
4.1 Introduction . . . . . . . . . . . . . . . . . . . . . . . . . . . . . . . . 58
4.2 Experimental procedures . . . . . . . . . . . . . . . . . . . . . . . . . 58
4.2.1 Animals . . . . . . . . . . . . . . . . . . . . . . . . . . . . . . 59
4.2.2 Whole cell patch clamp recordings . . . . . . . . . . . . . . . . 59

x
4.2.3 Visual display and stimuli . . . . . . . . . . . . . . . . . . . . 59
4.2.4 Data analysis and statistics . . . . . . . . . . . . . . . . . . . 59
4.3 Results . . . . . . . . . . . . . . . . . . . . . . . . . . . . . . . . . . . 60
4.4 Discussion . . . . . . . . . . . . . . . . . . . . . . . . . . . . . . . . . 60
5 Conclusion 64
Bibliography 70
xi
List of Figures
1.1 Major brain regions of the Drosophila optic lobes . . . . . . . . . . . . 3
1.2 Anatomy of VS cell dendrites . . . . . . . . . . . . . . . . . . . . . . . 4
1.3 Typical VS cell response to visual motion . . . . . . . . . . . . . . . . 5
1.4 Schematic of end inhibition in a VS cell network . . . . . . . . . . . . . 7
1.5 Visual input to the neck and wing motor systems . . . . . . . . . . . . 9
1.6 Schematic of the physiology/imaging preparation . . . . . . . . . . . . 14
1.7 Flight e�ects in VS cells . . . . . . . . . . . . . . . . . . . . . . . . . . 15
1.8 Octopamine synthesis pathway . . . . . . . . . . . . . . . . . . . . . . 16
2.1 Flight boost varies across a range of temporal frequencies . . . . . . . . 28
2.2 Octopamine reproduces �ight e�ects . . . . . . . . . . . . . . . . . . . 30
2.3 Saline control for octopamine pharmacology . . . . . . . . . . . . . . . 31
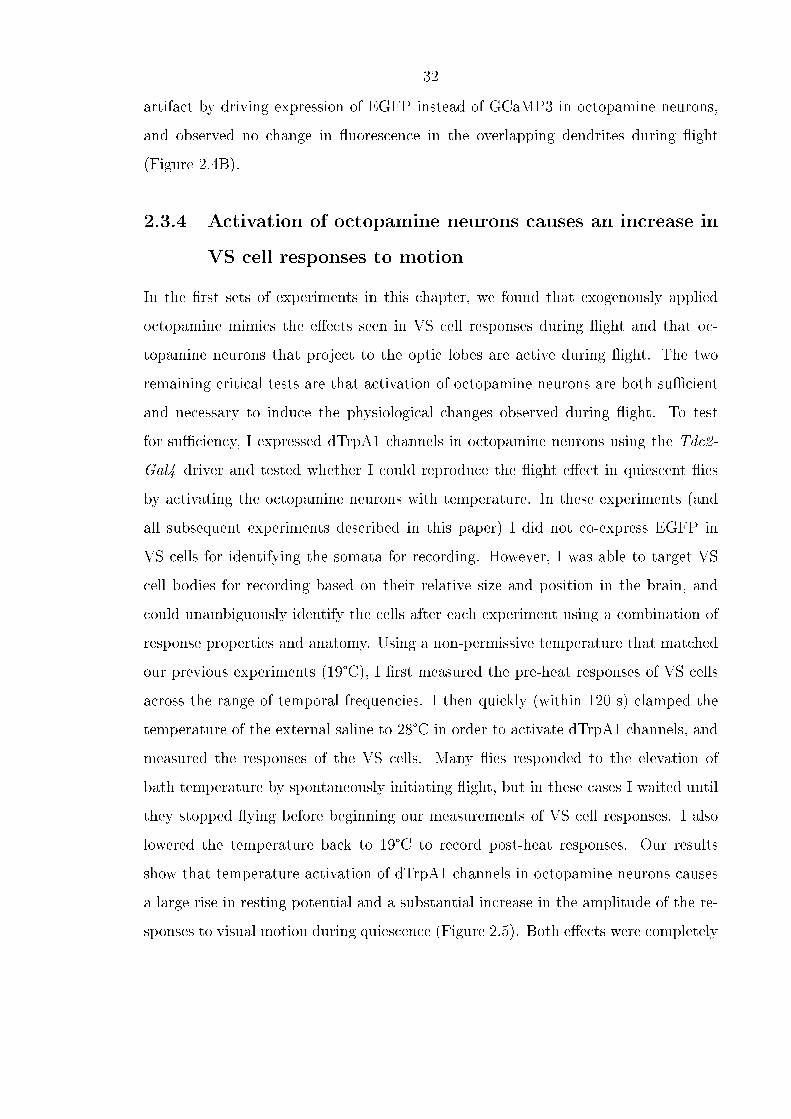
2.4 Octopamine neurons increase in activity during �ight . . . . . . . . . . 33
2.5 Activation of octopamine neurons increases baseline membrane potential
and response to motion . . . . . . . . . . . . . . . . . . . . . . . . . . 35
2.6 Activation of octopamine neurons induces �ight boost . . . . . . . . . 36
2.7 Inactivation of octopamine neurons abolishes �ight boost . . . . . . . . 37
2.8 Background control �ies for Kir inactivation experiment show normal
�ight e�ects . . . . . . . . . . . . . . . . . . . . . . . . . . . . . . . . . 38
2.9 Cross-condition summary . . . . . . . . . . . . . . . . . . . . . . . . . 40
2.10 E�ect of �ight during octopamine application . . . . . . . . . . . . . . 42
2.11 E�ect of �ight during activation of octopamine neurons . . . . . . . . . 44
xii
3.1 Expression pattern of a single pair of octopamine neurons labeled by the
combinatorial driver line Tdc2-Gal4;243-FLP . . . . . . . . . . . . . . 46
3.2 Expression of TNT in one pair of octopamine neurons has no e�ect on
the �ight boost . . . . . . . . . . . . . . . . . . . . . . . . . . . . . . . 49
3.3 Activation of one pair of octopamine neurons may increase VS cell re-
sponses to motion . . . . . . . . . . . . . . . . . . . . . . . . . . . . . 51
3.4 Activation of one pair of octopamine neurons may increase VS cell re-
sponses to motion across a range of temporal frequencies . . . . . . . . 52
3.5 Manipulation of the OA-AL2i1 octopamine neuron - cross-condition
summary . . . . . . . . . . . . . . . . . . . . . . . . . . . . . . . . . . 53
3.6 Heat does not increase VS cell responses to motion in DB331-Gal4;
UAS-2xEGFP �ies . . . . . . . . . . . . . . . . . . . . . . . . . . . . . 54
3.7 Heat e�ect on individual �y VS cell responses in di�erent genetic back-
grounds . . . . . . . . . . . . . . . . . . . . . . . . . . . . . . . . . . . 56
4.1 Wind stimulus induces a transient increase in VS cell response to visual
motion . . . . . . . . . . . . . . . . . . . . . . . . . . . . . . . . . . . . 61
4.2 Average VS cell response to motion after a wind stimulus . . . . . . . . 61
4.3 Wind stimulus generates an increase in individual �y average VS re-
sponses to visual motion . . . . . . . . . . . . . . . . . . . . . . . . . . 62
4.4 Baseline membrane potential does not change after wind stimulus . . . 62
5.1 Free �ight behavioral apparatus and Gal4 driver line expression . . . . 68
5.2 Octopamine null �ies respond to regressive visual motion during free
�ight with lower accelerations than wild type �ies . . . . . . . . . . . . 69

xiii
List of Tables
2.1 Transgenic lines . . . . . . . . . . . . . . . . . . . . . . . . . . . . . . . 21
1
Chapter 1
Introduction
A key feature of nervous systems is the ability to process sensory stimuli in a context-
dependent manner. For example, it has been shown in mice that the responses of
neurons in primary visual cortex increase during locomotion (Andermann et al., 2011;
Niell and Stryker, 2010), and this e�ect is reminiscent of the modulation observed
when a monkey attends to a stimulus (Moran and Desimone, 1985; Treue and Maun-
sell, 1996). Similarly, the responses of visual interneurons in �ies are enhanced during
walking (Chiappe et al., 2010) and �ight (Maimon et al., 2010; Jung et al., 2011),
compared to the responses in quiescent �ies. Given these similar observations in �ies,
mice and primates, state-dependent sensory modulation is likely to be quite general,
although the cellular mechanisms underlying such changes are not known. Given the
relatively small number of neurons in the Drosophila brain and the abundance of
genetic tools available with which to manipulate neural activity, the fruit �y provides
an excellent model system to probe the cellular and molecular basis of behavioral
modulation of sensory systems.
1.1 The visual system of the �y
Flies rely on vision for many tasks, including �nding mates, traveling long distances
in the absence of visual landmarks (Coyne et al., 1982), and avoiding obstacles
and predators. They have evolved the fastest visual system in the animal kingdom
(Autrum, 1958), and roughly one half of the brain is dedicated to visual processing
2
(Rein et al., 2002). The �y visual system has been a subject of intense study for
nearly a century, from the elegant anatomical characterization by Cajal and Sanchez
(1915) to modern neurogenetics. Indeed, for those interested in unraveling the neu-
ral basis of behavior, vision and its role in �y behavior presents a rich yet relatively
accessible system.
Adult �ies use two sensory structures to detect light - the compound eyes and
the ocelli. The ocelli are a set of three simple eyes positioned on the top (dorsal1-
most part) of the head, and are believed to aid in gaze stabilization (Goodman, 1970;
Schuppe and Hengstenberg, 1993). Ocellar interneurons, called L-neurons, sum in-
formation from photoreceptor outputs in each of the ocelli, and form a low-resolution
image of the visual world. These large diameter neurons rapidly relay intensity infor-
mation to the posterior slope, where they synapse onto descending neurons (Nässel
and Hagberg, 1985; Strausfeld, 1976; Strausfeld and Bassemir, 1985) and possibly
the large motion sensitive neurons of the third optic neuropil (Parsons et al., 2010;
Strausfeld, 1976). Most of the neurons in the visual system, however, are dedicated
to processing information from the compound eyes, where light is �rst detected by
the retina. The retina of each eye in Drosophila consists of an array of about 700
ommatidia (Heisenberg et al., 1984), specialized light-sensing structures in which pho-
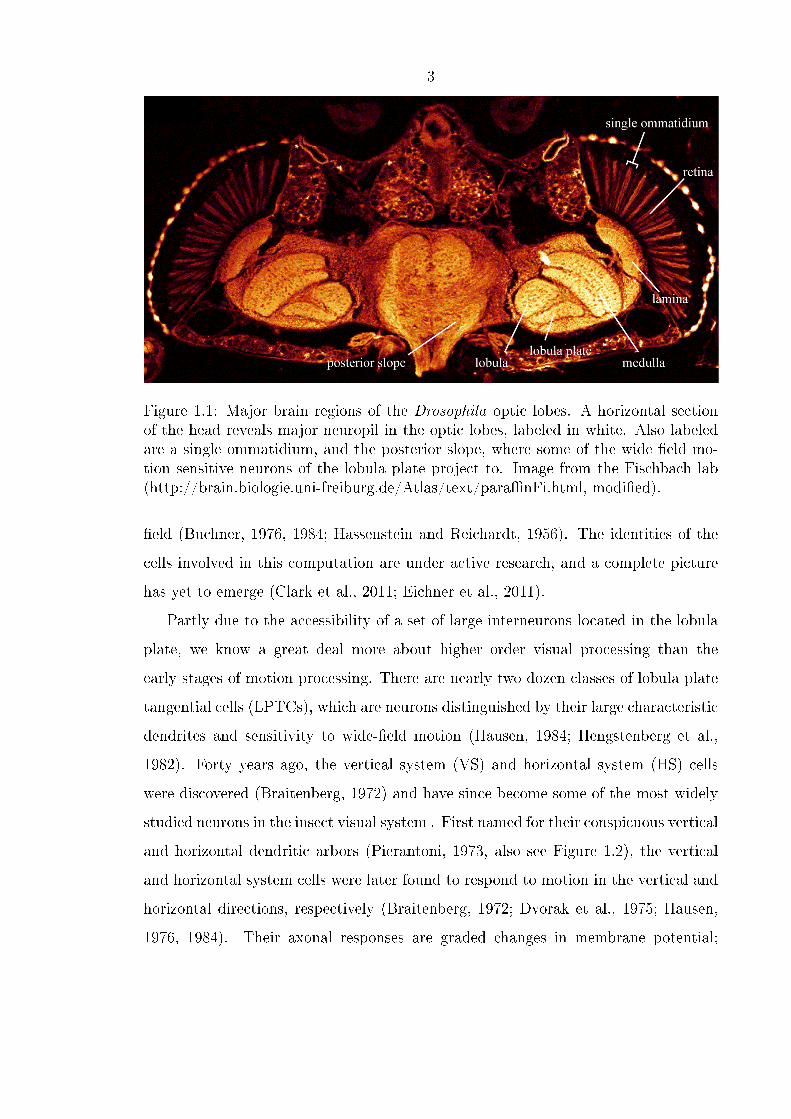
toreceptors are housed (Figure 1.1). Visual information is retinotopically projected
from the retina to a series of neuropil in which subsequent computations are per-
formed: the lamina, medulla, and the lobula complex, which consists of the lobula
and the lobula plate (Figure 1.1).
Using a variety of techniques, including electrophysiology, genetic manipulation,
and behavioral analysis, researchers have started to unravel the cellular basis of the
earliest stages of motion processing (Clark et al., 2011; Eichner et al., 2011). Visual
motion processing in the �y begins with the so-called elementary motion detectors
(EMDs), which are units sensitive to one direction of motion over a small receptive
1Some researchers prefer to report brain anatomy relative to the neuraxis, which is an anatomicalreference system based on development, and is especially helpful in comparative studies (a useful�gure can be found in Strausfeld and Seyan, 1985). However, the work presented in this thesisfocuses on a single species, and so I have chosen to refer to brain anatomy relative to the body axisfor clarity.
3
Figure 1.1: Major brain regions of the Drosophila optic lobes. A horizontal sectionof the head reveals major neuropil in the optic lobes, labeled in white. Also labeledare a single ommatidium, and the posterior slope, where some of the wide �eld mo-tion sensitive neurons of the lobula plate project to. Image from the Fischbach lab(http://brain.biologie.uni-freiburg.de/Atlas/text/para�nFi.html, modi�ed).
�eld (Buchner, 1976, 1984; Hassenstein and Reichardt, 1956). The identities of the
cells involved in this computation are under active research, and a complete picture
has yet to emerge (Clark et al., 2011; Eichner et al., 2011).
Partly due to the accessibility of a set of large interneurons located in the lobula
plate, we know a great deal more about higher order visual processing than the
early stages of motion processing. There are nearly two dozen classes of lobula plate
tangential cells (LPTCs), which are neurons distinguished by their large characteristic
dendrites and sensitivity to wide-�eld motion (Hausen, 1984; Hengstenberg et al.,
1982). Forty years ago, the vertical system (VS) and horizontal system (HS) cells
were discovered (Braitenberg, 1972) and have since become some of the most widely
studied neurons in the insect visual system . First named for their conspicuous vertical
and horizontal dendritic arbors (Pierantoni, 1973, also see Figure 1.2), the vertical
and horizontal system cells were later found to respond to motion in the vertical and
horizontal directions, respectively (Braitenberg, 1972; Dvorak et al., 1975; Hausen,
1976, 1984). Their axonal responses are graded changes in membrane potential;
4
VS and HS cells depolarize in response to motion in their preferred direction, and
hyperpolarize in response to non-preferred (null direction) motion. Although they do
not typically �re action potentials, they produce small, regenerative spike-like events
(Hengstenberg 1977, Figure 1.3).
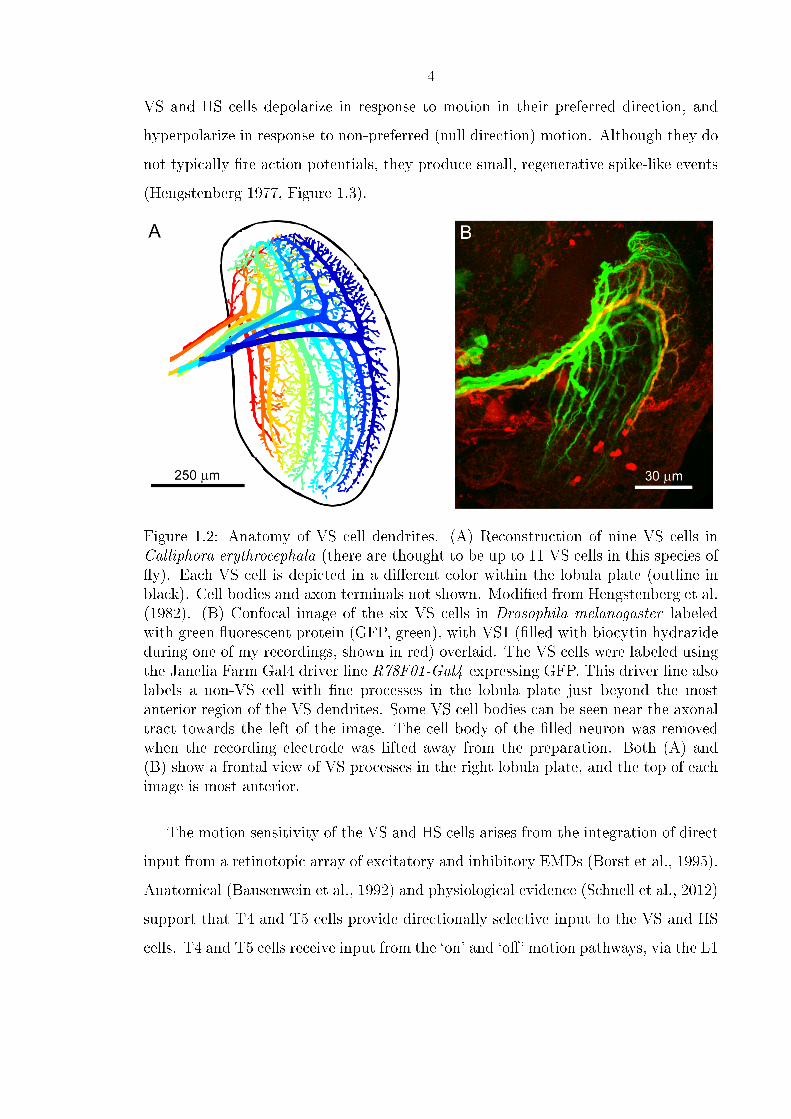
Figure 1.2: Anatomy of VS cell dendrites. (A) Reconstruction of nine VS cells inCalliphora erythrocephala (there are thought to be up to 11 VS cells in this species of�y). Each VS cell is depicted in a di�erent color within the lobula plate (outline inblack). Cell bodies and axon terminals not shown. Modi�ed from Hengstenberg et al.(1982). (B) Confocal image of the six VS cells in Drosophila melanogaster labeledwith green �uorescent protein (GFP, green), with VS1 (�lled with biocytin hydrazideduring one of my recordings, shown in red) overlaid. The VS cells were labeled usingthe Janelia Farm Gal4 driver line R78F01-Gal4 expressing GFP. This driver line alsolabels a non-VS cell with �ne processes in the lobula plate just beyond the mostanterior region of the VS dendrites. Some VS cell bodies can be seen near the axonaltract towards the left of the image. The cell body of the �lled neuron was removedwhen the recording electrode was lifted away from the preparation. Both (A) and(B) show a frontal view of VS processes in the right lobula plate, and the top of eachimage is most anterior.
The motion sensitivity of the VS and HS cells arises from the integration of direct
input from a retinotopic array of excitatory and inhibitory EMDs (Borst et al., 1995).
Anatomical (Bausenwein et al., 1992) and physiological evidence (Schnell et al., 2012)
support that T4 and T5 cells provide directionally selective input to the VS and HS
cells. T4 and T5 cells receive input from the `on' and `o�' motion pathways, via the L1
5
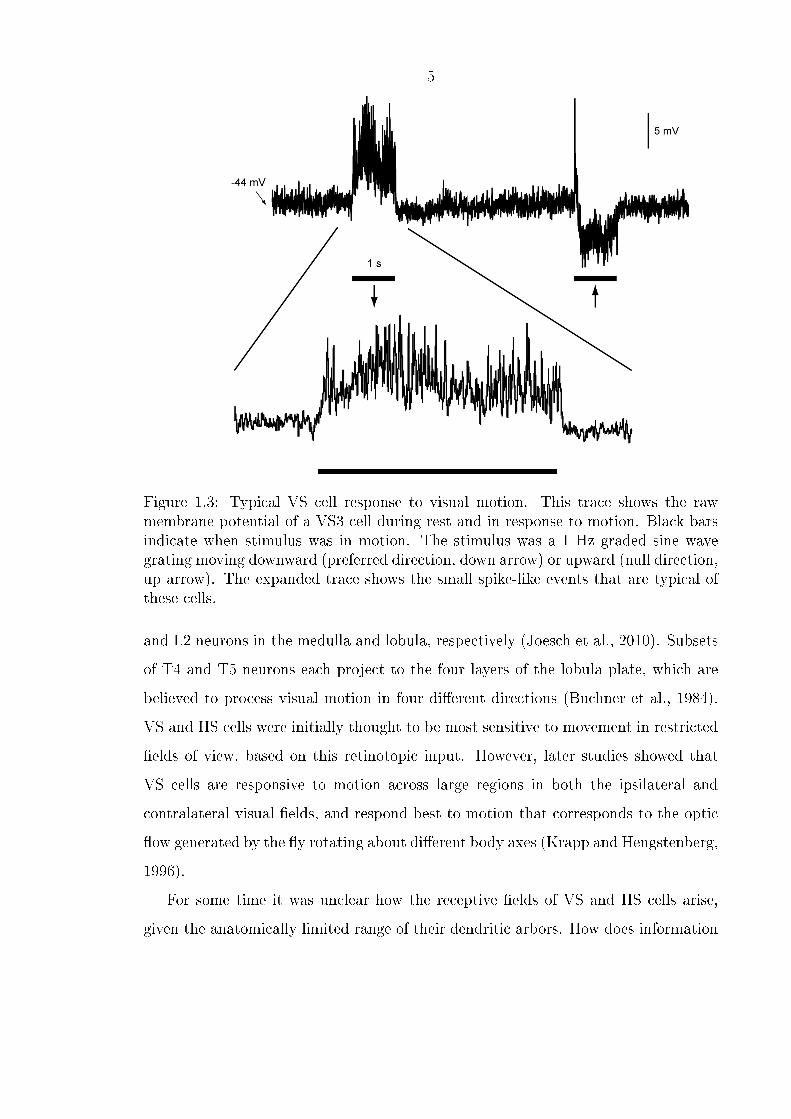
Figure 1.3: Typical VS cell response to visual motion. This trace shows the rawmembrane potential of a VS3 cell during rest and in response to motion. Black barsindicate when stimulus was in motion. The stimulus was a 1 Hz graded sine wavegrating moving downward (preferred direction, down arrow) or upward (null direction,up arrow). The expanded trace shows the small spike-like events that are typical ofthese cells.
and L2 neurons in the medulla and lobula, respectively (Joesch et al., 2010). Subsets
of T4 and T5 neurons each project to the four layers of the lobula plate, which are
believed to process visual motion in four di�erent directions (Buchner et al., 1984).
VS and HS cells were initially thought to be most sensitive to movement in restricted
�elds of view, based on this retinotopic input. However, later studies showed that
VS cells are responsive to motion across large regions in both the ipsilateral and
contralateral visual �elds, and respond best to motion that corresponds to the optic
�ow generated by the �y rotating about di�erent body axes (Krapp and Hengstenberg,
1996).
For some time it was unclear how the receptive �elds of VS and HS cells arise,
given the anatomically limited range of their dendritic arbors. How does information
6
from outside the receptive �eld of areas covered by the dendrites of a VS cell a�ect its
axonal membrane potential? By using paired recordings, researchers demonstrated
that VS, HS and another class of LPTCs, the two centrifugal horizontal (CH) cells
(Hausen, 1976), are connected via gap junctions into a network in which neighboring
cells excite each other, broadening and tuning the receptive �eld of each (Haag and
Borst, 2004, 2005). Both electrophysiological experiments and dye coupling results
suggest that HS and CH cells make dendro-dendritic contacts, and each VS cell is
electrically coupled to its immediate neighbor(s) (Haag and Borst, 2004, 2005). The
rotational sensitivity of these cells is now attributed in part to the tuning properties
of their inputs and in part to the connectivity pattern within the network.
An additional mechanism appears to contribute to the rotational tuning of these
cells at the level of the dendrites. Elyada et al. (2013) recently monitored activity
in the dendrites of VS and HS cells with a calcium-sensitive dye. They reported a
previously unknown phenomenon at work, termed �end inhibition,� which consists of
a decrease in dendritic responses when patterns are extended in the direction perpen-
dicular to a cell's preferred direction of motion. Thus, the responses in the dendrites
of a VS cell, sensitive to vertical motion, decrease when the same vertically moving
pattern is made wider. This inhibition in the dendrites contrasts with the behavior
at the axon of the same cell: because of gap junctions with neighboring VS cells, ax-
onal responses increase when stimulus patterns extend over a wider horizontal area.
These e�ects are illustrated in Figure 1.4. The authors suggest that the inhibitory
input from upstream EMDs outside the VS cell's excitatory receptive �eld are likely
candidates for the source of this inhibition, based on experiments in which they in-
jected current while stimulating VS cells with patterns of di�erent widths (red curved
inhibitory elements in Figure 1.4). Using a multicompartmental model of the VS cell
network, Elyada et al. (2013) provided support that end inhibition increased the ratio
of responses during rotation to responses during translation, thereby enhancing the
relative sensitivity of the model to rotational �ow �elds. Hence, end inhibition, in
addition to gap junction connections between neighboring LPTCs, appears to add to
the rotational tuning of the VS-HS cell network.
7
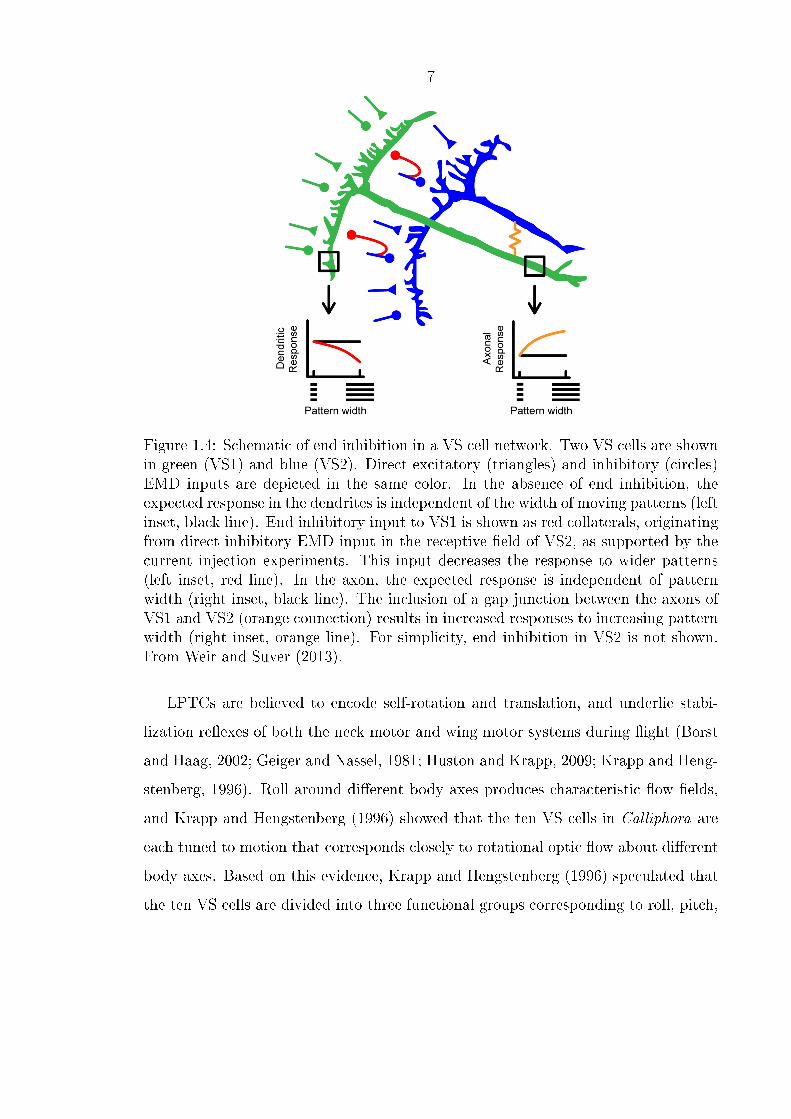
Figure 1.4: Schematic of end inhibition in a VS cell network. Two VS cells are shownin green (VS1) and blue (VS2). Direct excitatory (triangles) and inhibitory (circles)EMD inputs are depicted in the same color. In the absence of end inhibition, theexpected response in the dendrites is independent of the width of moving patterns (leftinset, black line). End inhibitory input to VS1 is shown as red collaterals, originatingfrom direct inhibitory EMD input in the receptive �eld of VS2, as supported by thecurrent injection experiments. This input decreases the response to wider patterns(left inset, red line). In the axon, the expected response is independent of patternwidth (right inset, black line). The inclusion of a gap junction between the axons ofVS1 and VS2 (orange connection) results in increased responses to increasing patternwidth (right inset, orange line). For simplicity, end inhibition in VS2 is not shown.From Weir and Suver (2013).
LPTCs are believed to encode self-rotation and translation, and underlie stabi-
lization re�exes of both the neck motor and wing motor systems during �ight (Borst
and Haag, 2002; Geiger and Nassel, 1981; Huston and Krapp, 2009; Krapp and Heng-
stenberg, 1996). Roll around di�erent body axes produces characteristic �ow �elds,
and Krapp and Hengstenberg (1996) showed that the ten VS cells in Calliphora are
each tuned to motion that corresponds closely to rotational optic �ow about di�erent
body axes. Based on this evidence, Krapp and Hengstenberg (1996) speculated that
the ten VS cells are divided into three functional groups corresponding to roll, pitch,
8
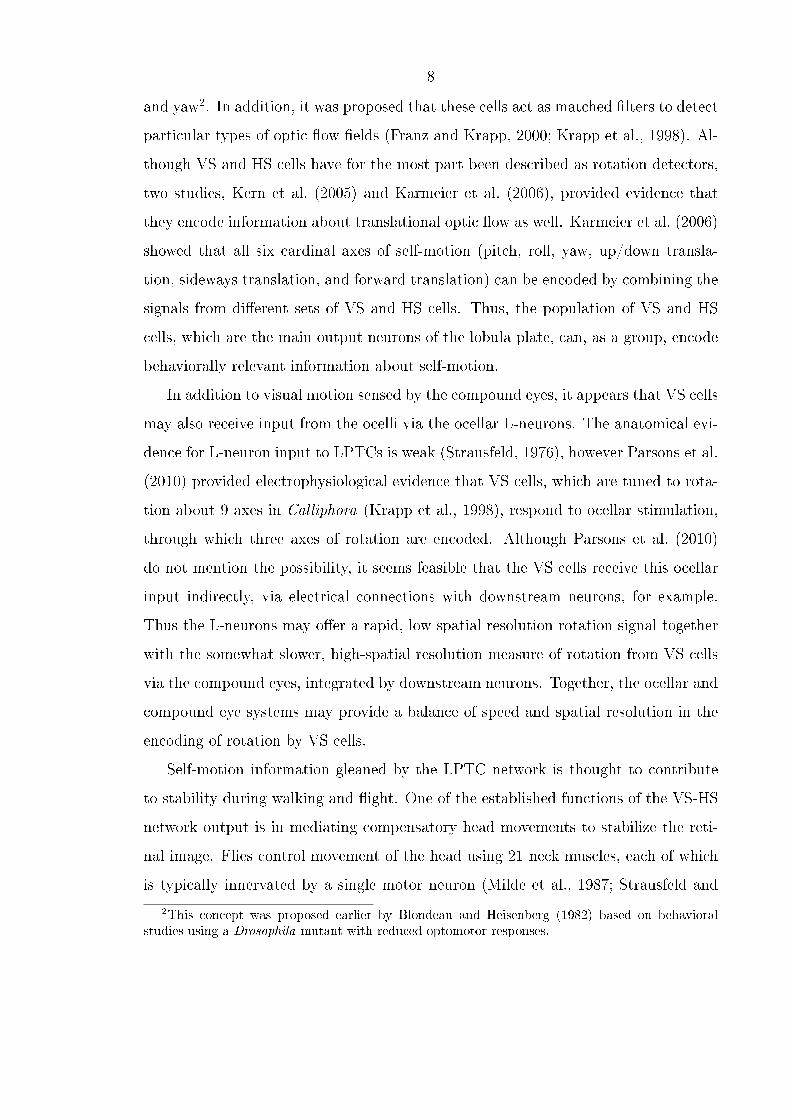
and yaw2. In addition, it was proposed that these cells act as matched �lters to detect
particular types of optic �ow �elds (Franz and Krapp, 2000; Krapp et al., 1998). Al-
though VS and HS cells have for the most part been described as rotation detectors,
two studies, Kern et al. (2005) and Karmeier et al. (2006), provided evidence that
they encode information about translational optic �ow as well. Karmeier et al. (2006)
showed that all six cardinal axes of self-motion (pitch, roll, yaw, up/down transla-
tion, sideways translation, and forward translation) can be encoded by combining the
signals from di�erent sets of VS and HS cells. Thus, the population of VS and HS
cells, which are the main output neurons of the lobula plate, can, as a group, encode
behaviorally relevant information about self-motion.
In addition to visual motion sensed by the compound eyes, it appears that VS cells
may also receive input from the ocelli via the ocellar L-neurons. The anatomical evi-
dence for L-neuron input to LPTCs is weak (Strausfeld, 1976), however Parsons et al.
(2010) provided electrophysiological evidence that VS cells, which are tuned to rota-
tion about 9 axes in Calliphora (Krapp et al., 1998), respond to ocellar stimulation,
through which three axes of rotation are encoded. Although Parsons et al. (2010)
do not mention the possibility, it seems feasible that the VS cells receive this ocellar
input indirectly, via electrical connections with downstream neurons, for example.
Thus the L-neurons may o�er a rapid, low spatial resolution rotation signal together
with the somewhat slower, high-spatial resolution measure of rotation from VS cells
via the compound eyes, integrated by downstream neurons. Together, the ocellar and
compound eye systems may provide a balance of speed and spatial resolution in the
encoding of rotation by VS cells.
Self-motion information gleaned by the LPTC network is thought to contribute
to stability during walking and �ight. One of the established functions of the VS-HS
network output is in mediating compensatory head movements to stabilize the reti-
nal image. Flies control movement of the head using 21 neck muscles, each of which
is typically innervated by a single motor neuron (Milde et al., 1987; Strausfeld and
2This concept was proposed earlier by Blondeau and Heisenberg (1982) based on behavioralstudies using a Drosophila mutant with reduced optomotor responses.
9
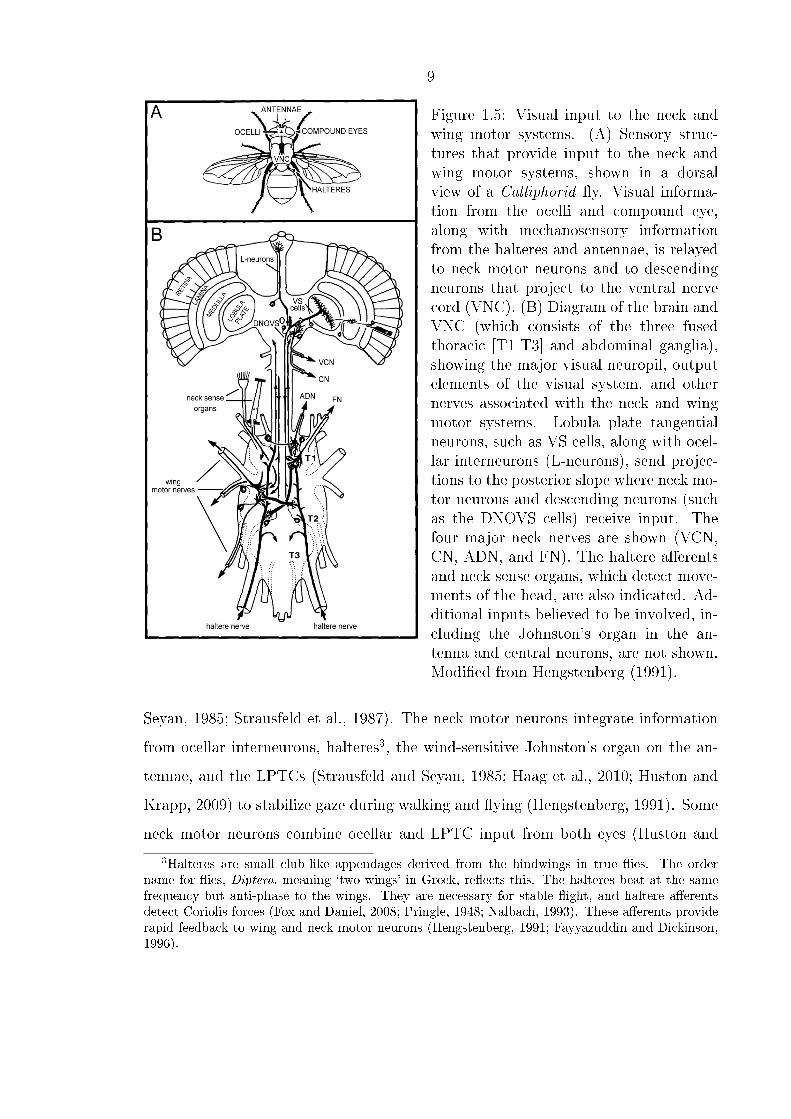
Figure 1.5: Visual input to the neck andwing motor systems. (A) Sensory struc-tures that provide input to the neck andwing motor systems, shown in a dorsalview of a Calliphorid �y. Visual informa-tion from the ocelli and compound eye,along with mechanosensory informationfrom the halteres and antennae, is relayedto neck motor neurons and to descendingneurons that project to the ventral nervecord (VNC). (B) Diagram of the brain andVNC (which consists of the three fusedthoracic [T1-T3] and abdominal ganglia),showing the major visual neuropil, outputelements of the visual system, and othernerves associated with the neck and wingmotor systems. Lobula plate tangentialneurons, such as VS cells, along with ocel-lar interneurons (L-neurons), send projec-tions to the posterior slope where neck mo-tor neurons and descending neurons (suchas the DNOVS cells) receive input. Thefour major neck nerves are shown (VCN,CN, ADN, and FN). The haltere a�erentsand neck sense organs, which detect move-ments of the head, are also indicated. Ad-ditional inputs believed to be involved, in-cluding the Johnston's organ in the an-tenna and central neurons, are not shown.Modi�ed from Hengstenberg (1991).
Seyan, 1985; Strausfeld et al., 1987). The neck motor neurons integrate information
from ocellar interneurons, halteres3, the wind-sensitive Johnston's organ on the an-
tennae, and the LPTCs (Strausfeld and Seyan, 1985; Haag et al., 2010; Huston and
Krapp, 2009) to stabilize gaze during walking and �ying (Hengstenberg, 1991). Some
neck motor neurons combine ocellar and LPTC input from both eyes (Huston and
3Halteres are small club-like appendages derived from the hindwings in true �ies. The ordername for �ies, Diptera, meaning `two wings' in Greek, re�ects this. The halteres beat at the samefrequency but anti-phase to the wings. They are necessary for stable �ight, and haltere a�erentsdetect Coriolis forces (Fox and Daniel, 2008; Pringle, 1948; Nalbach, 1993). These a�erents providerapid feedback to wing and neck motor neurons (Hengstenberg, 1991; Fayyazuddin and Dickinson,1996).
10
Krapp, 2008; Wertz et al., 2012) and respond very closely to rotational �ow �elds,
whereas others appear to respond to both translational and rotational motion (Hus-
ton and Krapp, 2008). In addition, the halteres gate the response of a number of neck
motor neurons, and Huston and Krapp (2009) suggested that this fusion of haltere
signals with LPTC output may contribute to fast head movements. Thus, self-motion
information is encoded by the integration of visual motion information from LPTCs
as well as other sensory modalities to control gaze. Figure 1.5 gives an overview of
this anatomy. Furthermore, an unidenti�ed central neuron, depending on behavioral
state, may also provide input to neck motor neurons (Haag et al., 2010). How the
LPTCs contribute to the control of the whole animal while navigating, via neck motor
neurons or other descending cells, however, is not fully understood.
A few studies have attempted to directly address the in�uence of LPTCs on behav-
ior. For example, Heisenberg et al. (1978) took advantage of a mutant �y, optomotor-
blindH31, that displayed de�cits in optomotor turning responses, to try to answer
this. VS and HS cells were absent in these �ies. In walking optomotor-blindH31 �ies,
turning reactions were signi�cantly reduced, but thrust and visually-induced landing
responses were not. Based on observations from previous studies, Heisenberg et al.
(1978) concluded that HS cells mediate turning responses, and that VS cells do not
mediate thrust responses. The weaknesses in this study, however (admitted by the
authors), is that the extent of this mutation is not well characterized. In a later study,
Geiger and Nassel (1981) attempted to more precisely excise VS and HS cell function
by ablating VS and HS neuron precursors on one side of the brain in third instar
Musca domestica larvae. After each experiment, Geiger and Nassel (1981) examined
the histology of the a�ected side to con�rm the absence of VS and HS cells. This
ablation protocol resulted in the absence of VS and HS cells with few other di�erences
with the control (non-ablated) side of the brain, although the lobula plate of the ab-
lated side was smaller in size. The authors claimed that the �ies' optomotor responses
to moving bars were not a�ected by the ablation, although the data presented in sup-
port of this is not entirely convincing given the large response variance (the authors
claimed the di�erence lay within the standard deviation of the torque response, but
11
the responses appear very qualitatively di�erent). Optomotor responses were a�ected
by ablation of VS and HS cells, according to the authors, in an experiment in which
a moving grating was presented instead of the stripe. The data for this experiment
was not included in the publication, however, and so we are left to trust the word of
the authors. In another experiment, Hausen and Wehrhahn (1983) microsurgically le-
sioned HS cell axons in Calliphora erythrocephala and observed a de�cit in the torque
response component associated with the lesioned right eye. These authors admitted
that the lesion may not have been constrained to the HS cells only - such that down-
stream neurons receiving input from the HS cells may also have been damaged. In
addition, it seems likely that output from other visual interneurons may also have
been severed by the manipulation. Although this study showed a convincing de�cit in
turning responses induced by lesioning axons from one optic lobe, it is not clear that
this can be attributed to HS cells alone. A similar, subsequent study by Hausen and
Wehrhahn (1990) provided further evidence that severing LPTC axons reduces opto-
motor behavior. None of these studies provides a complete picture of the individual
contribution of VS, HS, or other LPTCs in behavior, but they collectively support
the view that lobula plate interneurons are involved somehow in mediating turning
responses. It is important to remember in any functional study of the LPTCs that
they are a network of neurons whose outputs are integrated by downstream neurons
to extract behaviorally relevant information about self-motion. Indeed, the function
of the LPTC neurons may be appreciated not just by direct ablation experiments, but
by investigation of their output elements, which consist of the neck motor neurons
already discussed, as well as descending interneurons that project to the ventral nerve
cord.
A number of descending interneurons post-synaptic to the lobula plate have been
characterized anatomically, although few electrophysiological studies exist. Most
LPTCs project to the posterior slope (also called the lateral deuterocerebral neu-
ropil; Strausfeld and Bassemir, 1985; Ito et al., 1998, see Figure 1.1), or further in
towards the subesophageal ganglion (as HS cells do), where they make synaptic con-
nections with descending neurons that project to neck, leg, and wing motor centers
12
in the thoracic ganglion (Strausfeld and Seyan, 1985; Strausfeld and Bassemir, 1985;
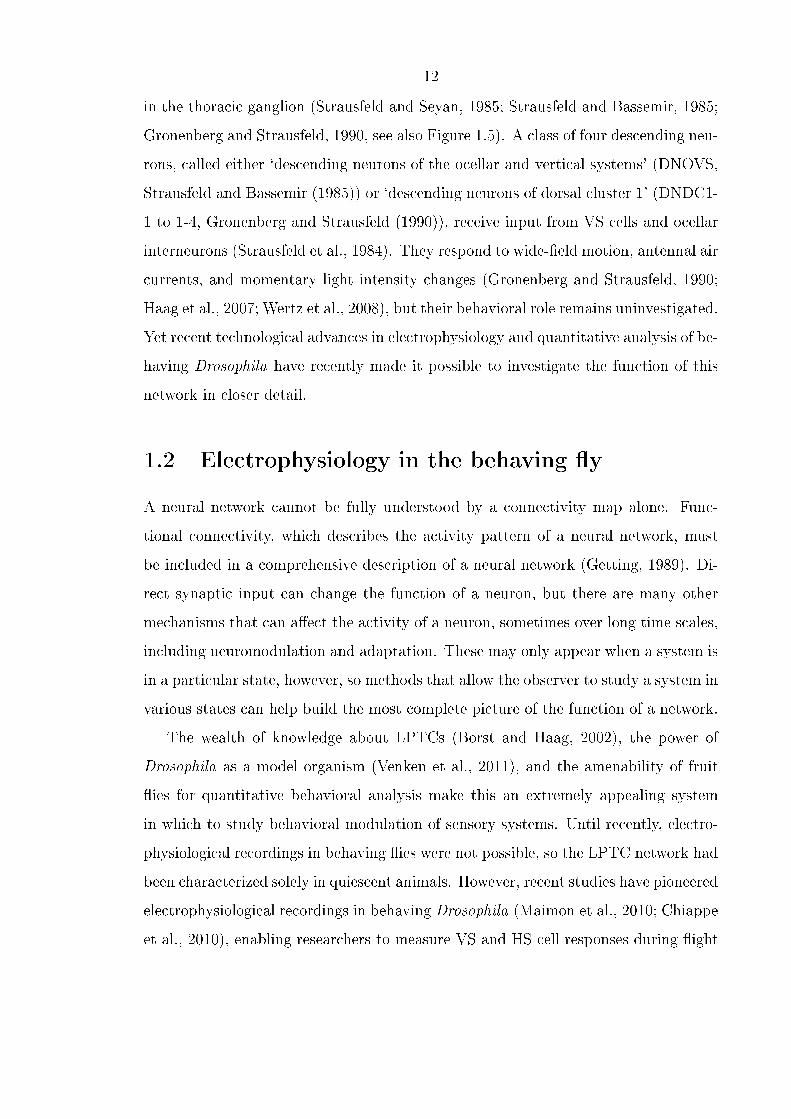
Gronenberg and Strausfeld, 1990, see also Figure 1.5). A class of four descending neu-
rons, called either `descending neurons of the ocellar and vertical systems' (DNOVS,
Strausfeld and Bassemir (1985)) or `descending neurons of dorsal cluster 1' (DNDC1-
1 to 1-4, Gronenberg and Strausfeld (1990)), receive input from VS cells and ocellar
interneurons (Strausfeld et al., 1984). They respond to wide-�eld motion, antennal air
currents, and momentary light intensity changes (Gronenberg and Strausfeld, 1990;
Haag et al., 2007; Wertz et al., 2008), but their behavioral role remains uninvestigated.
Yet recent technological advances in electrophysiology and quantitative analysis of be-
having Drosophila have recently made it possible to investigate the function of this
network in closer detail.
1.2 Electrophysiology in the behaving �y
A neural network cannot be fully understood by a connectivity map alone. Func-
tional connectivity, which describes the activity pattern of a neural network, must
be included in a comprehensive description of a neural network (Getting, 1989). Di-
rect synaptic input can change the function of a neuron, but there are many other
mechanisms that can a�ect the activity of a neuron, sometimes over long time scales,
including neuromodulation and adaptation. These may only appear when a system is
in a particular state, however, so methods that allow the observer to study a system in
various states can help build the most complete picture of the function of a network.
The wealth of knowledge about LPTCs (Borst and Haag, 2002), the power of
Drosophila as a model organism (Venken et al., 2011), and the amenability of fruit
�ies for quantitative behavioral analysis make this an extremely appealing system
in which to study behavioral modulation of sensory systems. Until recently, electro-
physiological recordings in behaving �ies were not possible, so the LPTC network had
been characterized solely in quiescent animals. However, recent studies have pioneered
electrophysiological recordings in behaving Drosophila (Maimon et al., 2010; Chiappe
et al., 2010), enabling researchers to measure VS and HS cell responses during �ight
13
and walking, respectively, for the �rst time.
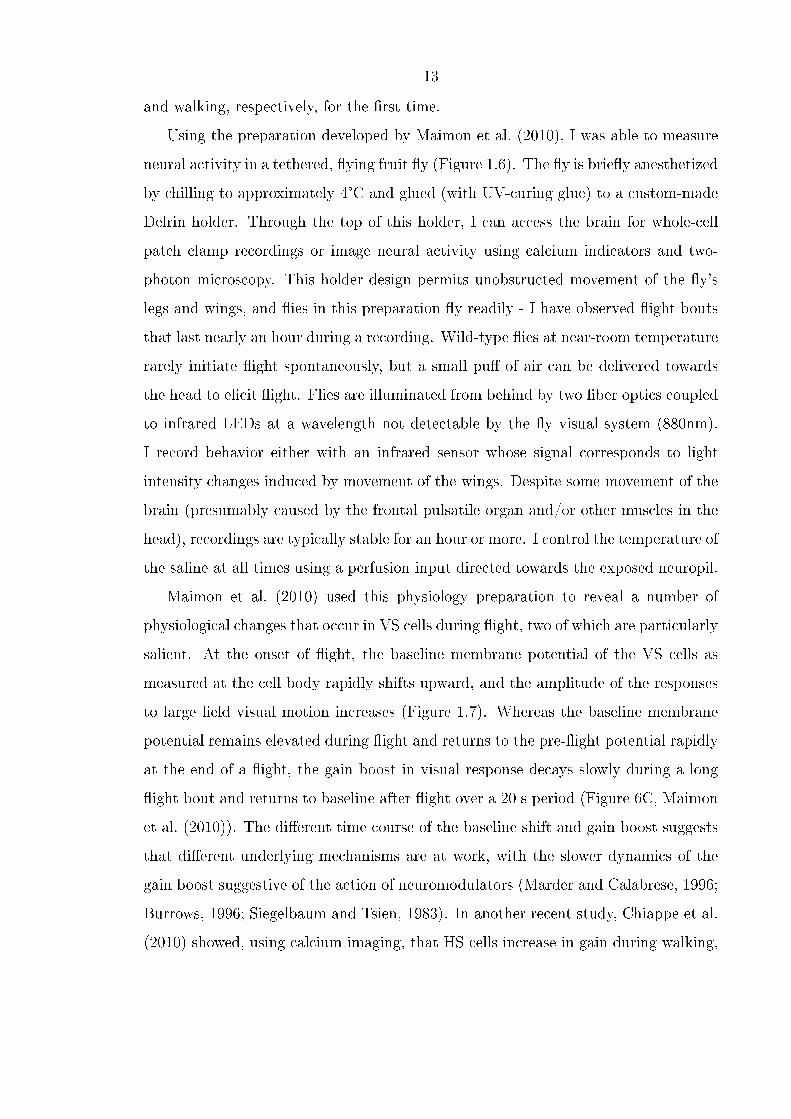
Using the preparation developed by Maimon et al. (2010), I was able to measure
neural activity in a tethered, �ying fruit �y (Figure 1.6). The �y is brie�y anesthetized
by chilling to approximately 4°C and glued (with UV-curing glue) to a custom-made
Delrin holder. Through the top of this holder, I can access the brain for whole-cell
patch clamp recordings or image neural activity using calcium indicators and two-
photon microscopy. This holder design permits unobstructed movement of the �y's
legs and wings, and �ies in this preparation �y readily - I have observed �ight bouts
that last nearly an hour during a recording. Wild-type �ies at near-room temperature
rarely initiate �ight spontaneously, but a small pu� of air can be delivered towards
the head to elicit �ight. Flies are illuminated from behind by two �ber optics coupled
to infrared LEDs at a wavelength not detectable by the �y visual system (880nm).
I record behavior either with an infrared sensor whose signal corresponds to light
intensity changes induced by movement of the wings. Despite some movement of the
brain (presumably caused by the frontal pulsatile organ and/or other muscles in the
head), recordings are typically stable for an hour or more. I control the temperature of
the saline at all times using a perfusion input directed towards the exposed neuropil.
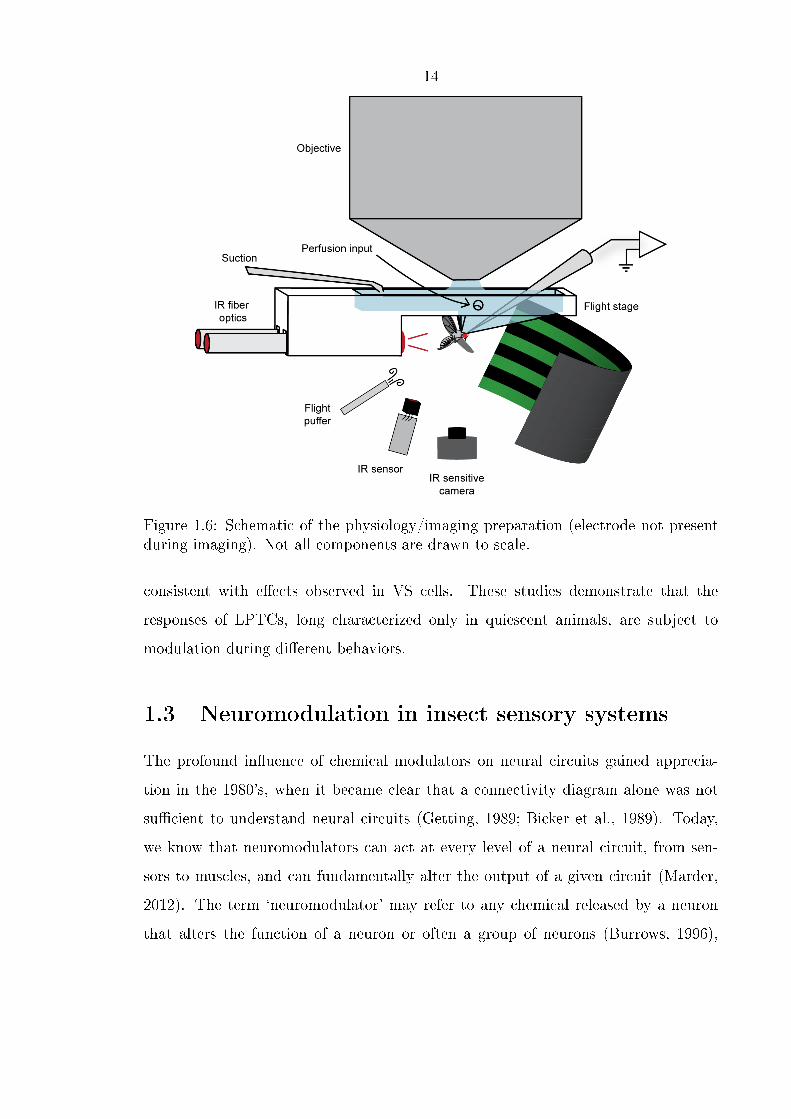
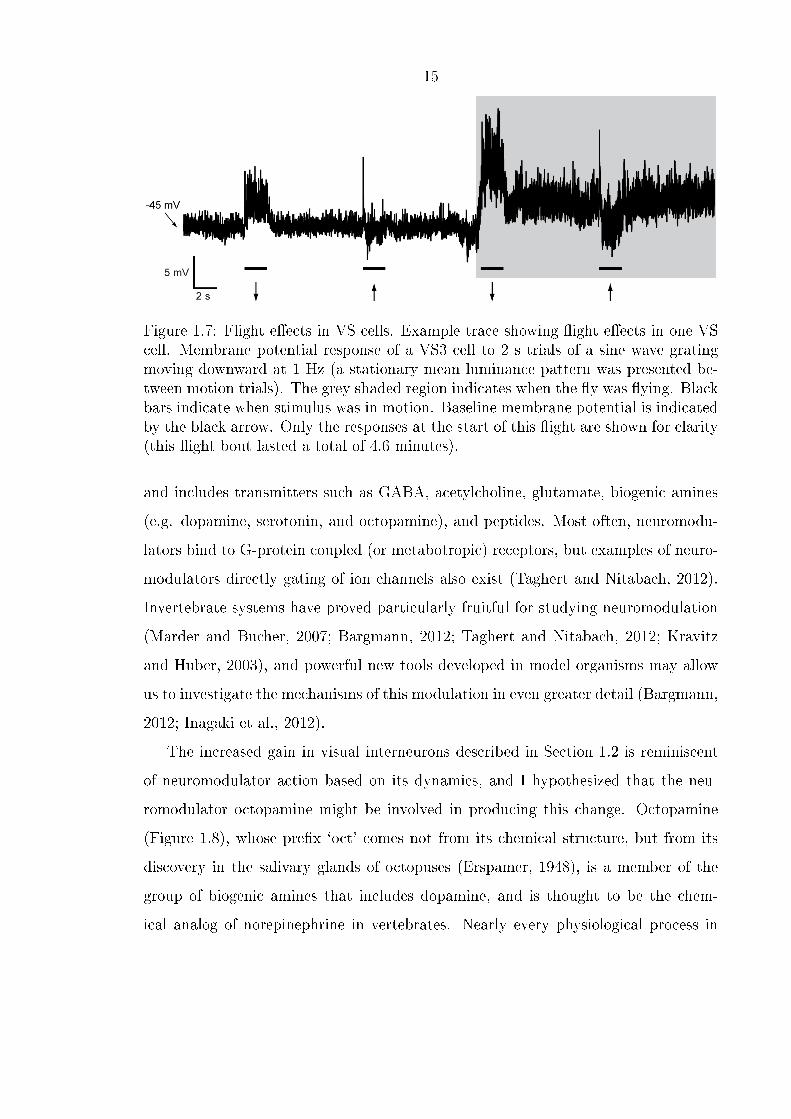
Maimon et al. (2010) used this physiology preparation to reveal a number of
physiological changes that occur in VS cells during �ight, two of which are particularly
salient. At the onset of �ight, the baseline membrane potential of the VS cells as
measured at the cell body rapidly shifts upward, and the amplitude of the responses
to large �eld visual motion increases (Figure 1.7). Whereas the baseline membrane
potential remains elevated during �ight and returns to the pre-�ight potential rapidly
at the end of a �ight, the gain boost in visual response decays slowly during a long
�ight bout and returns to baseline after �ight over a 20 s period (Figure 6C, Maimon
et al. (2010)). The di�erent time course of the baseline shift and gain boost suggests
that di�erent underlying mechanisms are at work, with the slower dynamics of the
gain boost suggestive of the action of neuromodulators (Marder and Calabrese, 1996;
Burrows, 1996; Siegelbaum and Tsien, 1983). In another recent study, Chiappe et al.
(2010) showed, using calcium imaging, that HS cells increase in gain during walking,
14
Figure 1.6: Schematic of the physiology/imaging preparation (electrode not presentduring imaging). Not all components are drawn to scale.
consistent with e�ects observed in VS cells. These studies demonstrate that the
responses of LPTCs, long characterized only in quiescent animals, are subject to
modulation during di�erent behaviors.
1.3 Neuromodulation in insect sensory systems
The profound in�uence of chemical modulators on neural circuits gained apprecia-
tion in the 1980's, when it became clear that a connectivity diagram alone was not
su�cient to understand neural circuits (Getting, 1989; Bicker et al., 1989). Today,
we know that neuromodulators can act at every level of a neural circuit, from sen-
sors to muscles, and can fundamentally alter the output of a given circuit (Marder,
2012). The term `neuromodulator' may refer to any chemical released by a neuron
that alters the function of a neuron or often a group of neurons (Burrows, 1996),
15
Figure 1.7: Flight e�ects in VS cells. Example trace showing �ight e�ects in one VScell. Membrane potential response of a VS3 cell to 2 s trials of a sine wave gratingmoving downward at 1 Hz (a stationary mean luminance pattern was presented be-tween motion trials). The grey shaded region indicates when the �y was �ying. Blackbars indicate when stimulus was in motion. Baseline membrane potential is indicatedby the black arrow. Only the responses at the start of this �ight are shown for clarity(this �ight bout lasted a total of 4.6 minutes).
and includes transmitters such as GABA, acetylcholine, glutamate, biogenic amines
(e.g. dopamine, serotonin, and octopamine), and peptides. Most often, neuromodu-
lators bind to G-protein coupled (or metabotropic) receptors, but examples of neuro-
modulators directly gating of ion channels also exist (Taghert and Nitabach, 2012).
Invertebrate systems have proved particularly fruitful for studying neuromodulation
(Marder and Bucher, 2007; Bargmann, 2012; Taghert and Nitabach, 2012; Kravitz
and Huber, 2003), and powerful new tools developed in model organisms may allow
us to investigate the mechanisms of this modulation in even greater detail (Bargmann,
2012; Inagaki et al., 2012).
The increased gain in visual interneurons described in Section 1.2 is reminiscent
of neuromodulator action based on its dynamics, and I hypothesized that the neu-
romodulator octopamine might be involved in producing this change. Octopamine
(Figure 1.8), whose pre�x `oct' comes not from its chemical structure, but from its
discovery in the salivary glands of octopuses (Erspamer, 1948), is a member of the
group of biogenic amines that includes dopamine, and is thought to be the chem-
ical analog of norepinephrine in vertebrates. Nearly every physiological process in
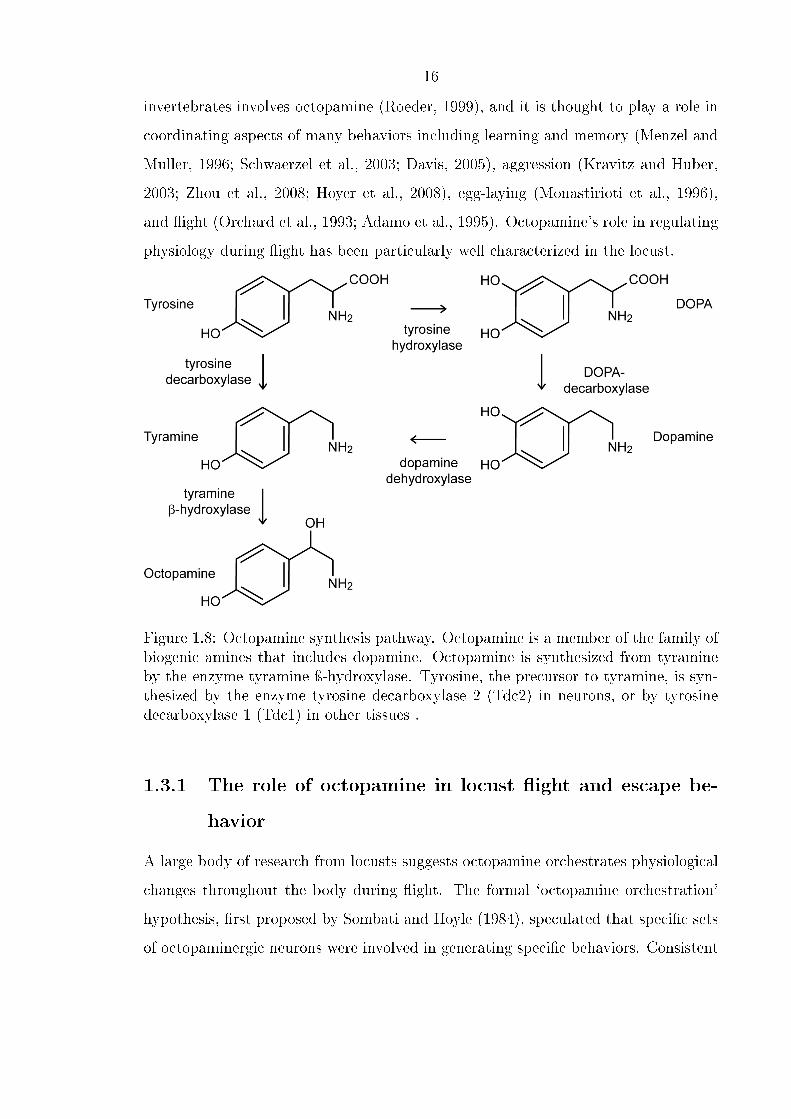
16
invertebrates involves octopamine (Roeder, 1999), and it is thought to play a role in
coordinating aspects of many behaviors including learning and memory (Menzel and
Muller, 1996; Schwaerzel et al., 2003; Davis, 2005), aggression (Kravitz and Huber,
2003; Zhou et al., 2008; Hoyer et al., 2008), egg-laying (Monastirioti et al., 1996),
and �ight (Orchard et al., 1993; Adamo et al., 1995). Octopamine's role in regulating
physiology during �ight has been particularly well characterized in the locust.
Figure 1.8: Octopamine synthesis pathway. Octopamine is a member of the family ofbiogenic amines that includes dopamine. Octopamine is synthesized from tyramineby the enzyme tyramine ÿ-hydroxylase. Tyrosine, the precursor to tyramine, is syn-thesized by the enzyme tyrosine decarboxylase 2 (Tdc2) in neurons, or by tyrosinedecarboxylase 1 (Tdc1) in other tissues .
1.3.1 The role of octopamine in locust �ight and escape be-
havior
A large body of research from locusts suggests octopamine orchestrates physiological
changes throughout the body during �ight. The formal `octopamine orchestration'
hypothesis, �rst proposed by Sombati and Hoyle (1984), speculated that speci�c sets
of octopaminergic neurons were involved in generating speci�c behaviors. Consistent
17
with this hypothesis, certain octopaminergic cells in the locust brain, such as the dor-
sal unpaired median (DUM) neuron, become tonically active during �ight (Ramirez
and Orchard, 1990). Furthermore, pharmacological application of octopamine ap-
pears to elicit a general arousal process in�uencing many features of the animal's
�ight system including proprioceptors, interneurons, and muscles (Orchard et al.,
1993). With respect to possible e�ects on visual processing, there is a set of seven
octopaminergic neurons in the locust brain with extensive arborizations in the op-
tic lobes, and two of these may play a role in dishabituation of the visual system
(Stern et al., 1995). For example, the octopaminergic PM4 neuron, which responds
to visual, wind, and tactile stimuli, innervates a large region of the optic lobes, and
is thought to dishabituate lobula giant motion detector (LGMD) via endogenous re-
lease of octopamine (Roeder, 1999; Stern et al., 1995). The LGMD then projects
to the descending contralateral movement detector (DCMD), a multimodal descend-
ing interneuron involved in escape re�exes (Bacon et al., 1995; Rowell, 1971; Pearson
et al., 1980; Fotowat et al., 2011). Thus, octopamine appears to play a role in visually
mediated behaviors in the locust.
1.3.2 Modulation of visual interneurons in �ies
More recently, studies in blow�ies have shown that the octopamine agonist chlordime-
form can modulate the response properties of lobula plate tangential neurons in a
manner similar to that observed in �ight (Jung et al., 2011; Longden and Krapp,
2009, 2010). Speci�cally, chlordimeform, when bath-applied, induced an increase
in response range and decreased latency of two spiking LPTCs, V1 and V2 (Long-
den and Krapp, 2009). Similarly, chlordimeform induced an increase in spontaneous
activity, a frequency-dependent decrease in motion adaptation, and an increased re-
sponse gain to moving gratings in the horizontally sensitive H2 neuron. Furthermore,
Jung et al. (2011) showed that during �ight, the response of H1 increases at higher
temporal frequencies, and that chlordimeform roughly reproduced this increase. Re-
cently Rien et al. (2012) also found evidence that chlordimeform reduces the contrast
18
gain adaptation of V1 and H1 neurons, and hypothesized that this adaptation occurs
presynaptic to the LPTCs. Together, these studies showed that the activity of LPTCs
is altered by the octopamine agonist chlordimeform, and suggest that �ight may alter
their response properties via octopamine. However, these results left unclear what
the neuronal basis of such modulation might be, and what functional e�ect this may
have for the behavior of the animal.
1.4 Thesis overview
In this thesis, I describe a body of work aimed at determining the mechanism and
function of the �ight e�ects observed in the visual system of Drosophila melanogaster.
I begin by characterizing the neuronal basis of the �ight e�ects observed in visual
interneurons and provide strong evidence that octopamine neurons that project to
the optic lobe become active during �ight, and are necessary and su�cient to produce
the �ight boost in VS cells. In the hopes of determining the role of single octopamine
neurons in this system, I then use intersectional genetic tools to manipulate the
activity of a single octopamine neuron that projects to many regions of the optic lobes,
including the lobula plate, where the dendrites of the behaviorally modulated visual
interneurons are located. I also explore the origin of the �ight boost by quantifying
the e�ect of wind stimuli on responses of VS cells. Lastly, we examine the functional
consequences of the �ight changes by manipulating the activity of octopamine neurons
in freely �ying �ies, and provide preliminary evidence that these neurons underlie a
gain mechanism that underlies �ight speed control.
19
Chapter 2
Octopamine neurons mediate
�ight-induced modulation of visual
interneurons in Drosophila
2.1 Introduction
Recent studies showed that the activity of VS cells is modulated during �ight (Mai-
mon et al., 2010), and pharmacological experiments in blow�ies (see Section 1.3.2), as
well as a wealth of evidence in locusts (Section 1.3.1), suggest that parts of the insect
visual system may be modulated by octopamine. However, the role of octopamine in
modulating these e�ects in behaving Drosophila was not established. We used a com-
bination of whole cell patch clamp recordings and calcium imaging in tethered, �ying
Drosophila to assess whether or not octopamine neurons play a de�nitive role in mod-
ulating VS cells. To more fully characterize the responses of VS cells in both quiescent
and �ying �ies, I �rst quanti�ed the average responses to large �eld vertical motion
across a range of temporal frequencies. I then measured the e�ect of exogenous appli-
cation of octopamine, which produced similar e�ects in VS cells as observed during
�ight. Next, using the genetically-encoded calcium indicator GCaMP3 (Tian et al.,
2009) we tested whether octopamine neurons become active during �ight. Finally, I
manipulated endogenous release of octopamine through ectopic expression of dTrpA1
and Kir2.1 channels and was able to reproduce or abolish aspects of the naturally
occurring �ight boost. These results provide the �rst evidence that octopamine cells
20
increase in activity during �ight in Drosophila, and are both necessary and su�cient
to produce the �ight boost in VS cells.
2.2 Experimental procedures
2.2.1 Animals
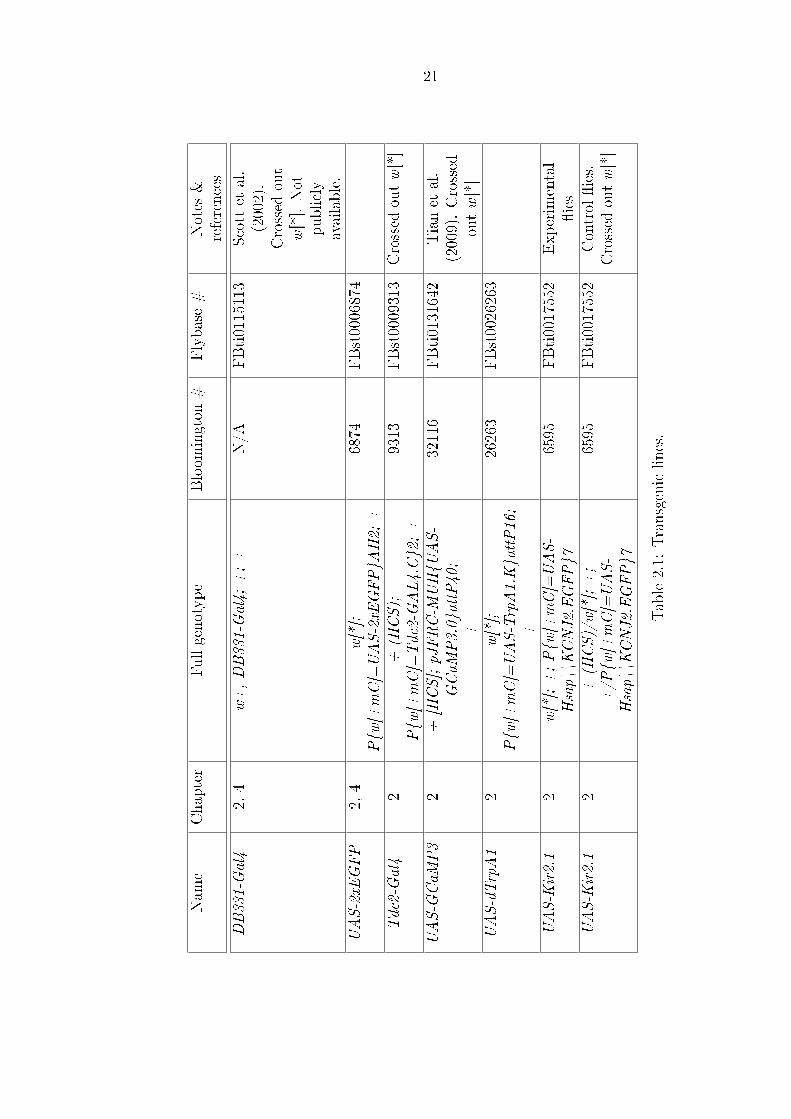
I used 1-3 day old female Drosophila melanogaster raised on standard cornmeal
medium at 25°C with a 14:10 light/dark schedule. Our experiments made use of
the following transgenic constructs: DB331-Gal4 (Scott et al., 2002, FBti0115113),
UAS-2xEGFP (Bloomington 6874), Tdc2-Gal4 (Bloomington 9313), UAS-red stinger
(FBtp0018199), UAS-mCD8GFP (FBst0005137), UAS-GCaMP3 (Tian et al., 2009),
UAS-dTrpA1 (Bloomington 26263), and UAS-Kir2.1-EGFP (FBti0017552). For
some �y strains, we crossed in the white (w+) gene onto the �rst chromosome (using
the Heisenberg Canton-S background) so that all �ies had one functioning wild-type
copy of the gene. See Table 2.1 for complete genotypes of these �ies. To encourage
long �ight bouts, I removed the pro- and meso-thoracic legs.
2.2.2 Whole cell patch clamp recordings
Using a preparation described previously (Maimon et al., 2010), I performed whole-
cell patch clamp recordings on VS cells 1-4 in the right brain hemisphere (Figure 1.6).
In some experiments, I used EGFP to target VS cell bodies by using DB331-Gal4,
UAS-2xEGFP �ies with subsequent veri�cation of cell identity using dye �lls (see
Figure 1.2) as well as the electrophysiological responses. For all other experiments in
which the VS cells were not labeled with EGFP, I identi�ed the cell type after each
experiment using dye �lls and cell response properties alone.
I used electrodes with resistances of 4.8-7.4 MW. Our intracellular, external, and
collagenase solutions were identical to those used in Maimon et al. (2010). I added
20µM Alexa 568 (Invitrogen #A-10437) and 13mM biocytin (Invitrogen #B1093) to
the intracellular solution for cell visualization. For 13 cells, I omitted biocytin and
21
Nam
eChapter
Fullgenotype
Bloom
ington
#Flybase#
Notes
&references
DB331-Gal4
2,4
w+,DB331-Gal4;
+;+
N/A
FBti0115113
Scott
etal.
(2002).
Crossed
out
w[*].Not
publicly
available.
UAS-2xE
GFP
2,4
w[*];
P{w
[+mC]=UAS-2xE
GFP}A
H2;
+6874
FBst0006874
Tdc2-Gal4
2+
(HCS);
P{w
[+mC]=Tdc2-GAL4.C}2;+
9313
FBst0009313
Crossed
outw[*]
UAS-G
CaM
P3
2+
[HCS];pJFRC-M
UH{U
AS-
GCaM
P3.0}attP40;
+
32116
FBti0131642
Tianet
al.
(2009).Crossed
outw[*]
UAS-dTrpA1
2w[*];
P{w
[+mC]=UAS-TrpA1.K}attP16;
+
26263
FBst0026263
UAS-K
ir2.1
2w[*];+;P{w
[+mC]=UAS-
Hsap\\K
CNJ2.EGFP}7
6595
FBti0017552
Experim
ental
�ies
UAS-K
ir2.1
2+
(HCS)/w[*];+;
+/P
{w[+mC]=UAS-
Hsap\\K
CNJ2.EGFP}7
6595
FBti0017552
Control
�ies.
Crossed
outw[*]
Table2.1:
Transgeniclines.
22
observed no obvious e�ect in the physiological responses. The average resting po-
tential of cells after compensation for an experimentally-measured junction potential
(-13mV) was -46.4mV. I injected 20-30pA constant hyperpolarizing current into the
cells prior to presentation of visual stimuli to aid with dye �lls, which decreased the
membrane potential by an average of 3.6mV (to -50.0 mV). The access resistance
(Racc) for all recordings was 31.8 +/- 6.8 MW S.D., which is in the typical range for
Drosophila whole-cell patch clamp recordings (Wilson et al., 2004). Any cells with
Racc greater than 50MW were excluded from my analysis.
I controlled the temperature of the bath with a bipolar temperature controller
and an in-line heater/cooler (CL-100 and SC-20, Warner Instruments). For all ex-
periments, with the exception of dTrpA1-activation and parental controls, I raised
the bath temperature to 30°C during the initial desheathing step, and then lowered
the bath to temperature 19°C for the remainder of the experiment. I performed the
desheathing without any applied heat in all dTrpA1 activation and parental control
experiments to avoid contaminating results with pre-exposure to heat. For these
dTrpA1 activation experiments, I held the external saline at 19°C, increased it to
28°C over a time course of approximately 120 s, and then lowered it back to 19°C.
2.2.3 Visual display and stimuli
I presented �ies with vertically-moving sine wave grating stimuli (8 pixels, approxi-
mately 20° per cycle) using an electronic LED display (Reiser and Dickinson, 2008)
as described in Maimon et al. (2010). I presented upward and downward-moving
stimuli at a temporal frequency of 1, 2, 4, 8, 16, or 24 Hz, as well as a stationary
sine wave grating (0 Hz), in pseudorandom order. In addition, I presented the visual
stimulus beginning at a position chosen randomly from one of four quadrants in the
sine-wave pattern. VS cells showed a slight decay in response over multiple cycles of
this stimulus, so I presented each stimulus for 1 to 4 s to obtain a measure of at least
four cycles. Thus, I presented 0, 1, 2, 4, 8, 16, and 24 Hz stimuli for 1, 4, 2, 1, 1, 1,
and 1 s, respectively. I presented 1 s of stationary mean luminance between stimuli.
23
2.2.4 Pharmacology
I dissolved octopamine (DL-Octopamine hydrochloride, Fluka) in extracellular saline
at a concentration of 100µM on the day of each experiment. For comparison, this
concentration of octopamine, the lowest level at which VS cell responses were notice-
ably and reliably a�ected, lies at or near concentrations used in previous studies in
locusts (Ramirez and Pearson, 1991; Matheson, 1997), crustaceans (Goaillard et al.,
2004), and crickets (Kosakai et al., 2008). To my knowledge, no measurements have
been made of in vivo concentrations of octopamine in various tissues in the brain of
Drosophila for comparison. Octopamine levels in the hemolymph of crickets (Adamo
et al., 1995) and locusts (Goosey and Candy, 1980) become elevated during �ight
(235.5+-117.7 nM and 173+-8nM , relatively), and although the levels used in pre-
vious pharmacology experiments surpassed these concentrations, it is unclear how
hemolymph levels correlate with that of the neuropil where neurons of interest are
located. I modi�ed the holder from Maimon et al. (2010) to more rapidly apply oc-
topamine by aiming the perfusion input directly towards the exposed neuropil. The
cells never fully recovered to pre-octopamine levels of activity during a washout of
octopamine, so I do not present these responses.
2.2.5 Immunohistochemistry
We dissected brains in 4% paraformaldehyde in PBS and �xed for a total of 30
minutes. We then incubated them overnight at 4°C in a primary antibody solution
containing 5% normal goat serum in PBS-Tx, mouse anti-nc82 (1:10, DSHB) and
rabbit anti-GFP (1:1000, Invitrogen). Brains were then incubated overnight at 4°C
in a secondary antibody solution containing 5% normal goat serum in PBS-Tx, goat
anti-mouse Alexa Fluor 633 (1:250, Invitrogen) and goat anti-rabbit Alexa Fluor 488
(1:250, Invitrogen). We then mounted the brains in Vectashield and imaged them
on a Leica SP5 II confocal microscope under 40x magni�cation and scanned at 1µm
section intervals. We adjusted intensity and contrast for single channels for the entire
image using ImageJ 1.45s.
24
2.2.6 Calcium imaging
Using the same holder and procedures as in the electrophysiology experiments, we1
tethered �ies to the holder and removed the cuticle and fat tissue above either the
lobula plate or the posterior slope surrounding the esophagus foramen to gain optical
access to putative dendrites of octopamine neurons that project to the optic lobes
(Busch et al., 2009).
We imaged the brain using the Prairie Ultima IV two-photon excitation micro-
scope controlled by Prairie View Acquisition software (Prairie Technologies). We used
a mode locked Ti:Sapphire laser (Chameleon Ultra; Coherent) tuned to 930 nm as an
excitation light source and adjusted the laser power to be 20 mW at the rear aper-
ture of the objective lens (Nikon NIR Ap, 40x water-immersion lens, 0.8 NA). We
collected �uorescence using a multi-alkali photomultiplier tube (Hamamatsu) after
bandpass �ltering it with an HQ525/70m-2p emission �lter (Chroma Technologies).
We acquired images in a frame scan mode (152x150 pixels, 0.125 s/frame) to record
activity of octopamine neurons. For each trial, we acquired images for 30 s, starting
from 10 s before the �ight onset. For each �y, we acquired a z-stack image (z step
= 1 µm) covering the entire dendritic branch of the octopamine neurons near the
esophagus foramen to con�rm the location of each recording within the brain.
2.2.7 Data analysis and statistics
For whole cell patch clamp recordings, I acquired data at 10 kHz using Axoscope
software. All data analyses were done using Matlab R2010b. I calculated peak visual
responses by �rst down-sampling the data to 1 kHz. I then calculated a moving
average of the membrane potential over a window of 10 points (10 ms) and selected
the peak during the �rst cycle of stimulus motion.
To initiate �ight, I applied a small pu� of air directed towards the �y's head. If
�ight was not initiated after a pu�, I observed an increase in visual responses that
1Akira Mamiya performed the calcium imaging experiments described in this chapter. Any use ofthe �rst person plural in this chapter and subsequent chapters, when discussing the calcium imagingexperiments, should be interpreted to include him.
25
returned to pre-pu� levels in 20 s or less. Thus, I excluded visual responses from
the measure of quiescent responses for 20 s after I applied a pu� of air if the �y did
not initiate �ight. This resulted in at most a di�erence of -0.27 mV in average quies-
cent visual response. I used one- and two-tailed Student's t-tests to make statistical
comparisons of the data.
For two-photon imaging experiments, we applied a brief pu� of air to the head of
the �y to initiate �ight, as in the electrophysiology experiments. If a �y was still �ying
after the end of two-photon image acquisition (approximately 20 s after the onset of
�ight), we terminated the �ight by manually delivering a second pu� of air. We waited
4 minutes between initiations of �ight in the same animal. Only �ies that �ew for at
least �ve bouts lasting 12 s or more were included in the analysis. Throughout the
experiment, we illuminated the �y from behind with a high-intensity infrared diode
(880nm; Golden Dragon; Osram) and used a Basler A602f camera with a �xed-focus
lens (In�nistix 90, 94 mm working distance, 1.0x magni�cation) to record the behavior
of the �y from below at 100 frames/s. We used FView (Straw and Dickinson, 2009),
an open source program written in Python, to record images of �ies simultaneously
with a signal that indicates the timing of two-photon image acquisition. We analyzed
images using custom software written in Matlab 2011b. We identi�ed the stereotypic
cluster of thick dendritic branches of octopamine neurons and terminal regions in
the lobula plate based on the basal �uorescence of GCaMP3 and chose this area
as a region of interest (ROI). We then averaged the pixel intensity in the ROI to
estimate the �uorescence from this region. We �rst smoothed the acquired images
with a Gaussian �lter (3 x 3 pixel, sv= 0.5) and corrected for small movements of the
brain in the x-y direction during the image acquisition using a previously published
algorithm (Guizar-Sicairos et al., 2008). We then averaged the pixel intensity in the
ROI to estimate the �uorescence from this region. For each trial, we reviewed the
images of �ight behavior and determined the �ight onset time by �nding the �rst
frame after the application of the air pu� where a �y moves its wing forward. We
then used the simultaneously recorded signal that indicates the timing of two-photon
image acquisition to �nd the frame in the calcium imaging that corresponds to �ight
26
onset time. We used average �uorescence during the �ve s period before the onset
of the �ight as baseline �uorescence (F0) and used this value to calculate the DF/F
signal (de�ned as (F-F0)/F0). We calculated mean DF/F signal for each �y using 5
to 6 trials.
2.3 Results
2.3.1 Flight-dependent modulation of VS cell response ampli-
tude depends on temporal frequency of motion
Previous results indicate that the physiological properties of VS cells are modulated
during �ight (Maimon et al., 2010). Before investigating the e�ects of octopamine
in this system, I wished to characterize more completely the �ight modulation ob-
served in this earlier report. Speci�cally, �ight-dependent observations in VS cells
were quanti�ed in Maimon et al. (2010) at a single temporal frequency (1 Hz), so
it remained unclear how the �ight boost might vary across the broad tuning curve
of these cells (Joesch et al., 2008). As indicated in Figure 2.1, I presented �ies with
large �eld upward and downward motion across temporal frequencies ranging from 1
to 24 Hz (Figure 2.1C). The responses of VS cells during quiescence were strongest at
a temporal frequency of 1 Hz and exhibited phase-locking with the motion stimulus,
consistent with previous studies (Joesch et al., 2008). The responses to a stepwise
change in motion at all temporal frequencies exhibited an early peak followed by a
gradual decay, with the rate of decay tending to increase with increasing temporal fre-
quency. Given these dynamics, I chose to further quantify and compare cell responses
throughout the paper by measuring the baseline-subtracted peak response to down-
ward visual motion, as indicated in Figure 2.1B, although analyses based on steady
state responses and/or responses to upward motion lead to identical conclusions (data
not shown). Our results are consistent with recent studies from walking Drosophila
(Chiappe et al., 2010) and �ying blow�ies (Jung et al., 2011), which showed that
these behaviors are associated with an increase in the visual responses of HS and H1
27
neurons at many temporal frequencies. As in these studies, I observed a broadening
of the tuning curve at higher frequencies during locomotion. In contrast to the results
of these prior studies, I did not observe an upward shift in the temporal frequency
that elicits a maximal response in VS cells, nor do I observe as large an e�ect at the
highest temporal frequencies. The results of our temporal frequency analysis indicate
that the VS cell responses in both quiescent and �ying preparations are greatest at a
temporal frequency of 1 Hz, and that the �ight-dependent boost in visual responses
is actually greatest at temporal frequencies of 2 to 8 Hz (Figure 2.1D and 2.1E). This
e�ect of �ight represented a 20-30% increase in response as measured at the cell body
of the VS cells.
2.3.2 Bath application of octopamine reproduces �ight e�ects
in quiescent �ies
Given the wealth of evidence linking octopamine to �ight modulation in insects
(Brembs et al., 2007; Goosey and Candy, 1980; Longden and Krapp, 2009; Jung
et al., 2011; Orchard et al., 1993; Ramirez and Orchard, 1990; Sombati and Hoyle,
1984), I hypothesized that octopamine might be responsible for these physiological
changes during �ight. I measured the responses of VS cells to visual motion across the
same range of temporal frequencies used in the experiments described above before
and during bath application of 100 µM octopamine. Upon octopamine application,
the resting potential of the VS cells rose and their response to visual motion increased,
similar to the e�ects observed during �ight (Figure 2.2). Application of control saline
did not induce either of these two e�ects (Figure 2.3). During octopamine applica-
tion, baseline membrane potential shifted upward during �ight by 2.24 +/- 1.2mV,
which is smaller but not signi�cantly di�erent (at P = 0.05 level) than the baseline
shift produced during �ight in the absence of octopamine (3.42 +/- 1.5mV; two-tailed
Student's t-test; P = 0.051; Figure 2.4). However, no additional increase in the visual
response to motion was observed in the VS cells when the animals were �ying. These
results show that octopamine, when applied exogenously, can mimic the changes in
28
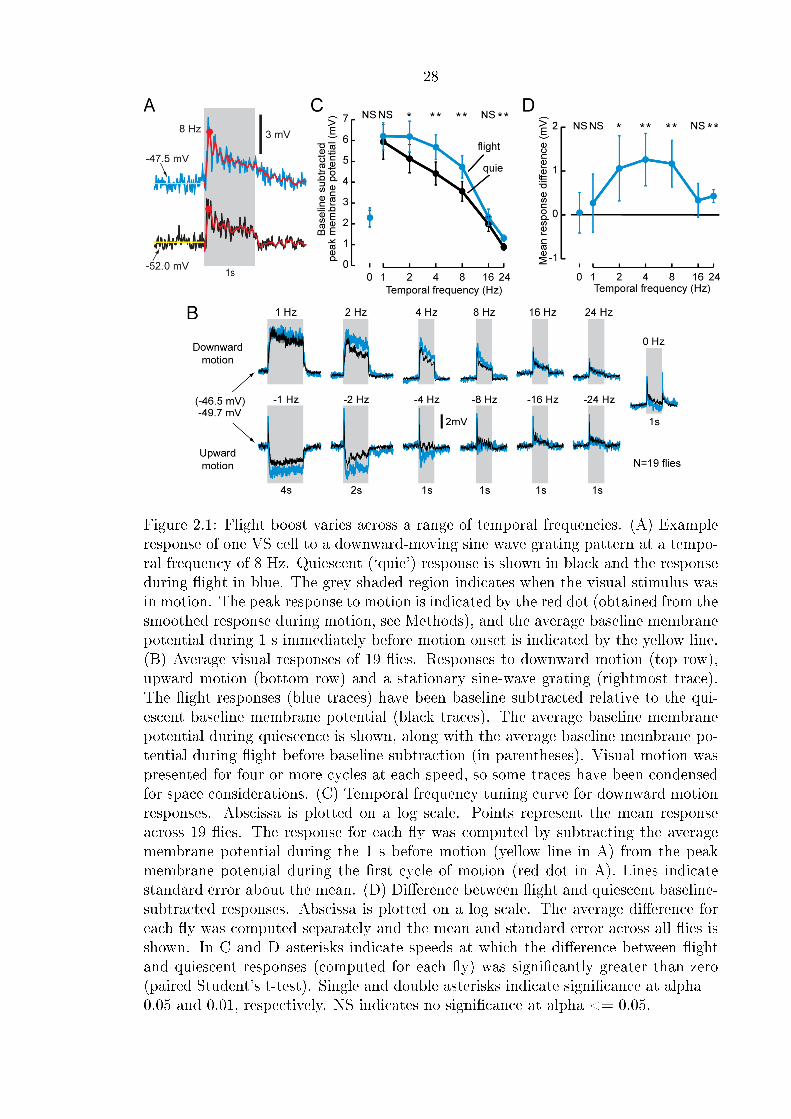
Figure 2.1: Flight boost varies across a range of temporal frequencies. (A) Exampleresponse of one VS cell to a downward-moving sine wave grating pattern at a tempo-ral frequency of 8 Hz. Quiescent (`quie') response is shown in black and the responseduring �ight in blue. The grey shaded region indicates when the visual stimulus wasin motion. The peak response to motion is indicated by the red dot (obtained from thesmoothed response during motion, see Methods), and the average baseline membranepotential during 1 s immediately before motion onset is indicated by the yellow line.(B) Average visual responses of 19 �ies. Responses to downward motion (top row),upward motion (bottom row) and a stationary sine-wave grating (rightmost trace).The �ight responses (blue traces) have been baseline subtracted relative to the qui-escent baseline membrane potential (black traces). The average baseline membranepotential during quiescence is shown, along with the average baseline membrane po-tential during �ight before baseline subtraction (in parentheses). Visual motion waspresented for four or more cycles at each speed, so some traces have been condensedfor space considerations. (C) Temporal frequency tuning curve for downward motionresponses. Abscissa is plotted on a log scale. Points represent the mean responseacross 19 �ies. The response for each �y was computed by subtracting the averagemembrane potential during the 1 s before motion (yellow line in A) from the peakmembrane potential during the �rst cycle of motion (red dot in A). Lines indicatestandard error about the mean. (D) Di�erence between �ight and quiescent baseline-subtracted responses. Abscissa is plotted on a log scale. The average di�erence foreach �y was computed separately and the mean and standard error across all �ies isshown. In C and D asterisks indicate speeds at which the di�erence between �ightand quiescent responses (computed for each �y) was signi�cantly greater than zero(paired Student's t-test). Single and double asterisks indicate signi�cance at alpha =0.05 and 0.01, respectively. NS indicates no signi�cance at alpha <= 0.05.
29
VS cell responses to motion observed during �ight.
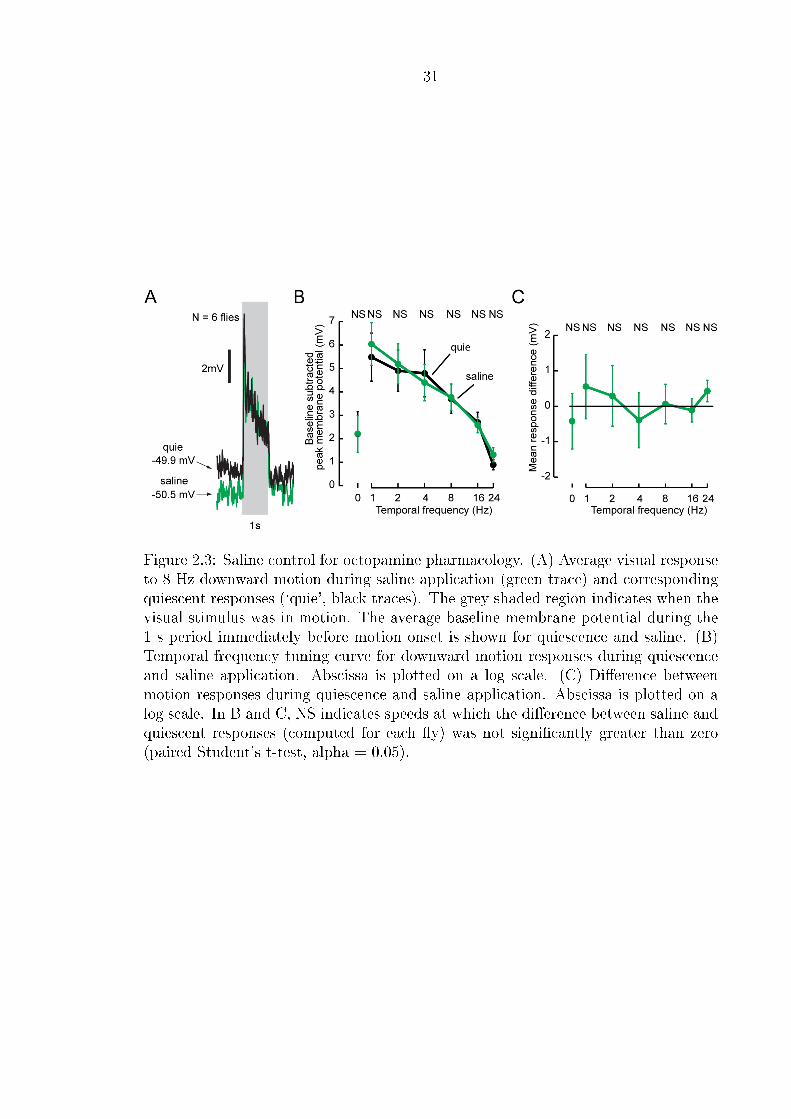
2.3.3 Octopaminergic neurons with optic lobe projections show
an increase in activity during �ight
Although octopamine application induces changes in VS cell physiology that resemble
those observed in �ight, pharmacology alone cannot prove the role of endogenous
octopamine neurons in the �ight boost. One critical prediction of this hypothesis
is that octopamine neurons must become active at the onset of �ight. A set of six
octopaminergic neurons (called AL2 neurons by Busch et al., 2009 and G3a neurons
by Sinakevitch and Strausfeld, 2006) send projections to the optic lobes, making them
good candidate neurons for the modulation of visual responses. These neurons each
send a large process along the esophageal foramen before reaching the posterior slope
(Busch et al., 2009). Using a selective driver line (Tdc2-Gal4, Busch et al., 2009), I
made an attempt to conduct whole cell patch recordings from octopamine neurons,
however the position of the cells bodies within the brain prohibited the use of a
gentle enough dissection to permit recordings in �ying animals. As an alternative
strategy, we used the same driver line to express the genetically-encoded calcium
indicator GCaMP3 (Tian et al., 2009), and measured their calcium activity during
�ight using 2-photon imaging. Although the Gal4 driver line we used likely targets all
octopamine neurons, we restricted our analysis to two areas, the lobula plate and the
region of brain surrounding the esophageal foramen where the optic-lobe projecting
cells have large and overlapping dendrites (Figure 2.4A). During �ight, the activity
of octopamine cells in these two regions increased (Figure 2.4B), suggesting that they
could indeed serve a role in modulating the activity of neurons within the optic lobes
during �ight. The time course of the GCaMP3 signal was slightly di�erent in the two
regions, with the �uorescent change decaying more rapidly in the �ne terminals of the
lobula plate. Without simultaneous electrophysiological recordings or neurochemical
measurements, we cannot determine how the GCaMP3 signal correlates with either
�ring rate or transmitter release. We veri�ed that the response was not a motion
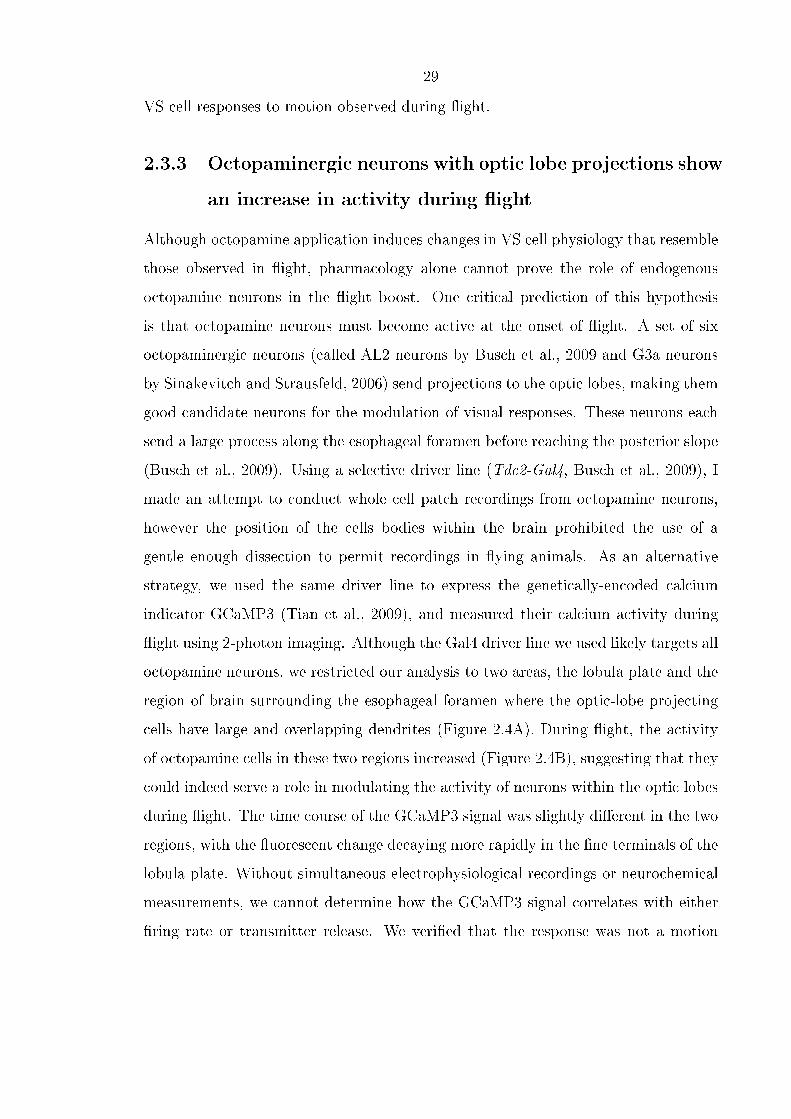
30
Figure 2.2: Octopamine reproduces �ight e�ects. (A) Average visual response to 8Hz downward motion during �ight (left, blue trace) and during octopamine appli-cation (OA; right, green trace) and corresponding quiescent responses (`quie', blacktraces). The grey shaded region indicates when the visual stimulus was in motion.The average baseline membrane potential during the 1 s immediately before motiononset is shown for quiescence, �ight and OA. (B) Temporal frequency tuning curve fordownward motion responses during quiescence and octopamine application. Abscissais plotted on a log scale. (C) Di�erence between motion responses during quiescenceand octopamine application. Abscissa is plotted on a log scale. In B and C responsesand statistics were computed as described in Figure 2.1D and 2.1E. Asterisks indicatespeeds at which the di�erence between the responses during octopamine applicationand quiescence (computed for each �y) was signi�cantly greater than zero (pairedStudent's t-test). Single and double asterisks indicate signi�cance at alpha = 0.05and 0.01, respectively.
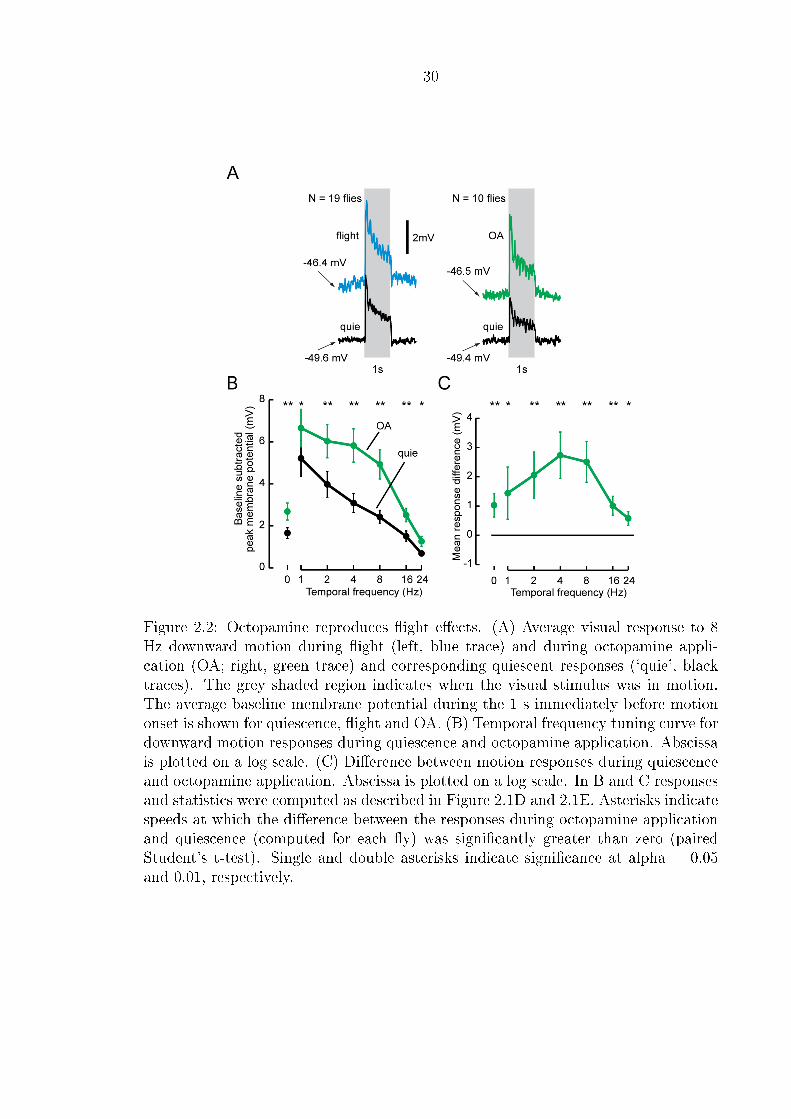
31
Figure 2.3: Saline control for octopamine pharmacology. (A) Average visual responseto 8 Hz downward motion during saline application (green trace) and correspondingquiescent responses (`quie', black traces). The grey shaded region indicates when thevisual stimulus was in motion. The average baseline membrane potential during the1 s period immediately before motion onset is shown for quiescence and saline. (B)Temporal frequency tuning curve for downward motion responses during quiescenceand saline application. Abscissa is plotted on a log scale. (C) Di�erence betweenmotion responses during quiescence and saline application. Abscissa is plotted on alog scale. In B and C, NS indicates speeds at which the di�erence between saline andquiescent responses (computed for each �y) was not signi�cantly greater than zero(paired Student's t-test, alpha = 0.05).
32
artifact by driving expression of EGFP instead of GCaMP3 in octopamine neurons,
and observed no change in �uorescence in the overlapping dendrites during �ight
(Figure 2.4B).
2.3.4 Activation of octopamine neurons causes an increase in
VS cell responses to motion
In the �rst sets of experiments in this chapter, we found that exogenously applied
octopamine mimics the e�ects seen in VS cell responses during �ight and that oc-
topamine neurons that project to the optic lobes are active during �ight. The two
remaining critical tests are that activation of octopamine neurons are both su�cient
and necessary to induce the physiological changes observed during �ight. To test
for su�ciency, I expressed dTrpA1 channels in octopamine neurons using the Tdc2-
Gal4 driver and tested whether I could reproduce the �ight e�ect in quiescent �ies
by activating the octopamine neurons with temperature. In these experiments (and
all subsequent experiments described in this paper) I did not co-express EGFP in
VS cells for identifying the somata for recording. However, I was able to target VS
cell bodies for recording based on their relative size and position in the brain, and
could unambiguously identify the cells after each experiment using a combination of
response properties and anatomy. Using a non-permissive temperature that matched
our previous experiments (19°C), I �rst measured the pre-heat responses of VS cells
across the range of temporal frequencies. I then quickly (within 120 s) clamped the
temperature of the external saline to 28°C in order to activate dTrpA1 channels, and
measured the responses of the VS cells. Many �ies responded to the elevation of
bath temperature by spontaneously initiating �ight, but in these cases I waited until
they stopped �ying before beginning our measurements of VS cell responses. I also
lowered the temperature back to 19°C to record post-heat responses. Our results
show that temperature activation of dTrpA1 channels in octopamine neurons causes
a large rise in resting potential and a substantial increase in the amplitude of the re-
sponses to visual motion during quiescence (Figure 2.5). Both e�ects were completely
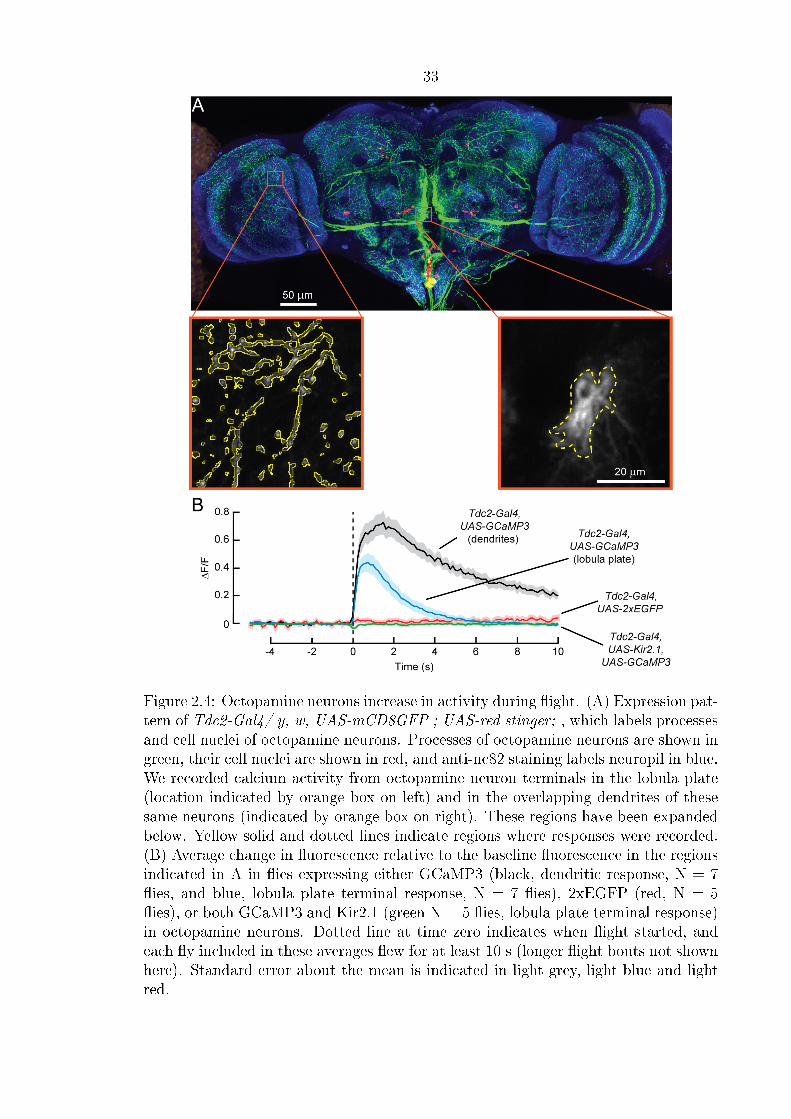
33
Figure 2.4: Octopamine neurons increase in activity during �ight. (A) Expression pat-tern of Tdc2-Gal4/ y, w, UAS-mCD8GFP ; UAS-red stinger; , which labels processesand cell nuclei of octopamine neurons. Processes of octopamine neurons are shown ingreen, their cell nuclei are shown in red, and anti-nc82 staining labels neuropil in blue.We recorded calcium activity from octopamine neuron terminals in the lobula plate(location indicated by orange box on left) and in the overlapping dendrites of thesesame neurons (indicated by orange box on right). These regions have been expandedbelow. Yellow solid and dotted lines indicate regions where responses were recorded.(B) Average change in �uorescence relative to the baseline �uorescence in the regionsindicated in A in �ies expressing either GCaMP3 (black, dendritic response, N = 7�ies, and blue, lobula plate terminal response, N = 7 �ies), 2xEGFP (red, N = 5�ies), or both GCaMP3 and Kir2.1 (green N = 5 �ies, lobula plate terminal response)in octopamine neurons. Dotted line at time zero indicates when �ight started, andeach �y included in these averages �ew for at least 10 s (longer �ight bouts not shownhere). Standard error about the mean is indicated in light grey, light blue and lightred.
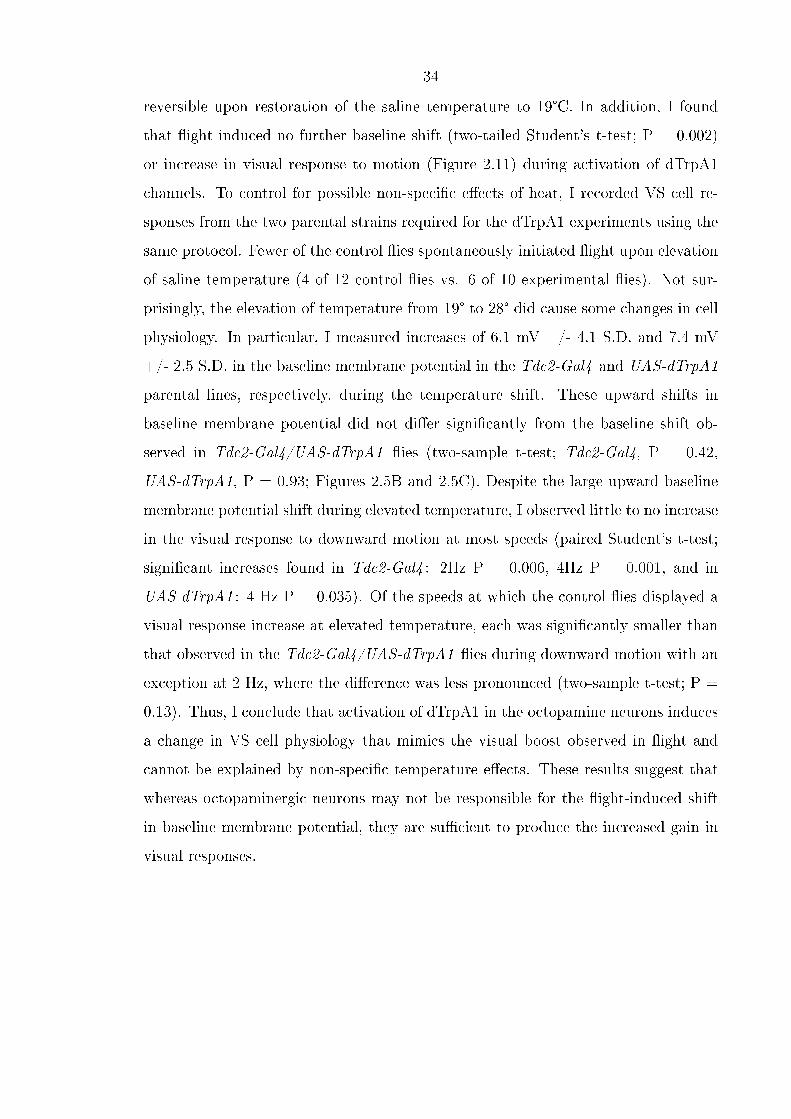
34
reversible upon restoration of the saline temperature to 19°C. In addition, I found
that �ight induced no further baseline shift (two-tailed Student's t-test; P = 0.002)
or increase in visual response to motion (Figure 2.11) during activation of dTrpA1
channels. To control for possible non-speci�c e�ects of heat, I recorded VS cell re-
sponses from the two parental strains required for the dTrpA1 experiments using the
same protocol. Fewer of the control �ies spontaneously initiated �ight upon elevation
of saline temperature (4 of 12 control �ies vs. 6 of 10 experimental �ies). Not sur-
prisingly, the elevation of temperature from 19° to 28° did cause some changes in cell
physiology. In particular, I measured increases of 6.1 mV +/- 4.1 S.D. and 7.4 mV
+/- 2.5 S.D. in the baseline membrane potential in the Tdc2-Gal4 and UAS-dTrpA1
parental lines, respectively, during the temperature shift. These upward shifts in
baseline membrane potential did not di�er signi�cantly from the baseline shift ob-
served in Tdc2-Gal4/UAS-dTrpA1 �ies (two-sample t-test; Tdc2-Gal4, P = 0.42,
UAS-dTrpA1, P = 0.93; Figures 2.5B and 2.5C). Despite the large upward baseline
membrane potential shift during elevated temperature, I observed little to no increase
in the visual response to downward motion at most speeds (paired Student's t-test;
signi�cant increases found in Tdc2-Gal4 : 2Hz P = 0.006, 4Hz P = 0.001, and in
UAS-dTrpA1 : 4 Hz P = 0.035). Of the speeds at which the control �ies displayed a
visual response increase at elevated temperature, each was signi�cantly smaller than
that observed in the Tdc2-Gal4/UAS-dTrpA1 �ies during downward motion with an
exception at 2 Hz, where the di�erence was less pronounced (two-sample t-test; P =
0.13). Thus, I conclude that activation of dTrpA1 in the octopamine neurons induces
a change in VS cell physiology that mimics the visual boost observed in �ight and
cannot be explained by non-speci�c temperature e�ects. These results suggest that
whereas octopaminergic neurons may not be responsible for the �ight-induced shift
in baseline membrane potential, they are su�cient to produce the increased gain in
visual responses.
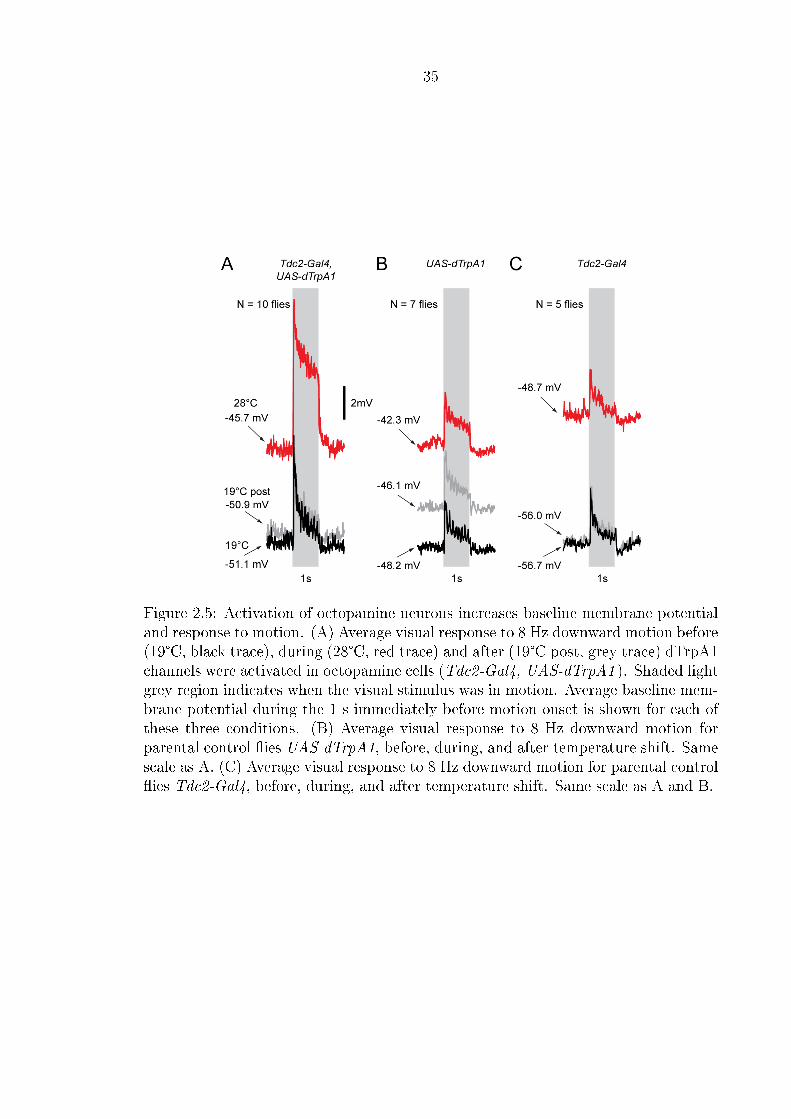
35
Figure 2.5: Activation of octopamine neurons increases baseline membrane potentialand response to motion. (A) Average visual response to 8 Hz downward motion before(19°C, black trace), during (28°C, red trace) and after (19°C post, grey trace) dTrpA1channels were activated in octopamine cells (Tdc2-Gal4, UAS-dTrpA1 ). Shaded lightgrey region indicates when the visual stimulus was in motion. Average baseline mem-brane potential during the 1 s immediately before motion onset is shown for each ofthese three conditions. (B) Average visual response to 8 Hz downward motion forparental control �ies UAS-dTrpA1, before, during, and after temperature shift. Samescale as A. (C) Average visual response to 8 Hz downward motion for parental control�ies Tdc2-Gal4, before, during, and after temperature shift. Same scale as A and B.
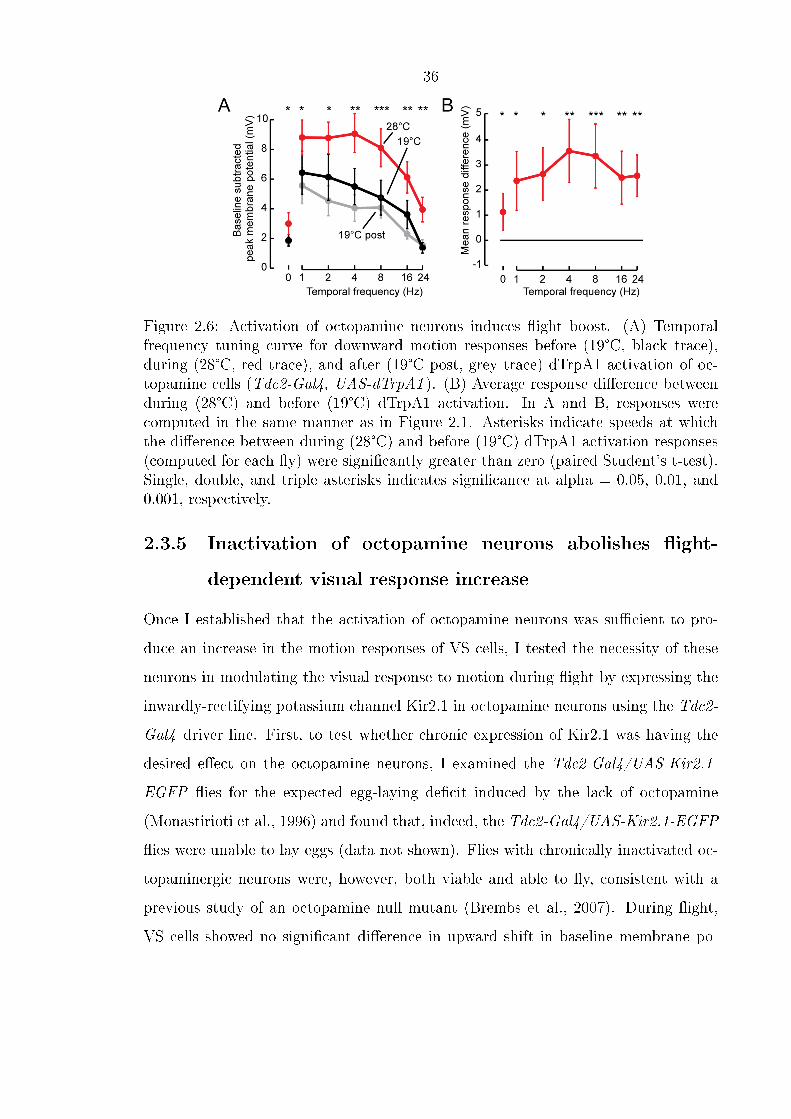
36
Figure 2.6: Activation of octopamine neurons induces �ight boost. (A) Temporalfrequency tuning curve for downward motion responses before (19°C, black trace),during (28°C, red trace), and after (19°C post, grey trace) dTrpA1 activation of oc-topamine cells (Tdc2-Gal4, UAS-dTrpA1 ). (B) Average response di�erence betweenduring (28°C) and before (19°C) dTrpA1 activation. In A and B, responses werecomputed in the same manner as in Figure 2.1. Asterisks indicate speeds at whichthe di�erence between during (28°C) and before (19°C) dTrpA1 activation responses(computed for each �y) were signi�cantly greater than zero (paired Student's t-test).Single, double, and triple asterisks indicates signi�cance at alpha = 0.05, 0.01, and0.001, respectively.
2.3.5 Inactivation of octopamine neurons abolishes �ight-
dependent visual response increase
Once I established that the activation of octopamine neurons was su�cient to pro-
duce an increase in the motion responses of VS cells, I tested the necessity of these
neurons in modulating the visual response to motion during �ight by expressing the
inwardly-rectifying potassium channel Kir2.1 in octopamine neurons using the Tdc2-
Gal4 driver line. First, to test whether chronic expression of Kir2.1 was having the
desired e�ect on the octopamine neurons, I examined the Tdc2-Gal4/UAS-Kir2.1-
EGFP �ies for the expected egg-laying de�cit induced by the lack of octopamine
(Monastirioti et al., 1996) and found that, indeed, the Tdc2-Gal4/UAS-Kir2.1-EGFP
�ies were unable to lay eggs (data not shown). Flies with chronically inactivated oc-
topaminergic neurons were, however, both viable and able to �y, consistent with a
previous study of an octopamine null mutant (Brembs et al., 2007). During �ight,
VS cells showed no signi�cant di�erence in upward shift in baseline membrane po-
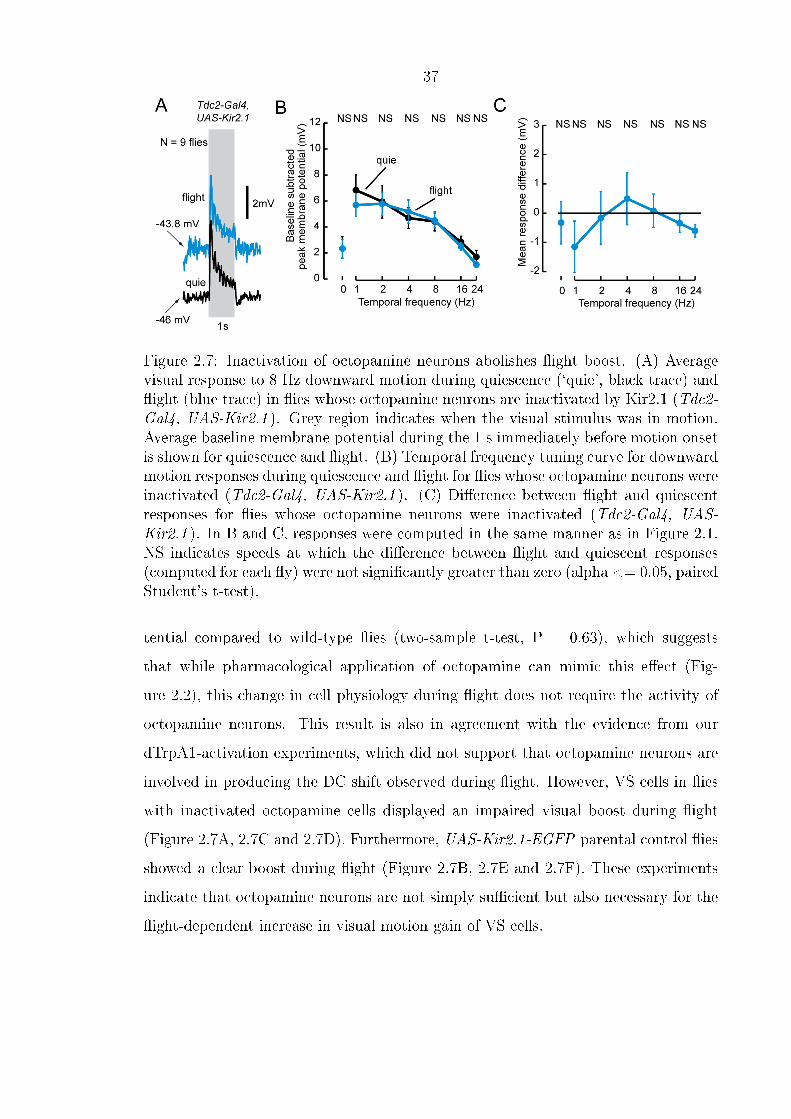
37
Figure 2.7: Inactivation of octopamine neurons abolishes �ight boost. (A) Averagevisual response to 8 Hz downward motion during quiescence (`quie', black trace) and�ight (blue trace) in �ies whose octopamine neurons are inactivated by Kir2.1 (Tdc2-Gal4, UAS-Kir2.1 ). Grey region indicates when the visual stimulus was in motion.Average baseline membrane potential during the 1 s immediately before motion onsetis shown for quiescence and �ight. (B) Temporal frequency tuning curve for downwardmotion responses during quiescence and �ight for �ies whose octopamine neurons wereinactivated (Tdc2-Gal4, UAS-Kir2.1 ). (C) Di�erence between �ight and quiescentresponses for �ies whose octopamine neurons were inactivated (Tdc2-Gal4, UAS-Kir2.1 ). In B and C, responses were computed in the same manner as in Figure 2.1.NS indicates speeds at which the di�erence between �ight and quiescent responses(computed for each �y) were not signi�cantly greater than zero (alpha <= 0.05, pairedStudent's t-test).
tential compared to wild-type �ies (two-sample t-test, P = 0.63), which suggests
that while pharmacological application of octopamine can mimic this e�ect (Fig-
ure 2.2), this change in cell physiology during �ight does not require the activity of
octopamine neurons. This result is also in agreement with the evidence from our
dTrpA1-activation experiments, which did not support that octopamine neurons are
involved in producing the DC shift observed during �ight. However, VS cells in �ies
with inactivated octopamine cells displayed an impaired visual boost during �ight
(Figure 2.7A, 2.7C and 2.7D). Furthermore, UAS-Kir2.1-EGFP parental control �ies
showed a clear boost during �ight (Figure 2.7B, 2.7E and 2.7F). These experiments
indicate that octopamine neurons are not simply su�cient but also necessary for the
�ight-dependent increase in visual motion gain of VS cells.
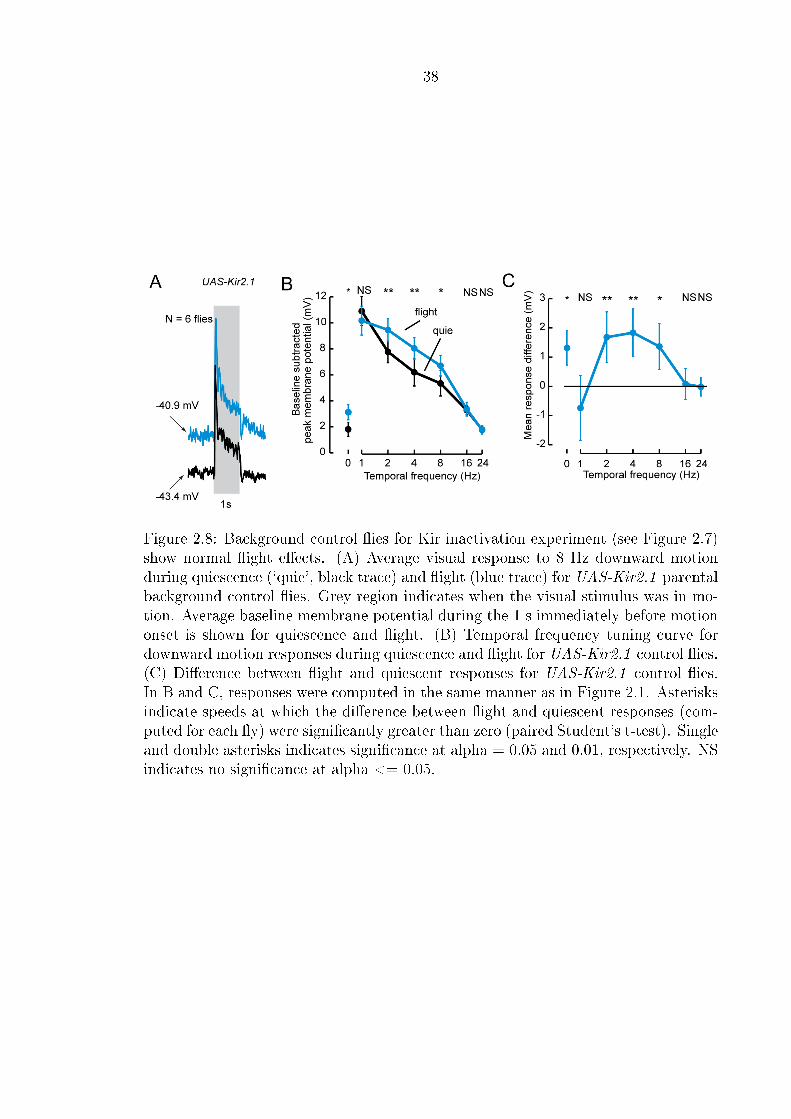
38
Figure 2.8: Background control �ies for Kir inactivation experiment (see Figure 2.7)show normal �ight e�ects. (A) Average visual response to 8 Hz downward motionduring quiescence (`quie', black trace) and �ight (blue trace) for UAS-Kir2.1 parentalbackground control �ies. Grey region indicates when the visual stimulus was in mo-tion. Average baseline membrane potential during the 1 s immediately before motiononset is shown for quiescence and �ight. (B) Temporal frequency tuning curve fordownward motion responses during quiescence and �ight for UAS-Kir2.1 control �ies.(C) Di�erence between �ight and quiescent responses for UAS-Kir2.1 control �ies.In B and C, responses were computed in the same manner as in Figure 2.1. Asterisksindicate speeds at which the di�erence between �ight and quiescent responses (com-puted for each �y) were signi�cantly greater than zero (paired Student's t-test). Singleand double asterisks indicates signi�cance at alpha = 0.05 and 0.01, respectively. NSindicates no signi�cance at alpha <= 0.05.
39
2.4 Discussion
In this chapter I presented evidence that octopamine neurons play a key role in the
modulation of large �eld visual interneurons during �ight. I characterized the motion
response of VS cells during �ight across a broad range of temporal frequencies, and
found that the boost in visual gain is variable across speeds (Figure 2.1), consistent
with previous studies in walking and �ying �ies (Chiappe et al., 2010; Jung et al.,
2011). Exogenous application of octopamine replicates many features of the change
in VS cell physiology observed during �ight (Figure 2.3). This result supports the
�ndings of previous extracellular studies in blow�ies that reported an increase in the
response gain of other lobula plate tangential cells after pharmacological application
of the octopamine agonist chlordimeform (Jung et al., 2011; Longden and Krapp,
2009, 2010). Although these pharmacological experiments are suggestive of a role of
octopamine in modulating visual responses during �ight, it is important to demon-
strate that the endogenous system of octopamine neurons is actually responsible for
the e�ect. By using GCaMP3 to monitor activity, we found that the octopamine neu-
rons with dense innervations in the optic lobes do indeed increase in activity at the
onset of �ight (Figure 2.4). When I activated the octopamine neurons via ectopically-
expressed dTrpA1, these neurons evoke a very large increase in the VS cell responses
to visual motion in quiescent �ies (Figure 2.5), indicating that the activation of oc-
topamine neurons is su�cient to generate the e�ect. The complementary experiment,
in which I inactivated octopamine neurons using Kir2.1 (Figure 2.7), demonstrated
that these neurons are also necessary to produce the �ight boost. Figure 2.9 shows a
summary of the average responses for each experimental condition and control.
Our activation and inactivation experiments suggest that the octopamine neurons
play a major role in producing the �ight boost observed in VS cells. The activity of
two di�erent regions of these neurons, the dendrites and output terminals in the lob-
ula plate, appears to be somewhat di�erent, and raises questions about the dynamics
of octopamine neurons relative to the �ight boost. In the lobula plate, these neurons
produced a smaller increase in �uorescence during �ight, relative to their input re-
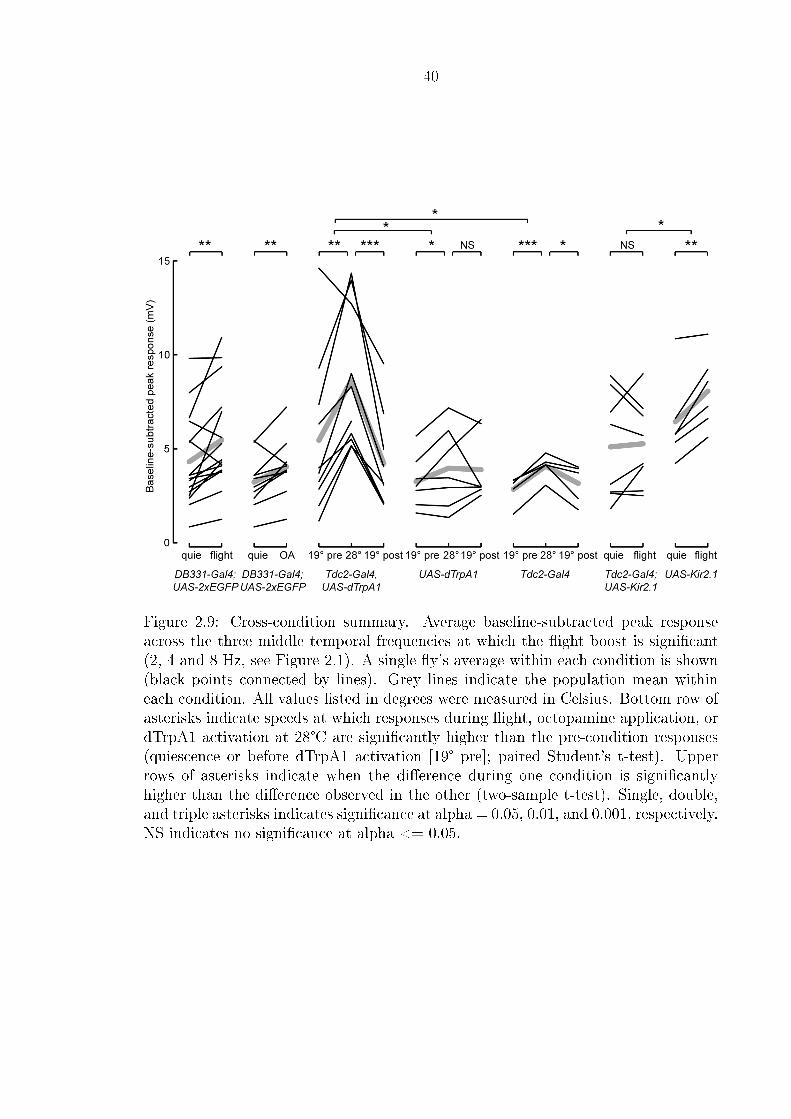
40
Figure 2.9: Cross-condition summary. Average baseline-subtracted peak responseacross the three middle temporal frequencies at which the �ight boost is signi�cant(2, 4 and 8 Hz, see Figure 2.1). A single �y's average within each condition is shown(black points connected by lines). Grey lines indicate the population mean withineach condition. All values listed in degrees were measured in Celsius. Bottom row ofasterisks indicate speeds at which responses during �ight, octopamine application, ordTrpA1 activation at 28°C are signi�cantly higher than the pre-condition responses(quiescence or before dTrpA1 activation [19° pre]; paired Student's t-test). Upperrows of asterisks indicate when the di�erence during one condition is signi�cantlyhigher than the di�erence observed in the other (two-sample t-test). Single, double,and triple asterisks indicates signi�cance at alpha = 0.05, 0.01, and 0.001, respectively.NS indicates no signi�cance at alpha <= 0.05.
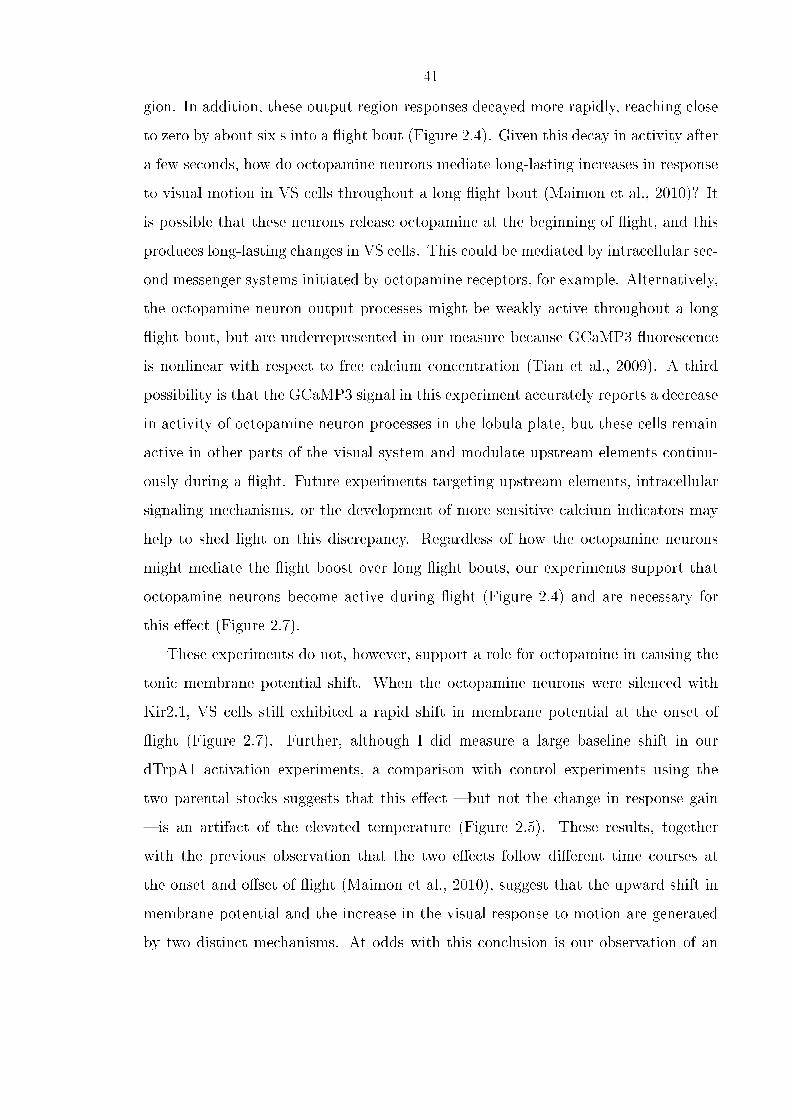
41
gion. In addition, these output region responses decayed more rapidly, reaching close
to zero by about six s into a �ight bout (Figure 2.4). Given this decay in activity after
a few seconds, how do octopamine neurons mediate long-lasting increases in response
to visual motion in VS cells throughout a long �ight bout (Maimon et al., 2010)? It
is possible that these neurons release octopamine at the beginning of �ight, and this
produces long-lasting changes in VS cells. This could be mediated by intracellular sec-
ond messenger systems initiated by octopamine receptors, for example. Alternatively,
the octopamine neuron output processes might be weakly active throughout a long
�ight bout, but are underrepresented in our measure because GCaMP3 �uorescence
is nonlinear with respect to free calcium concentration (Tian et al., 2009). A third
possibility is that the GCaMP3 signal in this experiment accurately reports a decrease
in activity of octopamine neuron processes in the lobula plate, but these cells remain
active in other parts of the visual system and modulate upstream elements continu-
ously during a �ight. Future experiments targeting upstream elements, intracellular
signaling mechanisms, or the development of more sensitive calcium indicators may
help to shed light on this discrepancy. Regardless of how the octopamine neurons
might mediate the �ight boost over long �ight bouts, our experiments support that
octopamine neurons become active during �ight (Figure 2.4) and are necessary for
this e�ect (Figure 2.7).
These experiments do not, however, support a role for octopamine in causing the
tonic membrane potential shift. When the octopamine neurons were silenced with
Kir2.1, VS cells still exhibited a rapid shift in membrane potential at the onset of
�ight (Figure 2.7). Further, although I did measure a large baseline shift in our
dTrpA1 activation experiments, a comparison with control experiments using the
two parental stocks suggests that this e�ect � but not the change in response gain
� is an artifact of the elevated temperature (Figure 2.5). These results, together
with the previous observation that the two e�ects follow di�erent time courses at
the onset and o�set of �ight (Maimon et al., 2010), suggest that the upward shift in
membrane potential and the increase in the visual response to motion are generated
by two distinct mechanisms. At odds with this conclusion is our observation of an
42
Figure 2.10: E�ect of �ight during octopamine application. (A) Average visual re-sponse to 8 Hz downward motion during quiescence (`quie', black traces), octopamineapplication (OA; green trace) and �ight during octopamine application (OA �ight;purple trace). The grey shaded region indicates when the visual stimulus was in mo-tion. The average baseline membrane potential during the 1 s immediately beforemotion onset is shown for quiescence, OA and OA �ight. (B) Temporal frequencytuning curve for downward motion responses during quiescence, octopamine applica-tion, and �ight during octopamine application. Abscissa is plotted on a log scale. (C)Di�erence between motion responses during octopamine application and quiescence,and �ight during octopamine application and quiescence. Abscissa is plotted on alog scale. In B and C, NS indicates speeds at which the di�erence between OA �ightresponses and OA responses (computed for each �y) was not signi�cantly greater thanzero (paired Student's t-test, alpha = 0.05).
upward baseline shift in VS cells during pharmacological application of octopamine
(Figure 2.3). Pharmacological application of the octopamine agonist chlordimeform
has also been shown to cause an increase in spontaneous �ring rate in a lobula plate
tangential neurons in blow�ies (Jung et al., 2011; Longden and Krapp, 2009, 2010),
which is consistent with our �ndings, but unfortunately o�ers no further insight into
why the baseline shift persisted when the octopamine cells were silenced with Kir2.1.
One possible explanation for why silencing octopamine cells abolished the �ight
boost but not the baseline shift is that our manipulation of cell activity might not be
uniform across all cells in the Tdc2-Gal4 line. Variable expression of the driver, or
alternatively, variable activation of the responder, might have resulted in heteroge-
neous inactivation of octopamine neurons by Kir2.1. In this scenario, the octopamine
neurons involved in both egg-laying behavior and the visual boost were substantially
43
inactivated by Kir2.1, but the octopamine neurons responsible for the baseline shift
were active enough to induce a baseline shift during �ight. However, this explanation
is feasible only if the baseline shift is mediated by octopamine neurons, and the time
course of the baseline shift, which occurs instantaneously at the onset of �ight (Mai-
mon et al., 2010), is not entirely consistent with the action of a neuromodulator. The
four known neuronal octopamine receptors in Drosophila are all G-protein coupled
receptors (Evans and Maqueira, 2005), whose actions may act on a much slower time
scale (Siegelbaum and Tsien, 1983) relative to the baseline shift we record at the
onset of �ight. For this reason, I believe it unlikely that octopamine is responsible for
the baseline shift and think it improbable that heterogeneity in the e�ect of Kir2.1
across the population of octopamine cells can explain the discrepancy. An alternative
explanation is that pharmacological application of octopamine throughout the brain
induces general e�ects that are manifest as an upward shift in membrane potential in
VS cells, but that this shift is biophysically distinct from the shift that occurs during
�ight. During �ight, octopamine might be released at very speci�c sites in the optic
lobes. Activation and inhibition of octopamine cells will induce or abolish the �ight
boost, respectively, but have no e�ect on the baseline membrane potential in this sce-
nario. Pharmacologically-applied octopamine reaches many regions throughout the
brain that are not typically supplied with this neuromodulator, and this may result
in broad nonspeci�c e�ects. This might include, for example, cross-reactivity with
various non-octopamine receptors or ion channels that cause a shift in baseline mem-
brane potential. There are many mechanisms by which a neuron's resting membrane
potential can be increased, and various biogenic amines have been shown to a�ect
multiple physiological targets (Flamm and Harris-Warrick, 1986b). Although further
experiments are required to resolve the issue, I believe that such nonspeci�c e�ects
are the most likely cause of the membrane potential shift observed in VS cells during
exogenous application of octopamine, and that octopamine neurons are not respon-
sible for the baseline shift observed during �ight. This hypothesis is strengthened by
the observation that during octopamine application, �ight induces an additional shift
of baseline membrane potential but no further visual boost (Figure 2.10). Similarly,
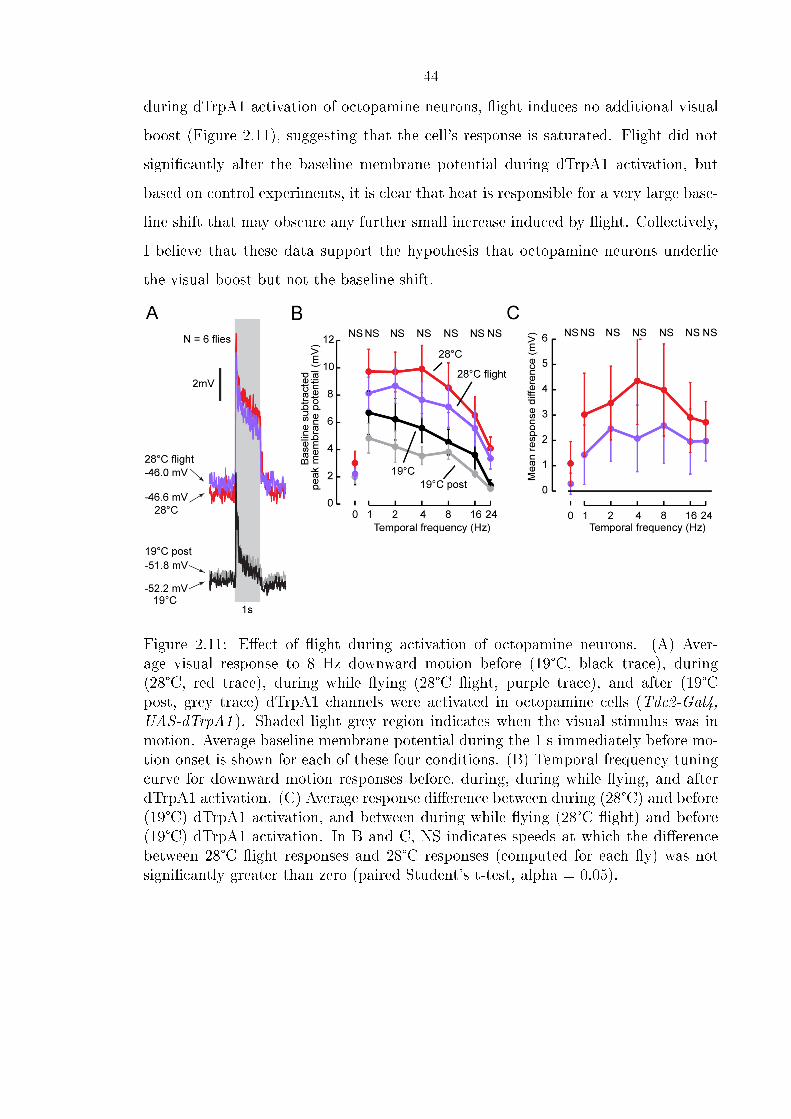
44
during dTrpA1 activation of octopamine neurons, �ight induces no additional visual
boost (Figure 2.11), suggesting that the cell's response is saturated. Flight did not
signi�cantly alter the baseline membrane potential during dTrpA1 activation, but
based on control experiments, it is clear that heat is responsible for a very large base-
line shift that may obscure any further small increase induced by �ight. Collectively,
I believe that these data support the hypothesis that octopamine neurons underlie
the visual boost but not the baseline shift.
Figure 2.11: E�ect of �ight during activation of octopamine neurons. (A) Aver-age visual response to 8 Hz downward motion before (19°C, black trace), during(28°C, red trace), during while �ying (28°C �ight, purple trace), and after (19°Cpost, grey trace) dTrpA1 channels were activated in octopamine cells (Tdc2-Gal4,UAS-dTrpA1 ). Shaded light grey region indicates when the visual stimulus was inmotion. Average baseline membrane potential during the 1 s immediately before mo-tion onset is shown for each of these four conditions. (B) Temporal frequency tuningcurve for downward motion responses before, during, during while �ying, and afterdTrpA1 activation. (C) Average response di�erence between during (28°C) and before(19°C) dTrpA1 activation, and between during while �ying (28°C �ight) and before(19°C) dTrpA1 activation. In B and C, NS indicates speeds at which the di�erencebetween 28°C �ight responses and 28°C responses (computed for each �y) was notsigni�cantly greater than zero (paired Student's t-test, alpha = 0.05).
45
Chapter 3
Genetic manipulation of the
lobula-plate projecting octopamine
neurons
3.1 Introduction
In Chapter 2, I showed that octopamine neurons were responsible for the �ight-
induced increase in visual responses to motion in VS cells. We found that the group
of octopamine neurons that project to the optic lobes become active during �ight
(Figure 2.4), and the entire set of octopamine neurons is necessary and su�cient for
the �ight boost (Figures 2.5, 2.6, and 2.7). It remained unclear, however, what the
contribution of individual octopamine neurons was in the �ight boost observed in
VS cells. The cell bodies of the six optic-lobe projecting neurons are located near
the midline, near the esophagus foramen and the antennal lobes. These cell bodies
are accessible for electrophysiological recordings, but not in a preparation that also
permits �ight behavior (see also Section 2.5). However, through a collaboration with
the Kravitz lab at Harvard University, I was able to manipulate octopamine neuron
activity using a reproducible enhancer trap line that labels a single pair of octopamine
neurons that project to the optic lobes (Figure 3.1), which I will call Kravitz line 243.
Based on its pattern of optic lobe innervation, I believe that this neuron is the OA-
AL2i1 neuron, whose stereotyped morphology is described in detail in Busch et al.
(2009), and refer to it as such for the remainder of this thesis. This neuron is the only
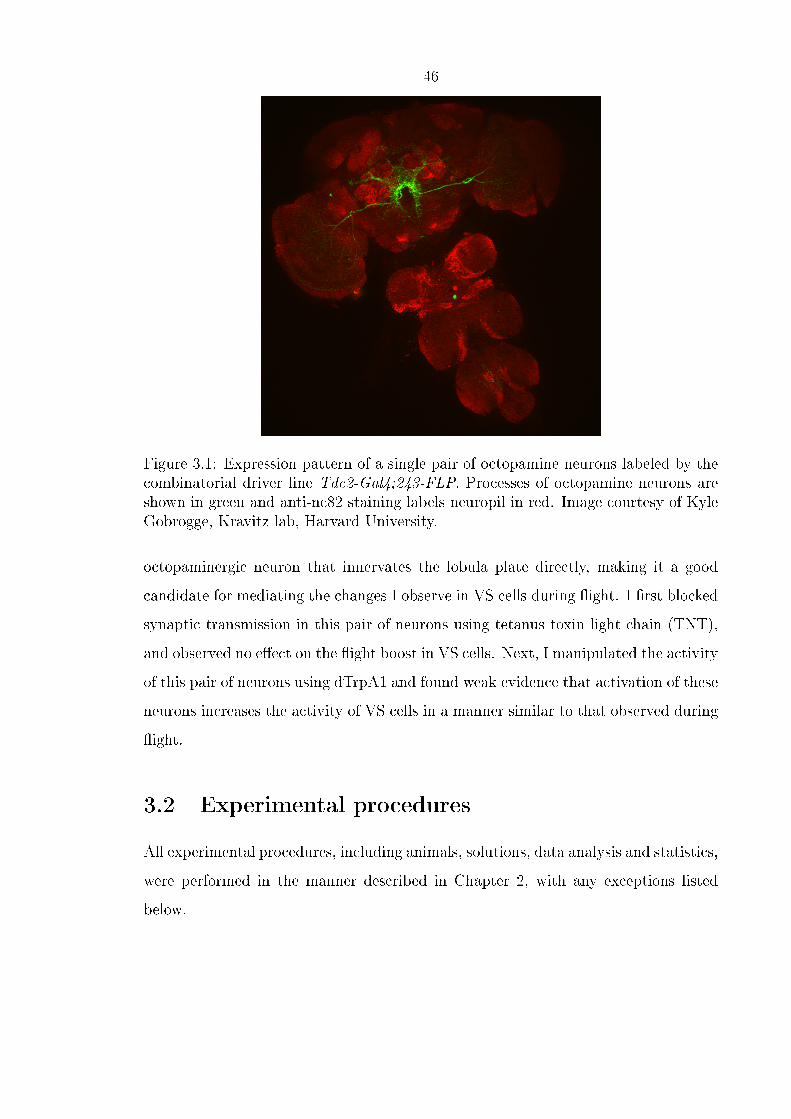
46
Figure 3.1: Expression pattern of a single pair of octopamine neurons labeled by thecombinatorial driver line Tdc2-Gal4;243-FLP. Processes of octopamine neurons areshown in green and anti-nc82 staining labels neuropil in red. Image courtesy of KyleGobrogge, Kravitz lab, Harvard University.
octopaminergic neuron that innervates the lobula plate directly, making it a good
candidate for mediating the changes I observe in VS cells during �ight. I �rst blocked
synaptic transmission in this pair of neurons using tetanus toxin light chain (TNT),
and observed no e�ect on the �ight boost in VS cells. Next, I manipulated the activity
of this pair of neurons using dTrpA1 and found weak evidence that activation of these
neurons increases the activity of VS cells in a manner similar to that observed during
�ight.
3.2 Experimental procedures
All experimental procedures, including animals, solutions, data analysis and statistics,
were performed in the manner described in Chapter 2, with any exceptions listed
below.
47
3.2.1 Animals
Flies were generously donated by the Kravitz lab at Harvard University. To label
subsets of octopamine neurons, a set of enhancer-trap FLP recombinase transgenic
lines was �rst produced. Next, by driving expression of Gal4 using the panneu-
ronal elav-Gal4 driver in combination with these lines, expression of GFP (using
UAS>stop>mCD8::GFP) was restricted to subsets of neurons in the brain � only
neurons expressing both the FLP recombinase and Gal4 expressed GFP. The lines
were then screened for reliable GFP expression. Expression was further restricted
in the brain by combining the reliably-expressing enhancer-trap FLP lines with the
Tdc-Gal4 driver line, which alone labels all octopamine neurons. One of the re-
producible enhancer trap lines generated, line 243 (;Tdc2-Gal4;243-�ipase), together
with the Tdc-Gal4 driver line, label a single pair of octopamine neurons that project
to the optic lobes. I used this combinatorial driver line (Tdc2-Gal4;243-FLP) to
drive expression of various e�ector proteins. Reproducibility was high in this line
- at least 95% of all brains examined expressed GFP in the same two neurons
(Dr. Kyle Gobrogge, personal communication). To manipulate neuronal activity,
either tetanus toxin light chain (TNT, Sweeney et al., 1995) or dTrpA1 (Hamada
et al., 2008) was expressed in this pair of neurons using the following constructs:
UAS>stop>TNT and UAS>stop>dTrpA1 (full genotypes are ;UAS>stop>TNT;+
and w[*];UAS>stop>dTRPA1;+, respectively). See Alekseyenko et al. (2013) for
more details about the enhancer-trap FLP screening method.
3.2.2 Whole cell patch clamp recordings
I used electrodes with resistance of 4.7-7.1 MW. Our intracellular, external, and col-
lagenase solutions were identical to those used in Maimon et al. (2010). The average
resting potential of cells after compensation for an experimentally-measured junction
potential (-13mV) was -46.5mV. I injected 20-30pA constant hyperpolarizing current
into the cells prior to presentation of visual stimuli to aid with dye �lls, which de-
creased the membrane potential by an average of -3.9mV (to -50.5 mV). The access
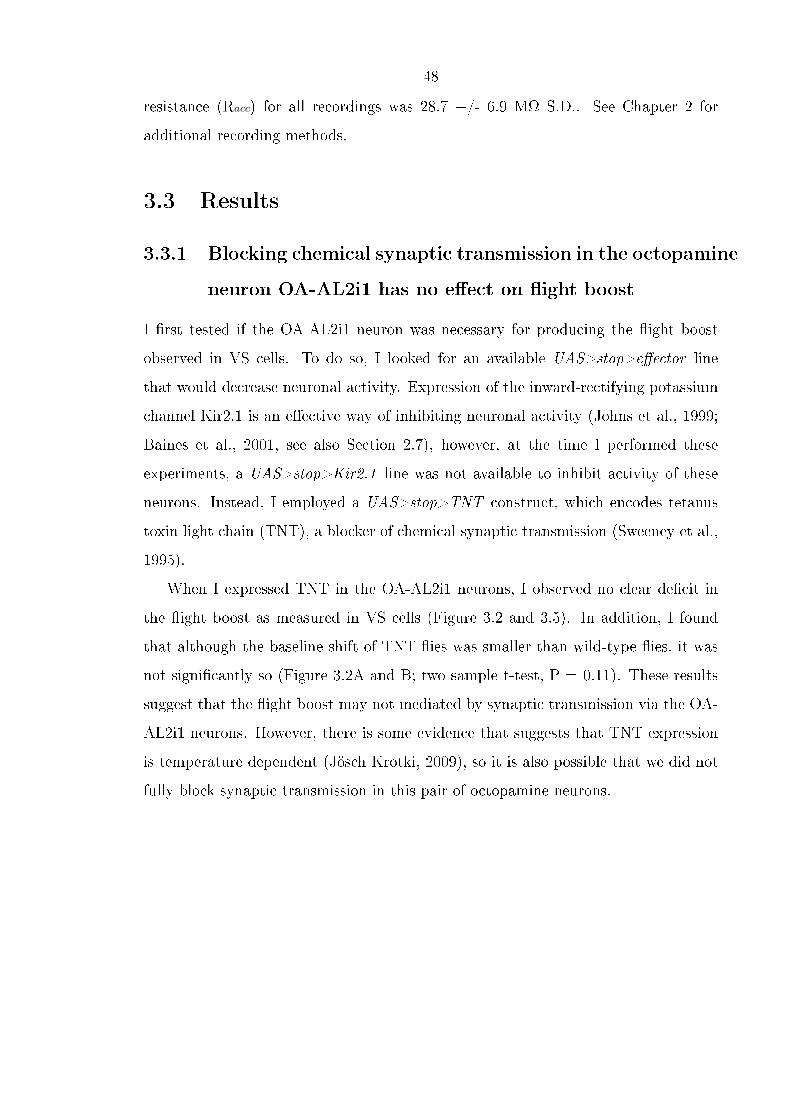
48
resistance (Racc) for all recordings was 28.7 +/- 6.9 MW S.D.. See Chapter 2 for
additional recording methods.
3.3 Results
3.3.1 Blocking chemical synaptic transmission in the octopamine
neuron OA-AL2i1 has no e�ect on �ight boost
I �rst tested if the OA-AL2i1 neuron was necessary for producing the �ight boost
observed in VS cells. To do so, I looked for an available UAS>stop>e�ector line
that would decrease neuronal activity. Expression of the inward-rectifying potassium
channel Kir2.1 is an e�ective way of inhibiting neuronal activity (Johns et al., 1999;
Baines et al., 2001, see also Section 2.7), however, at the time I performed these
experiments, a UAS>stop>Kir2.1 line was not available to inhibit activity of these
neurons. Instead, I employed a UAS>stop>TNT construct, which encodes tetanus
toxin light chain (TNT), a blocker of chemical synaptic transmission (Sweeney et al.,
1995).
When I expressed TNT in the OA-AL2i1 neurons, I observed no clear de�cit in
the �ight boost as measured in VS cells (Figure 3.2 and 3.5). In addition, I found
that although the baseline shift of TNT �ies was smaller than wild-type �ies, it was
not signi�cantly so (Figure 3.2A and B; two sample t-test, P = 0.11). These results
suggest that the �ight boost may not mediated by synaptic transmission via the OA-
AL2i1 neurons. However, there is some evidence that suggests that TNT expression
is temperature dependent (Jösch Krotki, 2009), so it is also possible that we did not
fully block synaptic transmission in this pair of octopamine neurons.
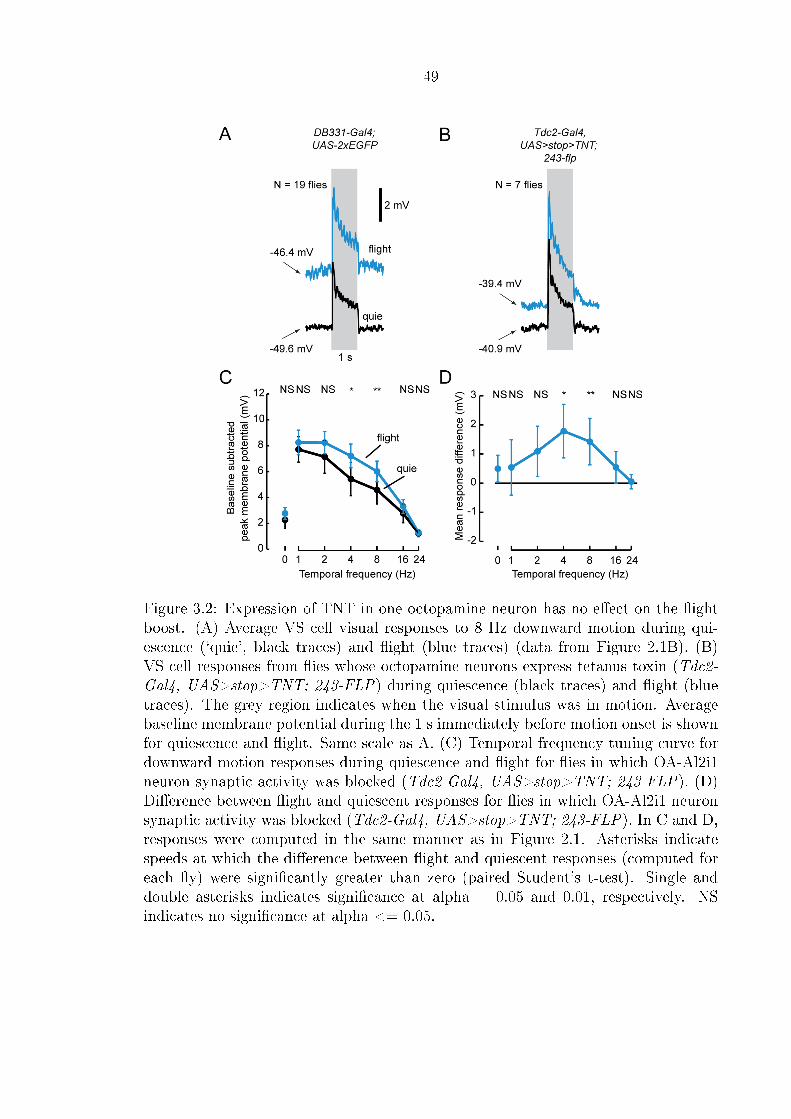
49
Figure 3.2: Expression of TNT in one octopamine neuron has no e�ect on the �ightboost. (A) Average VS cell visual responses to 8 Hz downward motion during qui-escence (`quie', black traces) and �ight (blue traces) (data from Figure 2.1B). (B)VS cell responses from �ies whose octopamine neurons express tetanus toxin (Tdc2-Gal4, UAS>stop>TNT; 243-FLP) during quiescence (black traces) and �ight (bluetraces). The grey region indicates when the visual stimulus was in motion. Averagebaseline membrane potential during the 1 s immediately before motion onset is shownfor quiescence and �ight. Same scale as A. (C) Temporal frequency tuning curve fordownward motion responses during quiescence and �ight for �ies in which OA-Al2i1neuron synaptic activity was blocked (Tdc2-Gal4, UAS>stop>TNT; 243-FLP). (D)Di�erence between �ight and quiescent responses for �ies in which OA-Al2i1 neuronsynaptic activity was blocked (Tdc2-Gal4, UAS>stop>TNT; 243-FLP). In C and D,responses were computed in the same manner as in Figure 2.1. Asterisks indicatespeeds at which the di�erence between �ight and quiescent responses (computed foreach �y) were signi�cantly greater than zero (paired Student's t-test). Single anddouble asterisks indicates signi�cance at alpha = 0.05 and 0.01, respectively. NSindicates no signi�cance at alpha <= 0.05.
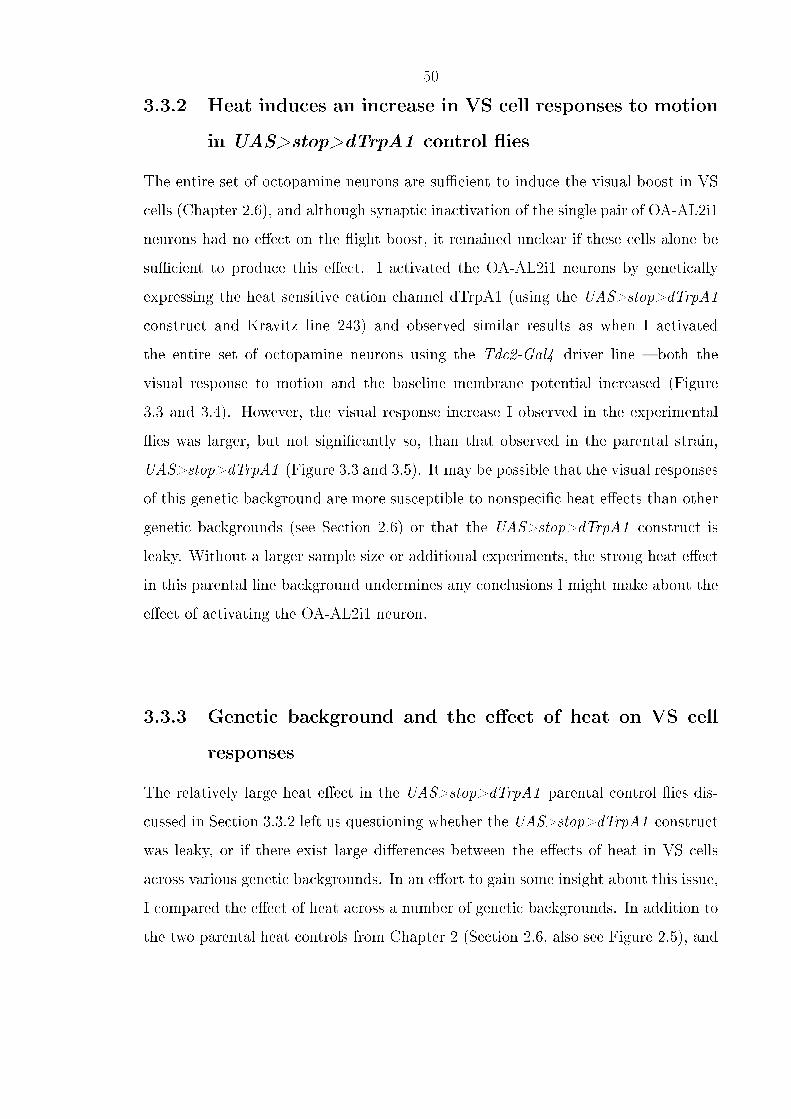
50
3.3.2 Heat induces an increase in VS cell responses to motion
in UAS>stop>dTrpA1 control �ies
The entire set of octopamine neurons are su�cient to induce the visual boost in VS
cells (Chapter 2.6), and although synaptic inactivation of the single pair of OA-AL2i1
neurons had no e�ect on the �ight boost, it remained unclear if these cells alone be
su�cient to produce this e�ect. I activated the OA-AL2i1 neurons by genetically
expressing the heat sensitive cation channel dTrpA1 (using the UAS>stop>dTrpA1
construct and Kravitz line 243) and observed similar results as when I activated
the entire set of octopamine neurons using the Tdc2-Gal4 driver line � both the
visual response to motion and the baseline membrane potential increased (Figure
3.3 and 3.4). However, the visual response increase I observed in the experimental
�ies was larger, but not signi�cantly so, than that observed in the parental strain,
UAS>stop>dTrpA1 (Figure 3.3 and 3.5). It may be possible that the visual responses
of this genetic background are more susceptible to nonspeci�c heat e�ects than other
genetic backgrounds (see Section 2.6) or that the UAS>stop>dTrpA1 construct is
leaky. Without a larger sample size or additional experiments, the strong heat e�ect
in this parental line background undermines any conclusions I might make about the
e�ect of activating the OA-AL2i1 neuron.
3.3.3 Genetic background and the e�ect of heat on VS cell
responses
The relatively large heat e�ect in the UAS>stop>dTrpA1 parental control �ies dis-
cussed in Section 3.3.2 left us questioning whether the UAS>stop>dTrpA1 construct
was leaky, or if there exist large di�erences between the e�ects of heat in VS cells
across various genetic backgrounds. In an e�ort to gain some insight about this issue,
I compared the e�ect of heat across a number of genetic backgrounds. In addition to
the two parental heat controls from Chapter 2 (Section 2.6, also see Figure 2.5), and
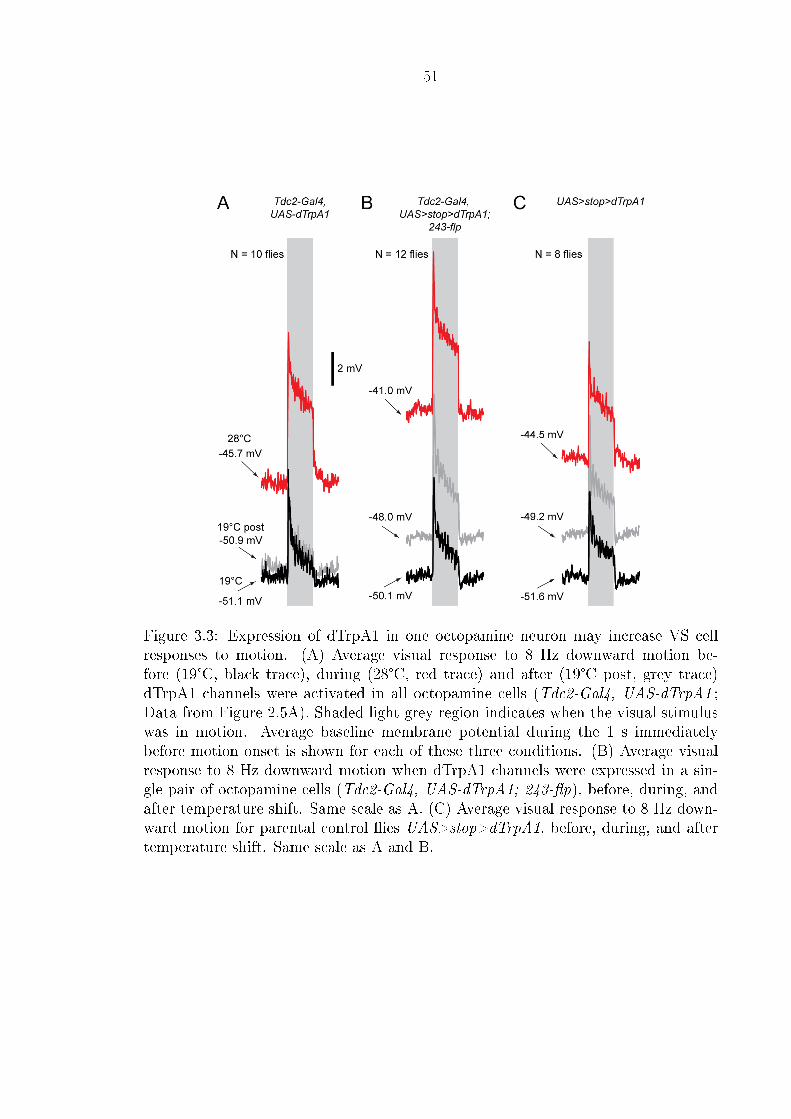
51
Figure 3.3: Expression of dTrpA1 in one octopamine neuron may increase VS cellresponses to motion. (A) Average visual response to 8 Hz downward motion be-fore (19°C, black trace), during (28°C, red trace) and after (19°C post, grey trace)dTrpA1 channels were activated in all octopamine cells (Tdc2-Gal4, UAS-dTrpA1 ;Data from Figure 2.5A). Shaded light grey region indicates when the visual stimuluswas in motion. Average baseline membrane potential during the 1 s immediatelybefore motion onset is shown for each of these three conditions. (B) Average visualresponse to 8 Hz downward motion when dTrpA1 channels were expressed in a sin-gle pair of octopamine cells (Tdc2-Gal4, UAS-dTrpA1; 243-�p), before, during, andafter temperature shift. Same scale as A. (C) Average visual response to 8 Hz down-ward motion for parental control �ies UAS>stop>dTrpA1, before, during, and aftertemperature shift. Same scale as A and B.
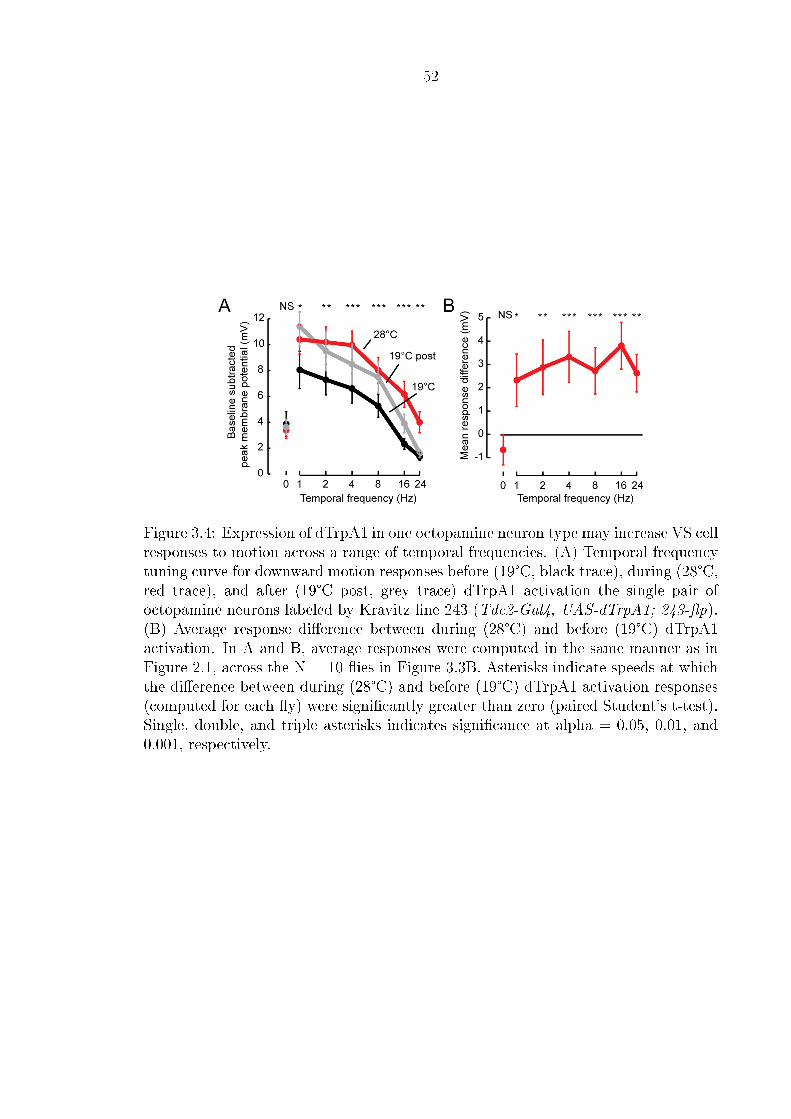
52
Figure 3.4: Expression of dTrpA1 in one octopamine neuron type may increase VS cellresponses to motion across a range of temporal frequencies. (A) Temporal frequencytuning curve for downward motion responses before (19°C, black trace), during (28°C,red trace), and after (19°C post, grey trace) dTrpA1 activation the single pair ofoctopamine neurons labeled by Kravitz line 243 (Tdc2-Gal4, UAS-dTrpA1; 243-�p).(B) Average response di�erence between during (28°C) and before (19°C) dTrpA1activation. In A and B, average responses were computed in the same manner as inFigure 2.1, across the N = 10 �ies in Figure 3.3B. Asterisks indicate speeds at whichthe di�erence between during (28°C) and before (19°C) dTrpA1 activation responses(computed for each �y) were signi�cantly greater than zero (paired Student's t-test).Single, double, and triple asterisks indicates signi�cance at alpha = 0.05, 0.01, and0.001, respectively.
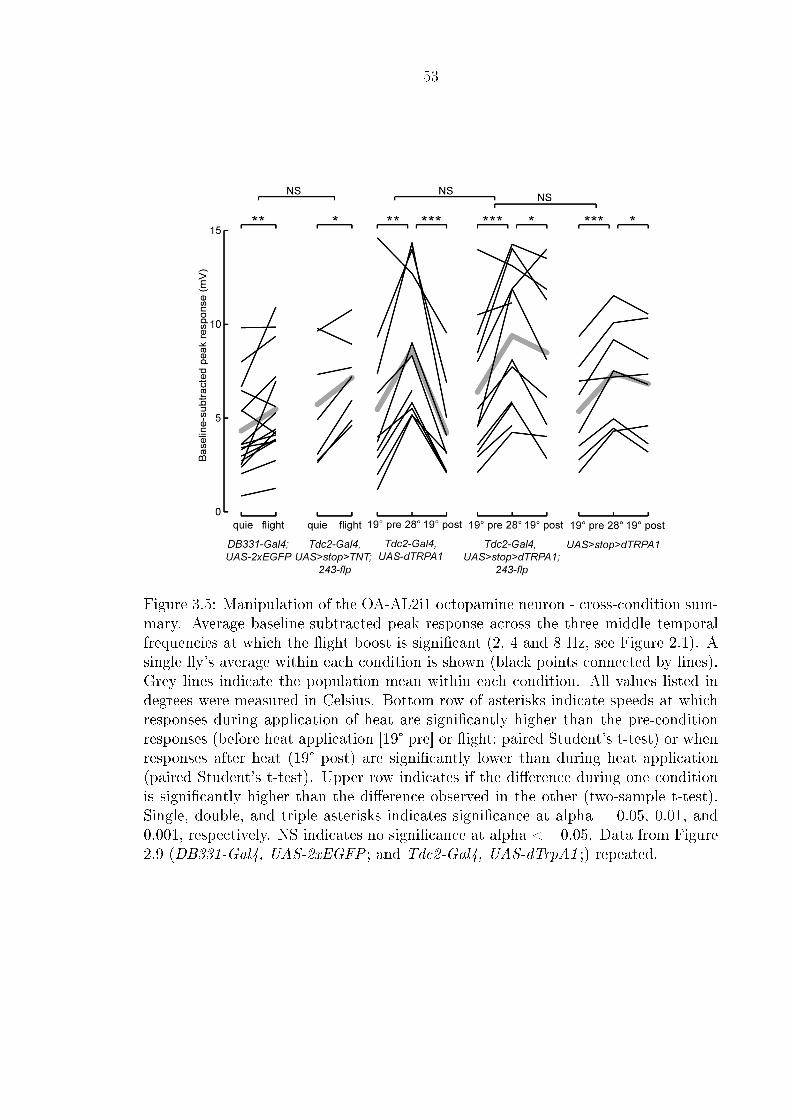
53
Figure 3.5: Manipulation of the OA-AL2i1 octopamine neuron - cross-condition sum-mary. Average baseline-subtracted peak response across the three middle temporalfrequencies at which the �ight boost is signi�cant (2, 4 and 8 Hz, see Figure 2.1). Asingle �y's average within each condition is shown (black points connected by lines).Grey lines indicate the population mean within each condition. All values listed indegrees were measured in Celsius. Bottom row of asterisks indicate speeds at whichresponses during application of heat are signi�cantly higher than the pre-conditionresponses (before heat application [19° pre] or �ight; paired Student's t-test) or whenresponses after heat (19° post) are signi�cantly lower than during heat application(paired Student's t-test). Upper row indicates if the di�erence during one conditionis signi�cantly higher than the di�erence observed in the other (two-sample t-test).Single, double, and triple asterisks indicates signi�cance at alpha = 0.05, 0.01, and0.001, respectively. NS indicates no signi�cance at alpha <= 0.05. Data from Figure2.9 (DB331-Gal4, UAS-2xEGFP ; and Tdc2-Gal4, UAS-dTrpA1 ;) repeated.
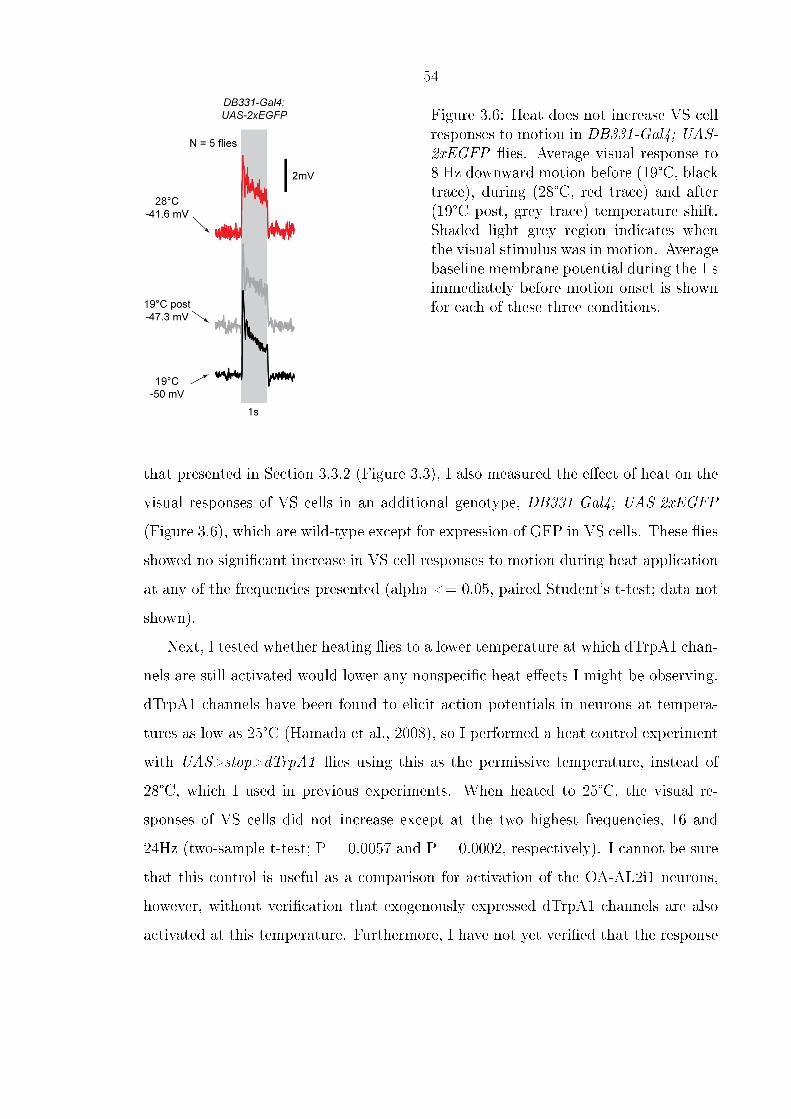
54
Figure 3.6: Heat does not increase VS cellresponses to motion in DB331-Gal4; UAS-2xEGFP �ies. Average visual response to8 Hz downward motion before (19°C, blacktrace), during (28°C, red trace) and after(19°C post, grey trace) temperature shift.Shaded light grey region indicates whenthe visual stimulus was in motion. Averagebaseline membrane potential during the 1 simmediately before motion onset is shownfor each of these three conditions.
that presented in Section 3.3.2 (Figure 3.3), I also measured the e�ect of heat on the
visual responses of VS cells in an additional genotype, DB331-Gal4; UAS-2xEGFP
(Figure 3.6), which are wild-type except for expression of GFP in VS cells. These �ies
showed no signi�cant increase in VS cell responses to motion during heat application
at any of the frequencies presented (alpha <= 0.05, paired Student's t-test; data not
shown).
Next, I tested whether heating �ies to a lower temperature at which dTrpA1 chan-
nels are still activated would lower any nonspeci�c heat e�ects I might be observing.
dTrpA1 channels have been found to elicit action potentials in neurons at tempera-
tures as low as 25°C (Hamada et al., 2008), so I performed a heat control experiment
with UAS>stop>dTrpA1 �ies using this as the permissive temperature, instead of
28°C, which I used in previous experiments. When heated to 25°C, the visual re-
sponses of VS cells did not increase except at the two highest frequencies, 16 and
24Hz (two-sample t-test; P = 0.0057 and P = 0.0002, respectively). I cannot be sure
that this control is useful as a comparison for activation of the OA-AL2i1 neurons,
however, without veri�cation that exogenously expressed dTrpA1 channels are also
activated at this temperature. Furthermore, I have not yet veri�ed that the response
55
observed in UAS>stop>dTrpA1 �ies is not the result of a leaky construct. This line
has been used in only one published study to our knowledge at this time (von Philips-
born et al., 2011), and unfortunately the authors did not provide evidence to support
that the line is not leaky, either by showing that dTrpA1 is not produced ectopically
in these �ies (using qRT-PCR, for example) or by providing data demonstrating the
e�ect of heat in this control line alone. In any case, our data show that temperature
can have a variable e�ect on the visual responses of VS cells, and this phenomena
may occur in many other cell types, and serves as an important reminder to consider
the side e�ects of heat when using di�erent genetic backgrounds and transgenes.
3.4 Discussion
Using a combinatorial labeling system to manipulate the activity of individual oc-
topamine neurons, I attempted to begin dissecting the system responsible for pro-
ducing the �ight boost I observe in VS cells. I �rst blocked synaptic transmission
of OA-AL2i1 neurons and observed no clear e�ect on the �ight boost (Figure 3.2).
This experiment suggests that the OA-AL2i1 neurons may transmit information via
electrical synapses to the visual system, which are therefore not a�ected by TNT, or
that they may not be involved in producing the changes I observe in VS cells during
�ight. Further experiments are needed to resolve which of these possibilities is most
likely. Very recently, we located a UAS>stop>Kir2.1 construct (Barry Dickson lab,
personal communication), and plan to test whether inactivating OA-AL2i1 neurons
completely using this construct has any e�ect on the VS cell �ight boost.
I also found that the increase in the response to visual motion in �ies whose OA-
AL2i1 neurons I activated using dTrpA1 was large, but not signi�cantly larger than
that observed in control �ies, which renders the contribution of this single pair of
neurons to the �ight boost ambiguous. The e�ect of heat on the visual responses of
parental control �ies (UAS>stop>dTrpA1 ) for this experiment was more pronounced
than in other strains (Figures 3.3 and 3.7). Genetic background can introduce signif-
icant variations in responses at the cellular, system, and behavioral levels. A correct
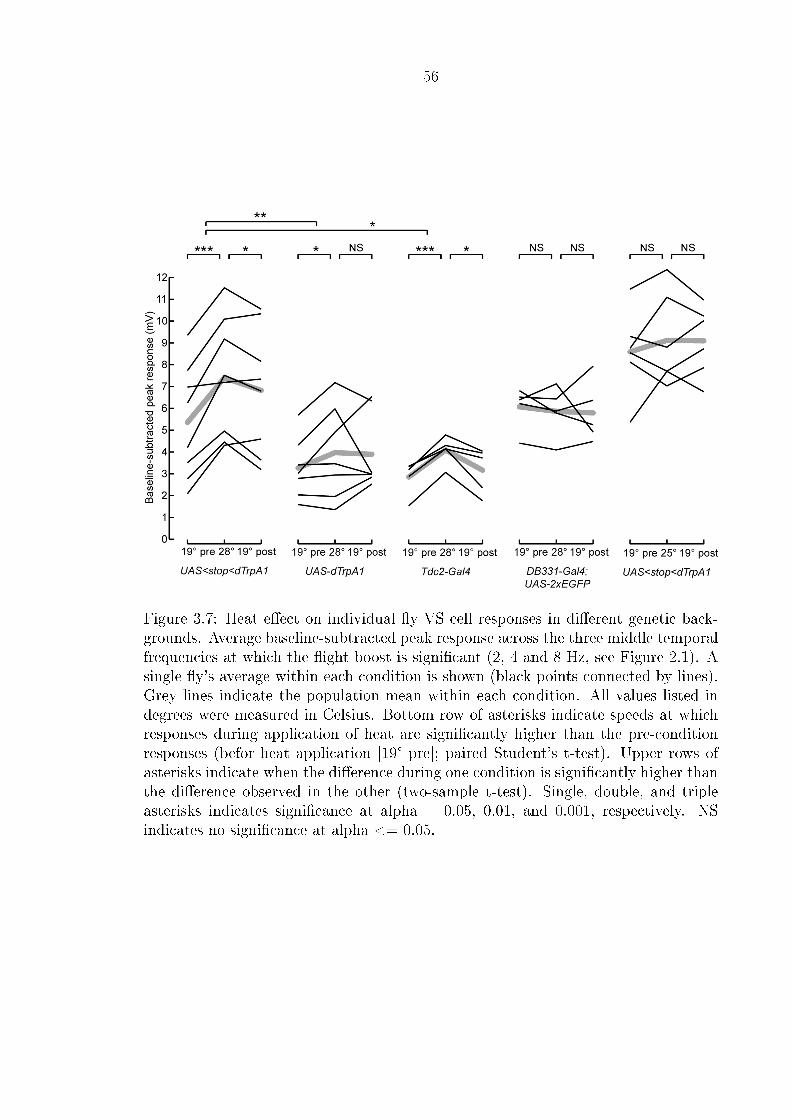
56
Figure 3.7: Heat e�ect on individual �y VS cell responses in di�erent genetic back-grounds. Average baseline-subtracted peak response across the three middle temporalfrequencies at which the �ight boost is signi�cant (2, 4 and 8 Hz, see Figure 2.1). Asingle �y's average within each condition is shown (black points connected by lines).Grey lines indicate the population mean within each condition. All values listed indegrees were measured in Celsius. Bottom row of asterisks indicate speeds at whichresponses during application of heat are signi�cantly higher than the pre-conditionresponses (befor heat application [19° pre]; paired Student's t-test). Upper rows ofasterisks indicate when the di�erence during one condition is signi�cantly higher thanthe di�erence observed in the other (two-sample t-test). Single, double, and tripleasterisks indicates signi�cance at alpha = 0.05, 0.01, and 0.001, respectively. NSindicates no signi�cance at alpha <= 0.05.
57
interpretation of genetic manipulations such as those used in this chapter depend on
the appropriate comparisons to control �ies, and yet occasionally these control exper-
iments are not performed. Our results serve as an important reminder that careful
background controls are critically important to the interpretation of experiments us-
ing genetically modi�ed animals.
In this chapter I presented weak evidence that activating the OA-AL2i1 neuron
may increase visual responses in VS cells. It remains unclear what contribution
individual octopamine neurons make in modulating visual responses during �ight,
but based on anatomy, I expect that the visual system is modulated at multiple levels
� octopaminergic processes innervate the optic lobes at the level of the medulla, the
lobula, and the lobula plate. I hope that future experiments, bolstered by the rapidly
developing set of genetic tools in Drosophila, will help build a more complete picture
of the modulatory network that underlies the �ight boost.
58
Chapter 4
Mechanosensory input and the �ight
boost
4.1 Introduction
Octopamine neurons appear to be responsible for the VS cell �ight boost, and, based
on anatomy, probably modulate many other parts of the visual system during �ight.
I showed that the octopamine neurons that project to the optic lobes become active
during �ight, but it remains unclear what drives this activity. During �ight, these
neurons may receive a central signal corresponding to the behavioral state, or they
may also receive mechanosensory feedback, similar to what has been hypothesized to
be the case in the octopaminergic, multimodal locust DCMD neuron (Rowell, 1971).
In this chapter, I brie�y explore the role of wind stimuli in the �ight boost. I show, for
the �rst time, that the visual responses of lobula plate tangential cells are modulated
by mechanosensory stimuli.
4.2 Experimental procedures
All experimental procedures were performed as described in Chapter 2 with any
exceptions listed below.
59
4.2.1 Animals
Animals were reared and prepared for experiments as outlined in Chapter 2. I made
use of the following transgenic �ies: DB331-Gal4 (Scott et al., 2002, FBti0115113)
and UAS-2xEGFP (Bloomington 6874). See Table 2.1 for complete genotypes of
these �ies.
4.2.2 Whole cell patch clamp recordings
I used electrodes with resistance of 4.8-7.4 MW. The average resting potential of cells
after compensation for an experimentally-measured junction potential (-13mV) was
-43.8mV. I injected 40-50 pA constant hyperpolarizing current into the cells prior to
presentation of visual stimuli to aid with dye �lls, which decreased the membrane
potential by an average of -7.2mV (to -51.0 mV). The access resistance (Racc) for all
recordings was 31.1 +/- 8.6 MW S.D.. Any cells with Racc greater than 50MW were
excluded from our analysis. See Chapter 2 for additional recording methods.
4.2.3 Visual display and stimuli
I used the same LED display and sine-wave grating stimulus as described in Chapter
2. For the 1 Hz responses, I presented �ies only with downward and upward 1Hz
motion. I presented �ies with 2 s of alternating upward and downward motion, with
8 s of a stationary mean luminance pattern in between trials. The pattern began
motion at the same quadrant in the sine-wave pattern for each trial. 8 Hz responses
were obtained from a subset of the data presented in Chapter 2 (�ies for which 8 Hz
wind stimuli responses existed - see Data Analysis and Statistics below).
4.2.4 Data analysis and statistics
As in Chapter 2, I applied a small pu� of air directed towards the �y's head to initiate
�ight. I observed an increase in visual responses for approximately 20 s after a brief
pu� (or a short, ≤5, rapid set of pu�s) was delivered to the �y in the absence of �ight.
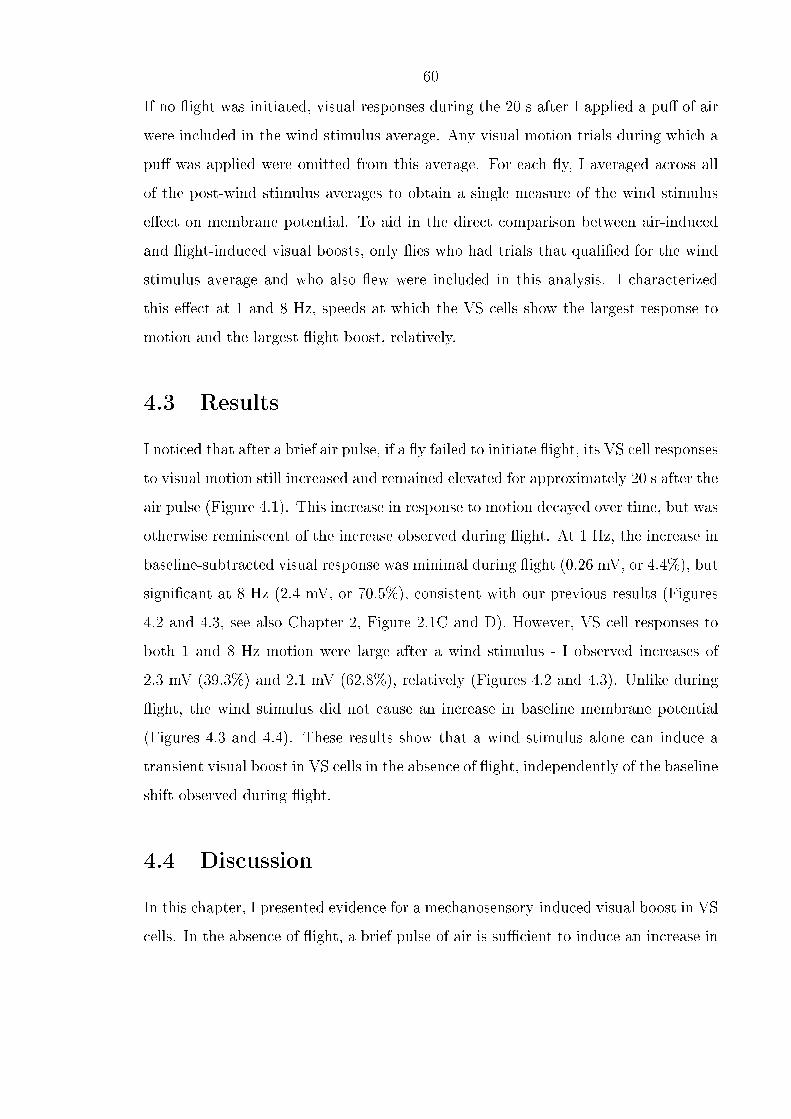
60
If no �ight was initiated, visual responses during the 20 s after I applied a pu� of air
were included in the wind stimulus average. Any visual motion trials during which a
pu� was applied were omitted from this average. For each �y, I averaged across all
of the post-wind stimulus averages to obtain a single measure of the wind stimulus
e�ect on membrane potential. To aid in the direct comparison between air-induced
and �ight-induced visual boosts, only �ies who had trials that quali�ed for the wind
stimulus average and who also �ew were included in this analysis. I characterized
this e�ect at 1 and 8 Hz, speeds at which the VS cells show the largest response to
motion and the largest �ight boost, relatively.
4.3 Results
I noticed that after a brief air pulse, if a �y failed to initiate �ight, its VS cell responses
to visual motion still increased and remained elevated for approximately 20 s after the
air pulse (Figure 4.1). This increase in response to motion decayed over time, but was
otherwise reminiscent of the increase observed during �ight. At 1 Hz, the increase in
baseline-subtracted visual response was minimal during �ight (0.26 mV, or 4.4%), but
signi�cant at 8 Hz (2.4 mV, or 70.5%), consistent with our previous results (Figures
4.2 and 4.3, see also Chapter 2, Figure 2.1C and D). However, VS cell responses to
both 1 and 8 Hz motion were large after a wind stimulus - I observed increases of
2.3 mV (39.3%) and 2.1 mV (62.8%), relatively (Figures 4.2 and 4.3). Unlike during
�ight, the wind stimulus did not cause an increase in baseline membrane potential
(Figures 4.3 and 4.4). These results show that a wind stimulus alone can induce a
transient visual boost in VS cells in the absence of �ight, independently of the baseline
shift observed during �ight.
4.4 Discussion
In this chapter, I presented evidence for a mechanosensory-induced visual boost in VS
cells. In the absence of �ight, a brief pulse of air is su�cient to induce an increase in
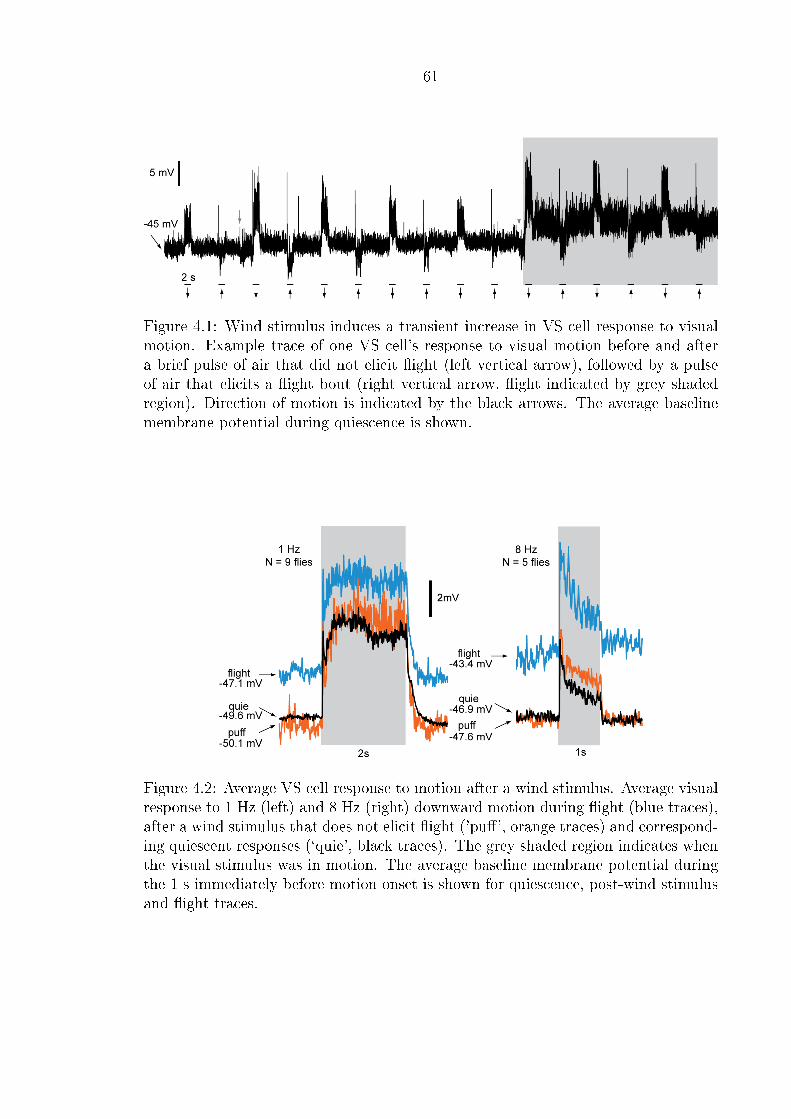
61
Figure 4.1: Wind stimulus induces a transient increase in VS cell response to visualmotion. Example trace of one VS cell's response to visual motion before and aftera brief pulse of air that did not elicit �ight (left vertical arrow), followed by a pulseof air that elicits a �ight bout (right vertical arrow, �ight indicated by grey shadedregion). Direction of motion is indicated by the black arrows. The average baselinemembrane potential during quiescence is shown.
Figure 4.2: Average VS cell response to motion after a wind stimulus. Average visualresponse to 1 Hz (left) and 8 Hz (right) downward motion during �ight (blue traces),after a wind stimulus that does not elicit �ight ('pu�', orange traces) and correspond-ing quiescent responses (`quie', black traces). The grey shaded region indicates whenthe visual stimulus was in motion. The average baseline membrane potential duringthe 1 s immediately before motion onset is shown for quiescence, post-wind stimulusand �ight traces.
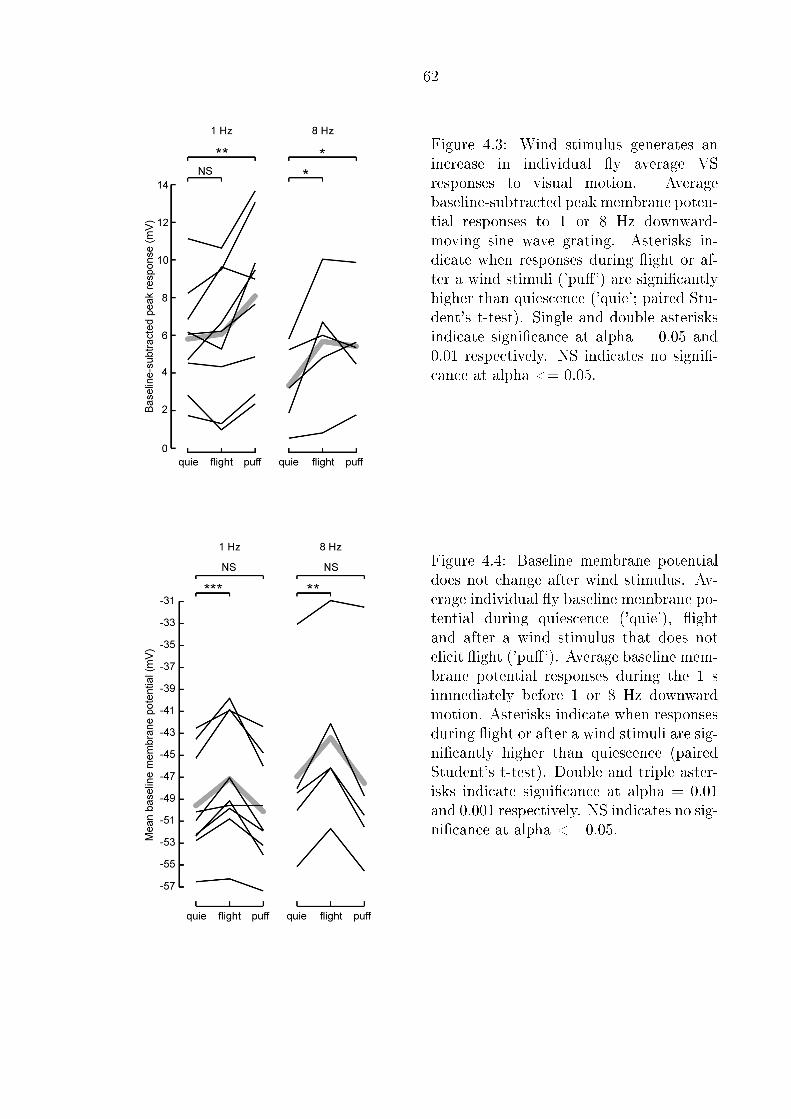
62
Figure 4.3: Wind stimulus generates anincrease in individual �y average VSresponses to visual motion. Averagebaseline-subtracted peak membrane poten-tial responses to 1 or 8 Hz downward-moving sine wave grating. Asterisks in-dicate when responses during �ight or af-ter a wind stimuli ('pu�') are signi�cantlyhigher than quiescence ('quie'; paired Stu-dent's t-test). Single and double asterisksindicate signi�cance at alpha = 0.05 and0.01 respectively. NS indicates no signi�-cance at alpha <= 0.05.
Figure 4.4: Baseline membrane potentialdoes not change after wind stimulus. Av-erage individual �y baseline membrane po-tential during quiescence ('quie'), �ightand after a wind stimulus that does notelicit �ight ('pu�'). Average baseline mem-brane potential responses during the 1 simmediately before 1 or 8 Hz downwardmotion. Asterisks indicate when responsesduring �ight or after a wind stimuli are sig-ni�cantly higher than quiescence (pairedStudent's t-test). Double and triple aster-isks indicate signi�cance at alpha = 0.01and 0.001 respectively. NS indicates no sig-ni�cance at alpha <= 0.05.
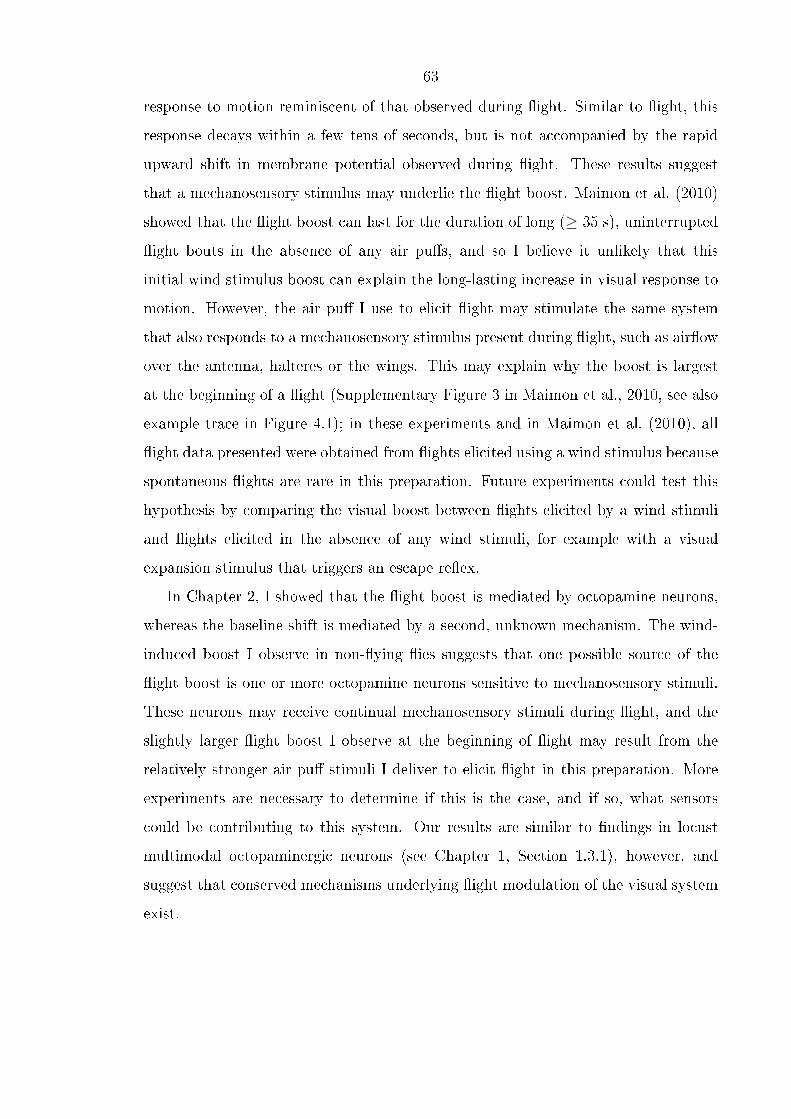
63
response to motion reminiscent of that observed during �ight. Similar to �ight, this
response decays within a few tens of seconds, but is not accompanied by the rapid
upward shift in membrane potential observed during �ight. These results suggest
that a mechanosensory stimulus may underlie the �ight boost. Maimon et al. (2010)
showed that the �ight boost can last for the duration of long (≥ 35 s), uninterrupted
�ight bouts in the absence of any air pu�s, and so I believe it unlikely that this
initial wind stimulus boost can explain the long-lasting increase in visual response to
motion. However, the air pu� I use to elicit �ight may stimulate the same system
that also responds to a mechanosensory stimulus present during �ight, such as air�ow
over the antenna, halteres or the wings. This may explain why the boost is largest
at the beginning of a �ight (Supplementary Figure 3 in Maimon et al., 2010, see also
example trace in Figure 4.1); in these experiments and in Maimon et al. (2010), all
�ight data presented were obtained from �ights elicited using a wind stimulus because
spontaneous �ights are rare in this preparation. Future experiments could test this
hypothesis by comparing the visual boost between �ights elicited by a wind stimuli
and �ights elicited in the absence of any wind stimuli, for example with a visual
expansion stimulus that triggers an escape re�ex.
In Chapter 2, I showed that the �ight boost is mediated by octopamine neurons,
whereas the baseline shift is mediated by a second, unknown mechanism. The wind-
induced boost I observe in non-�ying �ies suggests that one possible source of the
�ight boost is one or more octopamine neurons sensitive to mechanosensory stimuli.
These neurons may receive continual mechanosensory stimuli during �ight, and the
slightly larger �ight boost I observe at the beginning of �ight may result from the
relatively stronger air pu� stimuli I deliver to elicit �ight in this preparation. More
experiments are necessary to determine if this is the case, and if so, what sensors
could be contributing to this system. Our results are similar to �ndings in locust
multimodal octopaminergic neurons (see Chapter 1, Section 1.3.1), however, and
suggest that conserved mechanisms underlying �ight modulation of the visual system
exist.
64
Chapter 5
Conclusion
The octopamine orchestration hypothesis made explicit predictions about the role of
octopamine neurons in regulating insect behavior. Sombati and Hoyle (1984) pro-
posed that speci�c modulatory neurons were responsible for coordinating wide-scale
changes in physiology that were necessary to elicit various behaviors, and that oc-
topamine played such a role for �ight. The fact that �ies in which I presumably
reduced the activity of all octopamine neurons still retained the ability to �y suggests
that the original hypothesis, strictly interpreted, does not apply to Drosophila. Our
results from Chapter 2 are also consistent with an earlier genetic study which demon-
strated that octopamine null mutants are able to �y, albeit less robustly (Brembs
et al., 2007). However, although octopamine may not be necessary for �ight, our
results are consistent with prior research in locusts suggesting that octopamine does
play an important role in modulating physiology during �ight. Our results show that
a set of octopamine neurons in Drosophila with dense projections to the optic lobes
increase in activity during �ight. Based on previous anatomical studies, these neurons
are likely to belong to the AL2 cluster (Busch et al., 2009) (also called G3a in Sinake-
vitch et al., 2005). The locust multimodal protocerebrum-medulla (PM) neurons,
some of which have been shown to be octopaminergic, share remarkable anatomical
similarity with these neurons (Stern et al., 1995). Further, the octopaminergic PM4
neuron appears to play a role in dishabituating the descending contralateral move-
ment detector (DCMD; Bacon et al., 1995), which is involved in mediating startle
re�exes (Pearson et al., 1980; Fotowat et al., 2011). The PM4 neuron is thought to
65
release octopamine in the optic lobes in response to a variety of novel stimuli and is
presynaptic to the lobula giant motion detector, which then synapses onto the DCMD
(Bacon et al., 1995, see also Section 1.3.1). This simple visual circuit probably plays
a part in an arousal mechanism in the locust, but it remains to be determined what
behavior triggers its activation, and ultimately what functional role it plays in the
behavior of the animal. In the fruit �y, we now have evidence that a set of octopamin-
ergic neurons that project to the optic lobes increase in activity during �ight, and
that they likely play a role in the behavioral modulation of visual motion responses
in lobula plate tangential neurons. The similarities between the neurons believed to
be involved in arousal mechanisms in locusts and the cells involved in the �ight mod-
ulation that I examined in this thesis hint that there may exist conserved modulatory
mechanisms mediated by octopamine neurons.
The role of neuromodulators in the crustacean stomatogastric ganglion (STG) has
been particularly well characterized, and serves as another point of reference for our
�ndings. Activity patterns in the STG are regulated by multiple modulators, and
a single modulator is capable of eliciting entirely di�erent responses from individual
neurons depending on the expression of particular ion channels (Harris-Warrick et al.,
1998). A few of these substances are known to be released onto the STG neuropil
during speci�c behavioral states, but it remains unclear what role each one plays dur-
ing di�erent behaviors (Marder and Bucher, 2007). Octopamine has been shown to
increase overall pyloric activity in the lobster STG and can induce two distinct, stable
motor patterns depending on concentration (Flamm and Harris-Warrick, 1986a). Oc-
topamine is thought to play a role in activity-dependent modulation in the STG, but
to our knowledge, this has not been investigated, although endogenous action of sero-
tonin has been explored (Katz et al., 1989). In the STG, and in other circuits across
a variety of behaviors and organisms, it is thought that neuromodulators multiply the
number of functions that the circuit can perform (Harris-Warrick and Marder, 1991).
The �y brain has on the order of a hundred thousand neurons, yet is responsible for
the coordination of a remarkable repertoire of complex behaviors. It seems possible
that insects, like crustaceans, may employ neuromodulators to increase the functional
66
capacity of their relatively small brains.
Although I have identi�ed a set of octopamine neurons with projections in the
optic lobes that are likely responsible for mediating the �ight boost, the precise site
of modulation is still unknown. The VS cells may be directly modulated, upstream
cells could be the target of the octopaminergic input, or a combination of direct and
indirect modulation may occur. These alternative hypotheses will require a detailed
investigation of the location and action of octopamine receptors in the optic lobes.
However, recent studies in hover�ies (de Haan et al., 2012) and blow�ies (Rien et al.,
2012) suggest that the action of octopamine, at least in part, may be presynaptic
to the VS cells. It is also unclear how octopamine neurons become activated during
�ight. Based on the observation that an air pu� that does not induce �ight can alone
induce elevated visual responses (Chapter 4), it seems possible that a wind-sensitive
mechanosensory input may contribute to the �ight boost. Careful experiments to
determine which sensory modalities are involved will be needed to resolve this. Fur-
thermore, using combinatorial techniques (see Chapter 3), we can begin to investigate
whether the octopamine neurons act in concert, or if individual octopamine neurons
have distinct roles in mediating changes in the optic lobes during �ight.
Our results provide evidence that the �ight boost observed in VS cells is mediated
by octopamine neurons, but the origin of the baseline shift is still unclear. Neck motor
neurons and descending interneurons, which integrate information from a number of
sensory modalities, are the post-synaptic targets of the LPTCs. Based on anatomical
and electrophysiological evidence in blow�ies, the VS cells appear to be electrically
coupled to both of these types of interneurons (Wertz et al., 2008; Haag et al., 2007;
Wertz et al., 2012). The baseline shift observed in VS cells could be the result
of excitation of these downstream neurons by rapid mechanosensory input, from the
halteres for example. Alternatively, a central command signal may excite the VS cells
indirectly via this electrical coupling to descending interneurons. In Drosophila, I can
test these hypotheses starting by using a Gal4 driver line I recently found that labels
a subset of VS cells and a descending interneuron that displays characteristics similar
to the DNOVS cells identi�ed in Calliphora (data not shown). I can perform dual
67
recordings to determine �rst whether the VS cells and this descending interneuron
are indeed electrically coupled. Next I hope to identify any �ight e�ects in this
downstream neuron, then characterize information transfer between the two cell types
during quiescence and �ight. In addition to investigating the source of the baseline
shift, these future experiments may lead towards insights in the downstream e�ects of
the �ight boost, as well as a fuller understanding of the role VS cells play in di�erent
behaviors.
In a set of preliminary experiments in collaboration with Floris van Breugel and
Bettina Schnell, we have begun to investigate the role of the �ight boost observed
in VS cells and of octopamine neurons in regulating �ight behavior. Brie�y, we in-
vestigated the e�ect of genetically silencing octopamine neurons by expressing Kir2.1
in octopamine neurons using the Tdc2-Gal4 driver (see Figure 5.1B for expression
pattern in the brain and thoracic ganglia), in freely �ying �ies. We allowed �ies to
�y freely in a wind tunnel and presented them with regressive motion stimuli. Mov-
ing gratings of di�erent temporal frequencies were projected on the side of the wind
tunnel, and we recorded 3-D �ight trajectories before, during, and after these visual
stimuli (Figure 5.1A). We found that �ies whose octopamine neurons were inactivated
accelerated less than the two corresponding parental strains (Figure 5.2A). Male and
female �ies within each genotype performed similarly, suggesting that this e�ect was
probably not caused by the known egg-laying de�cit phenotype in octopamine null
females (females are unable to lay eggs, and at maturity, are typically large due to
egg retention). Furthermore, �ies whose octopamine neurons were inactivated showed
normal �ight speeds (Figure 5.2E) and accelerations (Figure 5.2F) in the absence of
motion stimuli, suggesting that our genetic manipulation did not cause a gross mo-
tor defect. We believe it is more likely that our manipulation induced a defect in
the gain control system regulating �ight behavior. Although we cannot be sure that
these e�ects are mediated by the LPTC network, this hypothesis is supported by
recent experiments indicating that octopamine alters the gain of neurons within this
system (Suver et al., 2012; Maimon et al., 2010; Longden and Krapp, 2009, 2010;
Jung et al., 2011). This experiment suggests that the �ight boost we observe in VS
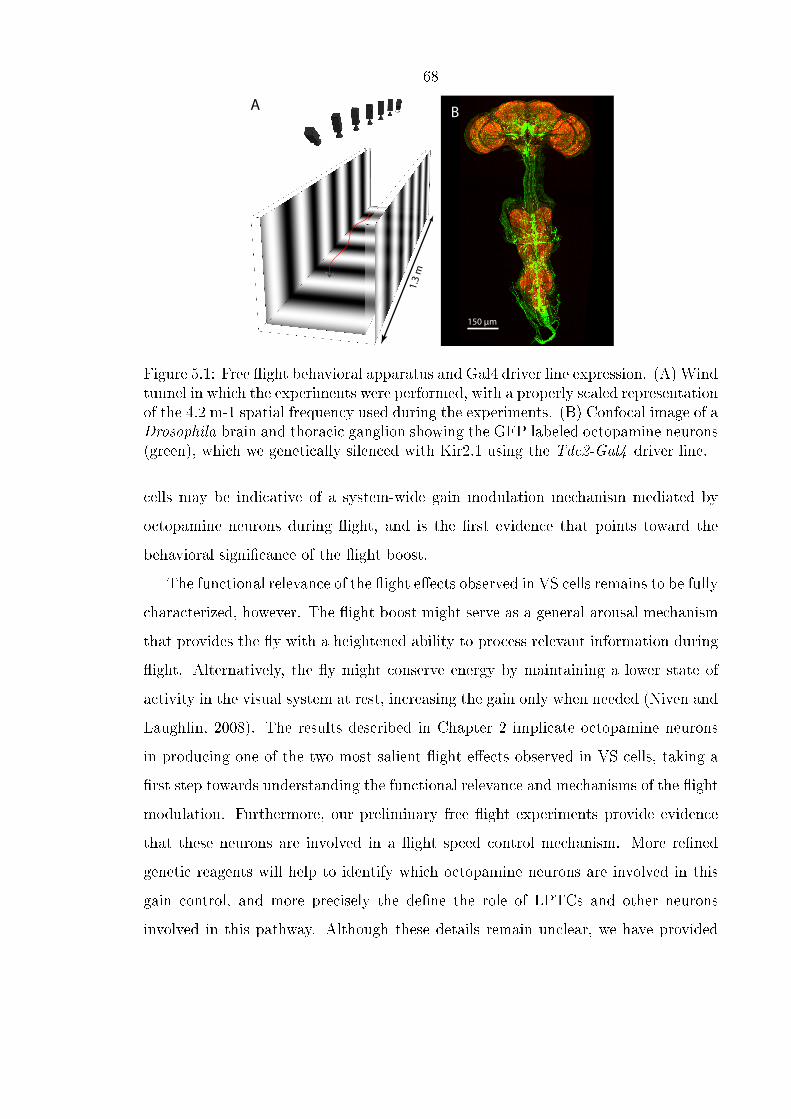
68
A B
150 μm
1.3
m
Figure 5.1: Free �ight behavioral apparatus and Gal4 driver line expression. (A) Windtunnel in which the experiments were performed, with a properly scaled representationof the 4.2 m-1 spatial frequency used during the experiments. (B) Confocal image of aDrosophila brain and thoracic ganglion showing the GFP labeled octopamine neurons(green), which we genetically silenced with Kir2.1 using the Tdc2-Gal4 driver line.
cells may be indicative of a system-wide gain modulation mechanism mediated by
octopamine neurons during �ight, and is the �rst evidence that points toward the
behavioral signi�cance of the �ight boost.
The functional relevance of the �ight e�ects observed in VS cells remains to be fully
characterized, however. The �ight boost might serve as a general arousal mechanism
that provides the �y with a heightened ability to process relevant information during
�ight. Alternatively, the �y might conserve energy by maintaining a lower state of
activity in the visual system at rest, increasing the gain only when needed (Niven and
Laughlin, 2008). The results described in Chapter 2 implicate octopamine neurons
in producing one of the two most salient �ight e�ects observed in VS cells, taking a
�rst step towards understanding the functional relevance and mechanisms of the �ight
modulation. Furthermore, our preliminary free �ight experiments provide evidence
that these neurons are involved in a �ight speed control mechanism. More re�ned
genetic reagents will help to identify which octopamine neurons are involved in this
gain control, and more precisely the de�ne the role of LPTCs and other neurons
involved in this pathway. Although these details remain unclear, we have provided
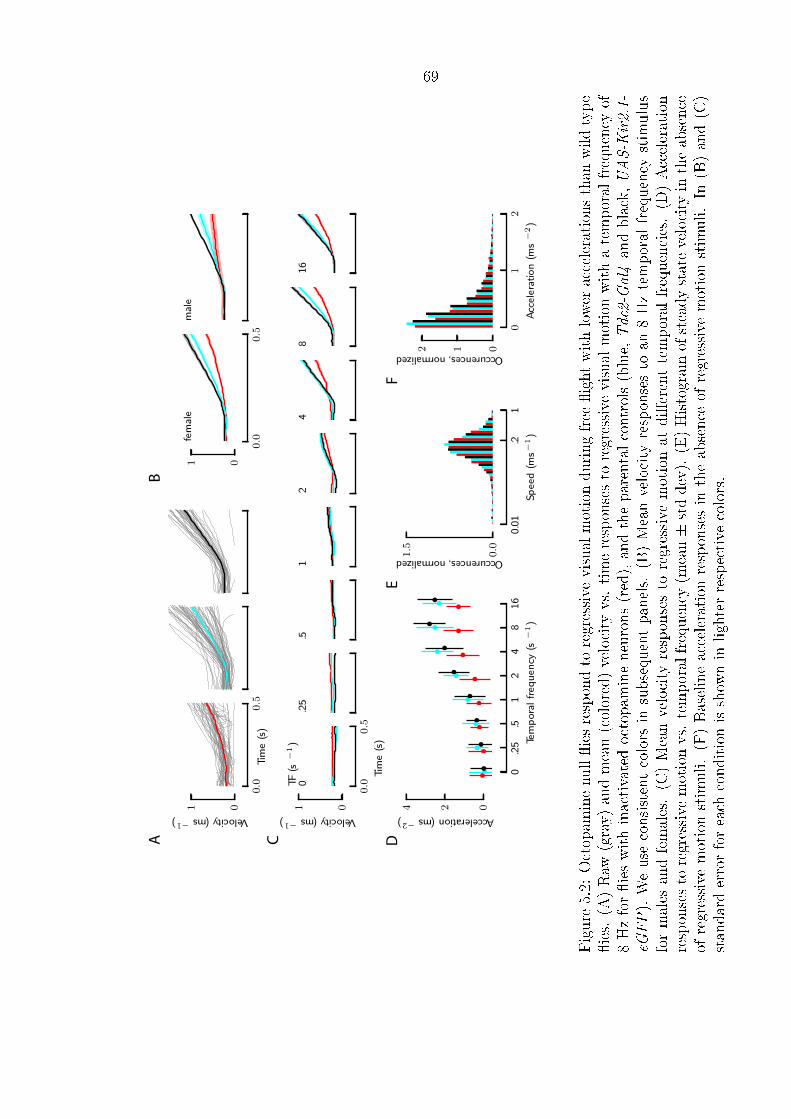
69
0.0
0.5
Time(s)
01
Velocity(ms−1)
0.0
0.5
01female
male
0.0
0.5
Time(s)
01Velocity(ms−1)
0TF(s
−1)
.25
.51
24
816
0.25
.51
24
816
Temporalfreq
uen
cy(s
−1)
024
Acceleration(ms−2)
0.01
.21
Spee
d(m
s−1)
0.0
1.5
Occurences,normalized
01
2
Acceleration(m
s−2)
012
Occurences,normalized
AB
C DE
F
Figure
5.2:
Octopam
inenull�iesrespondto
regressive
visualmotionduringfree
�ightwithlower
accelerationsthan
wildtype
�ies.
(A)Raw
(gray)andmean(colored)velocity
vs.
timeresponsesto
regressive
visual
motionwithatemporal
frequency
of8Hzfor�ieswithinactivatedoctopam
ineneurons(red),andtheparentalcontrols(blue,Tdc2-Gal4andblack,UAS-K
ir2.1-
eGFP).Weuse
consistentcolors
insubsequentpanels.
(B)Meanvelocity
responsesto
an8Hztemporal
frequency
stimulus
formales
andfemales.(C
)Meanvelocity
responsesto
regressive
motionat
di�erenttemporal
frequencies.(D
)Acceleration
responsesto
regressive
motionvs.
temporalfrequency
(mean±stddev).(E)Histogram
ofsteadystatevelocity
intheabsence
ofregressive
motionstimuli.(F)Baselineacceleration
responsesin
theabsence
ofregressive
motionstimuli.In
(B)and(C
)standarderrorforeach
conditionisshow
nin
lighterrespective
colors.

70
the �rst functional implication of the �ight e�ects observed in the visual system of
Drosophila.
71
Bibliography
Adamo, S., Linn, C., and Hoy, R. (1995). The role of neurohormonal octopamine
during `�ght or �ight' behaviour in the �eld cricket Gryllus bimaculatus. J Exp
Biol, 198(8):1691�1700.
Alekseyenko, O. V., Chan, Y.-B., Li, R., and Kravitz, E. A. (2013). Single dopamin-
ergic neurons that modulate aggression in Drosophila. Proceedings of the National
Academy of Sciences, 110(15):6151�6156.
Andermann, M. L., Kerlin, A. M., Roumis, D. K., Glickfeld, L. L., and Reid, R. C.
(2011). Functional specialization of mouse higher visual cortical areas. Neuron,
72(6):1025�39.
Autrum, H. (1958). Electrophysiological analysis of the visual systems in insects. Exp
Cell Res, 14(Suppl 5):426.
Bacon, J. P., Thompson, K. S., and Stern, M. (1995). Identi�ed octopaminergic neu-
rons provide an arousal mechanism in the locust brain. J Neurophysiol, 74(6):2739�
43.
Baines, R. A., Uhler, J. P., Thompson, A., Sweeney, S. T., and Bate, M. (2001).
Altered electrical properties in Drosophila neurons developing without synaptic
transmission. J Neurosci, 21(5):1523�1531.
Bargmann, C. I. (2012). Beyond the connectome: How neuromodulators shape neural
circuits. BioEssays, 34(6):458�465.
Bausenwein, B., Dittrich, A., and Fischbach, K.-F. (1992). The optic lobe of
Drosophila melanogaster. Cell Tissue Res, 267(1):17�28.
72
Bicker, G., Menzel, R., et al. (1989). Chemical codes for the control of behaviour in
arthropods. Nature, 337(6202):33�39.
Blondeau, J. and Heisenberg, M. (1982). The three-dimensional optomotor torque
system of Drosophila melanogaster. J Comp Physiol, 145(3):321�329.
Borst, A., Egelhaaf, M., and Haag, J. (1995). Mechanisms of dendritic integration
underlying gain control in �y motion-sensitive interneurons. J Comp Neurosci,
2(1):5�18.
Borst, A. and Haag, J. (2002). Neural networks in the cockpit of the �y. J Comp
Physiol A, 188(6):419�37.
Braitenberg, V. (1972). Periodic structures and structural gradients in the visual
ganglia of the �y. In Information Processing in the Visual Systems of Arthropods,
pages 3�15. Springer.
Brembs, B., Christiansen, F., P�uger, H. J., and Duch, C. (2007). Flight initiation
and maintenance de�cits in �ies with genetically altered biogenic amine levels. J
Neurosci, 27(41):11122�31.
Buchner, E. (1976). Elementary movement detectors in an insect visual system. Biol
Cybern, 24(2):85�101.
Buchner, E. (1984). Behavioural analysis of spatial vision in insects. In Photoreception
and vision in invertebrates, pages 561�621. Springer.
Buchner, E., Buchner, S., and Bültho�, I. (1984). Deoxyglucose mapping of nervous
activity induced in Drosophila brain by visual movement. 1. Wildtype. J Comp
Physiol A, 155(4):471�483.
Burrows, M. (1996). The Neurobiology of an Insect Brain. Oxford University Press,
New York.
Busch, S., Selcho, M., Ito, K., and Tanimoto, H. (2009). A map of octopaminergic
neurons in the Drosophila brain. J Comp Neurol, 513(6):643�67.
73
Cajal, R. Y. and Sanchez, D. (1915). Contribucion al conocimiento de los centros
nerviosos de los insectos. Parte 1. Retina y centros opticos. Trab Lab Invest Bio
Univ Madrid, 13:1�168.
Chiappe, M. E., Seelig, J. D., Reiser, M. B., and Jayaraman, V. (2010). Walking
modulates speed sensitivity in Drosophila motion vision. Curr Biol, 20(16):1470�5.
Clark, D. A., Bursztyn, L., Horowitz, M. A., Schnitzer, M. J., and Clandinin, T. R.
(2011). De�ning the computational structure of the motion detector in Drosophila.
Neuron, 70(6):1165�1177.
Coyne, J. A., Boussy, I. A., Prout, T., Bryant, S. H., Jones, J., and Moore, J. A.
(1982). Long-distance migration of Drosophila. Amer Nat, 119(4):589�595.
Davis, R. L. (2005). Olfactory memory formation in Drosophila: from molecular to
systems neuroscience. Annu Rev Neurosci, 28:275�302.
de Haan, R., Lee, Y. J., and Nordstrom, K. (2012). Octopaminergic modulation of
contrast sensitivity. Front Integr Neurosci, 6:55.
Dvorak, D. R., Bishop, L. G., and Eckert, H. E. (1975). On the identi�cation of
movement detectors in the �y optic lobe. J Comp Physiol, 100(1):5�23.
Eichner, H., Joesch, M., Schnell, B., Rei�, D. F., and Borst, A. (2011). Internal
structure of the �y elementary motion detector. Neuron, 70(6):1155�1164.
Elyada, Y. M., Haag, J., and Borst, A. (2013). Dendritic end inhibition in large-�eld
visual neurons of the �y. J Neurosci, 33(8):3659�3667.
Erspamer, V. (1948). Active substances in the posterior salivary glands of octopoda. ii.
Tyramine and Octopamine (Oxyoctopamine). Acta Pharmacol Toxicol, 4(3-4):224�
247.
Evans, P. D. and Maqueira, B. (2005). Insect octopamine receptors: a new classi�-
cation scheme based on studies of cloned Drosophila G-protein coupled receptors.
Invert Neurosci, 5(3-4):111�8.
74
Fayyazuddin, A. and Dickinson, M. H. (1996). Haltere a�erents provide direct, elec-
trotonic input to a steering motor neuron in the blow�y, Calliphora. J Neurosci,
16(16):5225�5232.
Flamm, R. and Harris-Warrick, R. (1986a). Aminergic modulation in lobster stom-
atogastric ganglion. I. e�ects on motor pattern and activity of neurons within the
pyloric circuit. J Neurophysiol, 55(5):847�865.
Flamm, R. and Harris-Warrick, R. (1986b). Aminergic modulation in lobster stomato-
gastric ganglion. II. target neurons of dopamine, octopamine, and serotonin within
the pyloric circuit. J Neurophysiol, 55(5):866�881.
Fotowat, H., Harrison, R. R., and Gabbiani, F. (2011). Multiplexing of motor in-
formation in the discharge of a collision detecting neuron during escape behaviors.
Neuron, 69(1):147�58.
Fox, J. and Daniel, T. (2008). A neural basis for gyroscopic force measurement in the
halteres of Holorusia. J Comp Physiol A, 194(10):887�897.
Franz, M. O. and Krapp, H. G. (2000). Wide-�eld, motion-sensitive neurons and
matched �lters for optic �ow �elds. Biol Cybern, 83(3):185�197.
Geiger, G. and Nassel, D. R. (1981). Visual orientation behaviour of �ies after selective
laser beam ablation of interneurones. Nature, 293(5831):398�9.
Getting, P. A. (1989). Emerging principles governing the operation of neural networks.
Ann Rev Neurosci, 12(1):185�204.
Goaillard, J.-M., Schulz, D. J., Kilman, V. L., and Marder, E. (2004). Octopamine
modulates the axons of modulatory projection neurons. J Neurosci, 24(32):7063�
7073.
Goodman, L. J. (1970). The structure and function of the insect dorsal ocellus. Adv
Insect Physiol, 7:97�195.
75
Goosey, M. and Candy, D. (1980). The D-octopamine content of the haemolymph of
the locust, Schistocerca americana gregaria and its elevation during �ight. Insect
Biochem, 10(4):393�397.
Gronenberg, W. and Strausfeld, N. J. (1990). Descending neurons supplying the neck
and �ight motor of diptera: physiological and anatomical characteristics. J Comp
Neurol, 302(4):973�991.
Guizar-Sicairos, M., Thurman, S. T., and Fienup, J. R. (2008). E�cient subpixel
image registration algorithms. Opt Lett, 33(2):156�158.
Haag, J. and Borst, A. (2004). Neural mechanism underlying complex receptive �eld
properties of motion-sensitive interneurons. Nat Neurosci, 7(6):628�634.
Haag, J. and Borst, A. (2005). Dye-coupling visualizes networks of large-�eld motion-
sensitive neurons in the �y. J Comp Physiol A, 191(5):445�454.
Haag, J., Wertz, A., and Borst, A. (2007). Integration of lobula plate output signals by
DNOVS1, an identi�ed premotor descending neuron. J Neurosci, 27(8):1992�2000.
Haag, J., Wertz, A., and Borst, A. (2010). Central gating of �y optomotor response.
Proc Natl Acad Sci, 107(46):20104�20109.
Hamada, F. N., Rosenzweig, M., Kang, K., Pulver, S. R., Ghezzi, A., Jegla, T. J., and
Garrity, P. A. (2008). An internal thermal sensor controlling temperature preference
in Drosophila. Nature, 454(7201):217�220.
Harris-Warrick, R. M., Johnson, B. R., Peck, J. H., Kloppenburg, P., Ayali, A., and
Skarbinski, J. (1998). Distributed e�ects of dopamine modulation in the crustacean
pyloric network. Ann N Y Acad Sci, 860:155�67.
Harris-Warrick, R. M. and Marder, E. (1991). Modulation of neural networks for
behavior. Annu Rev Neurosci, 14:39�57.
76
Hassenstein, B. and Reichardt, W. (1956). Systemtheoretische Analyse der Zeit, Rei-
henfolgen und Vorzeichenauswertung bei der Bewegungsperzeption des Rüsselkäfers
Chlorophanus. Z. Naturforsch, 11b:513�524.
Hausen, K. (1976). Functional characterization and anatomical identi�cation of mo-
tion sensitive neurons in the lobula plate of the blow�y Calliphora erythrocephala.
Z Naturforsch, 31:629�633.
Hausen, K. (1984). The lobula-complex of the �y: structure, function and signi�cance
in visual behaviour. In Photoreception and vision in invertebrates, pages 523�559.
Springer.
Hausen, K. and Wehrhahn, C. (1983). Microsurgical lesion of horizontal cells changes
optomotor yaw responses in the blow�y Calliphora erythrocephala. Proc Royal Soc
Lond [Biol], 219(1215):211�216.
Hausen, K. and Wehrhahn, C. (1990). Neural circuits mediating visual �ight control
in �ies. II. separation of two control systems by microsurgical brain lesions. J
Neurosci, 10(1):351�360.
Heisenberg, M., Wolf, R., et al. (1984). Vision in Drosophila. Genetics of microbe-
haviour. Springer Verlag.
Heisenberg, M., Wonneberger, R., and Wolf, R. (1978). optomotor-blindH31 - a
Drosophila mutant of the lobula plate giant neurons. J Comp Physiol, 124(4):287�
296.
Hengstenberg, R. (1977). Spike responses of `non-spiking' visual interneurone. Nature,
270:338�340.
Hengstenberg, R. (1991). Gaze control in the blow�y Calliphora: a multisensory,
two-stage integration process. In Seminars in Neuroscience, volume 3, pages 19�
29. Elsevier.
77
Hengstenberg, R., Hausen, K., and Hengstenberg, B. (1982). The number and struc-
ture of giant vertical cells (VS) in the lobula plate of the blow�y Calliphora ery-
throcephala. J Comp Physiol, 149(2):163�177.
Hoyer, S. C., Eckart, A., Herrel, A., Zars, T., Fischer, S. A., Hardie, S. L., and
Heisenberg, M. (2008). Octopamine in male aggression of Drosophila. Curr Biol,
18(3):159�167.
Huston, S. J. and Krapp, H. G. (2008). Visuomotor transformation in the �y gaze
stabilization system. PLoS Biol, 6(7):e173.
Huston, S. J. and Krapp, H. G. (2009). Nonlinear integration of visual and haltere
inputs in �y neck motor neurons. J Neurosci, 29(42):13097�105.
Inagaki, H. K., Ben-Tabou de Leon, S., Wong, A. M., Jagadish, S., Ishimoto, H.,
Barnea, G., Kitamoto, T., Axel, R., and Anderson, D. J. (2012). Visualizing neu-
romodulation in vivo: TANGO-mapping of dopamine signaling reveals appetite
control of sugar sensing. Cell, 148(3):583�595.
Ito, K., Suzuki, K., Estes, P., Ramaswami, M., Yamamoto, D., and Strausfeld, N. J.
(1998). The organization of extrinsic neurons and their implications in the func-
tional roles of the mushroom bodies in Drosophila melanogaster meigen. Learn
Memory, 5(1):52�77.
Joesch, M., Plett, J., Borst, A., and Rei�, D. F. (2008). Response properties of
motion-sensitive visual interneurons in the lobula plate of Drosophila melanogaster.
Curr Biol, 18(5):368�74.
Joesch, M., Schnell, B., Raghu, S. V., Rei�, D. F., and Borst, A. (2010). ON and
OFF pathways in Drosophila motion vision. Nature, 468(7321):300�304.
Johns, D. C., Marx, R., Mains, R. E., O'Rourke, B., and Marbán, E. (1999). Inducible
genetic suppression of neuronal excitability. J Neurosci, 19(5):1691�1697.
78
Jösch Krotki, M. A. (2009). Lobula Plate Tangential Cells in Drosophila melanogaster.
PhD thesis, lmu.
Jung, S. N., Borst, A., and Haag, J. (2011). Flight activity alters velocity tuning of
�y motion-sensitive neurons. J Neurosci, 31(25):9231�7.
Karmeier, K., van Hateren, J., Kern, R., and Egelhaaf, M. (2006). Encoding of
naturalistic optic �ow by a population of blow�y motion-sensitive neurons. J Neu-
rophysiol, 96(3):1602�1614.
Katz, P. S., Eigg, M. H., and Harris-Warrick, R. M. (1989). Serotonergic/cholinergic
muscle receptor cells in the crab stomatogastric nervous system. I. identi�cation and
characterization of the gastropyloric receptor cells. J Neurophysiol, 62(2):558�70.
Kern, R., van Hateren, J., Michaelis, C., Lindemann, J. P., and Egelhaaf, M. (2005).
Function of a �y motion-sensitive neuron matches eye movements during free �ight.
PLoS Biol, 3(6):e171.
Kosakai, K., Satoh, K., and Yoshino, M. (2008). Octopaminergic modulation of the
single Ca2+ channel currents in kenyon cells isolated from the mushroom body of
the cricket brain. J Insect Physiol, 54(12):1479�1486.
Krapp, H. G., Hengstenberg, B., and Hengstenberg, R. (1998). Dendritic structure
and receptive-�eld organization of optic �ow processing interneurons in the �y. J
Neurophysiol, 79(4):1902�1917.
Krapp, H. G. and Hengstenberg, R. (1996). Estimation of self-motion by optic �ow
processing in single visual interneurons. Nature, 384(6608):463�6.
Kravitz, E. A. and Huber, R. (2003). Aggression in invertebrates. Curr Opin Neuro-
biol, 13(6):736�743.
Longden, K. D. and Krapp, H. G. (2009). State-dependent performance of optic-�ow
processing interneurons. J Neurophysiol, 102(6):3606�18.
79
Longden, K. D. and Krapp, H. G. (2010). Octopaminergic modulation of temporal
frequency coding in an identi�ed optic �ow-processing interneuron. Front Syst
Neurosci, 4:153.
Maimon, G., Straw, A. D., and Dickinson, M. H. (2010). Active �ight increases the
gain of visual motion processing in Drosophila. Nat Neurosci, 13(3):393�9.
Marder, E. (2012). Neuromodulation of neuronal circuits: back to the future. Neuron,
76(1):1�11.
Marder, E. and Bucher, D. (2007). Understanding circuit dynamics using the stom-
atogastric nervous system of lobsters and crabs. Annu Rev Physiol, 69:291�316.
Marder, E. and Calabrese, R. L. (1996). Principles of rhythmic motor pattern gener-
ation. Physiol Rev, 76(3):687�717.
Matheson, T. (1997). Octopamine modulates the responses and presynaptic inhibition
of proprioceptive sensory neurones in the locust Schistocerca gregaria. J Exp Biol,
200(9):1317�1325.
Menzel, R. and Muller, U. (1996). Learning and memory in honeybees: from behavior
to neural substrates. Annu Rev Neurosci, 19(1):379�404.
Milde, J., Seyan, H., and Strausfeld, N. (1987). The neck motor system of the �y
Calliphora erythrocephala. J Comp Physiol A, 160(2):225�238.
Monastirioti, M., Linn, C. E., J., and White, K. (1996). Characterization of
Drosophila tyramine beta-hydroxylase gene and isolation of mutant �ies lacking
octopamine. J Neurosci, 16(12):3900�11.
Moran, J. and Desimone, R. (1985). Selective attention gates visual processing in the
extrastriate cortex. Science, 229(4715):782�784.
Nalbach, G. (1993). The halteres of the blow�y calliphora. Journal of Comparative
Physiology A, 173(3):293�300.
80
Nässel, D. R. and Hagberg, M. (1985). Ocellar interneurones in the blow�y Calliphora
erythrocephala: Morphology and central projections. Cell Tissue Res, 242(2):417�
426.
Niell, C. M. and Stryker, M. P. (2010). Modulation of visual responses by behavioral
state in mouse visual cortex. Neuron, 65(4):472�9.
Niven, J. E. and Laughlin, S. B. (2008). Energy limitation as a selective pressure on
the evolution of sensory systems. J Exp Biol, 211(Pt 11):1792�804.
Orchard, I., Ramirez, J. M., and Lange, A. B. (1993). A multifunctional role for
octopamine in locust �ight. Annu Rev Entomol, 38(1):227�249.
Parsons, M. M., Krapp, H. G., and Laughlin, S. B. (2010). Sensor fusion in identi�ed
visual interneurons. Curr Biol, 20(7):624�628.
Pearson, K. G., Heitler, W. J., and Steeves, J. D. (1980). Triggering of locust jump
by multimodal inhibitory interneurons. J Neurophysiol, 43(2):257�78.
Pierantoni, R. (1973). An observation on the giant �bre posterior optic tract in the
�y. Biokybernetic, Leipzig, 5(1):157�163.
Pringle, J. W. S. (1948). The gyroscopic mechanism of the halteres of Diptera. Phil
Trans R Soc London [Biol], pages 347�384.
Ramirez, J. M. and Orchard, I. (1990). Octopaminergic modulation of the forewing
stretch-receptor in the locust Locusta migratoria. J Exp Biol, 149(1):255�279.
Ramirez, J.-M. and Pearson, K. G. (1991). Octopaminergic modulation of interneu-
rons in the �ight system of the locust. J Neurophysiol, 66(5):1522�1537.
Rein, K., Zöckler, M., Mader, M. T., Grübel, C., and Heisenberg, M. (2002). The
Drosophila standard brain. Curr Biol, 12(3):227�231.
Reiser, M. B. and Dickinson, M. H. (2008). A modular display system for insect
behavioral neuroscience. J Neurosci Methods, 167(2):127�39.
81
Rien, D., Kern, R., and Kurtz, R. (2012). Octopaminergic modulation of contrast
gain adaptation in �y visual motion-sensitive neurons. Eur J Neurosci.
Roeder, T. (1999). Octopamine in invertebrates. Prog in Neurobiol, 59(5):533�561.
Rowell, C. F. (1971). Variable responsiveness of a visual interneurone in the free-
moving locust, and its relation to behaviour and arousal. J Exp Biol, 55(3):727�747.
Schnell, B., Raghu, S. V., Nern, A., and Borst, A. (2012). Columnar cells necessary
for motion responses of wide-�eld visual interneurons in Drosophila. J Comp Physiol
A, 198(5):389�395.
Schuppe, H. and Hengstenberg, R. (1993). Optical properties of the ocelli of Cal-
liphora erythrocephala and their role in the dorsal light response. J Comp Physiol
A, 173(2):143�149.
Schwaerzel, M., Monastirioti, M., Scholz, H., Friggi-Grelin, F., Birman, S., and
Heisenberg, M. (2003). Dopamine and octopamine di�erentiate between aversive
and appetitive olfactory memories in Drosophila. J Neurosci, 23(33):10495�10502.
Scott, E. K., Raabe, T., and Luo, L. (2002). Structure of the vertical and horizontal
system neurons of the lobula plate in Drosophila. J Comp Neurol, 454(4):470�81.
Siegelbaum, S. A. and Tsien, R. W. (1983). Modulation of gated ion channels as a
mode of transmitter action. Trends Neurosci, 6(8):307�313.
Sinakevitch, I., Niwa, M., and Strausfeld, N. J. (2005). Octopamine-like immunore-
activity in the honey bee and cockroach: comparable organization in the brain and
subesophageal ganglion. J Comp Neurol, 488(3):233�54.
Sinakevitch, I. and Strausfeld, N. J. (2006). Comparison of octopamine-like im-
munoreactivity in the brains of the fruit �y and blow �y. J Comp Neurol,
494(3):460�75.
82
Sombati, S. and Hoyle, G. (1984). Generation of speci�c behaviors in a locust by
local release into neuropil of the natural neuromodulator octopamine. J Neurobiol,
15(6):481�506.
Stern, M., Thompson, K. S. J., Zhou, P., Watson, D. G., Midgley, J. M., Gewecke, M.,
and Bacon, J. P. (1995). Octopaminergic neurons in the locust brain: morphological,
biochemical and electrophysiological characterization of potential modulators of the
visual system. J Comp Physiol A, 177(5):611�625.
Strausfeld, N. and Bassemir, U. (1985). Lobula plate and ocellar interneurons con-
verge onto a cluster of descending neurons leading to neck and leg motor neuropil
in Calliphora erythrocephala. Cell Tissue Res, 240(3):617�640.
Strausfeld, N., Bassemir, U., Singh, R., and Bacon, J. (1984). Organizational princi-
ples of outputs from dipteran brains. J Insect Physiol, 30(1):73�93.
Strausfeld, N. and Seyan, H. (1985). Convergence of visual, haltere, and proster-
nai inputs at neck motor neurons of Calliphora erythrocephala. Cell Tissue Res,
240(3):601�615.
Strausfeld, N., Seyan, H., and Milde, J. (1987). The neck motor system of the �y
Calliphora erythrocephala. J Comp Physiol A, 160(2):205�224.
Strausfeld, N. J. (1976). Atlas of an insect brain. Springer-Verlag Berlin, Heidelberg,
New York.
Straw, A. and Dickinson, M. (2009). Motmot, an open-source toolkit for realtime
video acquisition and analysis. Source Code Biol Med, 4.
Suver, M. P., Mamiya, A., and Dickinson, M. H. (2012). Octopamine neurons mediate
�ight-induced modulation of visual processing in Drosophila. Curr Biol.
Sweeney, S. T., Broadie, K., Keane, J., Niemann, H., and O'Kane, C. J. (1995).
Targeted expression of tetanus toxin light chain in Drosophila speci�cally eliminates
synaptic transmission and causes behavioral defects. Neuron, 14(2):341�351.
83
Taghert, P. H. and Nitabach, M. N. (2012). Peptide neuromodulation in invertebrate
model systems. Neuron, 76(1):82�97.
Tian, L., Hires, S. A., Mao, T., Huber, D., Chiappe, M. E., Chalasani, S. H., Petreanu,
L., Akerboom, J., McKinney, S. A., Schreiter, E. R., Bargmann, C. I., Jayaraman,
V., Svoboda, K., and Looger, L. L. (2009). Imaging neural activity in worms, �ies
and mice with improved gcamp calcium indicators. Nat Methods, 6(12):875�81.
Treue, S. and Maunsell, J. H. R. (1996). Attentional modulation of visual motion
processing in cortical areas MT and MST. Nature, 382(6591):539�541.
Venken, K. J., Simpson, J. H., and Bellen, H. J. (2011). Genetic manipulation of
genes and cells in the nervous system of the fruit �y. Neuron, 72(2):202�230.
von Philipsborn, A. C., Liu, T., Yu, J. Y., Masser, C., Bidaye, S. S., and Dickson,
B. J. (2011). Neuronal control of Drosophila courtship song. Neuron, 69(3):509�522.
Weir, P. T. and Suver, M. P. (2013). From dendritic compartments to neuronal
networks: A multilevel analysis of motion vision. J Neurosci, 33(24):9876�9878.
Wertz, A., Borst, A., and Haag, J. (2008). Nonlinear integration of binocular optic
�ow by DNOVS2, a descending neuron of the �y. J Neurosci, 28(12):3131�3140.
Wertz, A., Haag, J., and Borst, A. (2012). Integration of binocular optic �ow in
cervical neck motor neurons of the �y. J Comp Physiol A, 198(9):655�668.
Wilson, R. I., Turner, G. C., and Laurent, G. (2004). Transformation of olfactory
representations in the Drosophila antennal lobe. Sci Signal, 303(5656):366.
Zhou, C., Rao, Y., and Rao, Y. (2008). A subset of octopaminergic neurons are
important for Drosophila aggression. Nat Neurosci, 11(9):1059�1067.