Embed Size (px)
Citation preview
Full Terms & Conditions of access and use can be found athttp://www.tandfonline.com/action/journalInformation?journalCode=lcss20
Download by: [University of Arkansas Libraries - Fayetteville] Date: 12 September 2016, At: 12:01
Communications in Soil Science and Plant Analysis
ISSN: 0010-3624 (Print) 1532-2416 (Online) Journal homepage: http://www.tandfonline.com/loi/lcss20
Nutrient Availability Response to SulfurAmendment in Histosols having Variable CalciumCarbonates
Avjinder S. Kaler, J. Mabry McCray, Alan L. Wright & John E. Erickson
To cite this article: Avjinder S. Kaler, J. Mabry McCray, Alan L. Wright & John E. Erickson(2016): Nutrient Availability Response to Sulfur Amendment in Histosols havingVariable Calcium Carbonates, Communications in Soil Science and Plant Analysis, DOI:10.1080/00103624.2016.1225077
To link to this article: http://dx.doi.org/10.1080/00103624.2016.1225077
Accepted author version posted online: 08Sep 2016.Published online: 08 Sep 2016.
Submit your article to this journal
Article views: 53
View related articles
View Crossmark data
Accep
ted M
anus
cript
Nutrient Availability Response to Sulfur Amendment in Histosols
having Variable Calcium Carbonates
Avjinder S. Kaler, 1 J. Mabry McCray, 2 Alan L. Wright2 and John E. Erickson3
1Department of Crop, Soil, and Environmental Science, University of Arkansas, Fayetteville, AR
72701;
2Everglades Research and Education Center, Belle Glade, FL 33430;
3Agronomy Department, University of Florida, Gainesville, FL 32611.
Address Correspondence to Avjinder S. Kaler and J. Mabry Mcray:([email protected] and
ABSTRACT
High soil pH and excessive calcium carbonate (CaCO3) in the Everglades Agricultural Area of
south Florida reduces the availability of phosphorus and micronutrients to crops. Sulfur (S)
amendment is recommended to reduce soil pH and enhance nutrient supply. The study’s
Accep
ted M
anus
cript
objective was to determine the sulfur amendment effectiveness on soil pH and nutrient
availability in organic soil as CaCO3 content increases in soil. An experiment of 4 S rates (0,
90,224, and 448 kg ha-1) and 3 added CaCO3 (0%, 12.5%, and 50% by volume) in organic soil
was established. Sulfur application had limited effects on soil pH reduction as CaCO3 level
increased and therefore failed to enhance nutrient availability; however, it increased sulfate
concentration in soils, which could be at risk for export from the field. Unexpected increases in
manganese concentration with added CaCO3 was associated with reducing conditions due to
increased soil bulk density, which changed the soil physical properties.
Abbreviations: EAA, Everglades Agricultural Area; S, Elemental Sulfur; CaCO3, Calcium
Carbonate, Soil pH; Soil Nutrient Concentration.
INTRODUCTION
High pH and excessive CaCO3 reduce the availability of phosphorus (P) and micronutrients to
crops. Poor nutrient availability rather than low total nutrient content in the soil is one of the
major factors causing plant nutrient deficiency in alkaline soils, especially those of the
Everglades Agricultural Area (EAA). Nutrient deficiencies related to high pH have been
demonstrated to limit the growth and yield of sugarcane (Saccharum spp.) (McCray and Rice,
2013). However, sensible use of fertilizers and/or amendments can improve the nutrient balance
in soil. In the Everglades Agricultural Area (EAA), soils are organic (Histosols) having organic
Accep
ted M
anus
cript
matter content >30% and typically approaching 80%. These soils are high in nitrogen (N)
content but have low available phosphorus (P) and micronutrient concentrations in their natural
state (Rice et al., 2010). They developed as wetlands and were dominated by sawgrass (Cladium
jamaicense) prairies, until their drainage and conversion to agricultural use in the early 1900s.
Due to the flooding conditions when these soils developed, oxygen (O2) content was very low in
the soil and insufficient to maintain the functioning of aerobic microorganisms. Therefore, the
rates of organic matter accumulation exceeded the decomposition rates above the limestone
bedrock (Wright and Snyder, 2009). In the early1900s, drainage of these wetlands allowed the
conversion to agricultural use. Drainage resulted in soil aeration, which increased organic matter
decomposition to levels higher than its accumulation (Chen et al., 2006) and has led to decreases
in soil depth above the limestone bedrock. This soil loss is referred to as soil subsidence. The
current estimated rate of soil subsidence is 1.5 cm per year (Wright and Snyder, 2009). Snyder
(2005) predicted that in 2050 nearly half of EAA soil would have soils less than 20 cm in depth,
which will not be suitable for sugarcane production. As soils become shallow, management of
cultivation and irrigation become more difficult (Wright and Snyder, 2009). Based on the depth
of underlying limestone bedrock and mineral content, there are five main soil series in EAA,
which include Dania, Lauderhill, Pahokee, Terra Ceia, and Torry. Differences in soil depth result
in variable amounts of mixed CaCO3 and variable soil pH (Daroub et al., 2011).
Sugarcane is the most predominant row crop in south Florida with an approximate
cultivation of 162,000 ha per year. About 80% of this sugarcane is grown on the muck soil of the
EAA (Morgan et al., 2009). High soil pH is a major problem in this area since it reduces nutrient
availability to crops, especially P and micronutrients and consequently affects the growth and
yield of the plants. Increased soil pH is mostly due to incorporation of CaCO3 from underlying
Accep
ted M
anus
cript
limestone bedrock in shallow soils because of tillage operations for bed preparation and
agricultural drainage (Snyder, 2005). Soil subsidence increases the influence from underlying
limestone (CaCO3) bedrock into the root zone. Calcium carbonate, being the source of
agricultural lime, elevates the soil pH and reduces the nutrient availability. Soil pH adjustment is
one of the strategies that have been used to increase availability of pH-sensitive nutrients. An
earlier recommendation of elemental sulfur (S) application was 448 kg S ha-1 at pH ≥ 6.6 to
reduce soil pH (Anderson, 1985); however, an actual nutritional requirement of S for sugarcane
is satisfied through oxidation of organic soils in the EAA. Beverly and Anderson (1986)
determined that soil pH reduction was only for a short term due to a strong buffering capacity in
EAA soils, which counteracts the acidification of S oxidation. Although elemental S application
reduces soil pH and increases nutrient availability in alkaline soils, this response depends on the
amount of calcium carbonate present in the soil, which buffers the acidification of elemental S in
the soil (Lindemann et al., 1991). Previous studies showed that elemental S application at 448 kg
S ha-1 failed to enhance nutrient availability and yield (Wright and Snyder, 2009; Ye et al.,
2011). However, McCray and Rice (2013) determined sugarcane yield response to elemental S
when pH was >7.2 at same elemental S application. Expanded elemental S application to the
calcareous soils of EAA could potentially cause more environmental problems in the Everglades
wetland ecosystem. Increasing elemental sulfur application releases more P from the soils, which
may pose environmental problems from runoff and leaching of P into aquatic ecosystems
(Santoso et al., 1995, Childers et al., 2003). Increased sulfate (SO42-) levels in wetlands stimulate
the formation of methylmercury (neurotoxin) (Bates et al., 2002, Axelrad et al., 2011).
Therefore, it is important to understand the S amendment effectiveness in EAA’s organic soils
having variable CaCO3 content due to subsidence, so that nutrient availability can be optimized
Accep
ted M
anus
cript
while minimizing adverse environmental impacts. Results of this study could be used to update
fertilizer and nutrient management solutions for better sugarcane management in EAA. The
hypothesis of this study was that effects of increased S-amendment would show less pH
reduction in organic soil as CaCO3 content increases and as a result, soil nutrient concentrations
would be less influenced by S amendment. The study’s objective was to determine the S
amendment effectiveness on soil pH and nutrient availability in organic soil as CaCO3 level
increases in soil.
MATERIALS AND METHODS
Experimental Site and Design
A single outdoor pot study was conducted at the University of Florida’s Everglades Research and
Education Center (EREC) in Belle Glade, FL. A factorial experiment with two factors, three
levels of added CaCO3 (0%, 12.5%, and 50% by volume) and four elemental S rates (0, 90, 224,
448 kg S ha-1), were arranged using a randomized complete block design with four replications
(48 experimental units). Shell rock (< 2 mm mesh particle size) was used for the CaCO3
additions, which was thoroughly mixed in appropriate volumes with the entire soil for each pot
(95L pots). Organic soil for the experiment was obtained from a field (N 26° 39′, W 80° 37′) at
EREC. A single sugarcane (Saccharum spp.) accession, ‘CP89-2143’, was planted as single-eye
seed pieces in flats of the same organic soil used for the pots in December 2011 and then six
seedlings were transplanted from the nursery to each pot in January 2012. A single furrow,
approximately 15 cm deep, was formed in each pot in which all fertilizers were applied and then
Accep
ted M
anus
cript
the seedlings were transplanted and the furrow was covered. Four rates of granular elemental S
(90% S) were applied in a band in the furrow along with the other fertilizer. Other fertilizers
were applied according to recommendations and guidelines for this region (Gilbert et al., 2012).
All the fertilizers and elemental S were applied prior to planting and all pots received 29 kg P ha-
1 as monoammonium phosphate, 139 kg potassium (K) ha-1 as muriate of potash, and 39 kg
micromix ha-1 (containing manganese (Mn), zinc (Zn), copper (Cu), and boron (B)). All
calculations for fertilizer and S applications were based on the surface area of the pot. No
nitrogen was applied because the entire N requirement for sugarcane in the EAA comes from the
oxidation of organic soils (Rice et al., 2010). Water was applied two times a day through an
automatic microjet irrigation system using well water. Pots had drainage holes on the side at the
bottom. Weeds were removed by hand as necessary during the growing season. A support
structure of cables was built outside each row of pots in August 2012 to prevent sugarcane
lodging.
Soil Sampling and Nutrient Analysis
To evaluate the soil chemical properties, soil samples were taken four times from each pot. The
first soil sampling was carried out in January 2012, before planting and fertilization and the
remaining three samples were taken in May 2012, August 2012, and January 2013. Six random
soil cores were taken from each pot close to furrow at two depths, 0-15 cm and 15-30 cm, with a
soil sampling tube. After thoroughly mixing of six cores samples and then removing plant debris,
samples were placed in bags. Samples were air-dried at 31°C for three days and after being
Accep
ted M
anus
cript
sieved through a 2mm screen, samples were placed into the labeled airtight cups prior to
analysis.
Soil pH was measured using a soil to deionized (DI) water ratio of 1:2 (15 cm3 soil per 30
mL DI water). After 10 minutes of stirring and 1 hour of equilibrating, soil pH was measured on
a pH meter (Ye et al., 2011). Extractable ammonium (NH4+) and nitrate (NO3
-) were measured
using 2 M potassium chloride (KCl) extraction in a ratio of 1:10 of dried soil (2 g) to extractant
(20 mL). An AQ2 analyzer (NO3-) and spectrometer (NH4
+) were used to analyze the
concentration of these nutrients in soil (Castillo and Wright 2008). Water extraction was used to
determine the sulfate concentration by using 3 g soil in 25 mL DI water, followed by ion
chromatography (Gharmakher et al., 2009). Mehlich-3 extraction was used to determine the
concentration of Ca, magnesium (Mg), potassium (K), P, manganese (Mn), iron (Fe), zinc (Zn),
and copper (Cu) by using 2.5 cm3 soil in 25 mL extractant (Mehlich, 1984). Acetic acid
extraction was used to determine the concentration of Ca, Mg, K, and silicon (Si) by using 10
cm3 soils in 25 mL extractant (McCray and Ji, 2012). Inductively coupled plasma atomic
emission spectrometry (ICP) was used to analyze the nutrient concentration in soil for Mehlich 3
and acetic acid extractions.
Statistical Analysis
All statistical analyses were performed using SAS version 9.3 and JMP 10 (SAS Institute, Cary,
NC, USA). A mixed model was fit using restricted maximum likelihood in the GLIMMIX
procedure of SAS. The fixed effects were S application rate, calcium carbonate levels, time, and
their interaction, with block as a random effect. Analysis of variance was performed using PROC
Accep
ted M
anus
cript
GLIMMIX and treatment differences were determined using Tukey’s test with significance at P
< 0.05. Degree of freedom was adjusted using the Kenward-Roger adjustment. Pearson
correlation analysis was performed to assess relationships between variables using PROC
CORR.
RESULTS AND DISCUSSION
Soil pH
Soil pH was not significantly affected by any level of S application in soils having variable
CaCO3 contents at either depth (Table 1 and 2) during the sugarcane growing season. A limited
soil pH reduction by S application may be due to the presence of high buffering capacity in soil
against the acidification of S oxidation (Jaggi et al., 2005; Ye et al., 2011). Even pH in the soil
with no added CaCO3 was not significantly affected by the highest rate of S application (448 kg
ha-1). The pH range for these soils prior to S application was 7.54 to 7.66, which did not vary
after soil samples with S application were collected during the growing season. High soil pH
before S application indicates the presence of high carbonate and bicarbonate contents in soil,
which resist changes in soil pH (Rogovska et al., 2007). The current S recommendations (448 kg
S ha-1) were developed many years ago when soil pH was generally lower across the EAA. Now,
soil conditions have been changed because of subsidence and increased influence of CaCO3 from
underlying bedrock. Therefore, higher rates of S application may be required to produce
favorable responses for reducing pH in these soils, or areas having extremely high CaCO3 levels
may be determined to be uneconomical for crop production. Increased CaCO3 level in soil
Accep
ted M
anus
cript
significantly increased the soil pH at either depth (Table 1 and 2) due to increased carbonate and
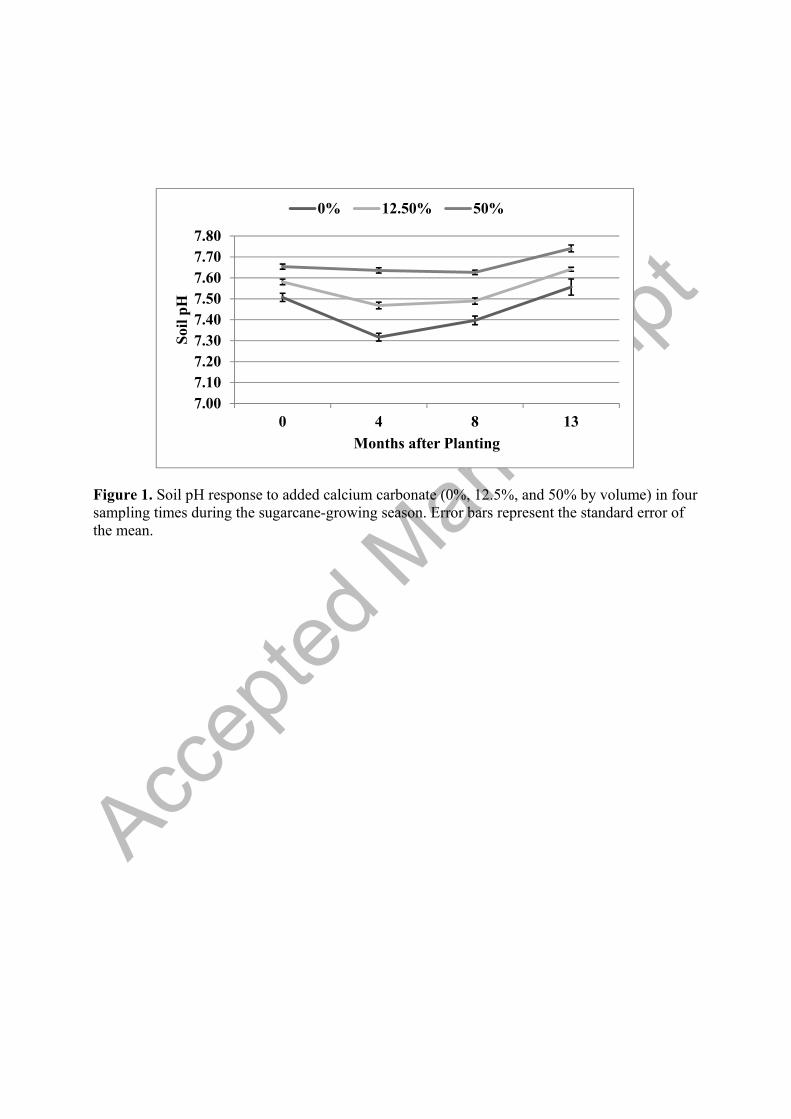
bicarbonate concentration in soil. Significantly higher soil pH (7.74) with added 50% CaCO3 in
organic soil was found in soil samples 13 month after plant and the lowest soil pH (7.29) was
with no added CaCO3 at 4 months for the depth 0-15 cm ( Figure 1). Reduction of soil pH at 4
months was likely due to uptake of certain nutrients like NH4+ and nitrification, which reduce the
pH in the rhizosphere (Bolan et al., 1991). In this study, NH4+ content in soil sharply decreased
after planting and was negatively correlated with soil pH (r2 = -0.52), which indicates that
increasing the NH4+ in soils decreases soil pH. A previous study also showed limited soil pH
reduction with S application (Ye et al., 2011). However, McCray and Rice (2013) showed pH
decreases in the row with banded S application.
Extractable Nitrogen
No significant effects of elemental S were determined for extractable nitrate (NO3-) and
ammonium (NH4+) concentrations for any level of CaCO3 at either depth (Tables 1 and 2).
Limited effects of S application on extractable NO3- and NH4
+ may be due to the low rate of S
application and the small volume of soil affected by banded application. Usually, the entire N
requirement for sugarcane in the EAA comes from the oxidation of organic soils (Rice et al.,
2010). The concentration of extractable NO3- was significantly higher in soil with no added
CaCO3 than soil with 50% CaCO3 for the depth 0-15 cm (Table 1). In addition, extractable NH4+
was significantly reduced with increased level of CaCO3 in organic soils (Table 1). Low
concentration of NO3- and NH4
+ with increased level of CaCO3 in organic soil might be due to
the decrease in organic matter content with increased volume of CaCO3, which led to the
Accep
ted M
anus
cript
decreased oxidation of organic soils and hence lower concentrations of NO3- and NH4
+.
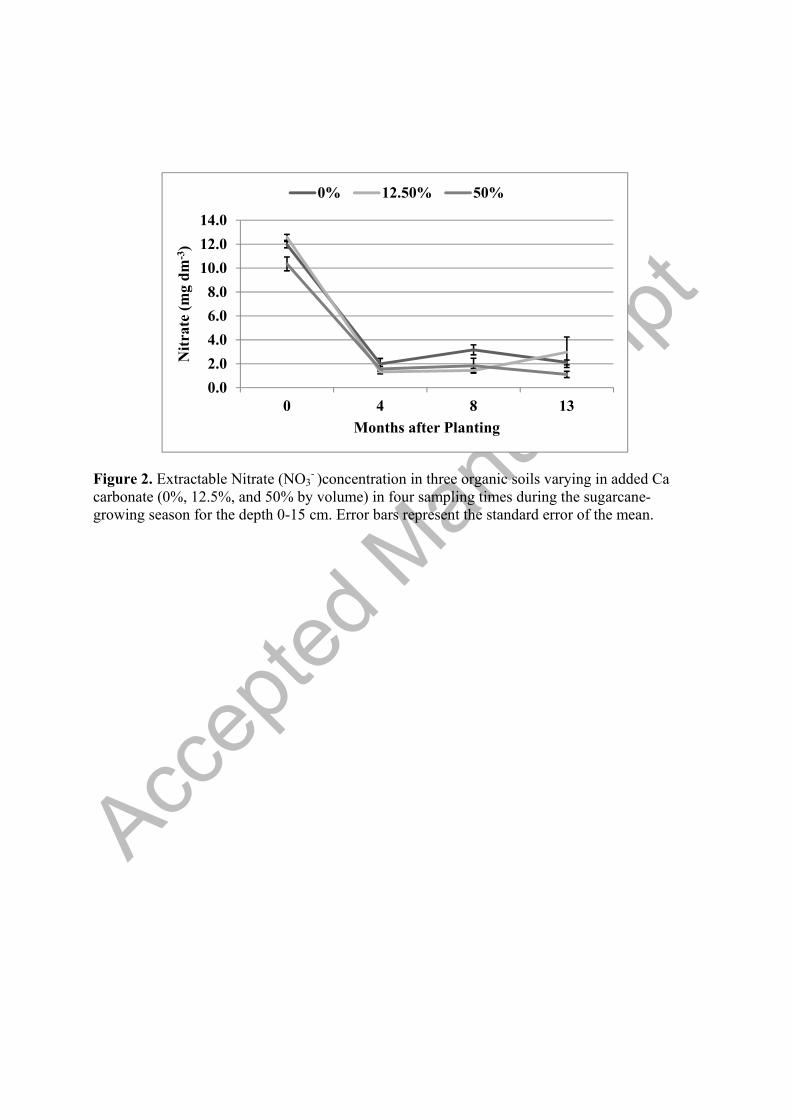
Extractable NO3- was sharply decreased from 0 (10-12 mg dm-3) to 4 months (1.5-2.0 mg dm-3),
and then remained near the same level throughout the growing season and had significant
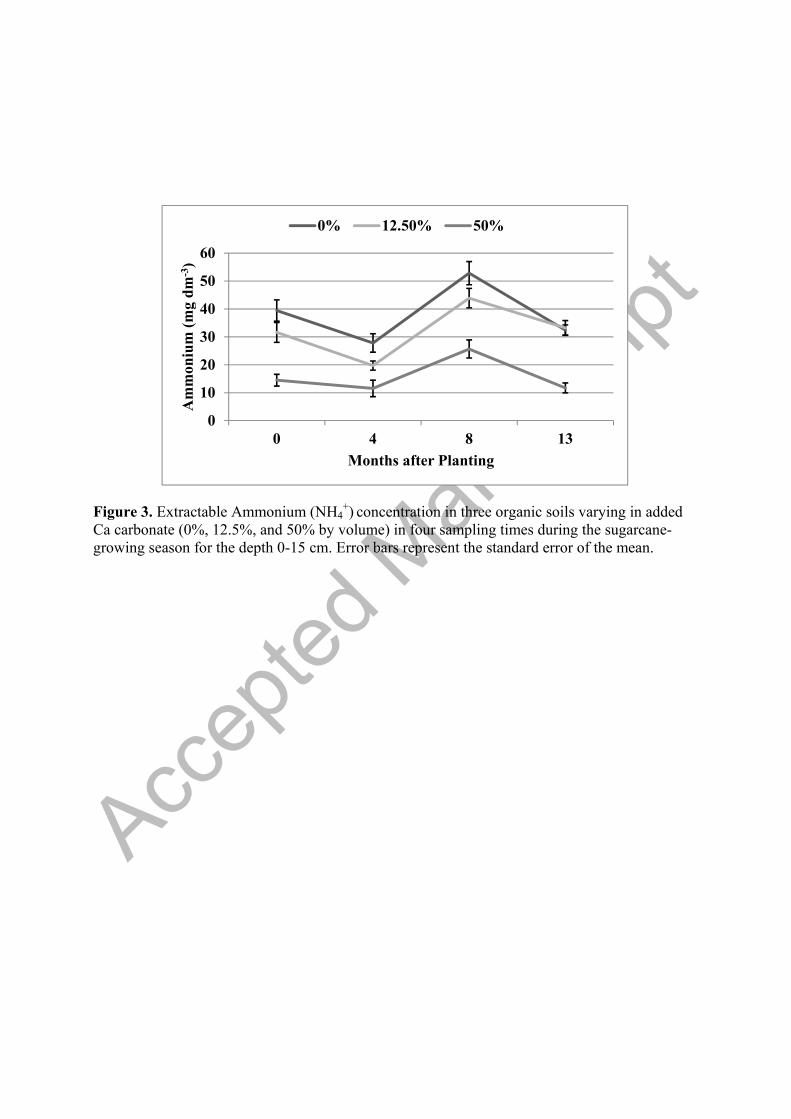
interaction with time ( Figure 2). However, extractable NH4+ concentrations fluctuated
throughout the growing season and did not show any significant interaction with time ( Figure 3).
The sharp decrease in NO3- concentration at the 4-month sampling was likely due to the plant
uptake and leaching losses. A fluctuation of ammonium may be due to plant uptake, which
decreased its level in soil, and oxidation of organic soil, which increased its levels in soil (Ye et
al., 2011).
Extractable Sulfate
Elemental S application significantly increased extractable sulfate (SO42-) concentration in
organic soils at the 0-15 cm depth (P > F = <0.001) (Table 1) and similar results were determined
for the 15-30 cm depth (Table 2). Sulfate concentration (190 mg dm-3) was highest in soil with
no added CaCO3 with highest elemental S rates (448 kg ha-1) (Table 1). Increased CaCO3 level in
organic soils significantly reduced extractable SO42- concentration (P > F = < 0.001) (Table 1).
There was a significant interaction between CaCO3 and sampling time for sulfate (P > F = <
0.001) (Table 1). Averaged across treatments, extractable SO42- concentrations were higher in
soils at first soil sampling (324 mg dm-3) and similar to nitrate, its concentration sharply
decreased in 4 months (75 mg dm-3) and then increased slightly in 13 months (88 mg dm-3).
Oxidation of elemental S in organic soils increases the extractable SO42- concentration, so the
higher the rate of S application, the higher the sulfate concentration in soil. The mineralization of
Accep
ted M
anus
cript
organic soil is the other source of SO42- in these soils and provides sufficient nutritional S for
sugarcane in these soils (Rice et al., 2010). Low concentration of SO42- with increased level of
CaCO3 in soils might be due to decreased organic matter content with increased volume of
CaCO3, which leads to the decreased oxidation of organic soils and hence, lower concentrations
of SO42-. Similar to nitrate, low SO4
2- concentration at 4 months was likely due to plant uptake
and leaching losses and similar results were also observed by Ye et al. (2011). High SO42-
concentration in soil from oxidation of elemental S and organic soil are likely to increase the risk
of sulfate export from fields and could be an environmental problem in the wetlands ecosystem
(Gabriel et al., 2011).
Extractable Phosphorus
Mehlich-3 extractable P was not significantly affected by sulfur application at any CaCO3 level
for any sample date for the 0-15 cm depth (Table 1) or for the 15-30 cm depth (Table 2).
Extractable P concentration was significantly decreased with increased CaCO3 level in organic
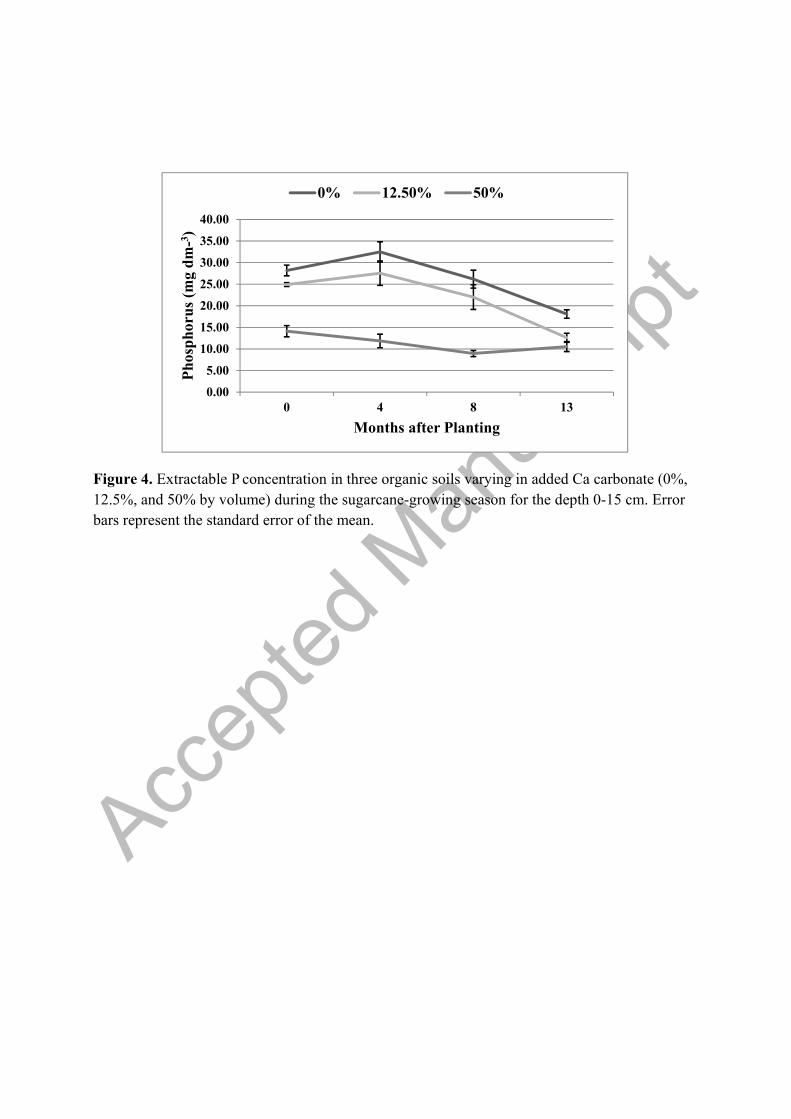
soils (P > F = <0.001) (Table 1). There was a significant interaction between CaCO3 and time for
P (P > F = <0.001) and averaged across treatments, its concentration decreased in organic soils
as the growing season progressed ( Figure 4). Similar results were determined for the 15-30 cm
depth (Table 2). Limited soil pH reduction by elemental S application did not influence the
extractable P concentration in organic soil. Soil pH was increased with increased level of CaCO3
in organic soils, which resulted in decreased extractable P. High CaCO3 concentration in soils
resulted in P adsorption with Ca and Mg, which made it unavailable for plant uptake (Wright and
Snyder, 2009; Wright et al., 2012). High soil pH in EAA soils will limit P availability to
Accep
ted M
anus
cript
sugarcane. Reduction of P concentration as the growing season progressed was likely due to
plant uptake and leaching losses (Ye et al., 2011).
Extractable Calcium, Magnesium, and Potassium
Mehlich-3 extractable Ca, Mg, and K were not affected by the application of elemental S at any
CaCO3 level during the sugarcane-growing season at either depth (Tables 1 and 2). Mehlich-3
extractable Ca concentration was significantly increased with increased level of CaCO3 in
organic soils at each depth (Tables 1 and 2). However, Mehlich-3 extractable Mg and K were
significantly decreased with increased level of CaCO3 in organic soils at each depth (Tables 1
and 2). Seasonal fluctuation of all these nutrient concentrations was observed in soils. Difference
in soil pH may not necessarily change the concentration of Ca, Mg, and K. Any change in pH
caused by S application would have been very localized because of the band application and so
the larger volume of soil would have been unaffected in terms of influence on other nutrients.
Thus, S application in organic soils showed limited effects on the concentrations of extractable
Ca, Mg, and K. Increased concentration of Ca was likely due to release of Ca from the CaCO3
and organic soil. However, increased volume of CaCO3 decreased the organic matter content in
soils, which resulted in lower concentrations of Mg and K per volume of soil. The other likely
reason of lower concentration of Mg and K with increased level of CaCO3 was the competition
with Ca in soils. Correlation of Ca with these nutrients revealed that both Mg (r2 = -0.45) and K
(r2 =-0.56) were negatively correlated with Ca in soils, which means increasing one would
decrease the other. Seasonal fluctuation of these nutrient concentrations in soils may be due to
plant uptake, leaching losses and oxidation of organic soils (Ye et al., 2011).
Accep
ted M
anus
cript
Extractable Manganese
Manganese is a micronutrient, which is strongly influenced by the high pH of calcareous soils.
Manganese concentration was not significantly affected by S application in organic soils during
the sugarcane growing season at either depth (Tables 3 and 4). Usually soil pH increases with
CaCO3 content, which consequently decreases the Mn availability in soils. Unexpected results of
Mn concentration were observed with CaCO3. Extractable Mn increased with increasing level of
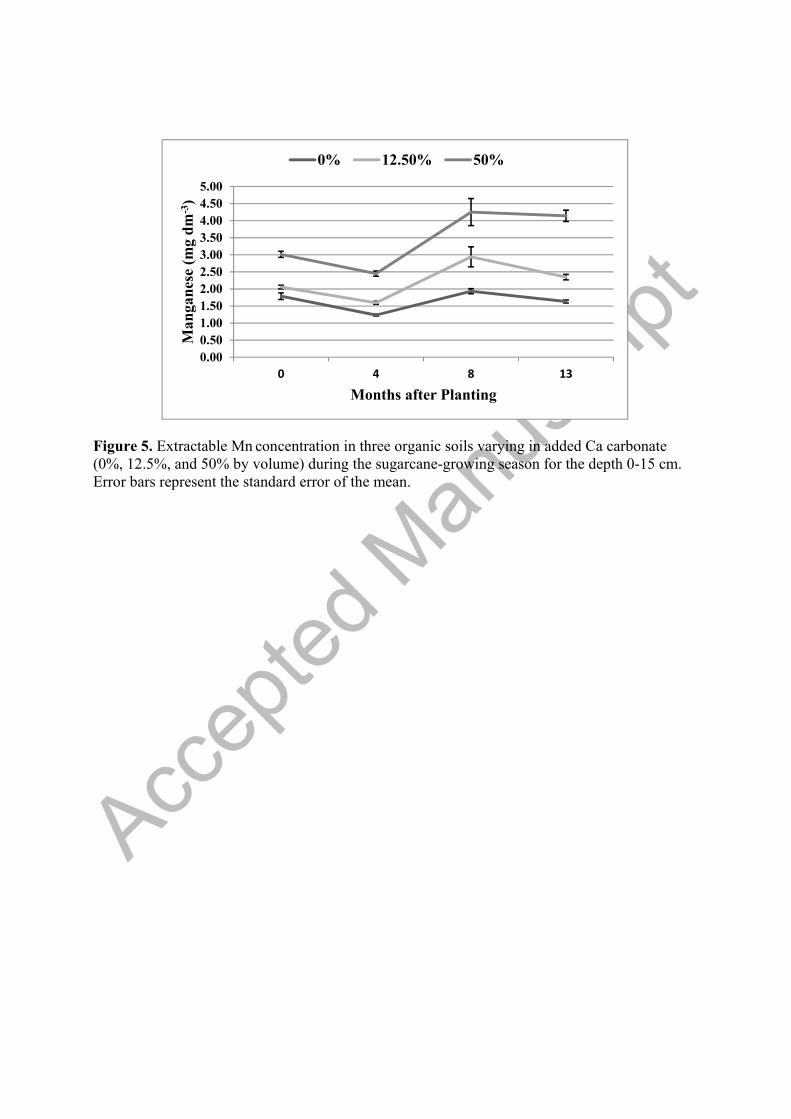
CaCO3 at each depth (Tables 3 and 4). Averaged across treatments for the 0-15 cm depth, Mn
concentration significantly decreased after the first soil sampling at 4 months, then increased at 8
months, followed by a slight decrease at 13 months in all three soils varying in added CaCO3 (
Figure 5). No change in Mn availability in soils with S application was likely due to limited soil
pH reduction by elemental S oxidation. High buffering capacity of organic soils counteracted the
acidification of S oxidation (Ye et al., 2011). Increased extractable Mn concentration in soils
with increased CaCO3 level is probably due to the changes in the physical properties of the soil
with added CaCO3. Added CaCO3 decreased the volume of organic matter in the soil and likely
increased the bulk density of the soil. Increased bulk density was indicated from the increased
density of air-dried soil. The increased density caused by the higher CaCO3 levels resulted in
reduced water infiltration rates, which were observed with added CaCO3, particularly at the 50%
CaCO3 level. The lower infiltration rates and associated poorer drainage resulted in periods of
increased soil moisture including short periods of flooding with the added CaCO3 treatments.
Restricted aeration due to poor drainage or compaction increased reducing conditions in organic
soils, which increased Mn availability in soils (Weil et al., 1997). Increased leaf Mn
concentrations have been consistently determined for samples taken during the rainy summer
Accep
ted M
anus
cript
months in Florida compared to the drier spring, which have been attributed to differences in soil
moisture (McCray et al., 2009). Plant uptake, leaching losses and oxidation of organic soils
might be the reasons of seasonal fluctuation of Mn in soils.
Extractable Iron, Zinc, and Copper
Similar to Mn, extractable Fe, Zn, and Cu are also highly influenced by high pH in calcareous
soils. Application of elemental S did not significantly influence extractable Fe, Zn, and Cu
concentrations in organic soils varying in CaCO3 level during the growing season at either depth
(Tables 3 and 4). Extractable Fe, Zn, and Cu concentrations were significantly decreased with
increased level of CaCO3 in soils at each depth (Tables 3 and 4). Similar to Mn, limited soil pH
reduction by S application did not influence the Fe, Zn, and Cu availability in soils (Ye et al.,
2011). Increased CaCO3 level in soils increased soil pH and resulted in decreased Fe, Zn, and Cu
availability in soils (Wright et al., 2012). Averaged across treatments, there were significant
differences in sampling time for these nutrients at each depth (Tables 3 and 4). There may be
many reasons for this difference such as plant uptake, leaching losses, high soil pH and high
CaCO3 and oxidation of organic soils.
Extractable Silicon
Acetic acid extractable Si concentration was not significantly affected by S application at any
CaCO3 level in soils during the sugarcane-growing season at either depth (Tables 3 and 4).
Increased CaCO3 level in soils decreased the availability of Si in soils at each depth (Tables 3
and 4). There were significant differences in Si concentration among sampling times (Table 3).
Accep
ted M
anus
cript
Averaged across treatments, Si concentration was significantly decreased from 4 (36.1 mg dm-3)
to 8 months (30.7 mg dm-3), then increased to 13 months (35.8 mg dm-3). The lack of an
influence of S application on Si concentration was likely due to limited soil pH reduction. High
soil pH and high extractable Ca due to increased CaCO3 level in soils are likely reasons for
decreased Si availability in soils. The results showed that Si was negatively correlated with soil
pH (r2 = -0.56) and Ca concentration (r2 = -0.89) at the 0-15 cm depth, which means that
increasing one would decrease the other. Similar results were found for the soil depth 15-30 cm.
CONCLUSIONS
Soil pH was not affected by different rates of elemental sulfur application. Limited effects of
elemental S application on soil pH were likely due to strong buffering capacity of these organic
soils, which counteracted the acidification of S oxidation. Consequently, application of elemental
S failed to enhance the nutrient availability in soil. In addition, sulfur application increased
sulfate concentration in the soils that could be at risk for export from the field. However,
increased level of CaCO3 in organic soils raised the soil pH and hence, decreased nutrient
availability in soil, except for Mn. The unexpected results of increased Mn availability with
increased CaCO3 levels are associated with reducing conditions, which were due to the changes
in the physical properties of the soil with added CaCO3. High bulk density caused by added
CaCO3 decreased water infiltration rates in soils, which led to increases in soil moisture.
Increased soil moisture enhanced the reducing conditions in soils, which consequently increased
Mn availability. The increased soil pH brought about by CaCO3 additions likely increased the
capacity of these soils to resist pH changes by S oxidation. New sulfur recommendation for these
Accep
ted M
anus
cript
soils may be needed, but it should be evaluated in terms of effects on the plant growth and
adverse environmental effects. This study demonstrated that both chemical and physical
properties of soil are changed as Histosols become shallower with subsidence and that all these
changes should be considered in the evaluation of agronomic practices on these soils.
ACKNOWLEDGMENT
We are thankful to Everglades Agricultural Area Environmental Protection District for funding.
REFERENCES
Anderson, D.L., 1985. Crop soil fertility recommendations of the Everglades soil testing
laboratory. EREC-Belle Glade Report EV-1985-10. University of Florida, Belle Glade,
FL.
Axelrad, D.M., T. Lange, M. Gabriel and T.D. Atkeson. 2011. Chapter 3B: Mercury and Sulfur
Monitoring, Research and Environmental Assessment in South Florida. . In: 2011 South
Florida Environmental Report – Volume I, South Florida Water Management District,
West Palm Beach, FL.
Accep
ted M
anus
cript
Bates, A.L., W.H. Orem, J.W. Harvey and E.C. Spiker 2002. Tracing sources of sulfur in the
Florida Everglades. Journal of Environmental Quality 31:287-299.
Beverly, R.B. and D.L. Anderson. 1986. Effects of acid source on soil pH. Soil Science 143:301-
303.
Bolan N.S., M.J. Hedley and R.E. White. 1991. Processes of soil acidification during nitrogen
cycling with emphasis on legume based pastures. Plant and Soil Vol. 134, No. 1. pp. 53-
63.
Castillo, M.S. and A.L. Wright. 2008a. Microbial activity and phosphorus availability in a
subtropical soil under different land use. World Journal of Agricultural Sciences 4:314-
320.
Chen, M., S.H. Daroub, T.A. Lang, and O.A. Diaz. 2006. Specific conductance and ionic
characteristics of farm canal in the Everglades Agricultural Area. Journal of
Environmental Quality 35:141-150.
Childers, D.L., R.F. Doren, R. Jones, G.B. Noe, M. Rugge, and L.J. Scinto 2003, Decadal change
in vegetation and soil phosphorus patterns across the Everglades landscape. Journal of
Environmental Quality 32:344-362.
Daroub S.H., S.V. Horn, T. A. Lang and O.A. Diaz 2011, Best management practices and long-
term water quality trends in the Everglades Agricultural Area. Critical Reviews in
Environmental Science and Technology 41:S1, 608-632
Accep
ted M
anus
cript
Gabriel, M.C., M. Axelrad, T. Lange, and L. Dirk. 2011. Chapter 3B: Mercury and sulfur
monitoring, research and environmental assessment in South Florida. 2010 South Florida
Environmental Report. South Florida Water Management District, West Palm Beach, FL.
Gharmakher, H.N., J.M. Machet, N. Beaudoin and S. Recous 2009. Estimation of sulfur
mineralization and relationships with nitrogen and carbon in soils. Biology and Fertility
of Soils 45:297-304.
Gilbert R.A., R.W. Rice and D. C. Odero. 2012. Nutrient Requirements for Sugarcane
Production on Florida Muck Soils. Florida Cooperative Extension Service Fact Sheet SS-
AGR-228. UF/IFAS Electronic Data Information Source (EDIS) Database. Available at
http://edis.ifas.ufl.edu/sc026. University of Florida, Gainesville.
Jaggi, R.C., M.S. Aulakh and R. Sharma. 2005. Impacts of elemental S applied under various
temperature and moisture regions on pH and available P in acidic, neutral, and alkaline
soils. Biology and Fertility of Soils 41:52–58.
Lindemann, W.C., J.J. Aburto, W.M. Haffner and A.A. Bono. 1991. Effect of sulfur source on
sulfur oxidation. Soil Science Society of American Journal 55:85-90.
Mehlich, A. 1984. Mehlich 3 soil test extractant: A modification of Mehlich 2 extractant.
Communications in Soil Science and Plant Analysis 15:1409-1416.
McCray, J. M., S. Ji, G. Powell, G. Montes, R. Perdomo, and Y. Luo. 2009. Seasonal
concentrations of leaf nutrients in Florida sugarcane. Sugar Cane International 27(1):17-
24.
Accep
ted M
anus
cript
McCray, J. M., and S. Ji. 2012. Calibration of sugarcane response to calcium silicate on Florida
Histosols. Journal of Plant Nutrition 35:1192-1209.
McCray, J.M., and R.W. Rice. 2013. Sugarcane yield response to elemental sulfur on high pH
organic soils. Proceedings of the International Society of Sugar Cane Technologists
28:280-287.
Morgan, K.T., J.M. McCray, R.W. Rice, R.A. Gilbert and L.E. Baucum. 2009. Review of current
sugarcane fertilizer recommendations: A report from the UF/IFAS sugarcane fertilizer
standards task force. UF EDIS SL 295, Gainesville, FL.
Rice, R.W., R.A. Gilbert and J.M. McCray. 2010. Nutrient requirements for Florida sugarcane.
UF-IFAS SS-AGR-228, Gainesville, FL.
Rogovska, N.P., A.M. Blackmer and A.P. Mallarino. 2007. Relationships between soybean yield,
soil pH, and soil carbonate concentration. Soil Science Society of American Journal
71:1251-1256.
Santoso, D., R.D.B. Lefroy and G.J. Blair. 1995. A comparison of sulfur extractions for
weathered acid soils. Australian Journal of Soil Research 33:125-133.
Snyder, G.H., 2005. Everglades Agricultural Area soil subsidence and land use projections.
Proceedings of the Soil and Crop Science Society of Florida 64:44-51.
Weil R.R., C.D. Foy and C.A. Coradetti. 1997. Influence of Soil Moisture Regimes on
Subsequent Soil Manganese Availability and Toxicity in Two Cotton Genotypes.
Agronomy Journal Vol. 89:1-8.
Accep
ted M
anus
cript
Wright, A.L. and G.H. Snyder. 2009. Soil Subsidence in the Everglades Agricultural Area. SL
311, Soil and Water Science Dept., Florida Cooperative Extension Service, IFAS,
University of Florida.
Wright, A.L., E.A. Hanlon and R. Rice. (2012). Managing pH in the Everglades agricultural
soils. Florida Cooperative Extension Service Fact Sheet SL-287. UF/IFAS Electronic
Data Information Source (EDIS) Database. Available at http://edis.ifas.ufl.edu/SS500.
Univ. of Florida, Gainesville.
Ye, R., A.L. Wright and J.M. McCray. 2011. Seasonal Changes In Nutrient Availability For
Sulfur-Amended Everglades Soils Under Sugarcane. Journal of Plant Nutrition 34:2095–
2113.
Accep
ted M
anus
cript
Figure 1. Soil pH response to added calcium carbonate (0%, 12.5%, and 50% by volume) in four sampling times during the sugarcane-growing season. Error bars represent the standard error of the mean.
7.007.107.207.307.407.507.607.707.80
0 4 8 13
Soi
l pH
Months after Planting
0% 12.50% 50%
Accep
ted M
anus
cript
Figure 2. Extractable Nitrate (NO3- )concentration in three organic soils varying in added Ca
carbonate (0%, 12.5%, and 50% by volume) in four sampling times during the sugarcane-growing season for the depth 0-15 cm. Error bars represent the standard error of the mean.
0.0
2.0
4.0
6.0
8.0
10.0
12.0
14.0
0 4 8 13
Nit
rate
(m
g d
m-3
)
Months after Planting
0% 12.50% 50%
Accep
ted M
anus
cript
Figure 3. Extractable Ammonium (NH4+) concentration in three organic soils varying in added
Ca carbonate (0%, 12.5%, and 50% by volume) in four sampling times during the sugarcane-growing season for the depth 0-15 cm. Error bars represent the standard error of the mean.
0
10
20
30
40
50
60
0 4 8 13
Am
mon
ium
(m
g d
m-3
)
Months after Planting
0% 12.50% 50%
Accep
ted M
anus
cript
Figure 4. Extractable P concentration in three organic soils varying in added Ca carbonate (0%, 12.5%, and 50% by volume) during the sugarcane-growing season for the depth 0-15 cm. Error bars represent the standard error of the mean.
0.00
5.00
10.00
15.00
20.00
25.00
30.00
35.00
40.00
0 4 8 13
Pho
spho
rus
(mg
dm
-3 )
Months after Planting
0% 12.50% 50%
Accep
ted M
anus
cript
Figure 5. Extractable Mn concentration in three organic soils varying in added Ca carbonate (0%, 12.5%, and 50% by volume) during the sugarcane-growing season for the depth 0-15 cm. Error bars represent the standard error of the mean.
0.000.501.001.502.002.503.003.504.004.505.00
0 4 8 13
Man
gan
ese
(mg
dm
-3)
Months after Planting
0% 12.50% 50%
Accep
ted M
anus
cript
TABLES
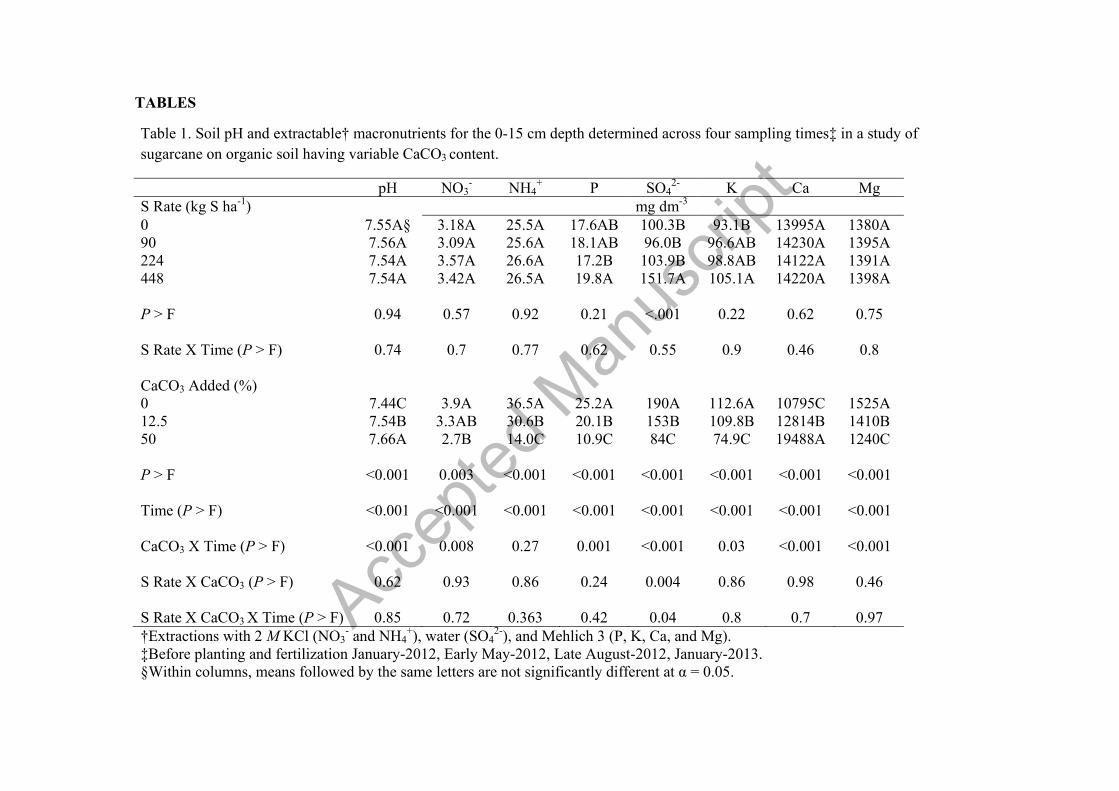
Table 1. Soil pH and extractable† macronutrients for the 0-15 cm depth determined across four sampling times‡ in a study of sugarcane on organic soil having variable CaCO3 content.
pH NO3- NH4
+ P SO42- K Ca Mg
S Rate (kg S ha-1) mg dm-3 0 7.55A§ 3.18A 25.5A 17.6AB 100.3B 93.1B 13995A 1380A 90 7.56A 3.09A 25.6A 18.1AB 96.0B 96.6AB 14230A 1395A 224 7.54A 3.57A 26.6A 17.2B 103.9B 98.8AB 14122A 1391A 448 7.54A 3.42A 26.5A 19.8A 151.7A 105.1A 14220A 1398A P > F 0.94 0.57 0.92 0.21 <.001 0.22 0.62 0.75 S Rate X Time (P > F) 0.74 0.7 0.77 0.62 0.55 0.9 0.46 0.8 CaCO3 Added (%) 0 7.44C 3.9A 36.5A 25.2A 190A 112.6A 10795C 1525A 12.5 7.54B 3.3AB 30.6B 20.1B 153B 109.8B 12814B 1410B 50 7.66A 2.7B 14.0C 10.9C 84C 74.9C 19488A 1240C P > F <0.001 0.003 <0.001 <0.001 <0.001 <0.001 <0.001 <0.001 Time (P > F) <0.001 <0.001 <0.001 <0.001 <0.001 <0.001 <0.001 <0.001 CaCO3 X Time (P > F) <0.001 0.008 0.27 0.001 <0.001 0.03 <0.001 <0.001 S Rate X CaCO3 (P > F) 0.62 0.93 0.86 0.24 0.004 0.86 0.98 0.46 S Rate X CaCO3 X Time (P > F) 0.85 0.72 0.363 0.42 0.04 0.8 0.7 0.97 †Extractions with 2 M KCl (NO3
- and NH4+), water (SO4
2-), and Mehlich 3 (P, K, Ca, and Mg). ‡Before planting and fertilization January-2012, Early May-2012, Late August-2012, January-2013. §Within columns, means followed by the same letters are not significantly different at α = 0.05.
Accep
ted M
anus
cript
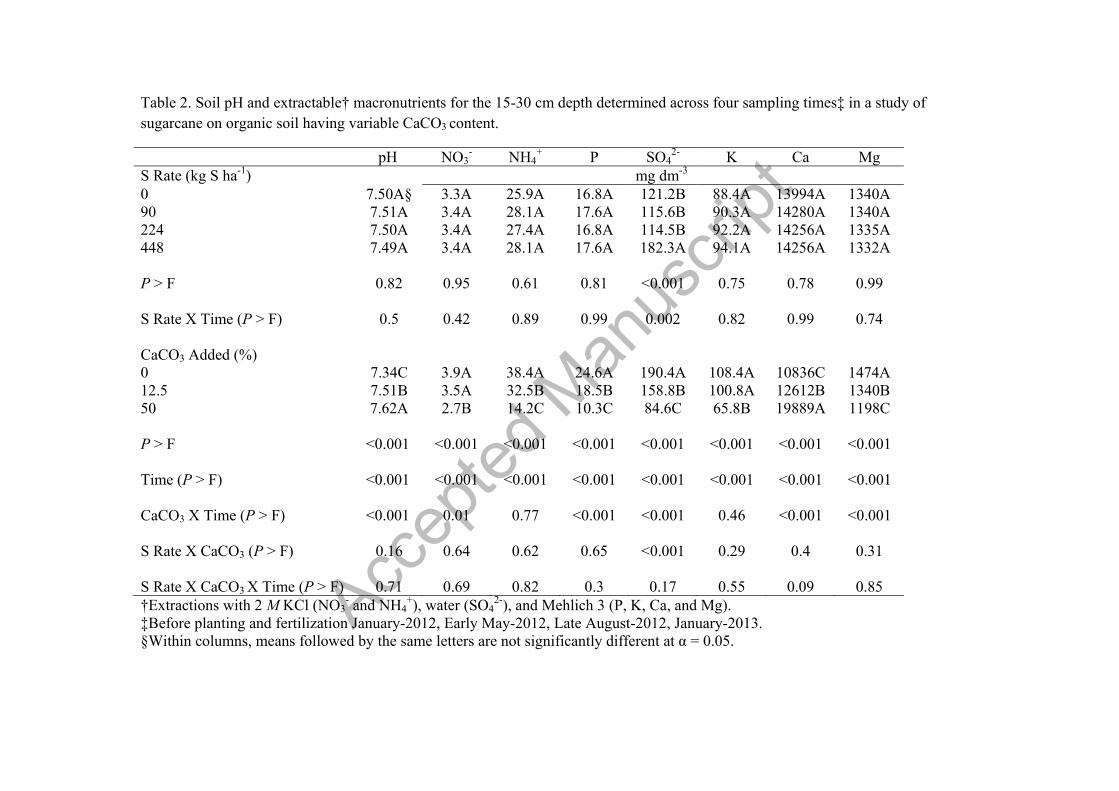
Table 2. Soil pH and extractable† macronutrients for the 15-30 cm depth determined across four sampling times‡ in a study of sugarcane on organic soil having variable CaCO3 content.
pH NO3- NH4
+ P SO42- K Ca Mg
S Rate (kg S ha-1) mg dm-3 0 7.50A§ 3.3A 25.9A 16.8A 121.2B 88.4A 13994A 1340A 90 7.51A 3.4A 28.1A 17.6A 115.6B 90.3A 14280A 1340A 224 7.50A 3.4A 27.4A 16.8A 114.5B 92.2A 14256A 1335A 448 7.49A 3.4A 28.1A 17.6A 182.3A 94.1A 14256A 1332A P > F 0.82 0.95 0.61 0.81 <0.001 0.75 0.78 0.99 S Rate X Time (P > F) 0.5 0.42 0.89 0.99 0.002 0.82 0.99 0.74 CaCO3 Added (%) 0 7.34C 3.9A 38.4A 24.6A 190.4A 108.4A 10836C 1474A 12.5 7.51B 3.5A 32.5B 18.5B 158.8B 100.8A 12612B 1340B 50 7.62A 2.7B 14.2C 10.3C 84.6C 65.8B 19889A 1198C P > F <0.001 <0.001 <0.001 <0.001 <0.001 <0.001 <0.001 <0.001 Time (P > F) <0.001 <0.001 <0.001 <0.001 <0.001 <0.001 <0.001 <0.001 CaCO3 X Time (P > F) <0.001 0.01 0.77 <0.001 <0.001 0.46 <0.001 <0.001 S Rate X CaCO3 (P > F) 0.16 0.64 0.62 0.65 <0.001 0.29 0.4 0.31 S Rate X CaCO3 X Time (P > F) 0.71 0.69 0.82 0.3 0.17 0.55 0.09 0.85 †Extractions with 2 M KCl (NO3
- and NH4+), water (SO4
2-), and Mehlich 3 (P, K, Ca, and Mg). ‡Before planting and fertilization January-2012, Early May-2012, Late August-2012, January-2013. §Within columns, means followed by the same letters are not significantly different at α = 0.05.
Accep
ted M
anus
cript
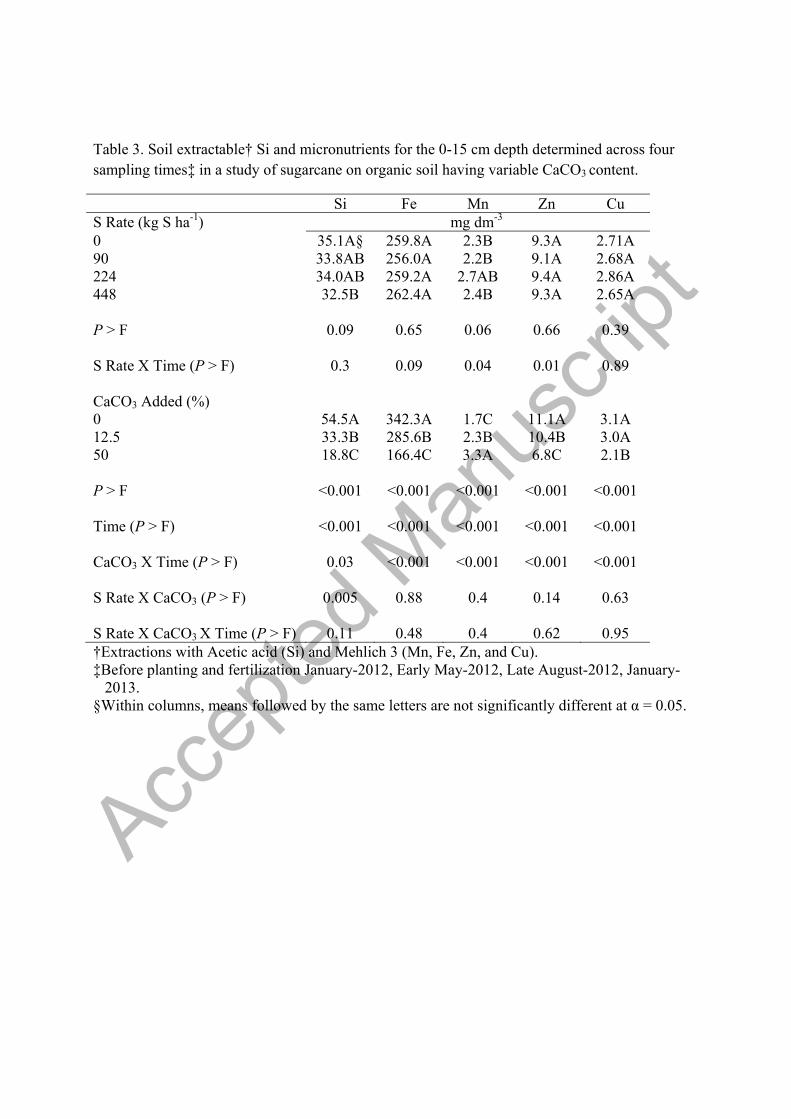
Table 3. Soil extractable† Si and micronutrients for the 0-15 cm depth determined across four sampling times‡ in a study of sugarcane on organic soil having variable CaCO3 content.
Si Fe Mn Zn Cu S Rate (kg S ha-1) mg dm-3 0 35.1A§ 259.8A 2.3B 9.3A 2.71A 90 33.8AB 256.0A 2.2B 9.1A 2.68A 224 34.0AB 259.2A 2.7AB 9.4A 2.86A 448 32.5B 262.4A 2.4B 9.3A 2.65A P > F 0.09 0.65 0.06 0.66 0.39 S Rate X Time (P > F) 0.3 0.09 0.04 0.01 0.89 CaCO3 Added (%) 0 54.5A 342.3A 1.7C 11.1A 3.1A 12.5 33.3B 285.6B 2.3B 10.4B 3.0A 50 18.8C 166.4C 3.3A 6.8C 2.1B P > F <0.001 <0.001 <0.001 <0.001 <0.001 Time (P > F) <0.001 <0.001 <0.001 <0.001 <0.001 CaCO3 X Time (P > F) 0.03 <0.001 <0.001 <0.001 <0.001 S Rate X CaCO3 (P > F) 0.005 0.88 0.4 0.14 0.63 S Rate X CaCO3 X Time (P > F) 0.11 0.48 0.4 0.62 0.95 †Extractions with Acetic acid (Si) and Mehlich 3 (Mn, Fe, Zn, and Cu). ‡Before planting and fertilization January-2012, Early May-2012, Late August-2012, January-
2013. §Within columns, means followed by the same letters are not significantly different at α = 0.05.

Accep
ted M
anus
cript
Table 4. Soil extractable† Si and micronutrients for the 15-30 cm depth determined across four sampling times‡ in a study of sugarcane on organic soil having variable CaCO3 content.
Si Fe Mn Zn Cu S Rate (kg S ha-1) mg dm-3 0 27.5A§ 257.8A 2.13A 8.5A 2.4A 90 25.0 B 255.4A 2.21A 8.4A 2.5A 224 26.7AB 255.7A 2.37A 8.5A 2.6A 448 25.1B 254.1A 2.25A 8.3A 2.5A P > F 0.047 0.97 0.31 0.78 0.41 S Rate X Time (P > F) 0.33 0.76 0.18 0.24 0.63 CaCO3 Added (%) 0 47.6A 342.3A 1.5C 10.9A 2.86A 12.5 24.0B 285.6B 2.1B 9.6B 2.81A 50 12.3C 156.3C 3.3A 5.5C 1.85B P > F <0.001 <0.001 <0.001 <0.001 <0.001 Time (P > F) <0.001 <0.001 <0.001 <0.001 <0.001 CaCO3 X Time (P > F) <0.001 0.01 0.001 0.04 0.057 S Rate X CaCO3 (P > F) 0.09 0.63 0.75 0.62 0.33 S Rate X CaCO3 X Time (P > F) 0.85 0.32 0.57 0.12 0.55 †Extractions with Acetic acid (Si) and Mehlich 3 (Mn, Fe, Zn, and Cu). ‡Before planting and fertilization January-2012, Early May-2012, Late August-2012, January-
2013. §Within columns, means followed by the same letters are not significantly different at α = 0.05.