Embed Size (px)
Citation preview
HOLGER DALKMANN, DIRECTOR, EMBARQ, WORLD RESOURCES INSTITUTE
NEXT STATION: OUR LOW-CARBON FUTUREEn Route to a Transportwende?Climate Solutions for the Transportation Sector - Nov. 24, 2014

THE URBANIZATION CHALLENGE• Over 50% of the global population now live in cities and urban
areas, rising to 70% by 2050.
Billion People
0
2
4
6
8
10
20502040203020202010200019901980197019601950
Global population
Urban population
Rural population
70%
50%
30%
Cities
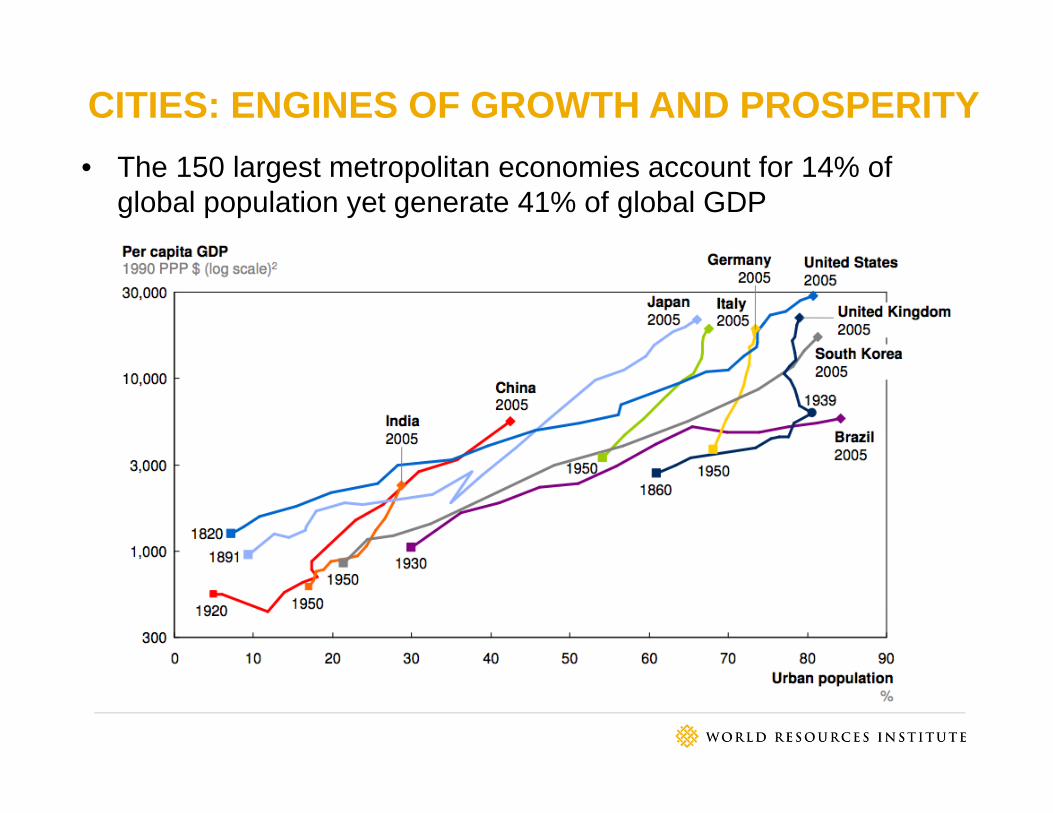
CITIES: ENGINES OF GROWTH AND PROSPERITY• The 150 largest metropolitan economies account for 14% of
global population yet generate 41% of global GDP

CITIES ARE KEY DRIVERS OF ECONOMIC GROWTH
Note: Population split from 2011, GDP split estimate from Grubler et al 2007 cited in GEA 2012, Energy use split from GEA 2005, Emissions from World Energy Outlook 2006 SOURCE: World UrbanisationProspects, Grubler et al 2007, GEA 2012, WEO 2006
52% of Population
80% of GDP

250 million1970
1 billion
2010
3 billion?
2050
Stock of Motorcars

ReducedGap
BRIDGING THE GAP TO A 2 DEGREE SCENARIO
Reference: UNEP 2013 Gap Report
Transport1.7 – 2.5 Gt
2 degreescenario
17GtGapBusiness
As Usual
2 degreescenario

THE CHALLENGE – 23% REDUCTION FOR 2°AND $20T
Source: IEA (2012) Energy Technology Perspectives
42,971
33,194
0
5,000
10,000
15,000
20,000
25,000
30,000
35,000
40,000
45,000
50,000
2000 2005 2010 2015 2020 2025 2030 2035 2040 2045 2050
Road
Travel (Billion
Veh
‐Km)
4 Degree Scenario 2 Degree Scenario

RELATED HEALTH & SAFETY IMPACTS
Source: EMBARQ Analysis, Duduta and Hidalgo (2013)
3,783,009
5,098,418
0
1,000,000
2,000,000
3,000,000
4,000,000
5,000,000
6,000,000
2005 2010 2015 2020 2025 2030 2035 2040 2045 2050
Worldwide an
nual traffic
fatalities
2 Degree Scenario 4 Degree Scenario

Source: http://ec.europa.eu/clima/policies/package/index_en.htm
EU commitment: 40 % GHG reduction by
2030
Norway – Carbon Neutrality by 2030 (for negotiation at Paris)

COST OF CONGESTION IN EU

COSTS OF TRAFFIC CONGESTION
Sources: Christidis, P. and Ibáñez Rivas, J. N., 2012. Measuring Road Congestion. European Commission Joint Research Centre, Institute for Prospective Technological Studies, Seville, Spain.
0.0%
0.5%
1.0%
1.5%
2.0%
0
20
40
60
80
100
120
Total EU Germany France UK
Annual Cost of Congestion (€B)
Cost of Congestion as% of GDP 2009
• In Europe €110Bn is lost annually due to traffic congestion

COSTS OF TRAFFIC CONGESTION
Sources: IBM Institute for Business Value, Smarter cities for smarter growth. Li-Zeng Mao, Hong-Ge Zhu, and Li-RenDuan (2012) The Social Cost of Traffic Congestion and Countermeasures in Beijing. Sustainable Transportation Systems: pp. 68-76.
4.2% 4.1% 4.0% 4.0%3.4%
2.6% 2.4% 2.1% 1.8%
0%
1%
2%
3%
4%
5%
Perc
enta
ge o
f GD
P
Cost of Traffic Congestion as a Percentage of GDP
Traffic congestion costs some cities more than 4% of GDP

AIR QUALITY IMPACTS

AIR QUALITY IMPACTS
Source: World Health Organisation: http://apps.who.int/gho/data/node.wrapper.ENVHEALTH3
0
50
100
150
200
250
300
New
Yor
kLo
s An
gele
sC
hica
goB
ueno
s A
ires
Sao
Pau
loR
io d
e Ja
neiro
Bog
ota
Mex
ico
City
Lim
aP
aris
Ess
enM
osco
wIs
tanb
ulLo
ndon
Kin
shas
aC
airo
Tehr
anBa
ghda
dLa
gos
Joha
nnes
burg
Shan
ghai
Beiji
ngG
uang
zhou
She
nzhe
nTi
anjin
Don
ggua
nC
heng
duW
uhan
Cho
ngqu
ngH
angz
hou
Hon
g Ko
ngTo
kyo
Osa
kaN
agoy
aM
anila
Seou
lTa
ipei
Ban
gkok
Ho
Chi
Min
h C
ityD
haka
Del
hiM
umba
iC
alcu
ttaC
henn
aiBe
ngal
uru
Hyd
erab
adAh
med
abad
Jaka
rtaK
arac
hiLa
hore
North America
Latin America
Europe & Central
Asia
Middle-east & North Africa
East Asia & Pacific South Asia
WHO air quality standard PM10 <20 per m3
Particulate matter per m3 for top 50 cities – higher particulate matter means worse air quality
• Of a selection of the world’s biggest cities by population none meet WHO air quality standards

LOCAL ISSUES: ROAD SAFETY

LOCAL ISSUES: PHYSICAL INACTIVITY
3.2 million people are affected for illnesses derived from physical inactivity and obesity

“BUSINESS AS USUAL” IS BREAKING DOWN
LOST ACCESSIBILITYLOST TIME
LOST PUBLIC SPACELOST HEALTH


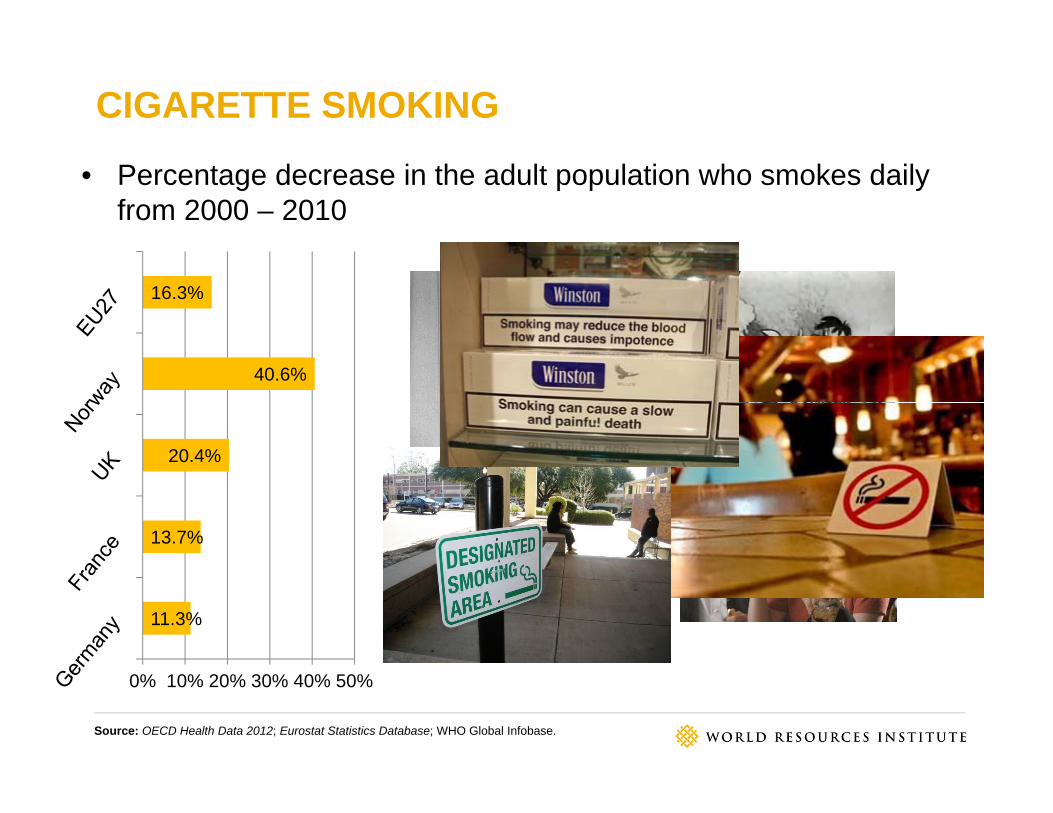
CIGARETTE SMOKING
• Percentage decrease in the adult population who smokes daily from 2000 – 2010
Source: OECD Health Data 2012; Eurostat Statistics Database; WHO Global Infobase.
11.3%
13.7%
20.4%
40.6%
16.3%
0% 10% 20% 30% 40% 50%
CIGARETTE SMOKING
• Percentage decrease in the adult population who smokes daily from 2000 – 2010
Source: OECD Health Data 2012; Eurostat Statistics Database; WHO Global Infobase.
11.3%
13.7%
20.4%
40.6%
16.3%
0% 10% 20% 30% 40% 50%

WHERE DO PEOPLE STAY?
IHG•65 years•645K rooms•100 countries
Hilton•93 years•610K rooms•88 countries
Accor•44 years•530K rooms•92 countries
Airbnb•4 years•650K rooms•192 countries

PARADIGM SHIFT: NEW YORK CITY

PARADIGM SHIFT IN US?• Proportion of population with driving licenses by age (2002-2008)
Source: Sivak and Schoettle, 2011 http://deepblue.lib.umich.edu/bitstream/handle/2027.42/86680/102764.pdf

BUILD ON GLOBAL BEST PRACTICES:
• Portland City’s transportation policies save its residents $2.6 billion that can be invested in the local economy.
Source: “Portland’s Green Dividend,” Joe Cortright, CEO for Cities (2007). 24

PARADIGM SHIFT? NORWAY• Proportion of population with driving licenses by age (1991-2009)
Source: Sivak and Schoettle, 2011 http://deepblue.lib.umich.edu/bitstream/handle/2027.42/86680/102764.pdf

HAVE WE HIT PEAK TRAVEL?
• Passenger kilometers by private car & light truck 1990-2009 • (Index 1990=100)
Source: International Transport Forum 2012

Cheonggyecheon, Seoul, South Korea
PARADIGM SHIFT: TREND VS. LEAPFROGGING

WHAT WOULD A PARADIGM SHIFT LOOK LIKE?

Emission Reduction + Co-benefits
Technology Improvements
Public Transport
Non-motorizedTransport
Urbandevelopmentand transport
integration
AVOID SHIFT IMPROVE
AVOID-SHIFT-IMPROVE (ASI) APPROACH

TOWARDS A SUSTAINABLE LOW CARBON FUTURE
DEMAND
SUPPLY
Accessibility

TOWARDS A SUSTAINABLE LOW CARBON FUTURE
DEMAND Accessibility
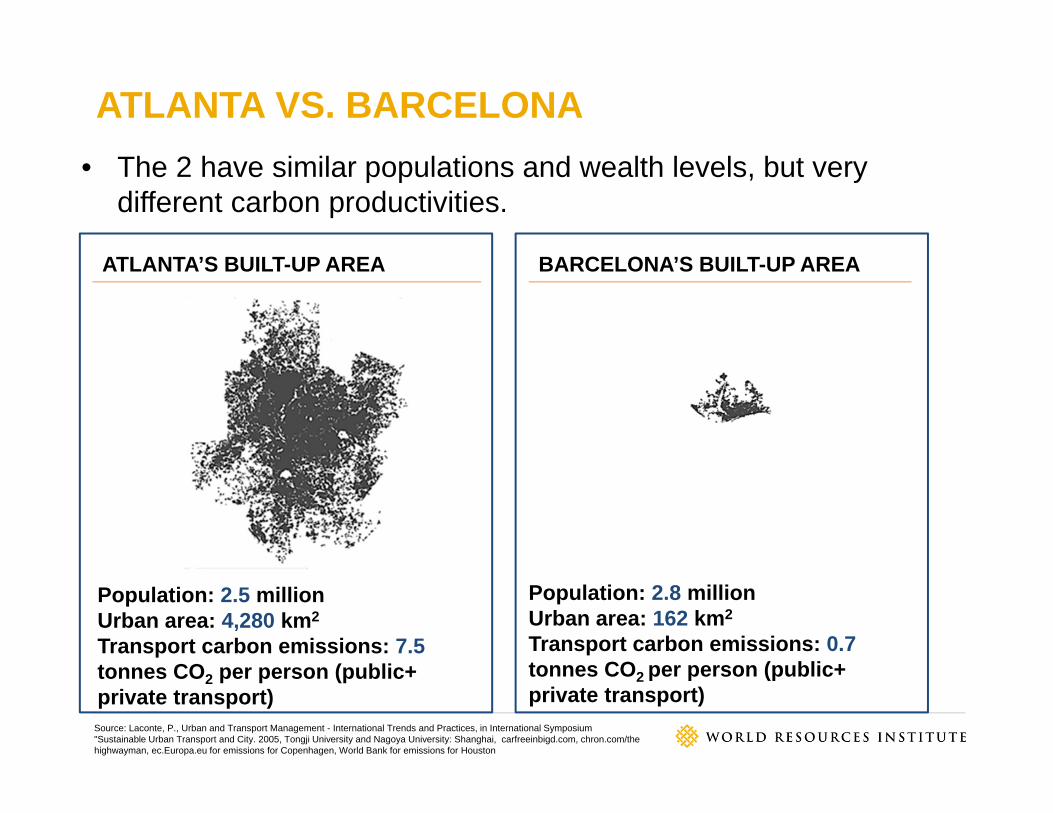
ATLANTA VS. BARCELONA• The 2 have similar populations and wealth levels, but very
different carbon productivities.
ATLANTA’S BUILT-UP AREA BARCELONA’S BUILT-UP AREA
Population: 2.5 millionUrban area: 4,280 km2
Transport carbon emissions: 7.5tonnes CO2 per person (public+ private transport)
Population: 2.8 millionUrban area: 162 km2
Transport carbon emissions: 0.7tonnes CO2 per person (public+ private transport)
Source: Laconte, P., Urban and Transport Management - International Trends and Practices, in International Symposium "Sustainable Urban Transport and City. 2005, Tongji University and Nagoya University: Shanghai, carfreeinbigd.com, chron.com/the highwayman, ec.Europa.eu for emissions for Copenhagen, World Bank for emissions for Houston

HOUSTON VS. COPENHAGEN• Contrast shows the economic benefits and cost savings from
mass transit and compactness
Source: Laconte, P., Urban and Transport Management - International Trends and Practices, in International Symposium "Sustainable Urban Transport and City. 2005, Tongji University and Nagoya University: Shanghai, carfreeinbigd.com, chron.com/the highwayman, ec.Europa.eu for emissions for Copenhagen, World Bank for emissions for Houston
Houston Copenhagen
Population density: 3,500 per sq/mi
~4% of people use public transport, 95%of trips are by car
14% of local GDP spent on transportation
Emissions per capita (tCO2e/capita): 14.1
Population density: 17,000 per sq/mi
~46% of people use public transport, cycling also common
4% of local GDP spent on transportation
Emissions per capita (tCO2e/capita): 4.7

CHOICES MATTER• Cities & countries with similar levels of GDP per capita can have
vastly different carbon emissions
0
5
10
15
20
25
30
0 20,000 40,000 60,000 80,000
Germany
HamburgUK
France
Canada
Paris
LondonNew York City
USAAustralia
Sydney
TorontoCape Town
ShanghaiSouth Africa
MexicoMexico City
São Paulo
BrazilChinaIndia
Delhi
Per C
apita
CO
2 Em
issi
ons
(tonn
es)
GDP per capita (2008 USD)

COMPACT AND CONNECTED URBAN PATHWAYS CAN GO HAND IN HAND WITH ECONOMIC GROWTH
Source: Rode, Floater et al. 2013; Floater, Rode et al. 2013, 2014.

Savings in global infrastructure spending to 2030 from more compact, connected urban
development
Source: New Climate Economy analysis.

TRANSIT ORIENTED DEVELOPMENT

COPENHAGEN’S “FINGER PLAN”

TRANSIT ORIENTED DEVELOPMENT IN KBV
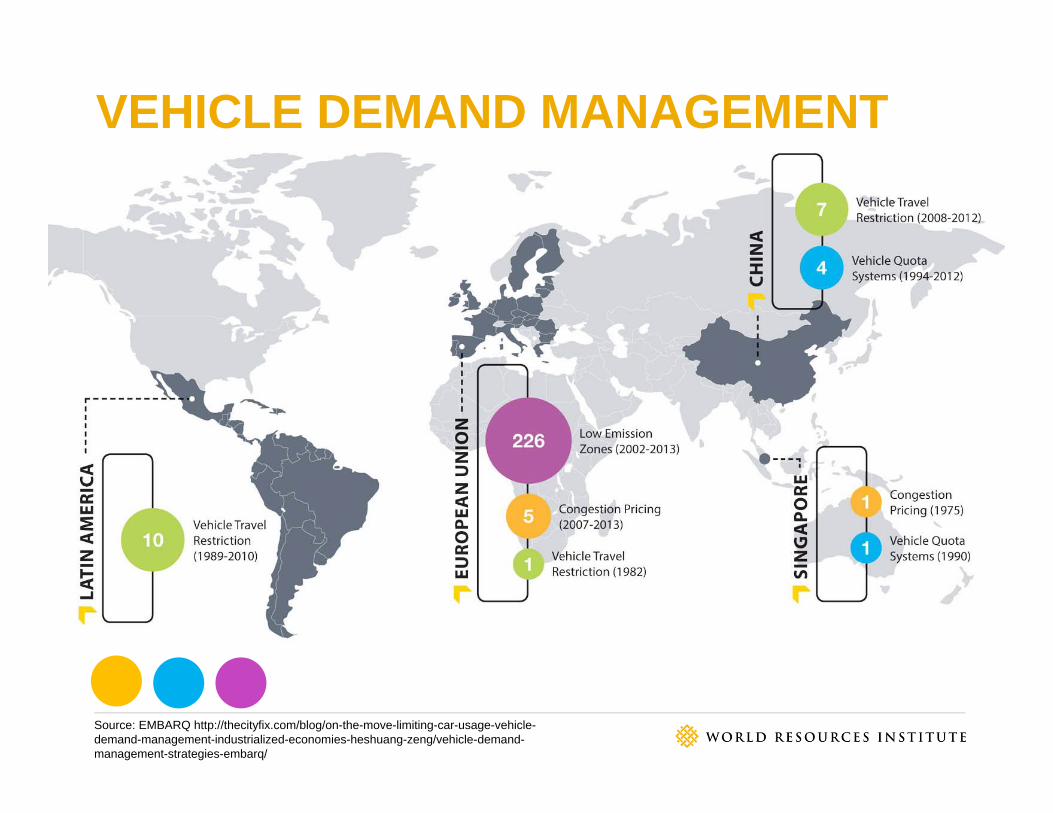
VEHICLE DEMAND MANAGEMENT
Source: EMBARQ http://thecityfix.com/blog/on-the-move-limiting-car-usage-vehicle-demand-management-industrialized-economies-heshuang-zeng/vehicle-demand-management-strategies-embarq/

LOW EMISSION ZONES
13
48
71 79
131
151
192
226
0
50
100
150
200
250
2006 2007 2008 2009 2010 2011 2012 2013
# of
LEZ
Citi
es in
EU
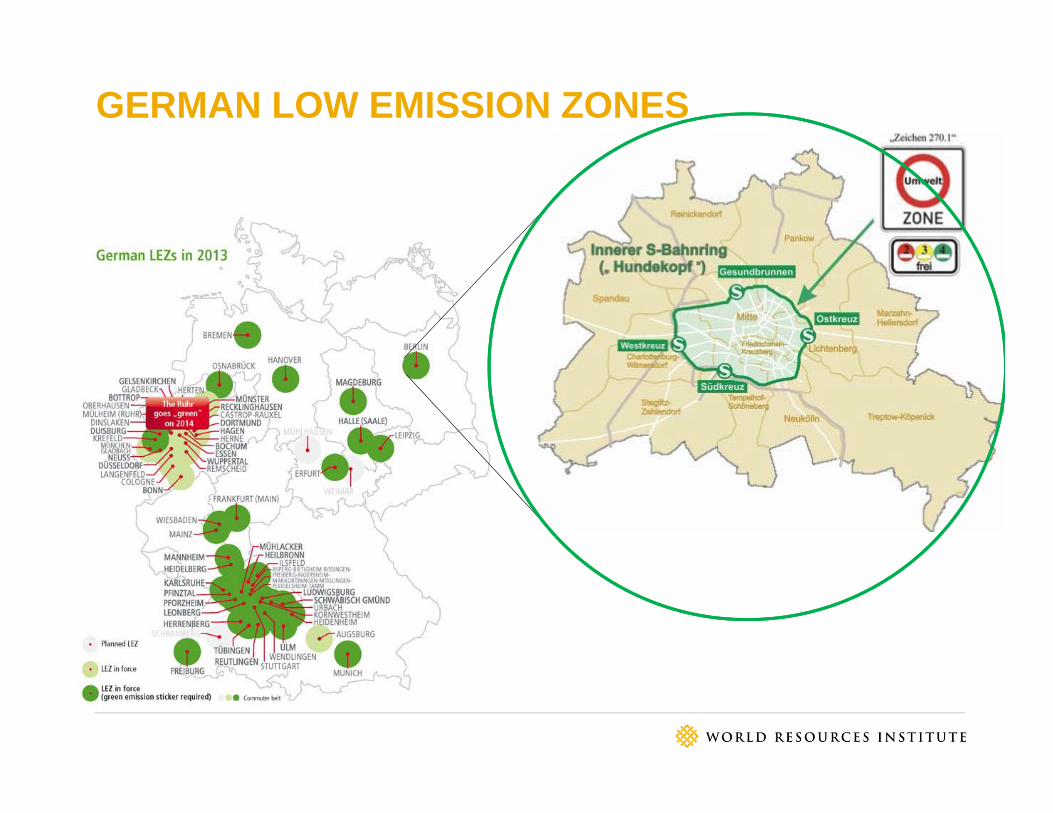
GERMAN LOW EMISSION ZONES

CONGESTION PRICING
Year
LONDON STOCKHOLM
TOWARDS A SUSTAINABLE LOW CARBON FUTURE
SUPPLY Accessibility

NEW TRENDS ON THE RISE
Source: EMBARQ; http://thecityfix.com/blog/on-the-move-advancing-sustainable-transport-getting-from-here-to-there-holger-dalkmann/

HIGH LEVEL OF SERVICE BUSES IN EUROPE
Source: (Finn et. al, 2011)
Cambridge, UK

BRT AND BUSWAY SYSTEMS IN THE WORLD
Source: EMBARQ, 2011
Planned / in construction(82 cities)
In expansion(23 cities)
In operation(163 cities)

BRT GROWTH IN EUROPE
Source: BRTdata.org
0
10
20
30
40
50
60
70
0
1
2
3
4
5
6
7
8
Cumulative System
Total
New
BRT
Systems
New Systems Cumulative Total

KEY BHLS COMPONENTS
Running ways
Stations
Vehicles
Intelligent Transportation Systems (ITS), operation
management tools
Identity of the BHLS scheme
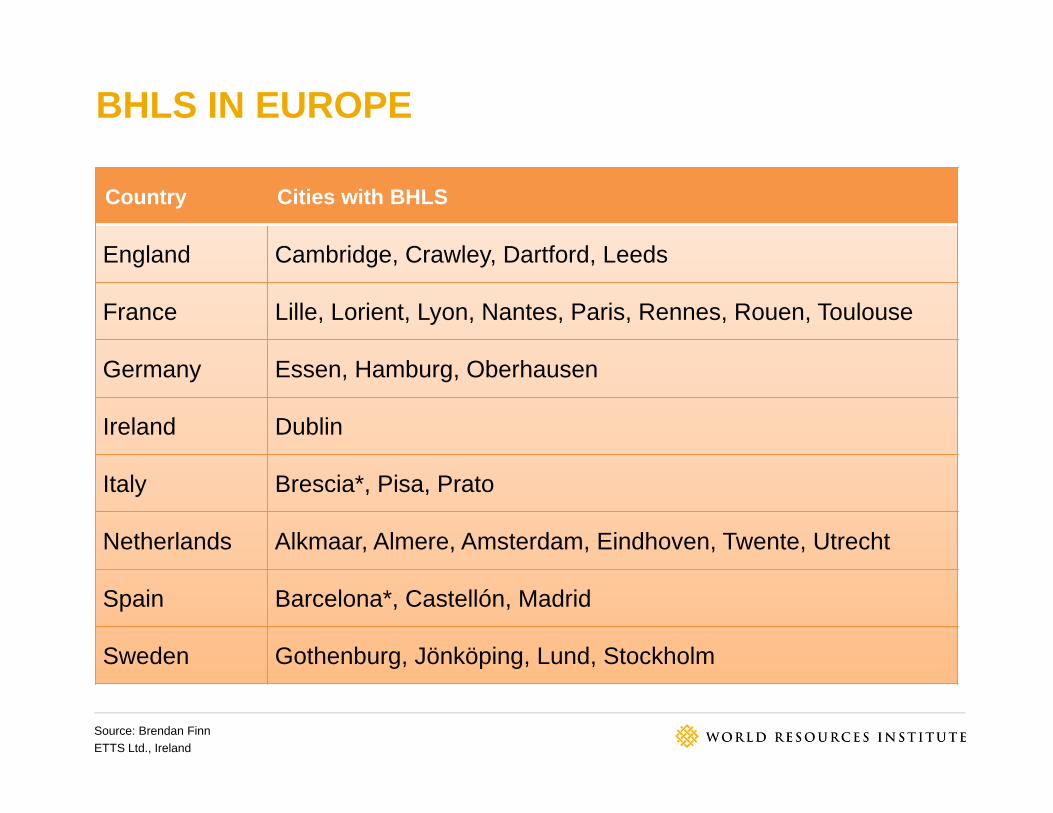
BHLS IN EUROPE
Country Cities with BHLS
England Cambridge, Crawley, Dartford, Leeds
France Lille, Lorient, Lyon, Nantes, Paris, Rennes, Rouen, Toulouse
Germany Essen, Hamburg, Oberhausen
Ireland Dublin
Italy Brescia*, Pisa, Prato
Netherlands Alkmaar, Almere, Amsterdam, Eindhoven, Twente, Utrecht
Spain Barcelona*, Castellón, Madrid
Sweden Gothenburg, Jönköping, Lund, Stockholm
Source: Brendan FinnETTS Ltd., Ireland

GLOBAL GROWTH OF CAR SHARE 2000-2012

CAR SHARING• For every shared car, there are 15 fewer owned cars on
the road. (Source: Zipcar)
Source: http://futureofcarsharing.com/

GLOBAL GROWTH OF BIKE-SHARE 2000-2013
Source: Peter Midgely and EMBARQ

BIKE SHARING IN LONDON & MADRID
Photo source: Flickr user shaggy359,
LONDON MADRID

BIKE SHARING SUCCESS FACTORS• Go Big or Go Home
Create a big, dense system with broad coverage or it won’t get used.
• You Get What You Pay ForQuality of infrastructure can make or break a system
• Merge the FinancialsMake the case for subsidies
• Evolve or DisappearEvolving payment systems that work for the new technology
• Connect Across BordersWork with established international service providers with experience

TOWARDS A SUSTAINABLE LOW CARBON FUTURE – INTEGRATION & DISRUPTION
DEMAND
SUPPLY
DISRUPTIVE SOLUTIONS
?
ACCESSIBILITY

INTEGRATED SOLUTIONS

BLURRING LINES BETWEEN PUBLIC & PRIVATE

HELSINKI RIDESHARING: KUTSUPLUS & AJELO

RIDESHARING: UBER, LYFT, SIDECAR…

BIG DATA SOLUTIONS
• Real-time traffic and transport data through bus location devices, cell phone data tracking, and crowd-sourced information platforms, like Waze

OPEN SOURCE DATA APPLICATIONS
Within 1 hour: Real-time bus locations on Google Earth
Within 1 week: Desktop widget with transit countdown information
Within 5 weeks: iPhone and Andriod transit tracking & planning apps
• Open source transit data can enable live trip planning tools and other new innovations
• When Boston’s transit authority opened its data in 2009, the results were immediate:

DISRUPTING THE 9-5
• Alternatives to working one 9-5 job for one employer

TELEWORKING

ONLINE SHOPPING & DELIVERY SERVICES

Open Data
Bike Sharing
Car Sharing
CONVENTIONAL SOLUTIONS& INNOVATIVE DISRUPTIONS
Biking Metro
Buses
Walking

5 ELEMENTS FOR TOWARDS A TRANSPORTWENDE
Political Will – Leadership and Community SupportFinance – Sustainable investment in Infrastructure and OperationsIntegrated Planning – Land-use and Sustainable MobilityEnable entrepreneurial environment for disruptive solutionsTechnology as enabler to better cleaner vehicles & integrated (disruptive) solutions