Embed Size (px)
Citation preview
Naviance Test Prep
Where Counseling Meets the Classroom
Rob Spackey, Product Marketing Manager Srikar Dronam, Product Manager
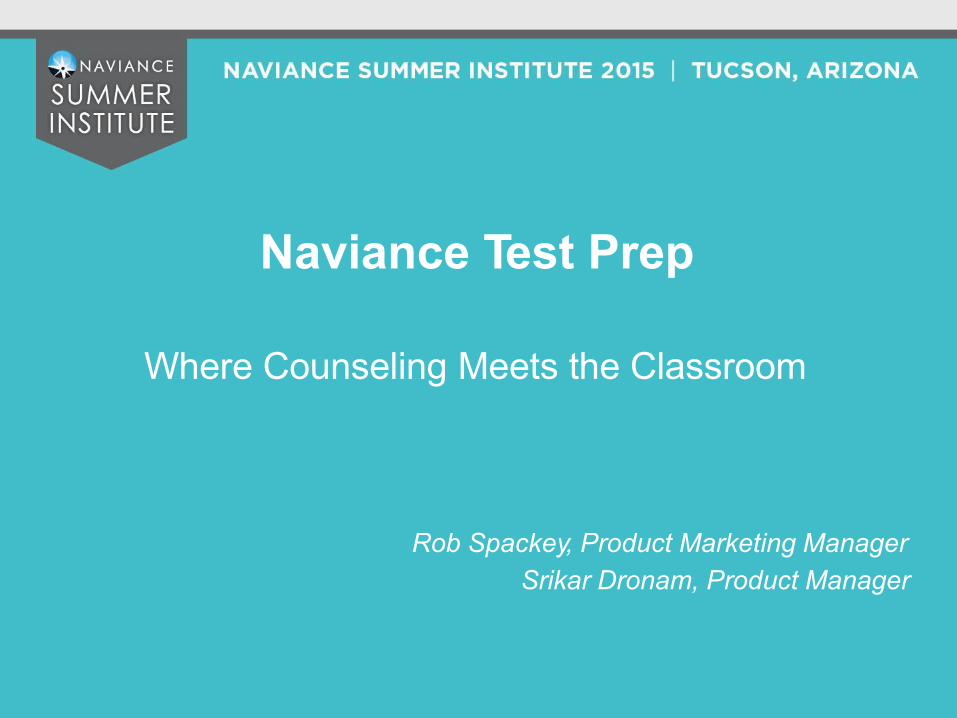
Current Landscape
Percentage of students who meet SAT benchmarks
43%
Source: College Board
Students are missing the mark on standardized tests
…and may be missing opportunities
Scholarships & Financial Aid
Credit for College Coursework
Expanded College Options
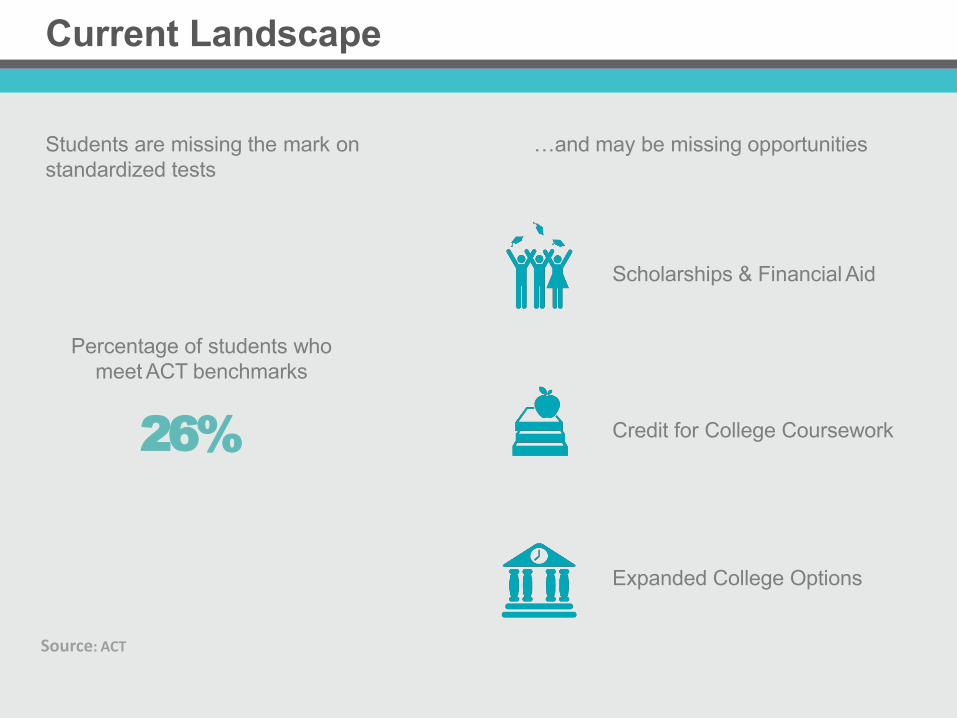
Current Landscape
Percentage of students who meet ACT benchmarks
26%
Source: ACT
Students are missing the mark on standardized tests
…and may be missing opportunities
Scholarships & Financial Aid
Credit for College Coursework
Expanded College Options

Current Landscape
Percentage of students who meet ACT benchmarks
20%
Students are missing the mark on standardized tests
Source: College Board
…and may be missing opportunities
Scholarships & Financial Aid
Credit for College Coursework
Expanded College Options
Foundations of Naviance Test Prep
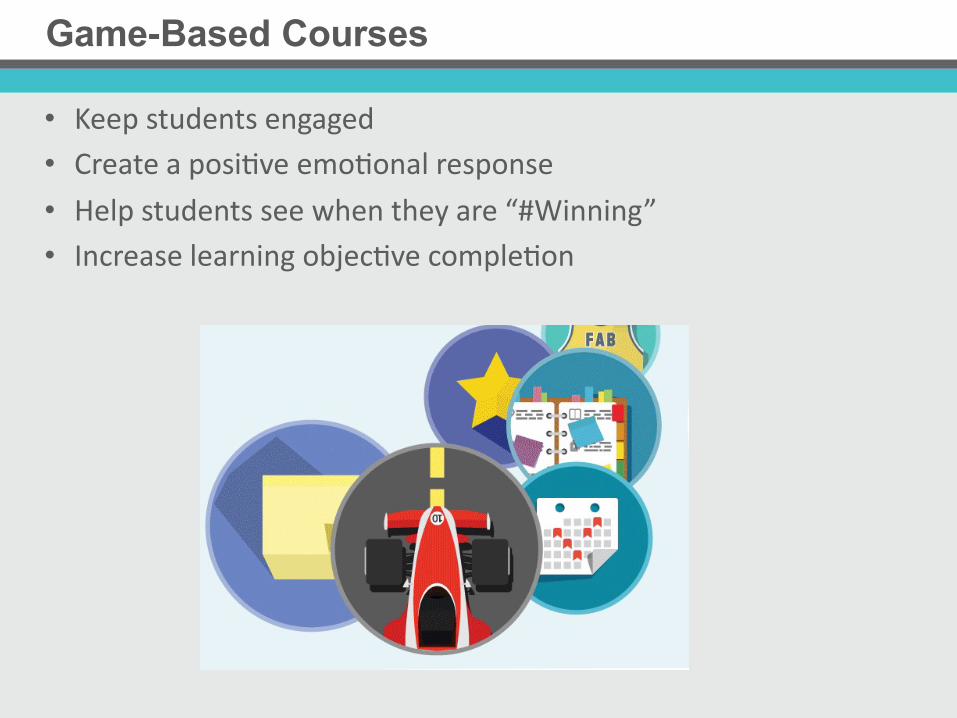
Game-Based Courses
• Keep students engaged • Create a posi0ve emo0onal response • Help students see when they are “#Winning” • Increase learning objec0ve comple0on
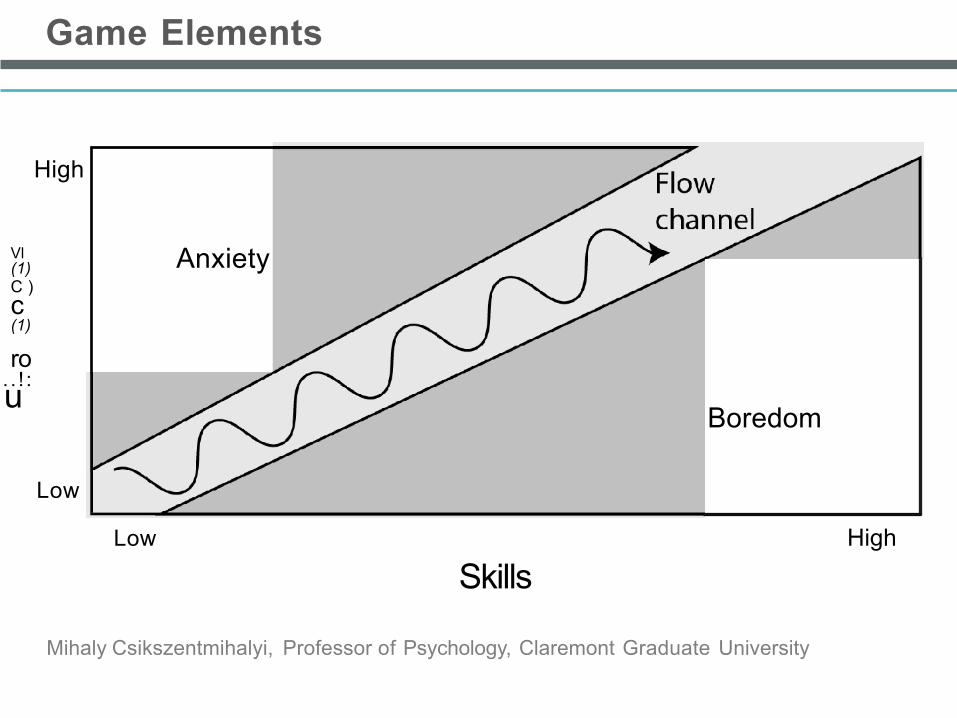
Game Elements
Mihaly Csikszentmihalyi, Professor of Psychology, Claremont Graduate University
High
Vl (1) C ) c (1)
ro . . ! : u
Low
Anxiety
Boredom
Low High
Skills
Game Elements
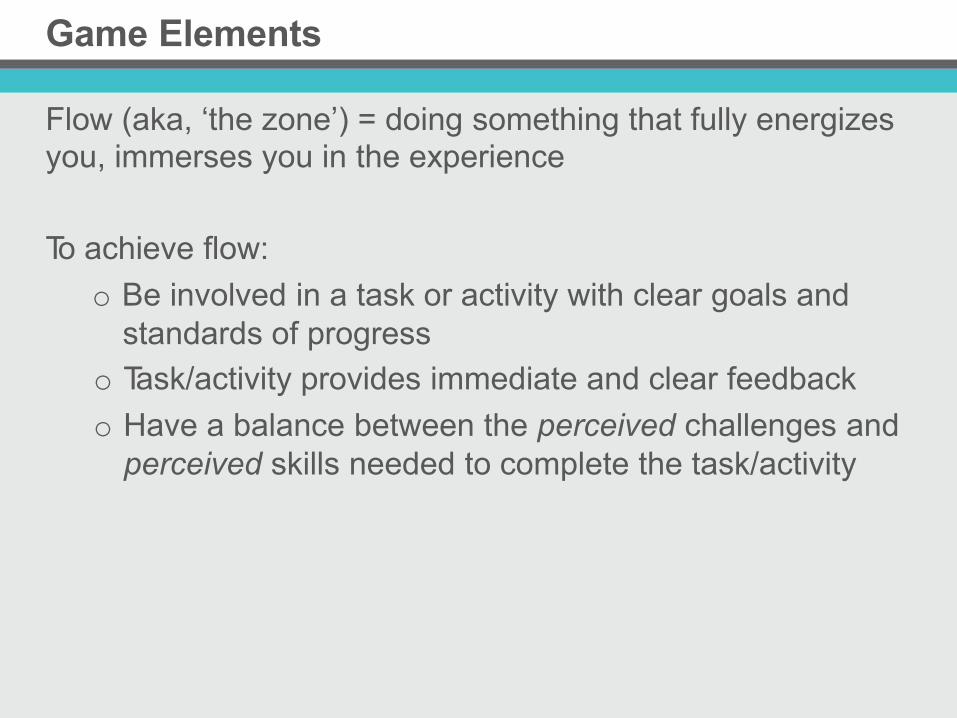
Flow (aka, ‘the zone’) = doing something that fully energizes you, immerses you in the experience
To achieve flow:
o Be involved in a task or activity with clear goals and standards of progress
o Task/activity provides immediate and clear feedback
o Have a balance between the perceived challenges and perceived skills needed to complete the task/activity
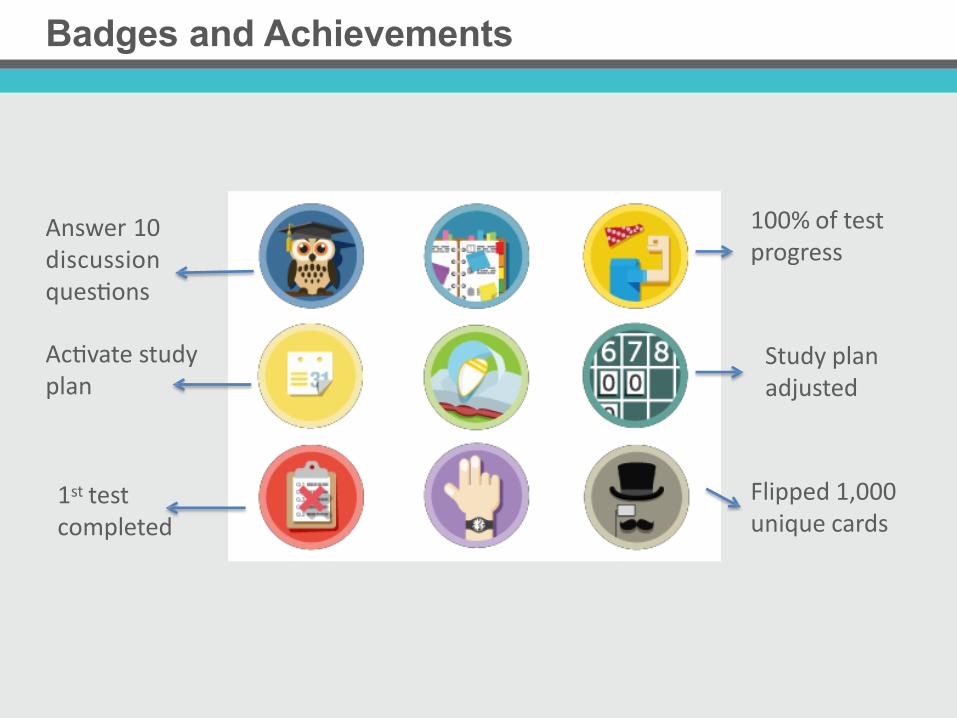
Badges and Achievements
Answer 10 discussion ques0ons
Ac0vate study plan
1st test completed
100% of test progress
Study plan adjusted
Flipped 1,000 unique cards
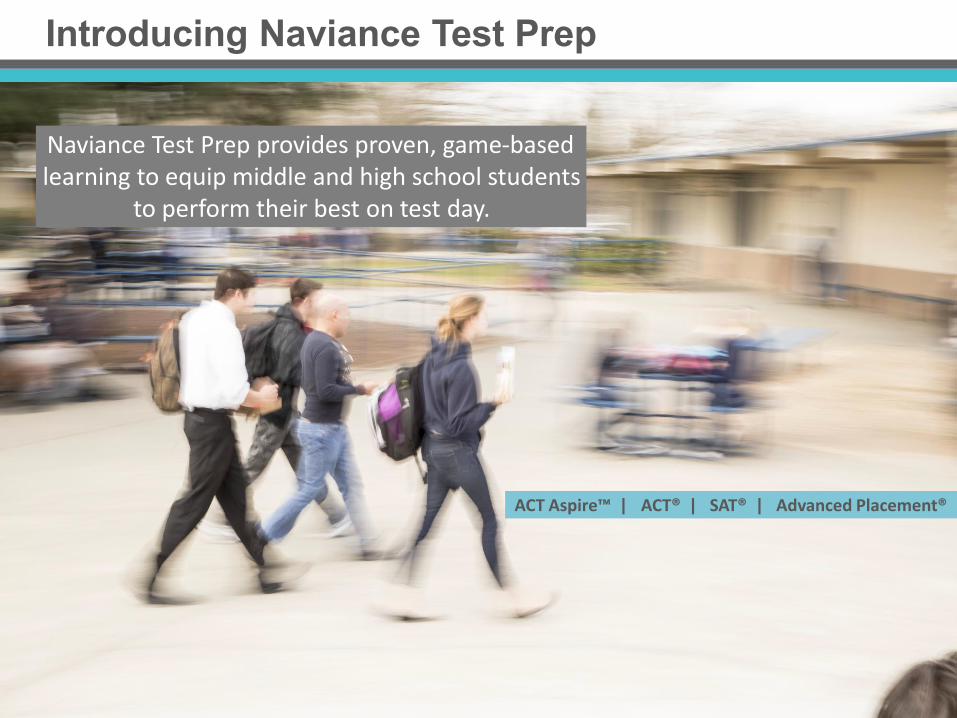
Introducing Naviance Test Prep
Naviance Test Prep provides proven, game-‐based learning to equip middle and high school students
to perform their best on test day.
ACT Aspire™ | ACT® | SAT® | Advanced Placement®
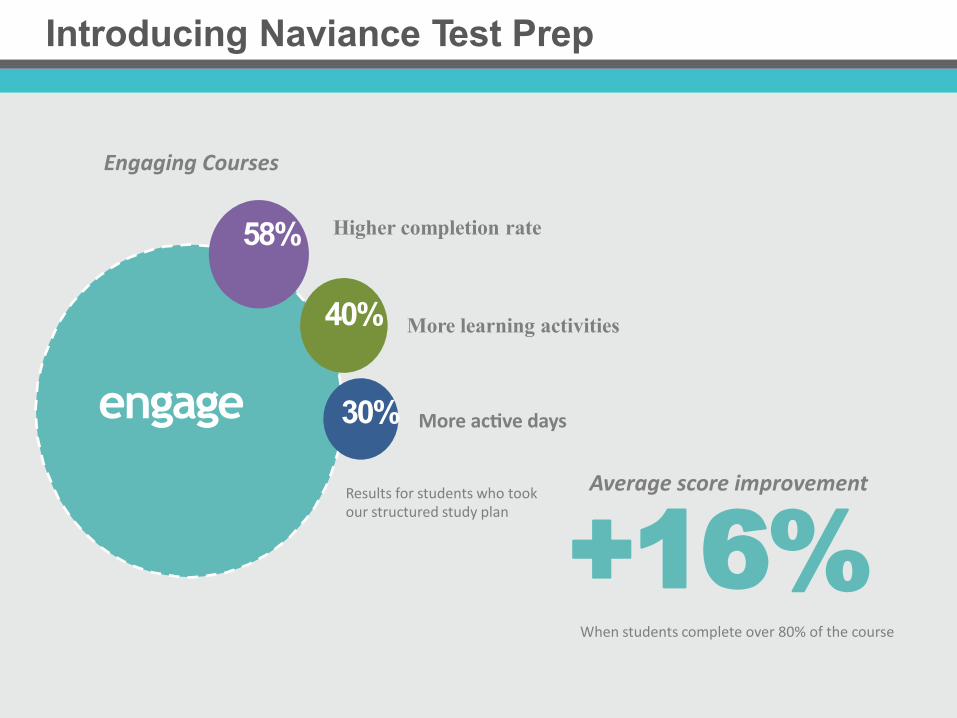
Introducing Naviance Test Prep
engage
58%
40%
30% More ac=ve days
Higher completion rate
More learning activities
Average score improvement
+16% When students complete over 80% of the course
Engaging Courses
Results for students who took our structured study plan
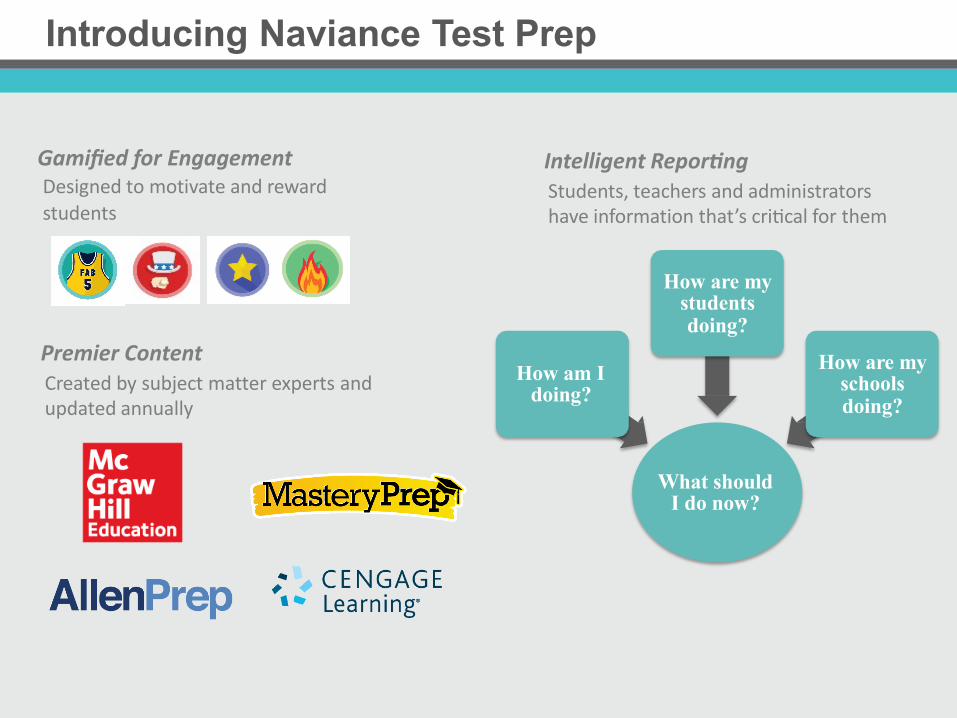
Introducing Naviance Test Prep
What should I do now?
How am I doing?
Premier Content Created by subject matter experts and updated annually
Intelligent Repor7ng Students, teachers and administrators have information that’s cri0cal for them
How are my students doing?
How are my schools doing?
Gamified for Engagement Designed to motivate and reward students
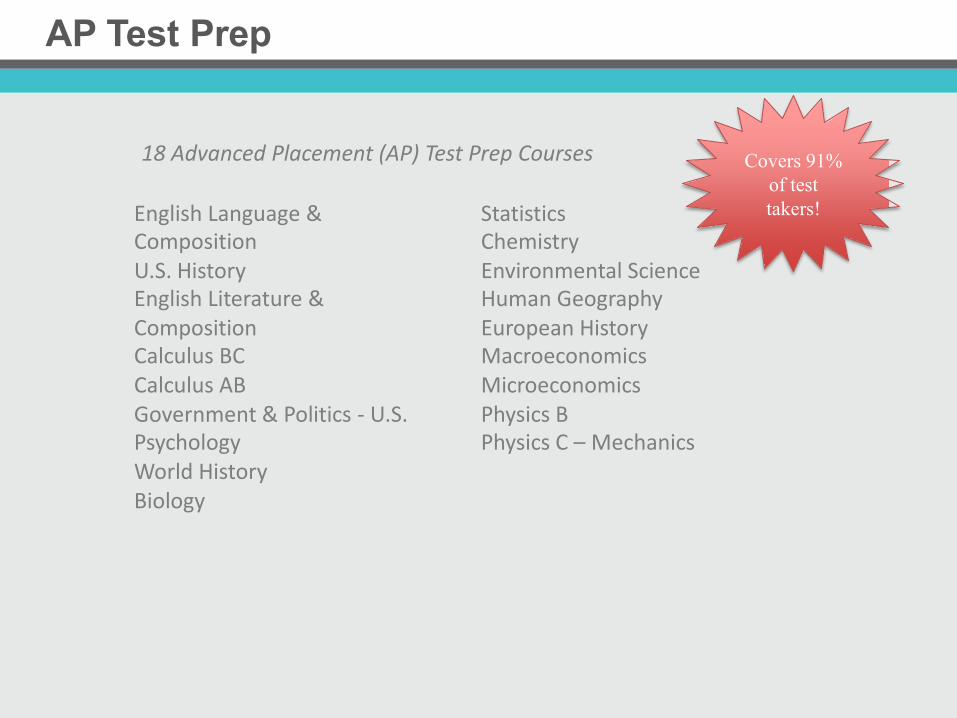
AP Test Prep
18 Advanced Placement (AP) Test Prep Courses
English Language & Composition U.S. History English Literature & Composition Calculus BC Calculus AB Government & Politics -‐ U.S. Psychology World History Biology
Statistics Chemistry Environmental Science Human Geography European History Macroeconomics Microeconomics Physics B Physics C – Mechanics
Covers 91% of test takers!
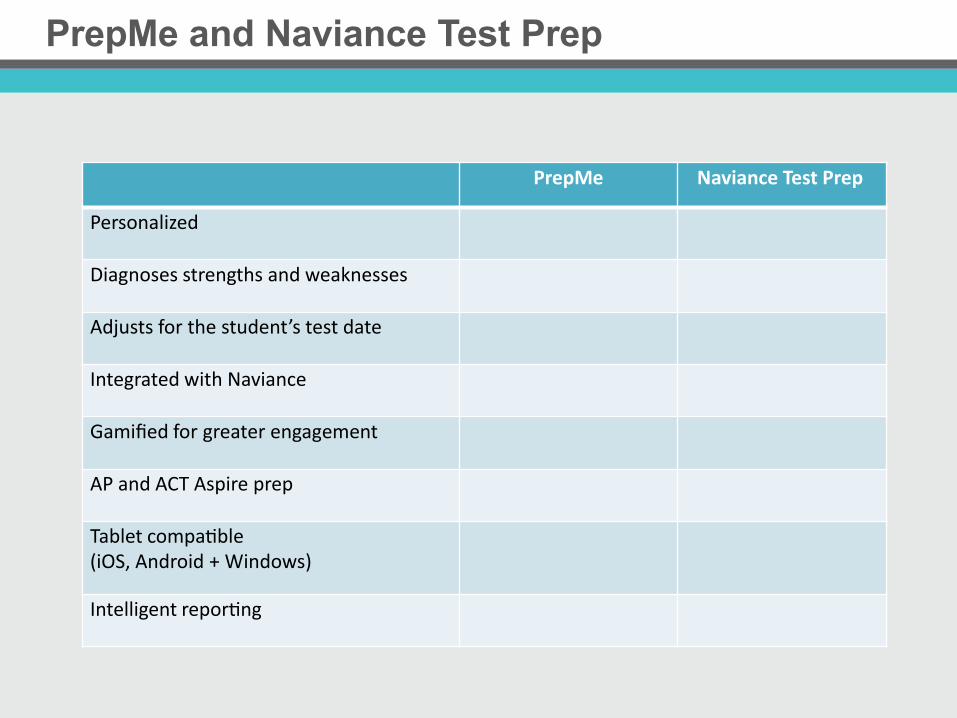
PrepMe and Naviance Test Prep
PrepMe Naviance Test Prep
Personalized
Diagnoses strengths and weaknesses
Adjusts for the student’s test date
Integrated with Naviance
Gamified for greater engagement
AP and ACT Aspire prep
Tablet compa0ble (iOS, Android + Windows)
Intelligent repor0ng
Results for Students
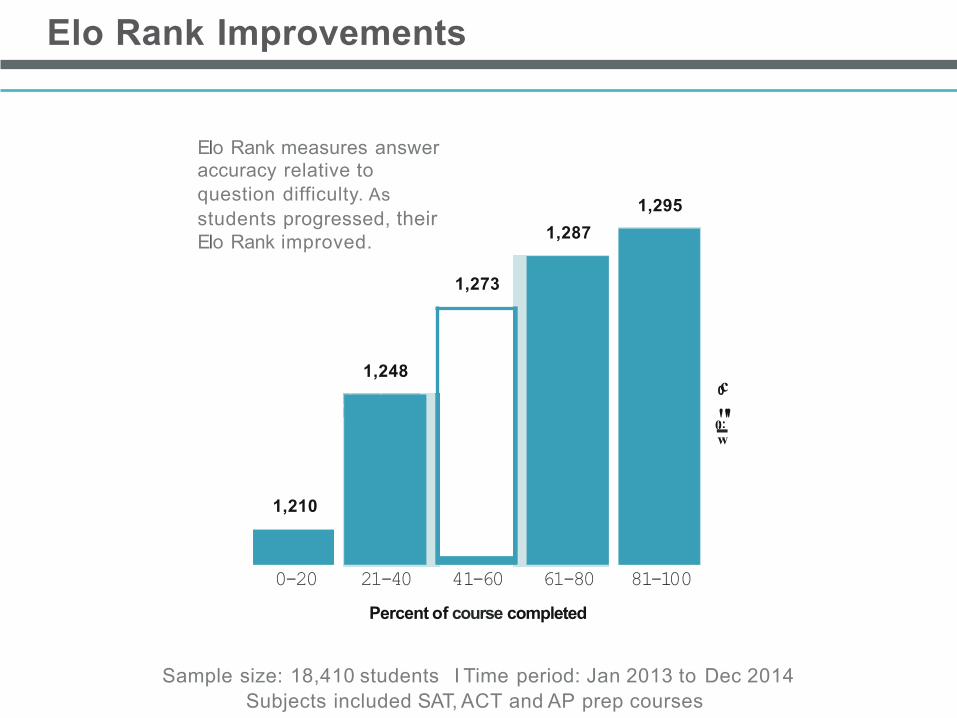
Elo Rank Improvements
Elo Rank measures answer accuracy relative to question difficulty. As students progressed, their Elo Rank improved. 1,287
1,273
1,248
1,210
0-20 21-40 41 -60 61-80
Percent of course completed
1,295
81-100
c 0
"::' -0 w
Sample size: 18,410 students I Time period: Jan 2013 to Dec 2014 Subjects included SAT, ACT and AP prep courses
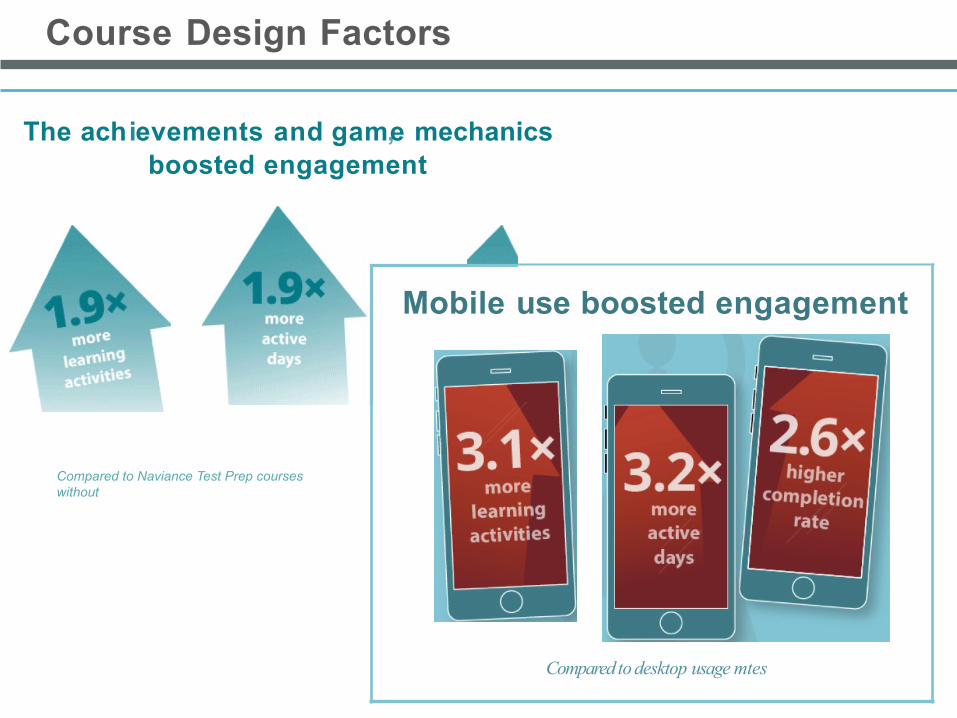
Course Design Factors
The achievements and gam,e mechanics boosted engagement
Mobile use boosted engagement
Compared to Naviance Test Prep courses without
Compared to desktop usage mtes
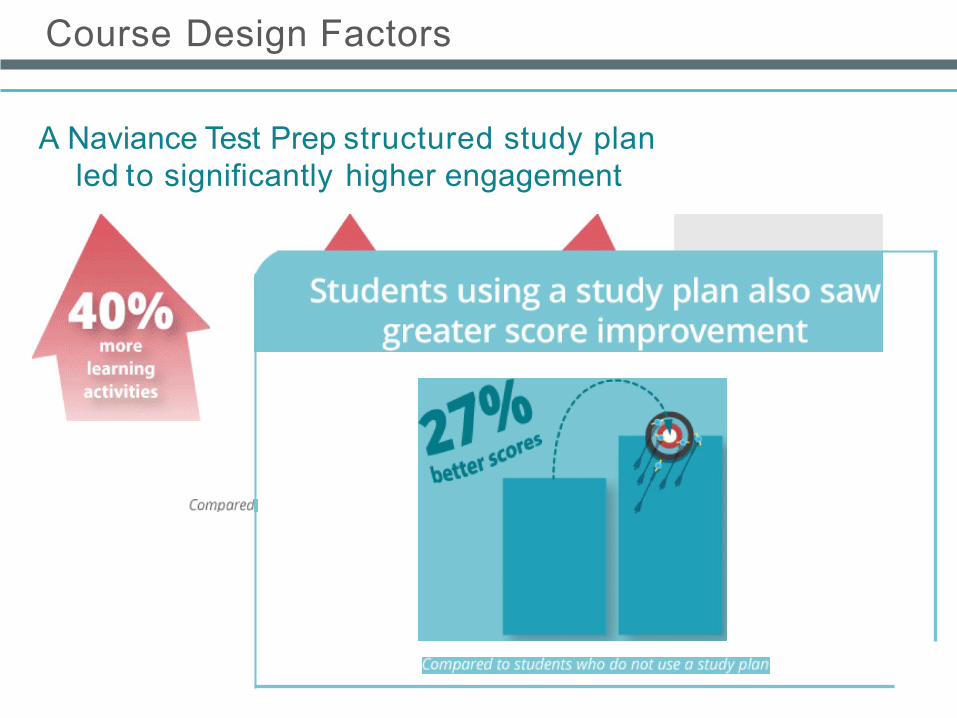
Course Design Factors
A Naviance Test Prep structured study plan led to significantly higher engagement
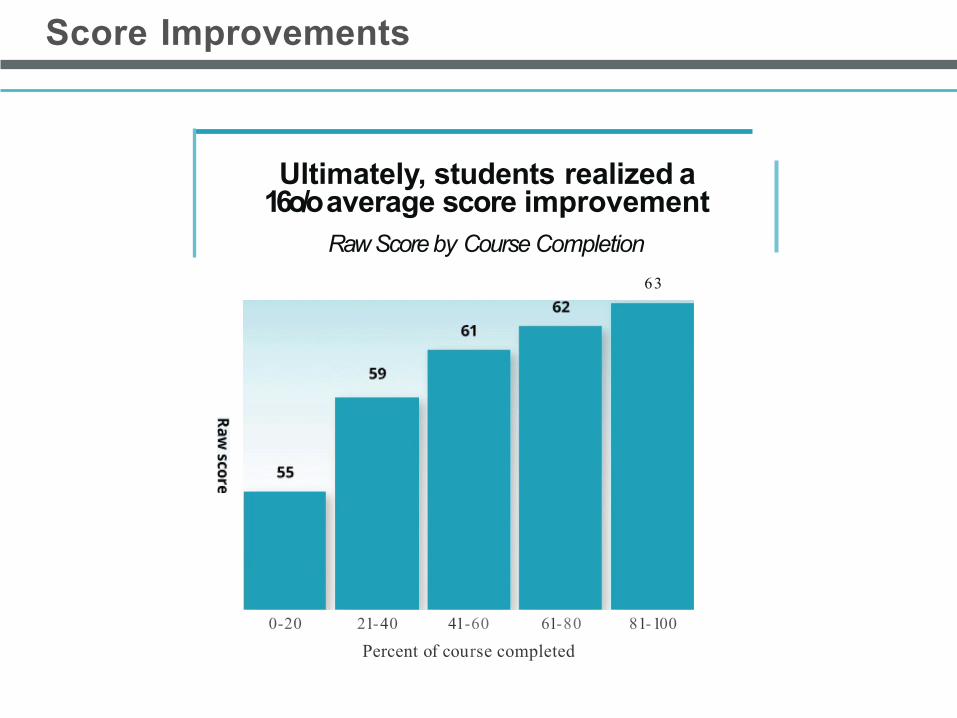
Score Improvements
Ultimately, students realized a 16o/o average score improvement
Raw Score by Course Completion 63
0-20 21-40 41-60 61-80
Percent of course completed 81-100
Live Demo
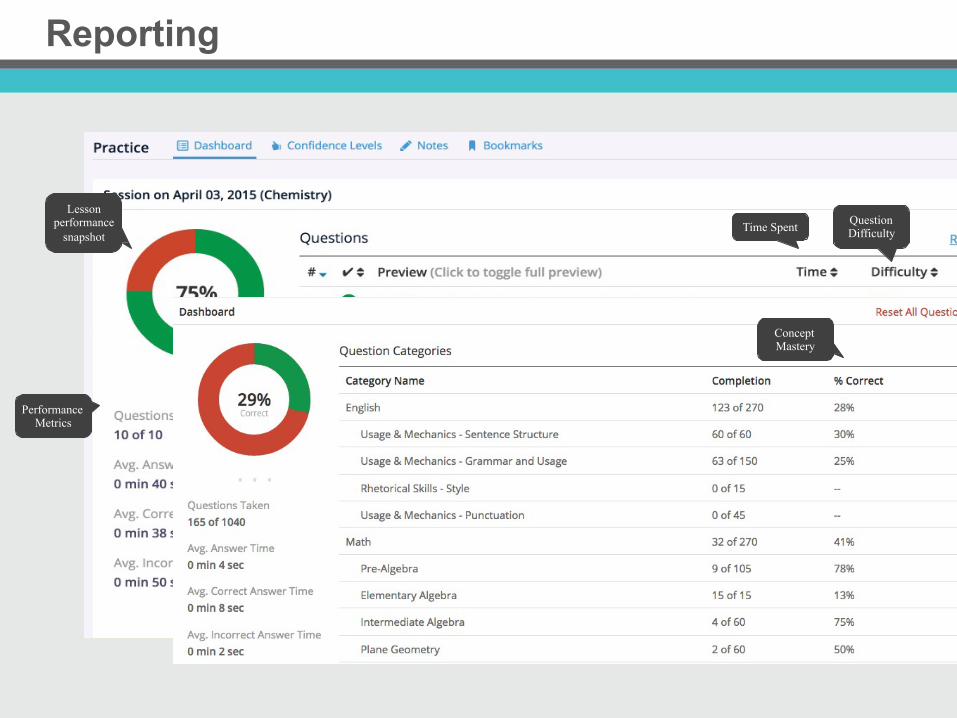
Reporting
Lesson performance
snapshot Question Difficulty Time Spent
Concept Mastery
Performance Metrics
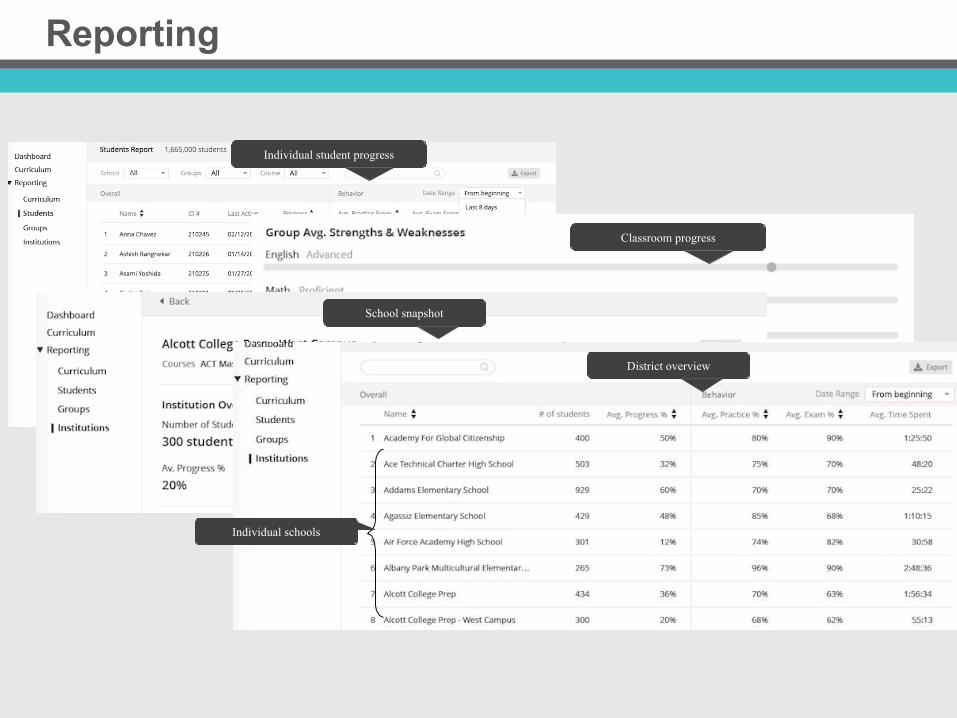
Reporting
Individual student progress
Classroom progress
School snapshot
District overview
Individual schools

Questions?