Embed Size (px)
Citation preview
Skills in Social Studies
The Multi-Line Graph
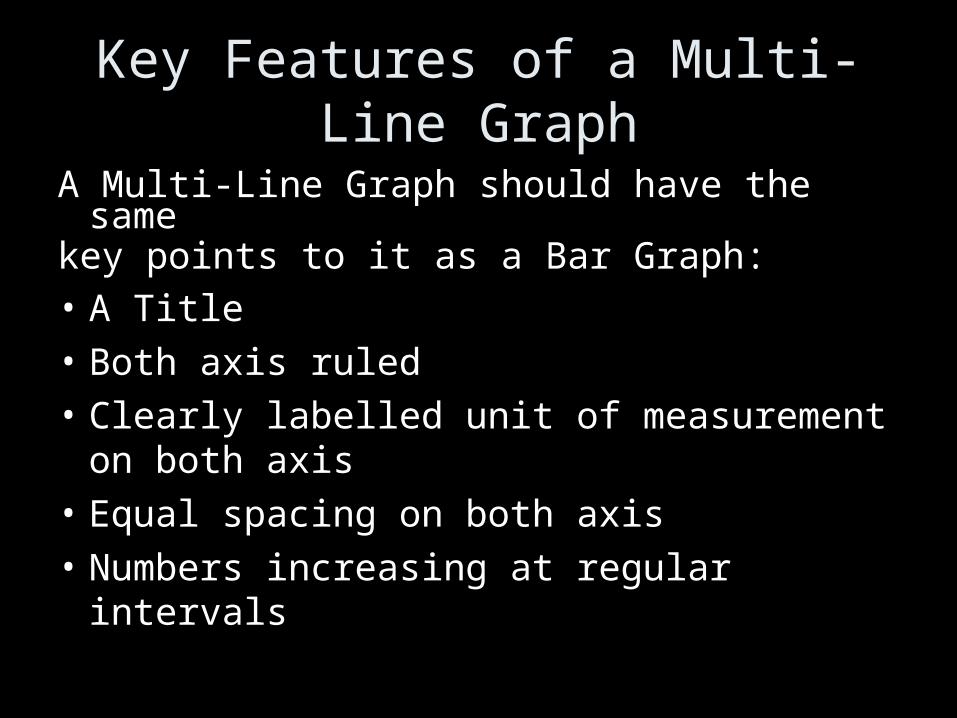
Key Features of a Multi-Line Graph
A Multi-Line Graph should have the samekey points to it as a Bar Graph:• A Title• Both axis ruled• Clearly labelled unit of measurement on
both axis• Equal spacing on both axis• Numbers increasing at regular intervals
Key Features of a Multi-Line Graph
A Multi-Line Graph should have the same key points to it as a Bar Graph:
• The only main difference is that the horizontal labels should be on the point instead of in between the points
• And it needs a key
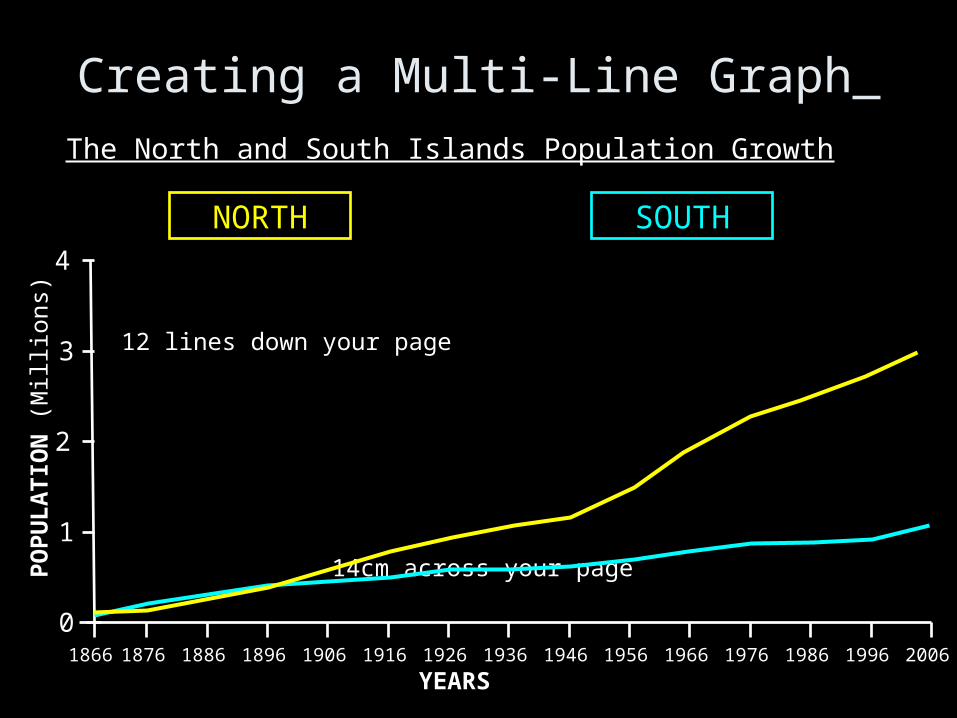
Creating a Multi-Line Graph The North and South Islands Population Growth
4
1
3
2
0
POPU
LATI
ON
(Mill
ions
)
1866 1876 1886 1896 1906 1916 1926 1936 1946 197619661956 2006YEARS
1986 1996
12 lines down your page
14cm across your page
NORTH SOUTH
Compare North Island vs South Island
• Now you have completed your graph I want you to write 1 sentence describing what your graph is showing.
• e.g. The above Multi-line graph is showing us that . . .
Create your own Multi-Line Graph
• Use the following figures to create your own line graph.
• Remember the Key Features of a Multi-Line Graph.
• Complete graph and then put your hand up so I can check your graph.
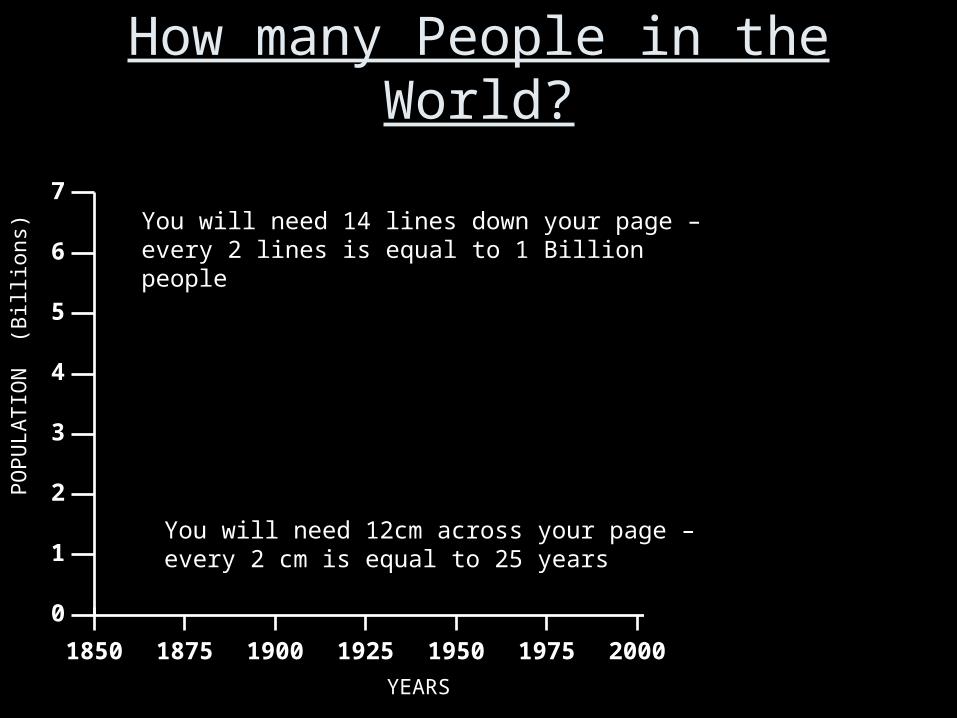
How many People in the World?
1850 1875 1900 1925 1950 1975 2000YEARS
0
1
2
3
4
5
6
7
PO
PU
LATI
ON
(B
illio
ns)
You will need 14 lines down your page – every 2 lines is equal to 1 Billion people
You will need 12cm across your page – every 2 cm is equal to 25 years
How many People in the World?
1850 1875 1900 1925 1950 1975 2000YEARS
0
1
2
3
4
5
6
7
PO
PU
LATI
ON
(B
illio
ns)
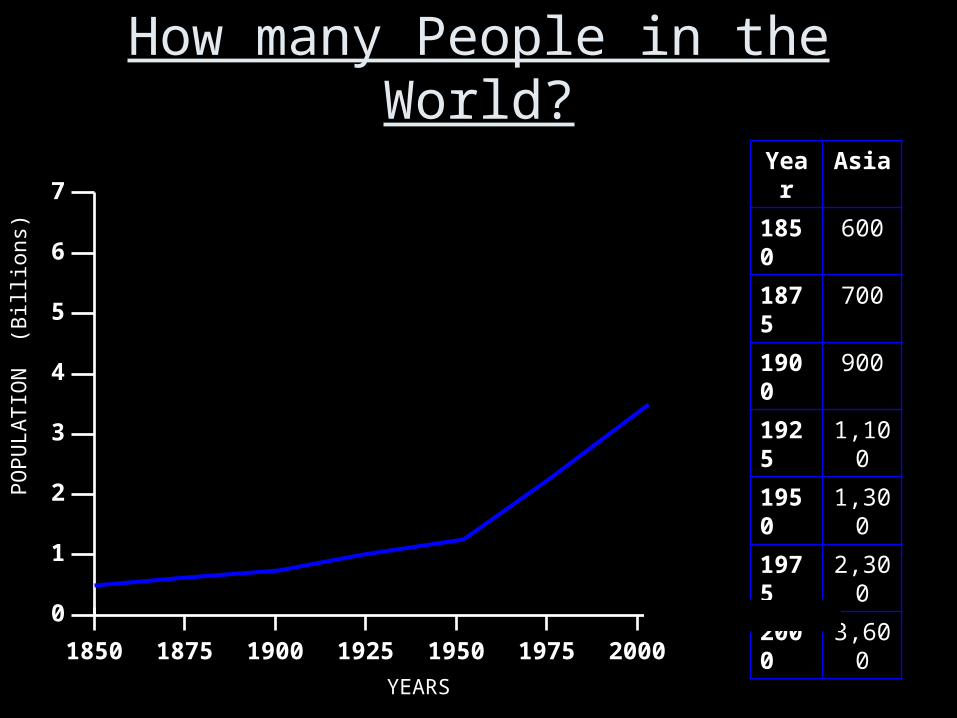
Year Asia1850 600
1875 700
1900 900
1925 1,100
1950 1,300
1975 2,300
2000 3,600
How many People in the World?
1850 1875 1900 1925 1950 1975 2000YEARS
0
1
2
3
4
5
6
7
PO
PU
LATI
ON
(B
illio
ns)
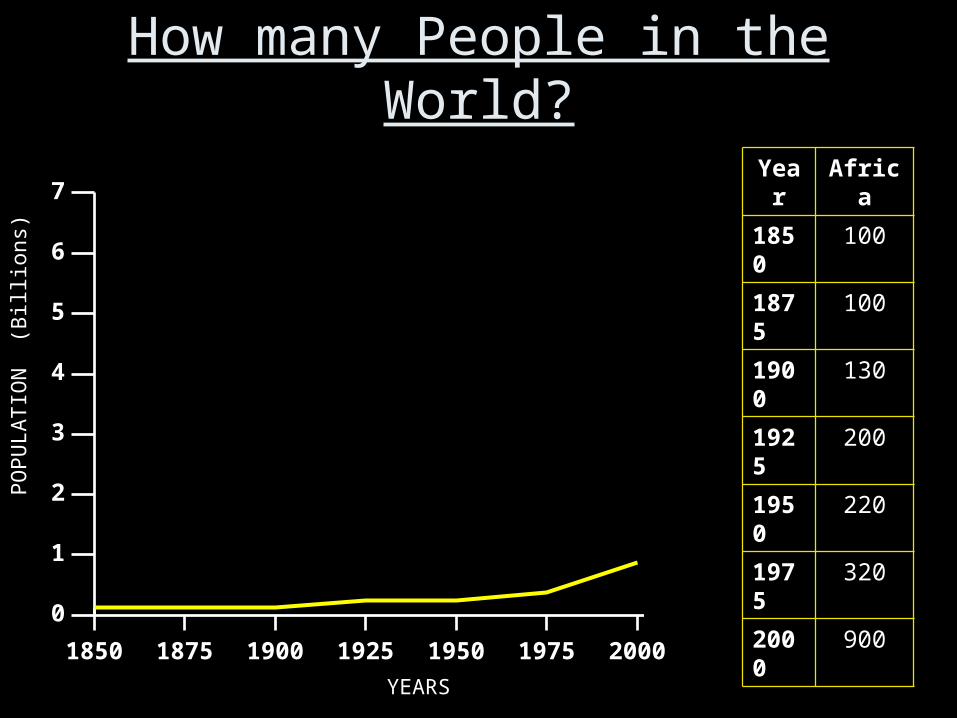
Year Africa1850 100
1875 100
1900 130
1925 200
1950 220
1975 320
2000 900
How many People in the World?
1850 1875 1900 1925 1950 1975 2000YEARS
0
1
2
3
4
5
6
7
PO
PU
LATI
ON
(B
illio
ns)
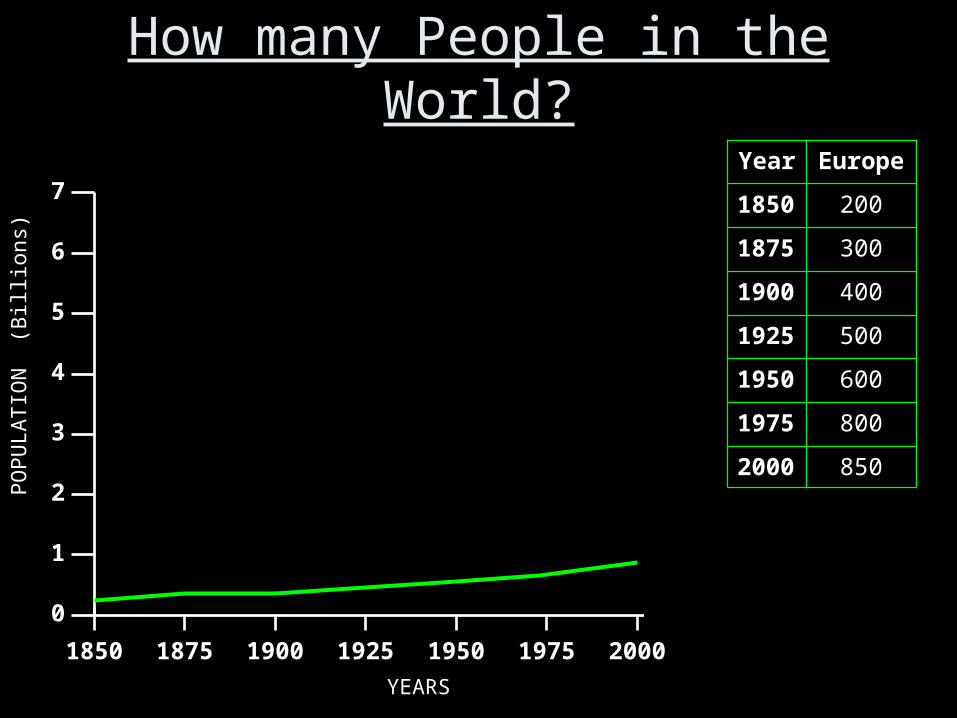
Year Europe
1850 200
1875 300
1900 400
1925 500
1950 600
1975 800
2000 850
How many People in the World?
1850 1875 1900 1925 1950 1975 2000YEARS
0
1
2
3
4
5
6
7
PO
PU
LATI
ON
(B
illio
ns)
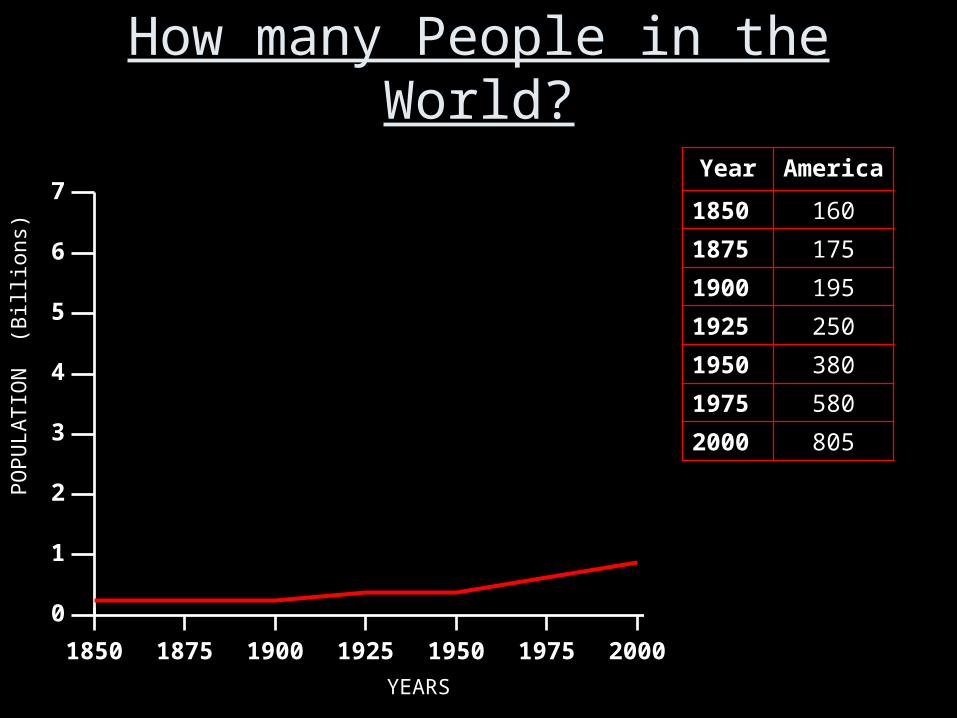
Year America1850 160
1875 175
1900 195
1925 250
1950 380
1975 580
2000 805
How many People in the World?
1850 1875 1900 1925 1950 1975 2000YEARS
0
1
2
3
4
5
6
7
PO
PU
LATI
ON
(B
illio
ns)
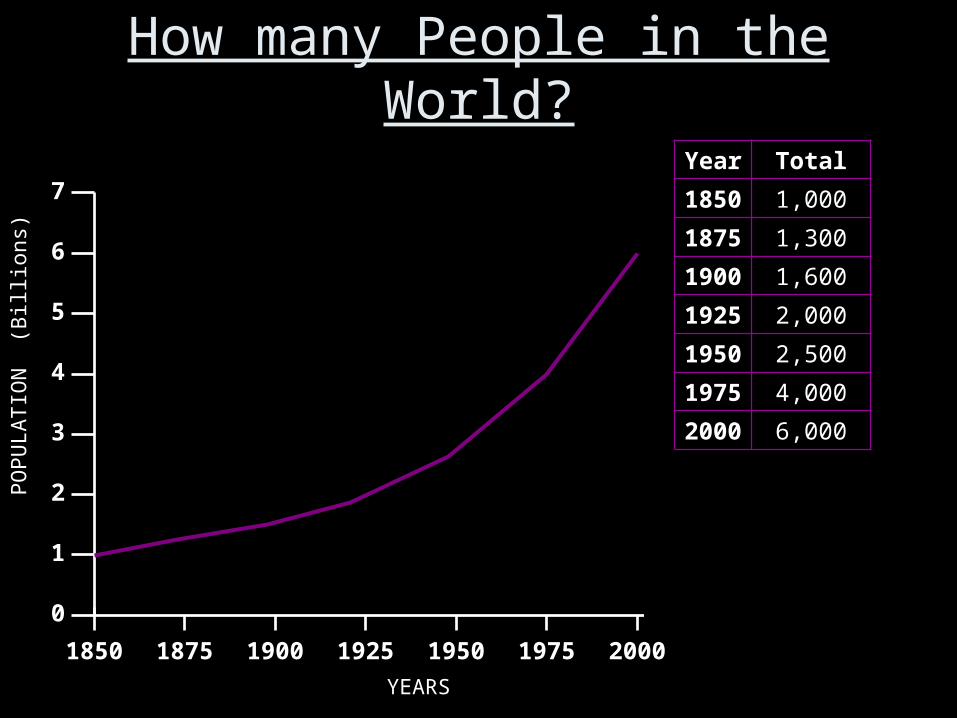
Year Total1850 1,000
1875 1,300
1900 1,600
1925 2,000
1950 2,500
1975 4,000
2000 6,000
How many People in the World?
1850 1875 1900 1925 1950 1975 2000YEARS
0
1
2
3
4
5
6
7
PO
PU
LATI
ON
(B
illio
ns)
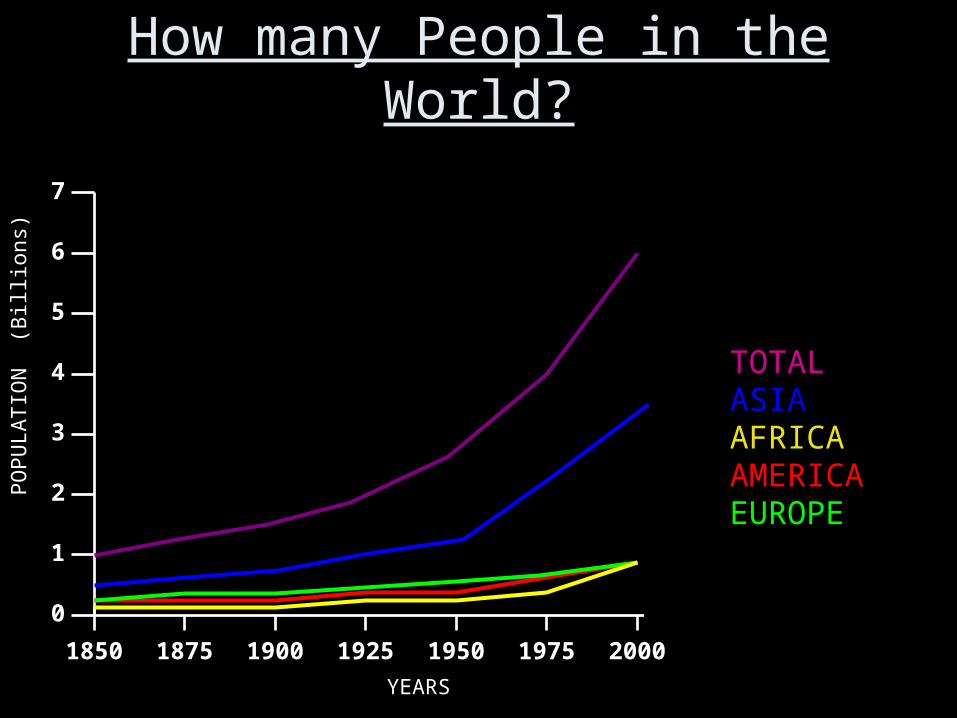
ASIAAFRICA
EUROPEAMERICA
TOTAL
World Population Growth
• Now you have completed your graph I want you to write 2-3 sentences describing what your graph is showing.
• e.g. The above multi-line graph is showing us . . .

THE END
Key Features of a Line Graph
DNOSJ AJMAMFJ


![Deep Multi-Graph Clustering via Attentive Cross-Graph ...personal.psu.edu/dul262/dmgc.pdf · and pertinent AI techniques [8], and propose a novel algorithm DMGC, (Deep Multi-Graph](https://img.pdfslide.us/doc/110x75/5e82748c3cf010488909578b/deep-multi-graph-clustering-via-attentive-cross-graph-and-pertinent-ai-techniques.jpg)

![Deep Multi-Graph Clustering via Attentive Cross-Graph ...faculty.ist.psu.edu/xzz89/publications/wsdm20_dmgc.pdfto multi-graph setting, including the ranking problem [32], net-work](https://img.pdfslide.us/doc/110x75/5e8272c847d41d2fdd019999/deep-multi-graph-clustering-via-attentive-cross-graph-to-multi-graph-setting.jpg)