Embed Size (px)
Citation preview

Create Tab:- Reports(MS ACCESS)
NAME :- YOGESH SINGH BANESHIEMAIL ID :- [email protected] :- http://yogeshbaneshi.blogspot.in/FACEBOOK :- https://www.facebook.com/yogesh.baneshiLINKEDIN :- http://in.linkedin.com/pub/yogesh-singh-baneshi/93/324/173TWITTER :- https://twitter.com/YSBaneshi
1
Introduction.....................................................3
Report Wizard……………………………….6
Blank Report...................................................16
Report Design……………………………….19
2
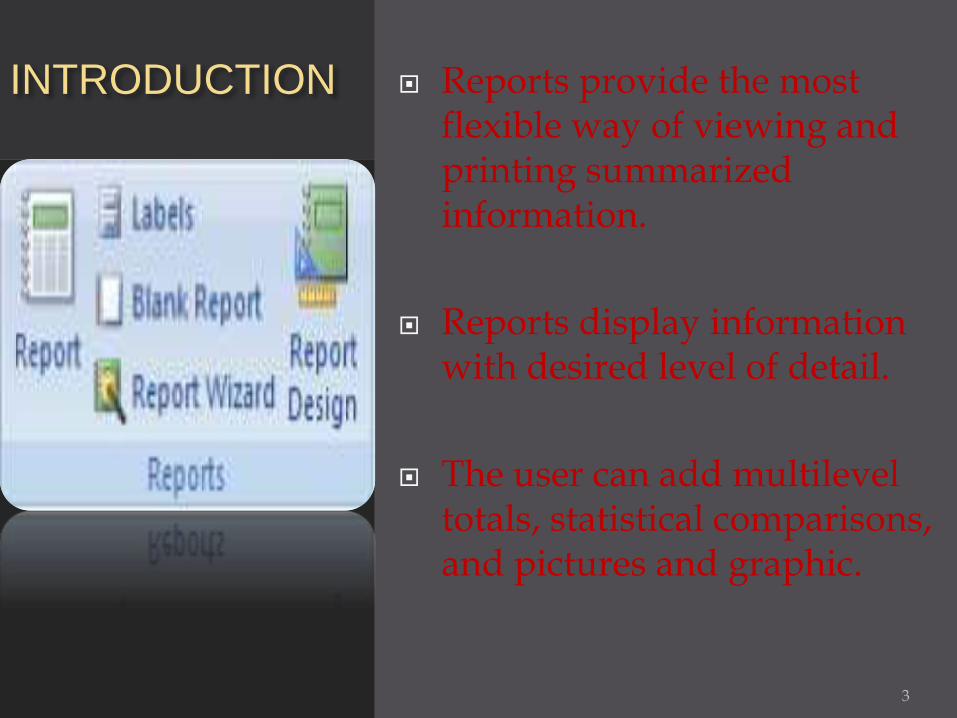
INTRODUCTION Reports provide the most flexible way of viewing and printing summarized information.
Reports display information with desired level of detail.
The user can add multilevel totals, statistical comparisons, and pictures and graphic.
3
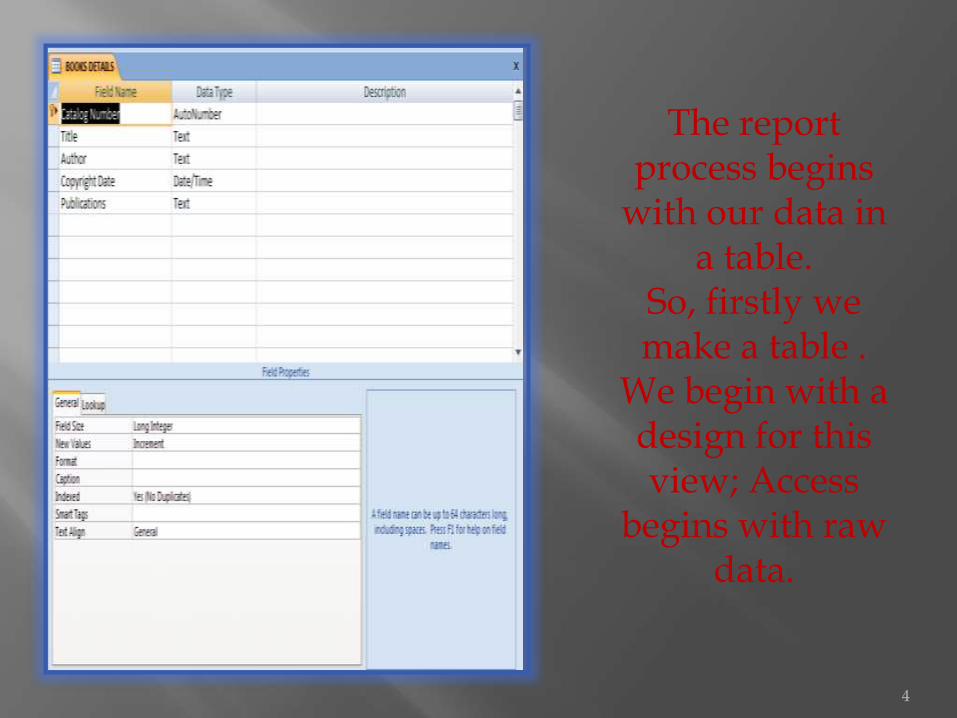
The report process begins
with our data in a table.
So, firstly we make a table .
We begin with a design for this view; Access
begins with raw data.
4
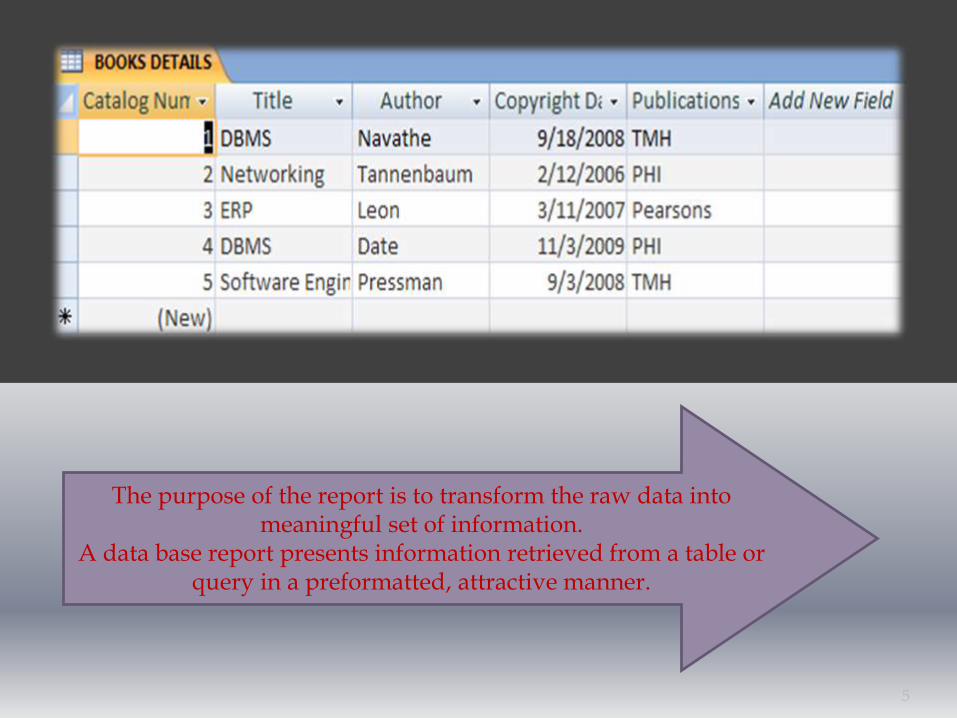
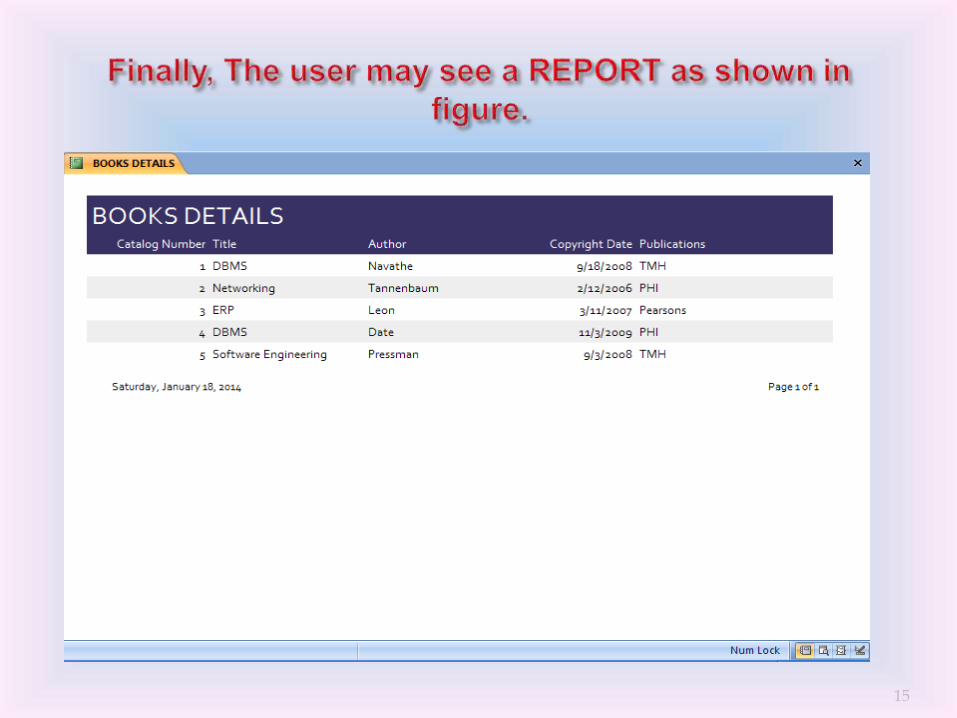
The purpose of the report is to transform the raw data into meaningful set of information.
A data base report presents information retrieved from a table or query in a preformatted, attractive manner.
5
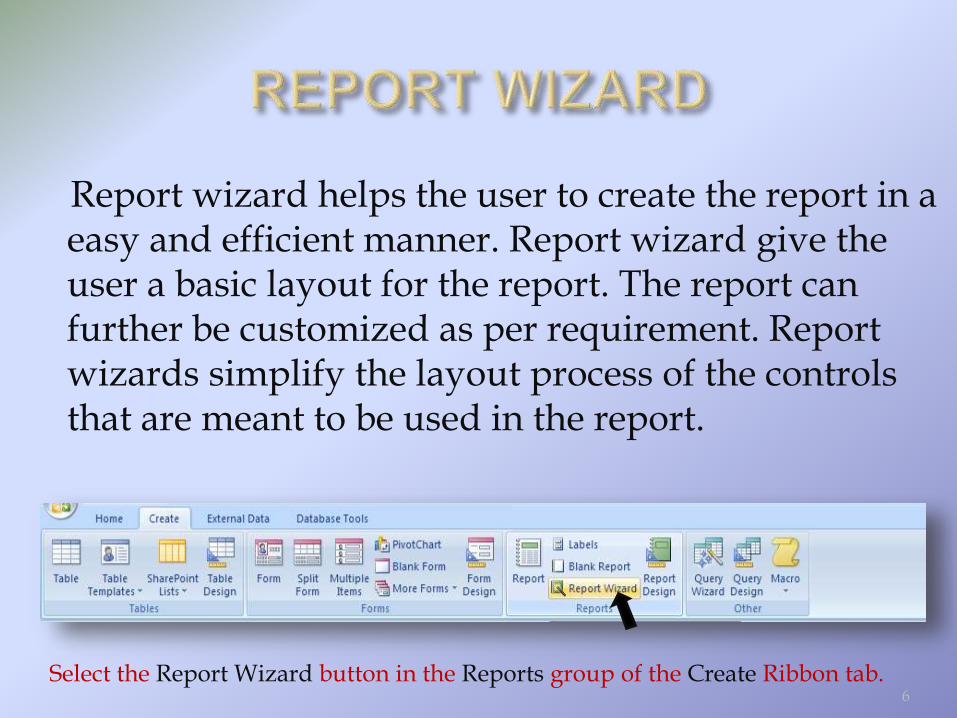
Report wizard helps the user to create the report in a easy and efficient manner. Report wizard give the user a basic layout for the report. The report can further be customized as per requirement. Report wizards simplify the layout process of the controls that are meant to be used in the report.
Select the Report Wizard button in the Reports group of the Create Ribbon tab.6
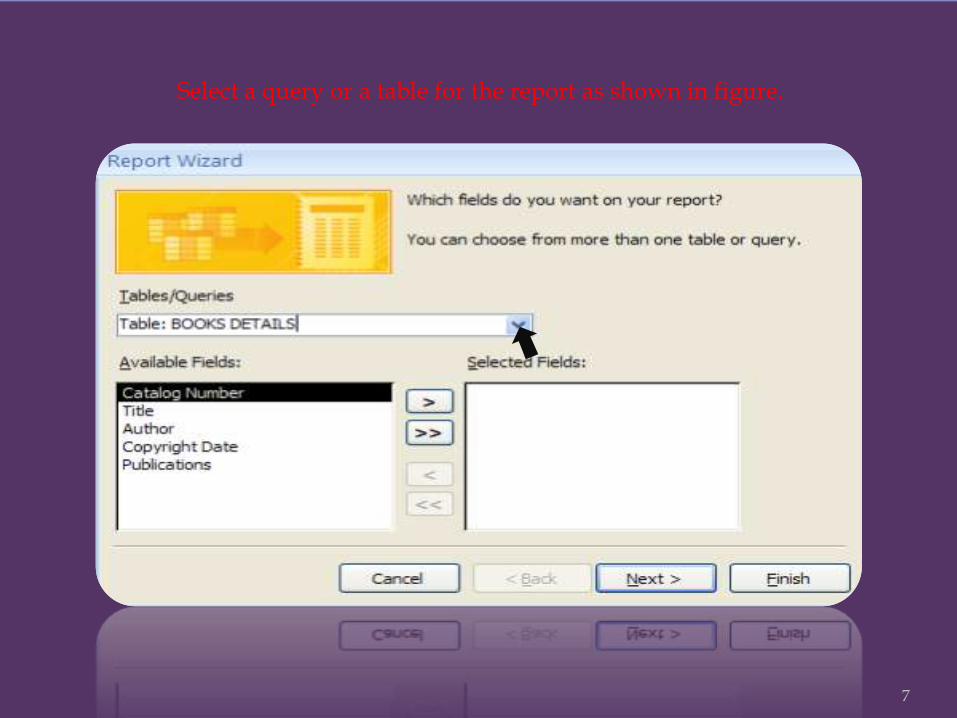
Select a query or a table for the report as shown in figure.
7
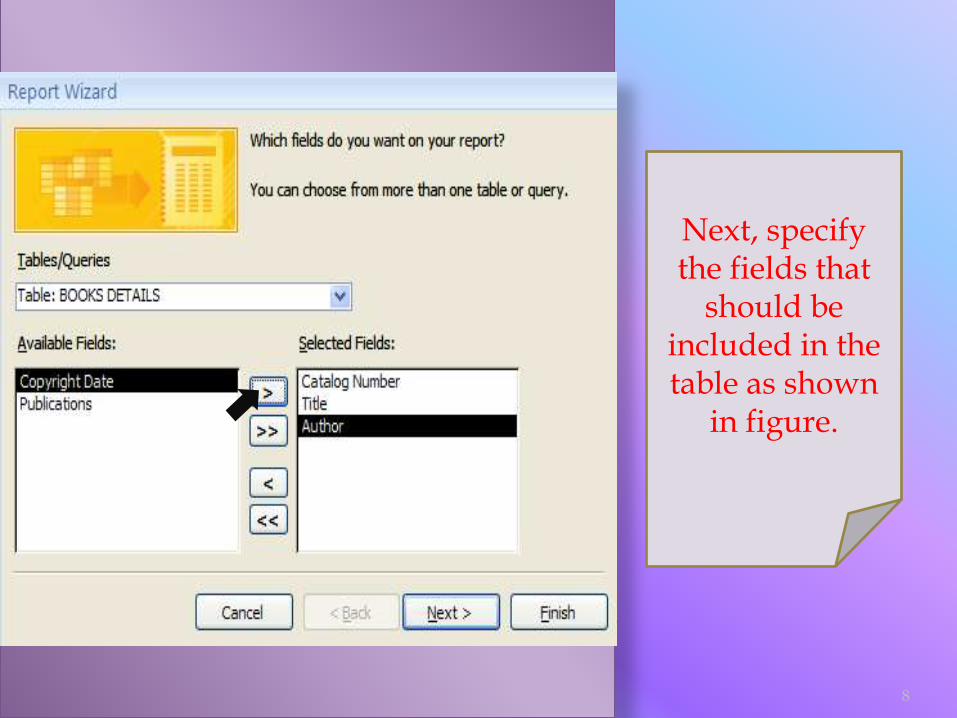
Next, specify the fields that
should be included in the table as shown
in figure.
8
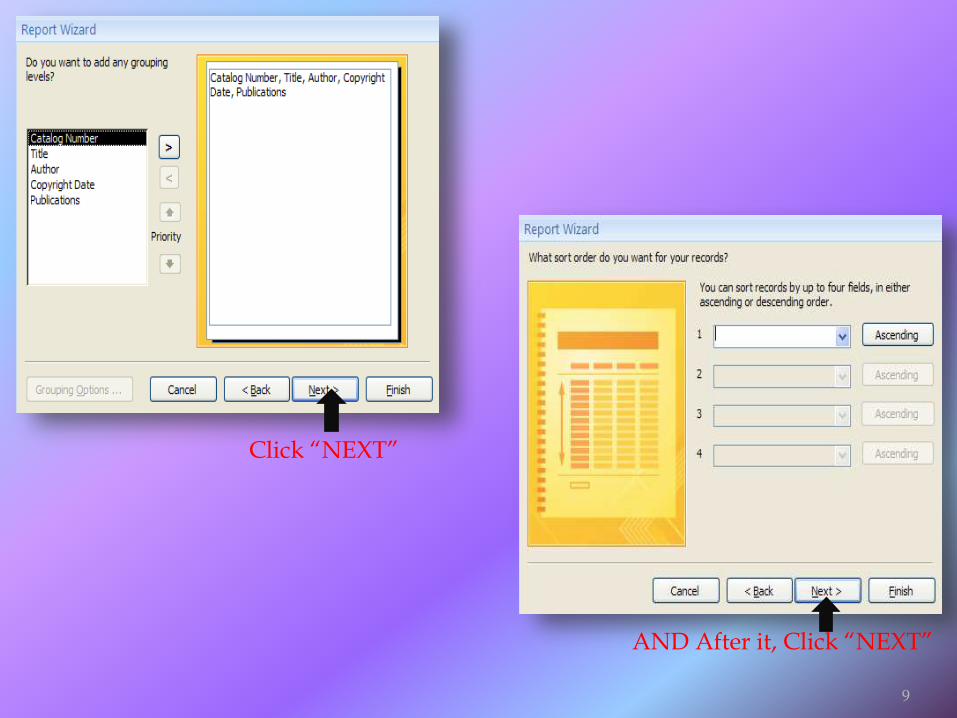
Click “NEXT”
AND After it, Click “NEXT”
9
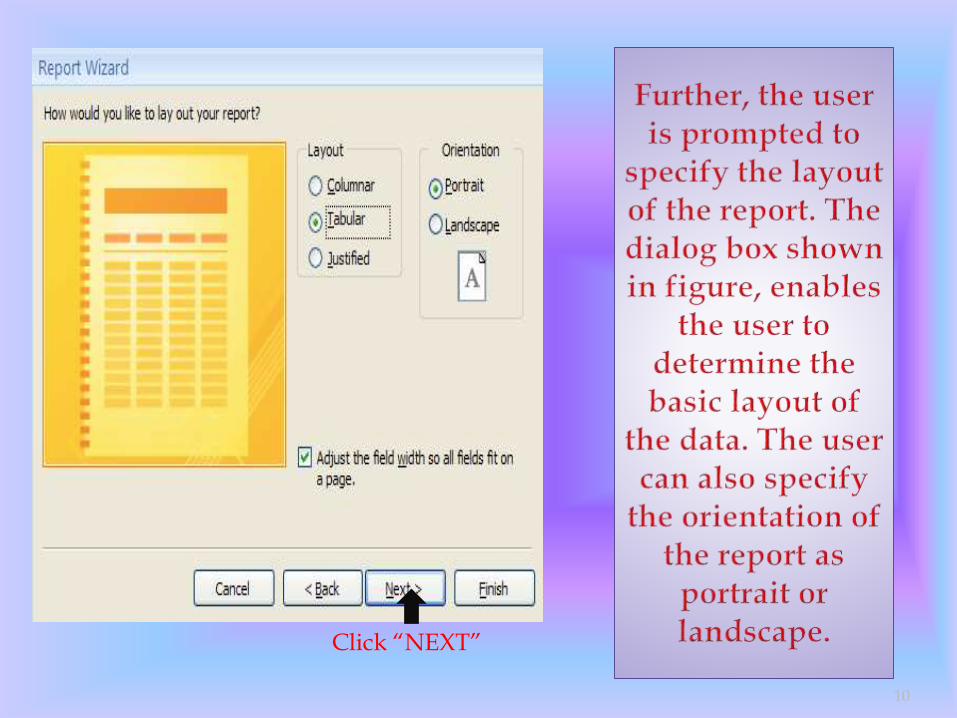
Click “NEXT”
10
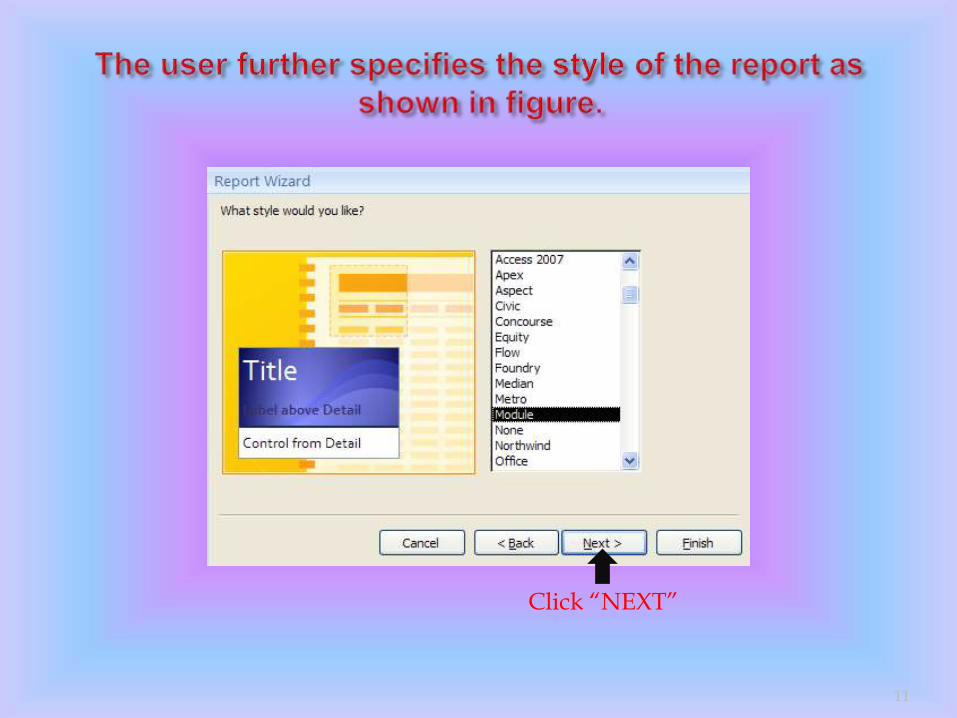
Click “NEXT”
11
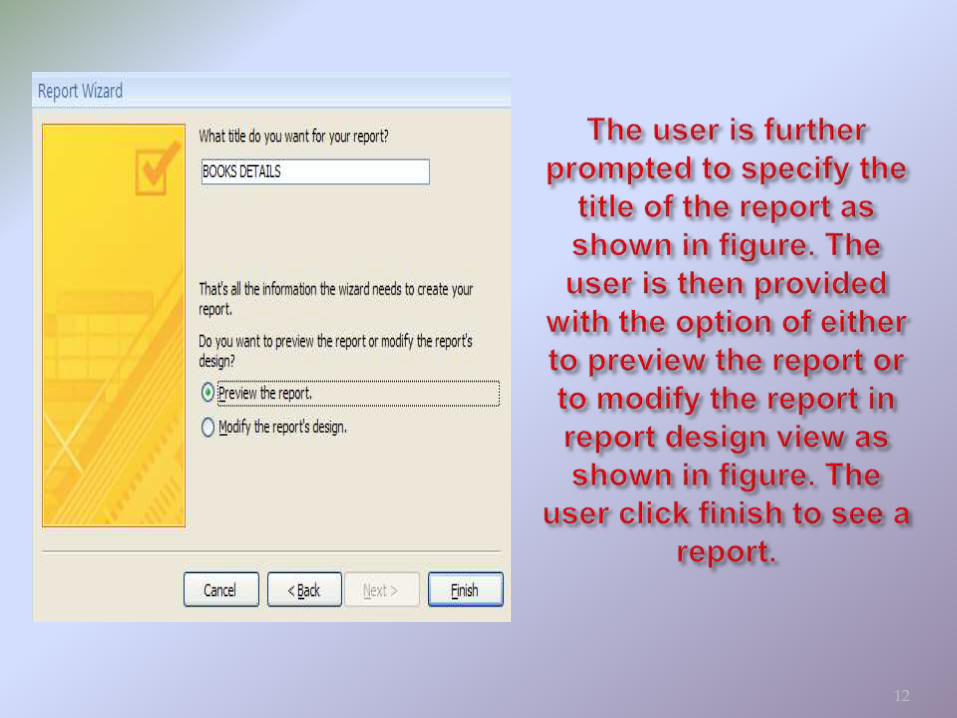
12
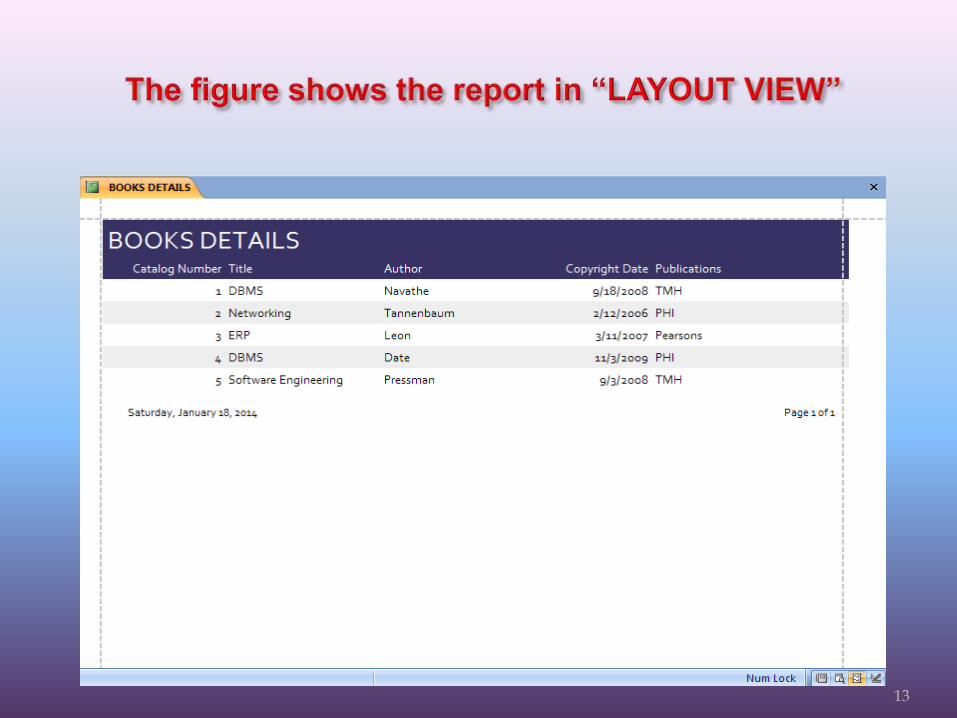
13
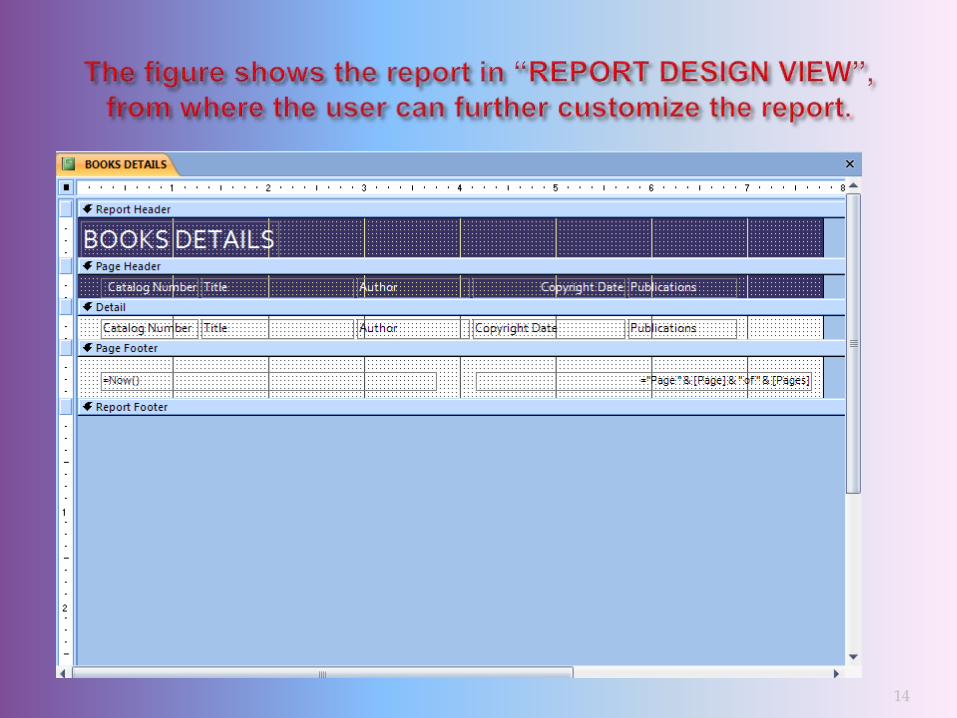
14
15

The user create a new blank report so that he can insert fields and controls and design the report.
Click “BLANK REPORT”
16
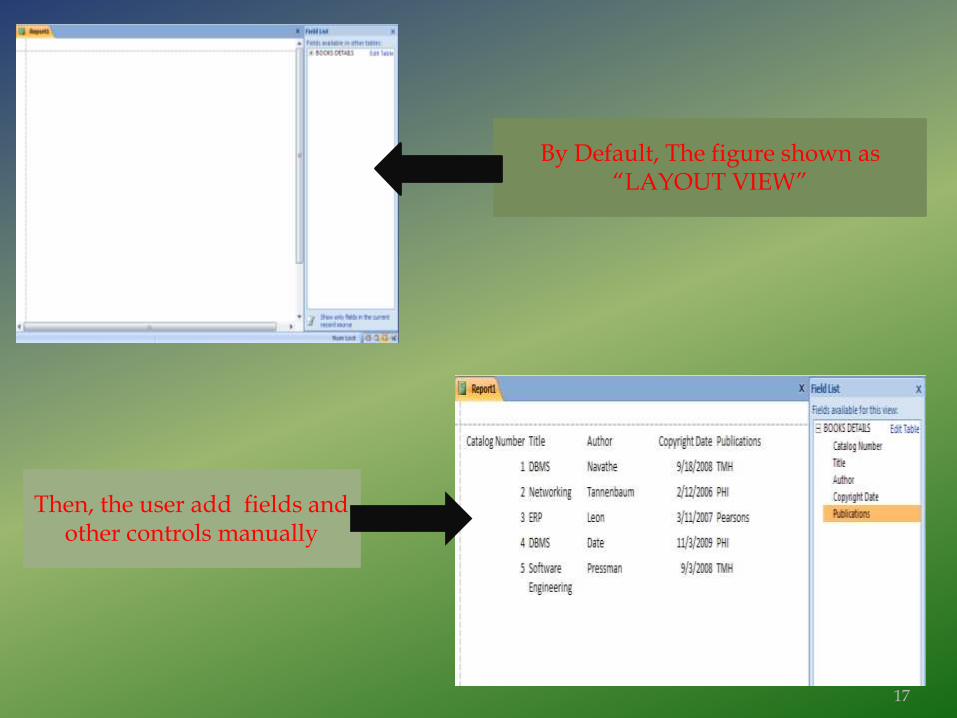
By Default, The figure shown as “LAYOUT VIEW”
Then, the user add fields and other controls manually
17
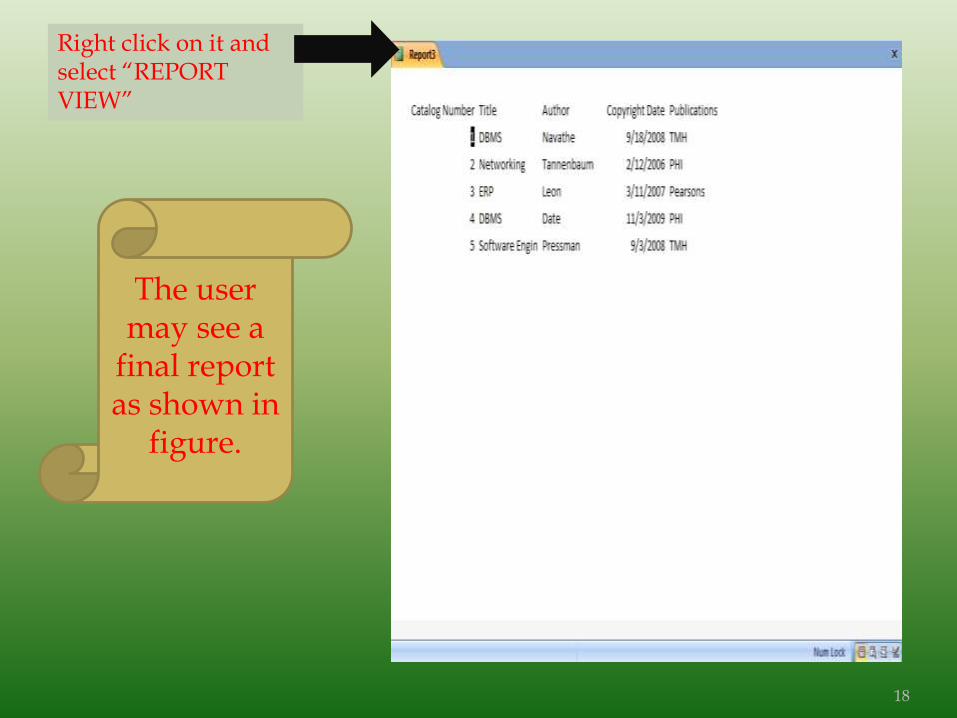
Right click on it and select “REPORT VIEW”
The user may see a
final report as shown in
figure.
18
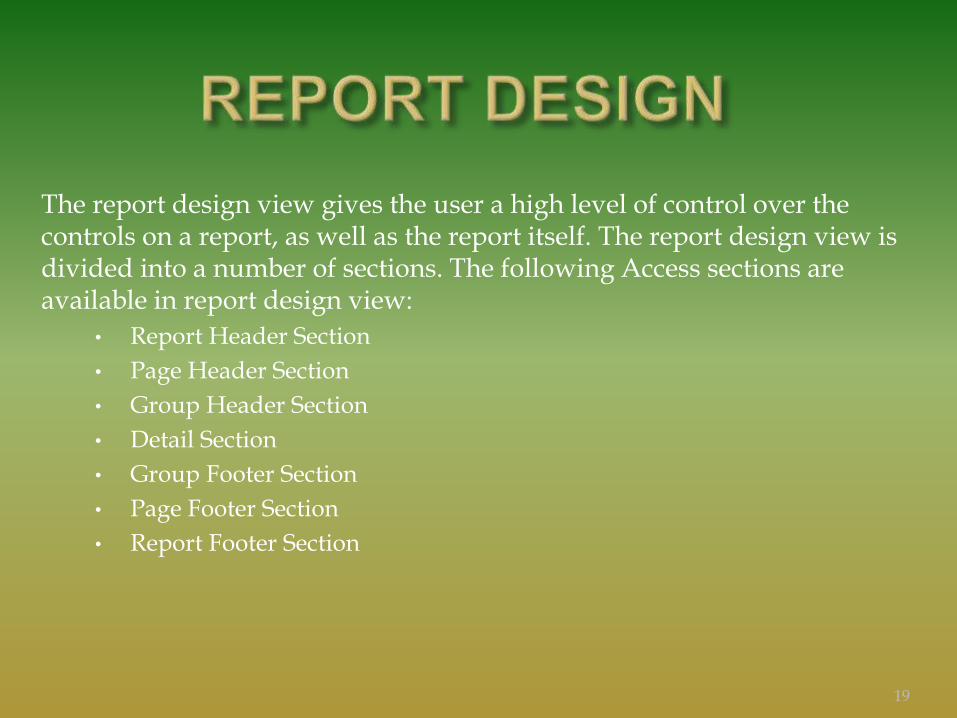
The report design view gives the user a high level of control over the controls on a report, as well as the report itself. The report design view is divided into a number of sections. The following Access sections are available in report design view:
• Report Header Section
• Page Header Section
• Group Header Section
• Detail Section
• Group Footer Section
• Page Footer Section
• Report Footer Section
19
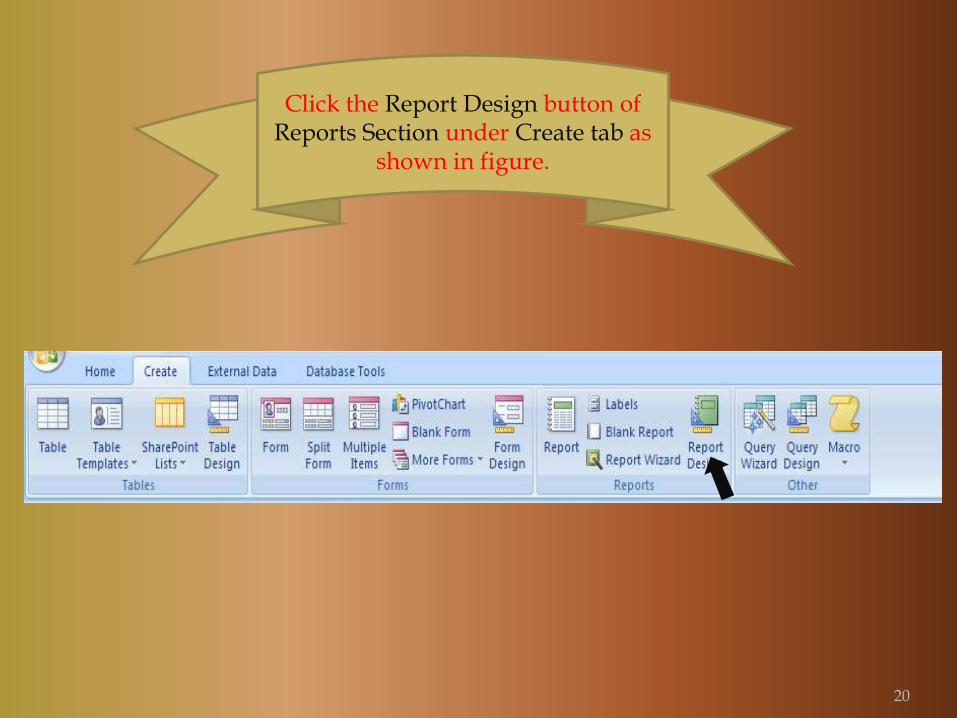
Click the Report Design button of Reports Section under Create tab as
shown in figure.
20
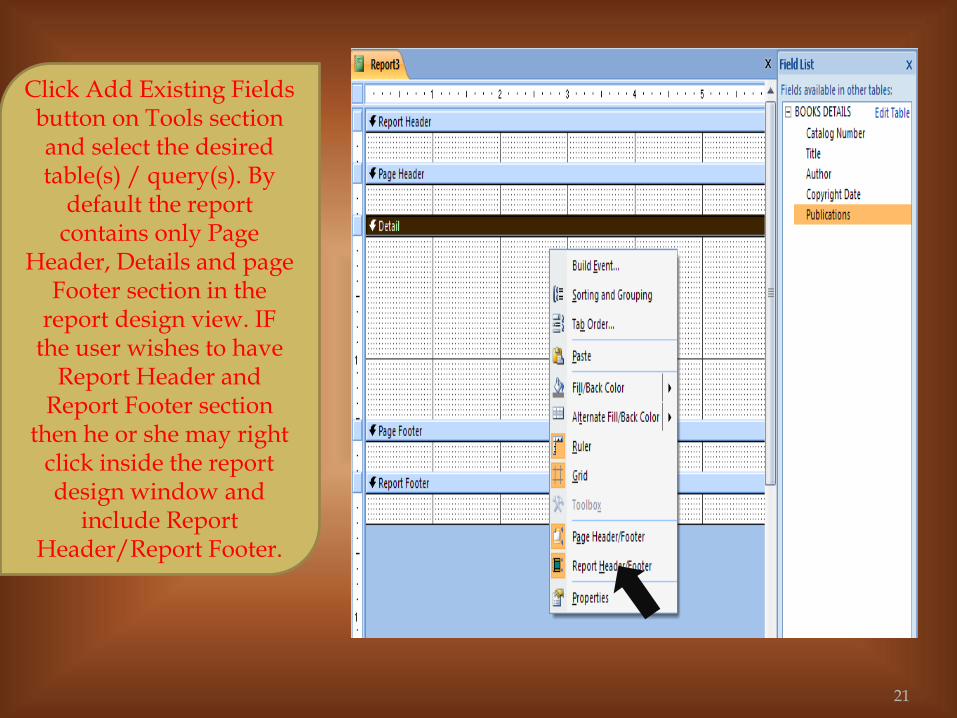
Click Add Existing Fields button on Tools section and select the desired table(s) / query(s). By
default the report contains only Page
Header, Details and page Footer section in the
report design view. IF the user wishes to have
Report Header and Report Footer section
then he or she may right click inside the report design window and
include Report Header/Report Footer.
21
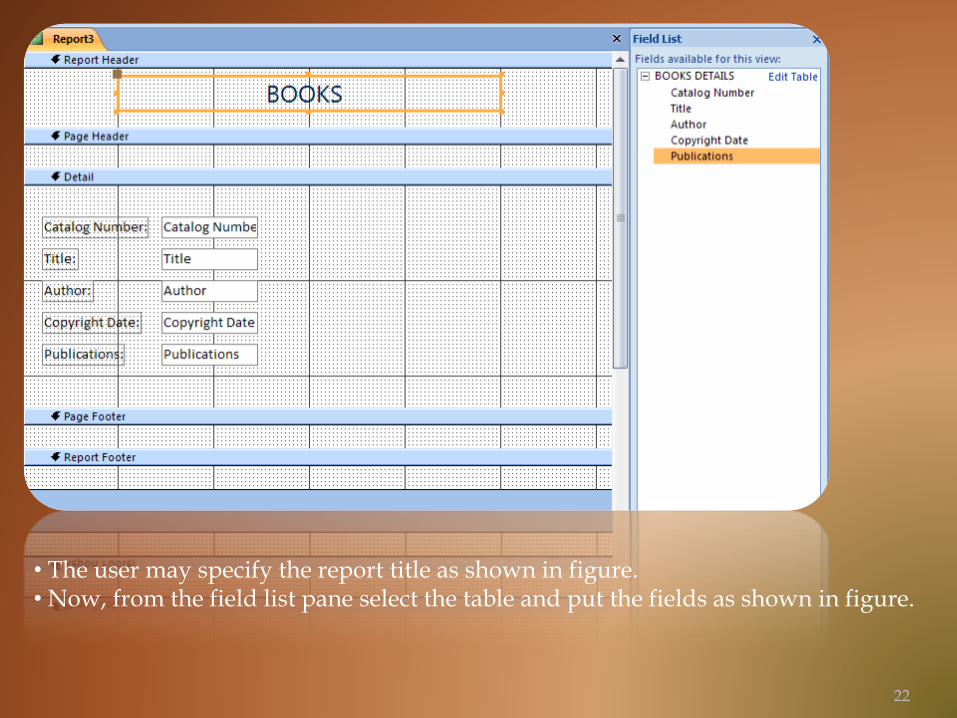
• The user may specify the report title as shown in figure.• Now, from the field list pane select the table and put the fields as shown in figure.
22
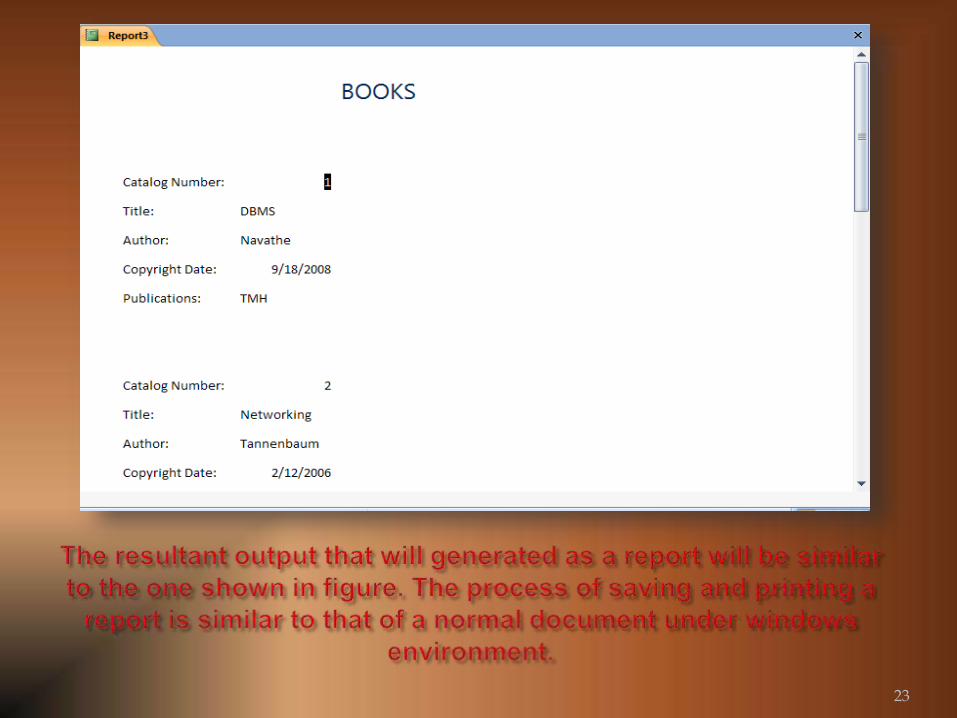
23

24