Embed Size (px)
Citation preview
Module 2 Statistics
What this module is about This module is about finding the measures of central tendency of grouped data. As you go over this material, you will develop the skills in computing the mean, median and mode of grouped data.
What you are expected to learn This module is designed for you to find the measures of central tendency using grouped data. Specifically, you are to find the mean, median and mode of grouped data.
How much do you know Use the frequency distribution table below to answer the questions.
Scores of Students in a Mathematics Test
Class Frequency46 – 50 1 41 – 45 2 36 – 40 2 31 – 35 3 26 – 30 7 21 – 25 10 16 – 20 13 11 – 15 6 6 – 10 4 1 – 5 2
1. What is the class size? 2. What is the class mark of the class with the highest frequency? 3. What is fX∑ ? 4. Find the mean score. 5. What is the median class?
2
6. Determine the cumulative frequency of the median class. 7. Solve for the median score. 8. What is the modal class? 9. Determine the lower boundary of the modal class 10. Compute for the modal score.
What you will do
Lesson 1
The Mean of Grouped Data Using the Class Marks
When the number of items in a set of data is too big, items are grouped for convenience. The manner of computing for the mean of grouped data is given by the formula:
(fX)Mean
f∑
=∑
where: f is the frequency of each class
X is the class mark of class
The Greek symbol ∑ (sigma) is the mathematical symbol for summation. This means that all items having this symbol are to be added. Thus, the symbol ∑f means the sum of all frequencies, and ∑fX means the sum of all the products of the frequency and the corresponding class mark.
Examples:
Compute the mean of the scores of the students in a Mathematics IV test.
Class Frequency46 – 50 1 41 – 45 5 36 – 40 11 31 – 35 12 26 – 30 11 21 – 25 5 16 – 20 2 11 – 15 1
3
The frequency distribution for the data is given below. The columns X and fX are added.
Class f X fX 46 – 50 1 48 48 41 – 45 5 43 21536 – 40 11 38 41831 – 35 12 33 39626 – 30 11 28 30821 – 25 5 23 11516 – 20 2 18 36 11 – 15 1 13 13
∑f = 48
∑fX = 1,549
(fX)Meanf
∑=
∑
1,549Mean48
=
Mean =32.27 The mean score is 32.27.
Solve for the mean gross sale of Aling Mely’s Sari-sari Store for one
month. Sales in Pesos Frequency4,501 – 5,000 3 4,001 – 4,500 4 3,501 – 4,000 6 3,001 – 3,500 5 2,501 – 3,000 7 2,001 – 2,500 3 1,501 – 2,000 1 1,001 – 1,500 1
The frequency distribution for the data is given below. The columns X and
fX are added. Sales in Pesos f X fX 1,001 – 1,500 1 1,250 1,250 1,501 – 2,000 1 1,750 1,750 2,001 – 2,500 3 2,250 6,750 2,501 – 3,000 7 2,750 19,2503,001 – 3,500 5 3,250 16,2503,501 – 4,000 6 3,750 22,5004,001 – 4,500 4 4,250 17,0004,501 – 5,000 3 4,750 14,250
4
∑f = 30 ∑fX = 99,000
(fX)Meanf
∑=
∑
99,000Mean30
=
Mean = 3,300 The mean gross sale is P3, 300.
Try this out
Solve for the mean of each grouped data using the class marks. Set A
1. Scores of Diagnostic Test of IV-Narra Students
Score Frequency36 – 40 1 31 – 35 10 26 – 20 10 21 – 25 16 16 – 20 9 11 – 15 4
2. Height of IV-1 and IV-2 Students
Height in cm Frequency175 – 179 2 170 – 174 5 165 – 169 8 160 – 164 11 155 – 159 21 150 – 154 14 145 – 169 17 140 – 144 2
3. Midyear Test Scores of IV-Newton
Score Frequency41 – 45 1 36 – 40 8 31 – 35 8 26 – 30 14 21 – 25 7 16 – 20 2
5
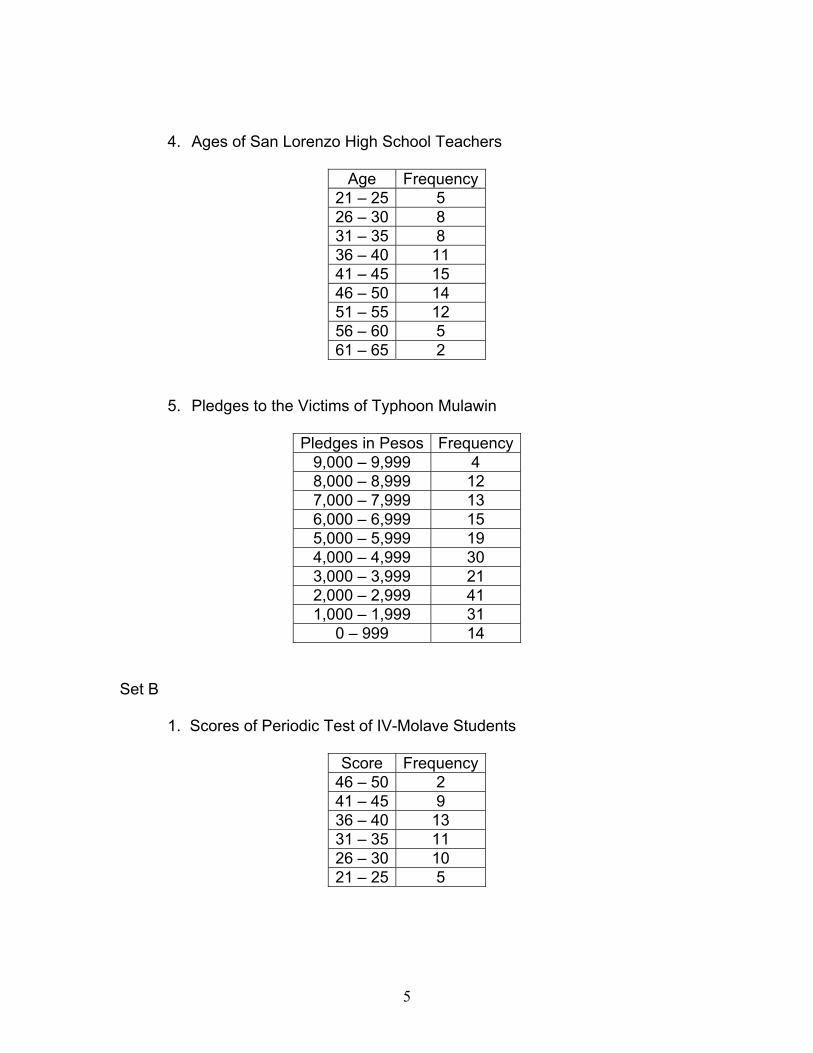
4. Ages of San Lorenzo High School Teachers
Age Frequency21 – 25 5 26 – 30 8 31 – 35 8 36 – 40 11 41 – 45 15 46 – 50 14 51 – 55 12 56 – 60 5 61 – 65 2
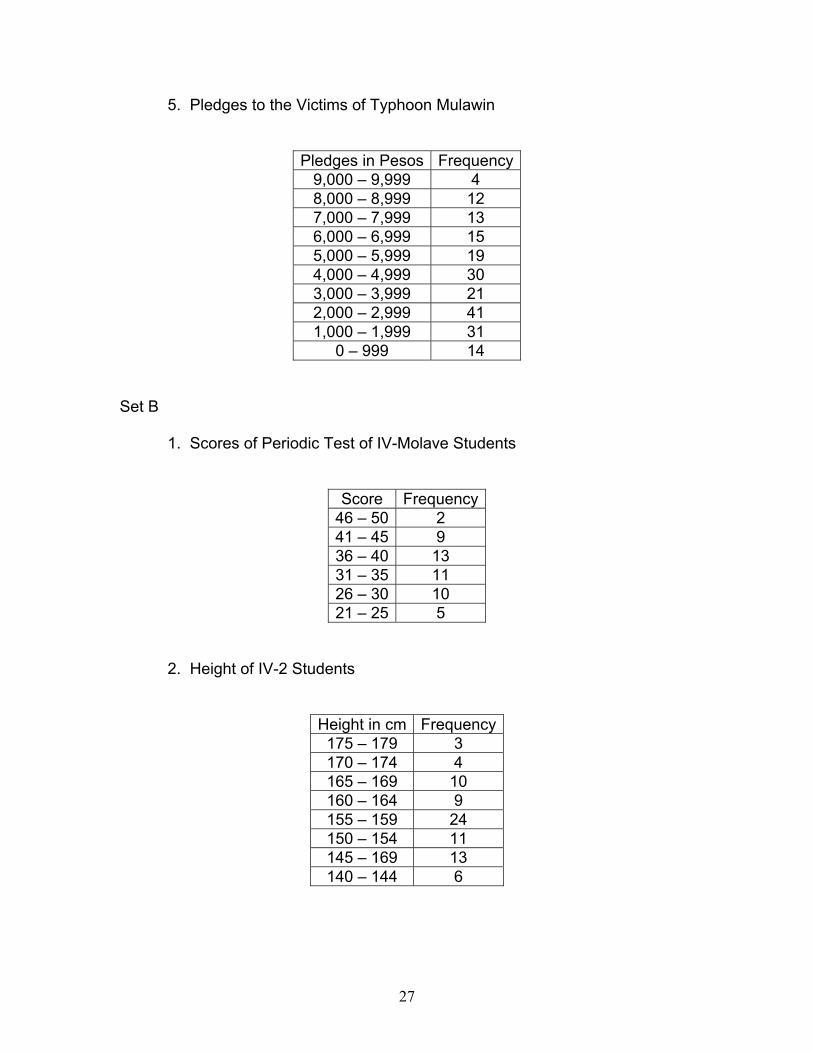
5. Pledges to the Victims of Typhoon Mulawin
Pledges in Pesos Frequency
9,000 – 9,999 4 8,000 – 8,999 12 7,000 – 7,999 13 6,000 – 6,999 15 5,000 – 5,999 19 4,000 – 4,999 30 3,000 – 3,999 21 2,000 – 2,999 41 1,000 – 1,999 31
0 – 999 14
Set B
1. Scores of Periodic Test of IV-Molave Students
Score Frequency46 – 50 2 41 – 45 9 36 – 40 13 31 – 35 11 26 – 30 10 21 – 25 5

6
2. Height of IV-2 Students
Height in cm Frequency175 – 179 3 170 – 174 4 165 – 169 10 160 – 164 9 155 – 159 24 150 – 154 11 145 – 169 13 140 – 144 6
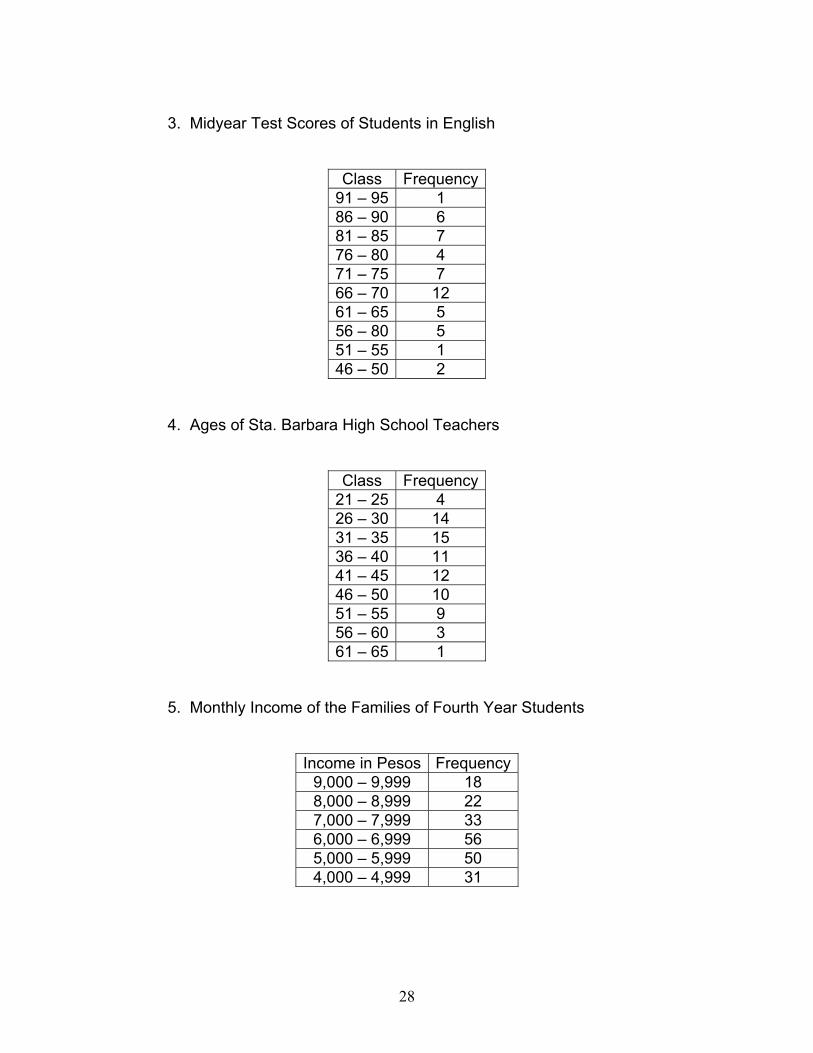
3. Midyear Test Scores of Students in English
Class Frequency91 – 95 1 86 – 90 6 81 – 85 7 76 – 80 4 71 – 75 7 66 – 70 12 61 – 65 5 56 – 80 5 51 – 55 1 46 – 50 2
4. Ages of Sta. Barbara High School Teachers
Class Frequency21 – 25 4 26 – 30 14 31 – 35 15 36 – 40 11 41 – 45 12 46 – 50 10 51 – 55 9 56 – 60 3 61 – 65 3

7
5. Monthly Income of the Families of Fourth Year Students
Income in Pesos Frequency9,000 – 9,999 18 8,000 – 8,999 22 7,000 – 7,999 33 6,000 – 6,999 56 5,000 – 5,999 50 4,000 – 4,999 31
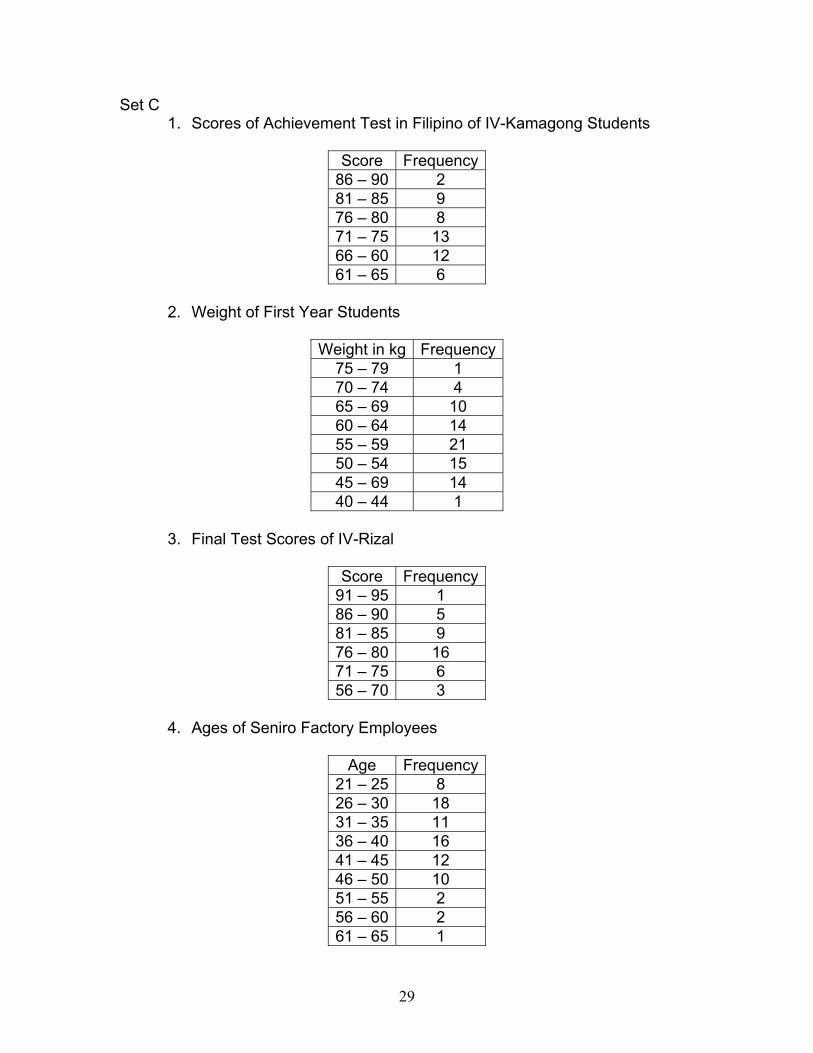
Set C
1. Scores of Achievement Test in Filipino of IV-Kamagong Students
Score Frequency86 – 90 2 81 – 85 9 76 – 80 8 71 – 75 13 66 – 60 12 61 – 65 6
2. Weight of First Year Students
Weight in kg Frequency75 – 79 1 70 – 74 4 65 – 69 10 60 – 64 14 55 – 59 21 50 – 54 15 45 – 69 14 40 – 44 1
3. Final Test Scores of IV-Rizal
Score Frequency91 – 95 1 86 – 90 5 81 – 85 9 76 – 80 16 71 – 75 6 66 – 70 3
8
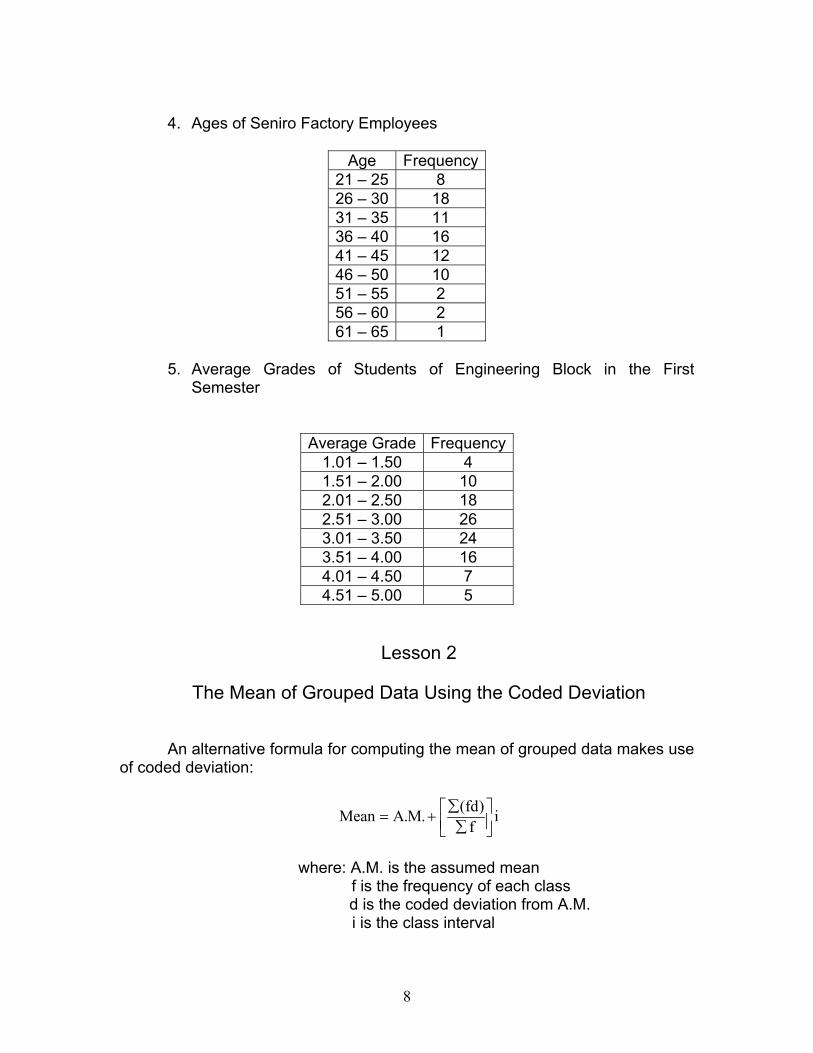
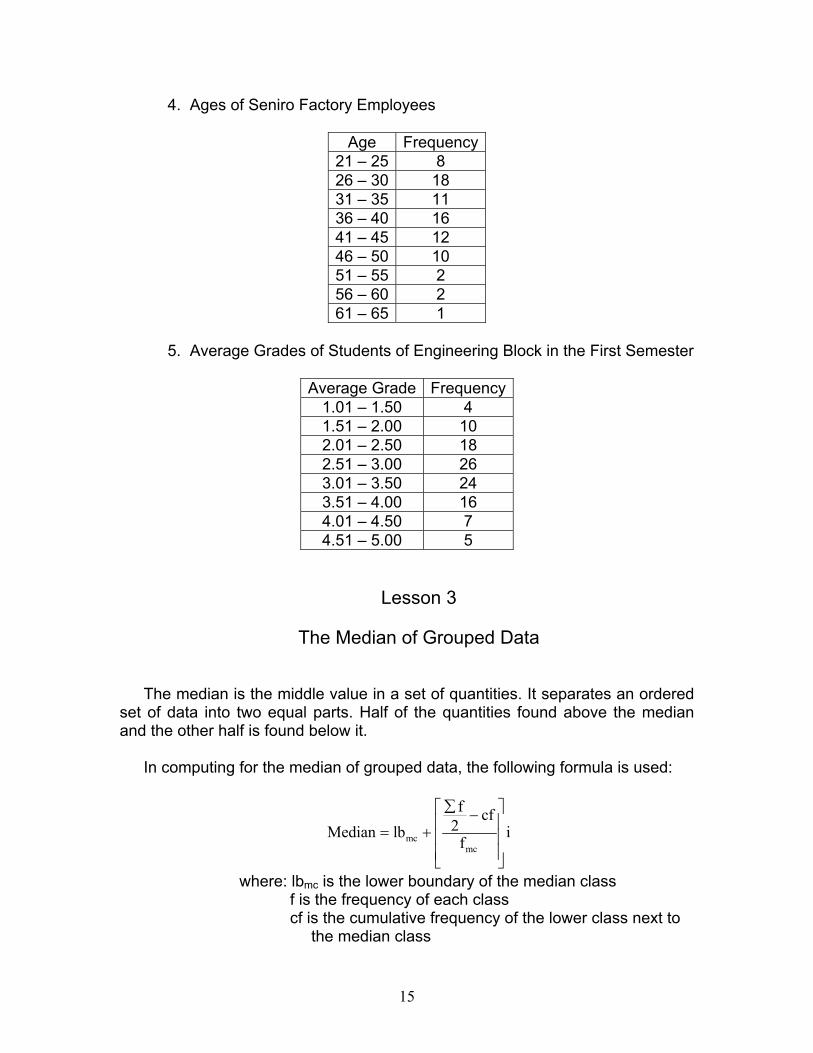
4. Ages of Seniro Factory Employees
Age Frequency21 – 25 8 26 – 30 18 31 – 35 11 36 – 40 16 41 – 45 12 46 – 50 10 51 – 55 2 56 – 60 2 61 – 65 1
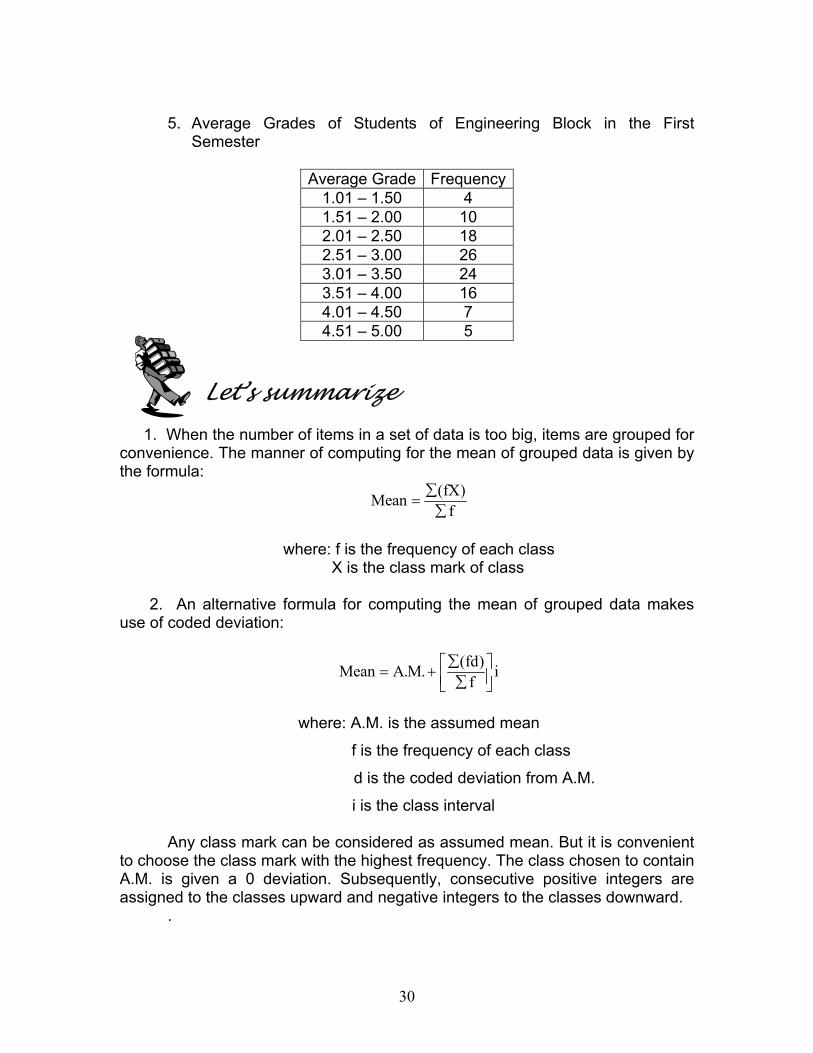
5. Average Grades of Students of Engineering Block in the First
Semester
Average Grade Frequency1.01 – 1.50 4 1.51 – 2.00 10 2.01 – 2.50 18 2.51 – 3.00 26 3.01 – 3.50 24 3.51 – 4.00 16 4.01 – 4.50 7 4.51 – 5.00 5
Lesson 2
The Mean of Grouped Data Using the Coded Deviation
An alternative formula for computing the mean of grouped data makes use of coded deviation:
(fd)Mean A.M. i
f∑ = + ∑
where: A.M. is the assumed mean
f is the frequency of each class d is the coded deviation from A.M.
i is the class interval
9
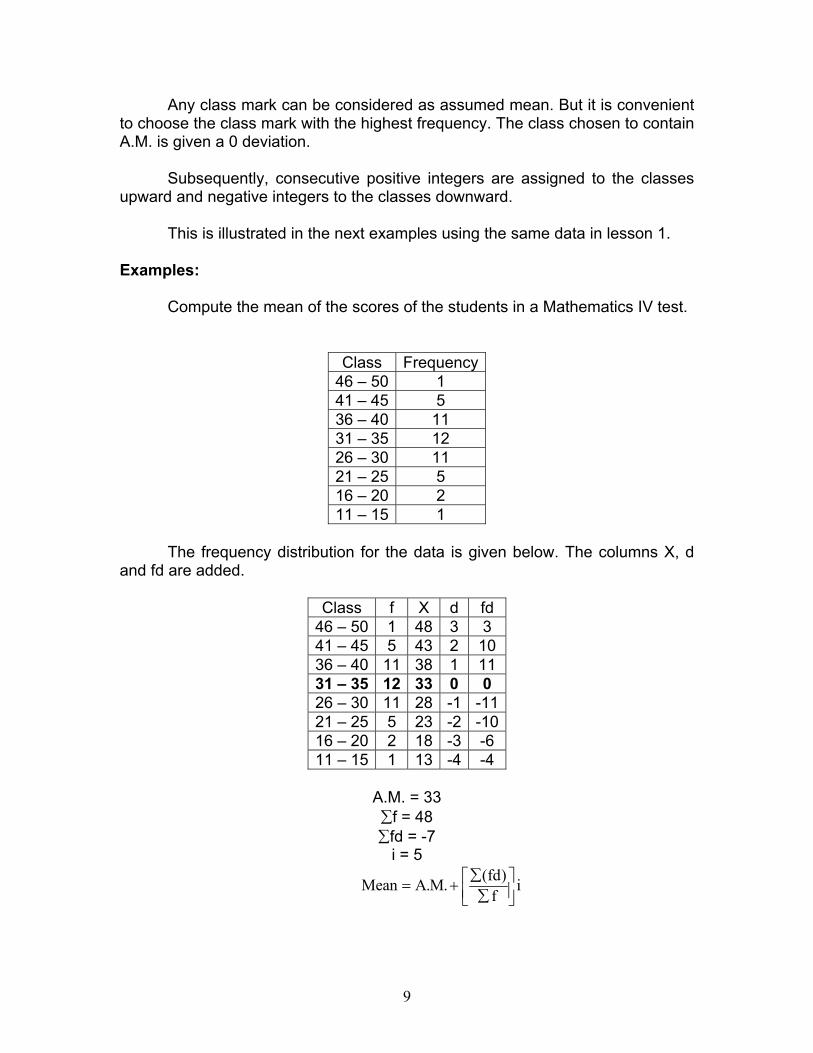
Any class mark can be considered as assumed mean. But it is convenient to choose the class mark with the highest frequency. The class chosen to contain A.M. is given a 0 deviation.
Subsequently, consecutive positive integers are assigned to the classes
upward and negative integers to the classes downward.
This is illustrated in the next examples using the same data in lesson 1.
Examples:
Compute the mean of the scores of the students in a Mathematics IV test.
Class Frequency46 – 50 1 41 – 45 5 36 – 40 11 31 – 35 12 26 – 30 11 21 – 25 5 16 – 20 2 11 – 15 1
The frequency distribution for the data is given below. The columns X, d
and fd are added.
Class f X d fd 46 – 50 1 48 3 3 41 – 45 5 43 2 10 36 – 40 11 38 1 11 31 – 35 12 33 0 0 26 – 30 11 28 -1 -1121 – 25 5 23 -2 -1016 – 20 2 18 -3 -6 11 – 15 1 13 -4 -4
A.M. = 33 ∑f = 48 ∑fd = -7
i = 5
(fd)Mean A.M. if
∑ = + ∑
10
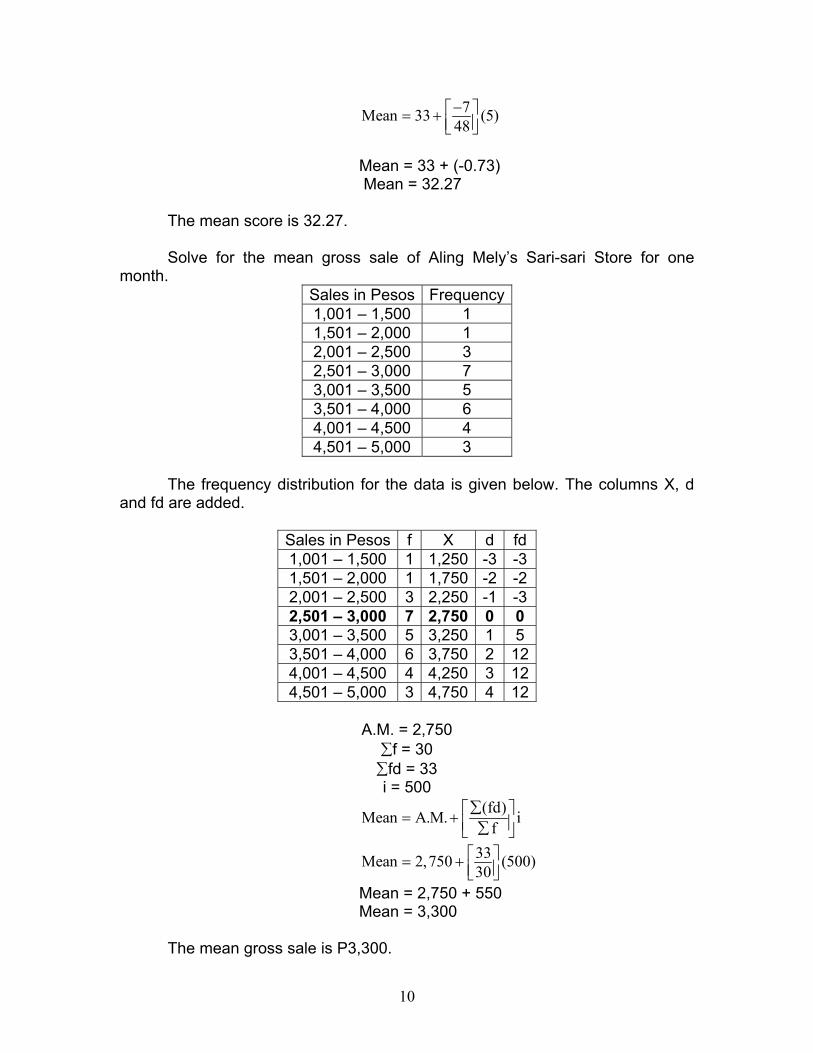
7Mean 33 (5)48− = +
Mean = 33 + (-0.73) Mean = 32.27
The mean score is 32.27.
Solve for the mean gross sale of Aling Mely’s Sari-sari Store for one month.
Sales in Pesos Frequency1,001 – 1,500 1 1,501 – 2,000 1 2,001 – 2,500 3 2,501 – 3,000 7 3,001 – 3,500 5 3,501 – 4,000 6 4,001 – 4,500 4 4,501 – 5,000 3
The frequency distribution for the data is given below. The columns X, d
and fd are added.
Sales in Pesos f X d fd 1,001 – 1,500 1 1,250 -3 -31,501 – 2,000 1 1,750 -2 -22,001 – 2,500 3 2,250 -1 -32,501 – 3,000 7 2,750 0 0 3,001 – 3,500 5 3,250 1 5 3,501 – 4,000 6 3,750 2 124,001 – 4,500 4 4,250 3 124,501 – 5,000 3 4,750 4 12
A.M. = 2,750
∑f = 30 ∑fd = 33 i = 500
(fd)Mean A.M. if
∑ = + ∑
33Mean 2,750 (500)30 = +
Mean = 2,750 + 550 Mean = 3,300
The mean gross sale is P3,300.
11
Try this out
Solve for the mean of each grouped data using coded deviation. Set A
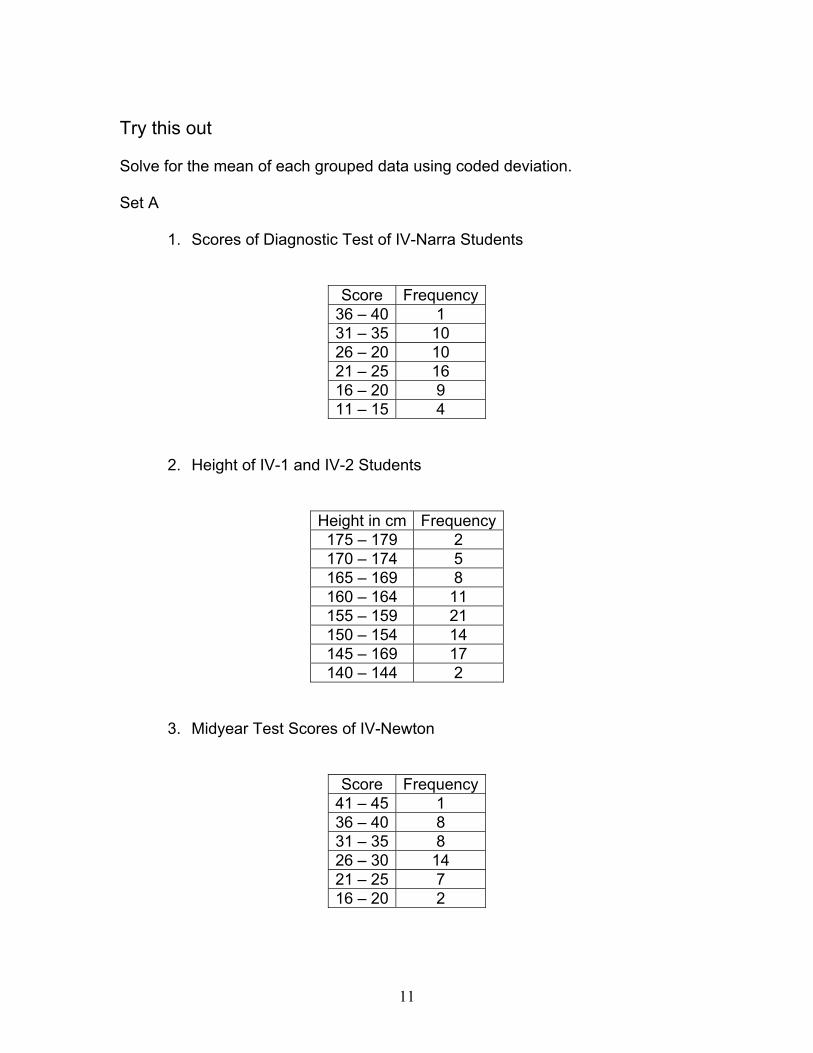
1. Scores of Diagnostic Test of IV-Narra Students
Score Frequency36 – 40 1 31 – 35 10 26 – 20 10 21 – 25 16 16 – 20 9 11 – 15 4
2. Height of IV-1 and IV-2 Students
Height in cm Frequency175 – 179 2 170 – 174 5 165 – 169 8 160 – 164 11 155 – 159 21 150 – 154 14 145 – 169 17 140 – 144 2
3. Midyear Test Scores of IV-Newton
Score Frequency41 – 45 1 36 – 40 8 31 – 35 8 26 – 30 14 21 – 25 7 16 – 20 2
12
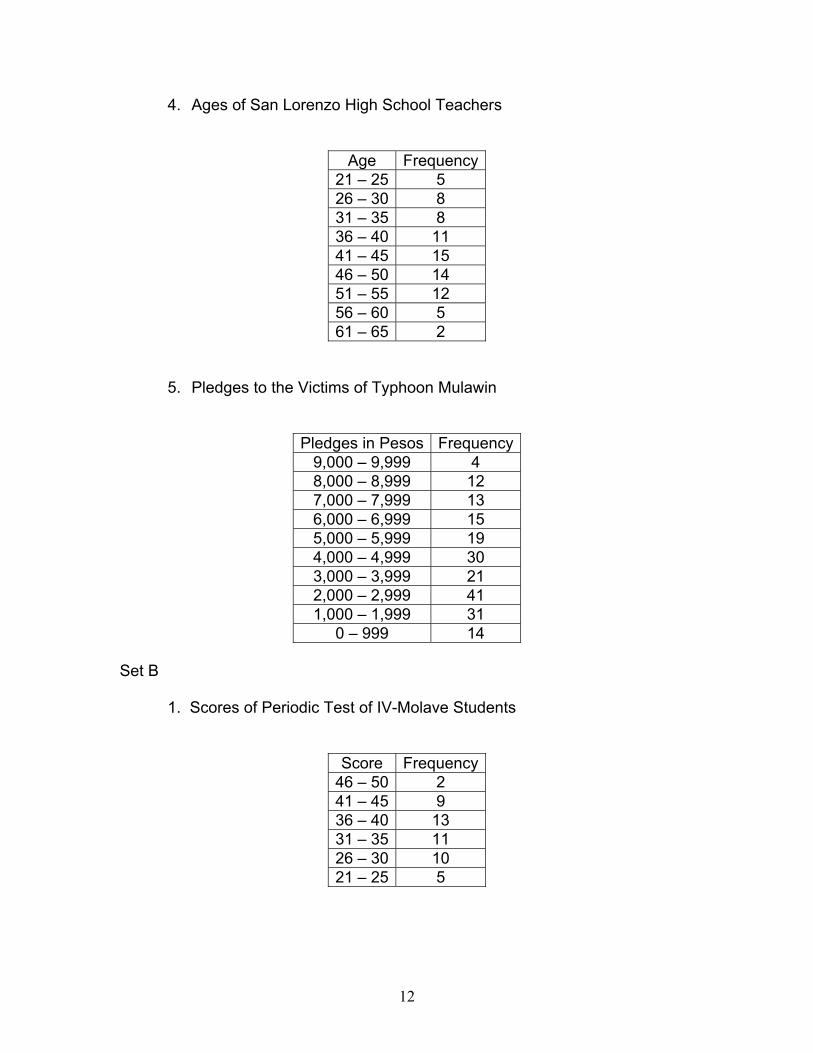
4. Ages of San Lorenzo High School Teachers
Age Frequency21 – 25 5 26 – 30 8 31 – 35 8 36 – 40 11 41 – 45 15 46 – 50 14 51 – 55 12 56 – 60 5 61 – 65 2
5. Pledges to the Victims of Typhoon Mulawin
Pledges in Pesos Frequency9,000 – 9,999 4 8,000 – 8,999 12 7,000 – 7,999 13 6,000 – 6,999 15 5,000 – 5,999 19 4,000 – 4,999 30 3,000 – 3,999 21 2,000 – 2,999 41 1,000 – 1,999 31
0 – 999 14
Set B 1. Scores of Periodic Test of IV-Molave Students
Score Frequency46 – 50 2 41 – 45 9 36 – 40 13 31 – 35 11 26 – 30 10 21 – 25 5
13
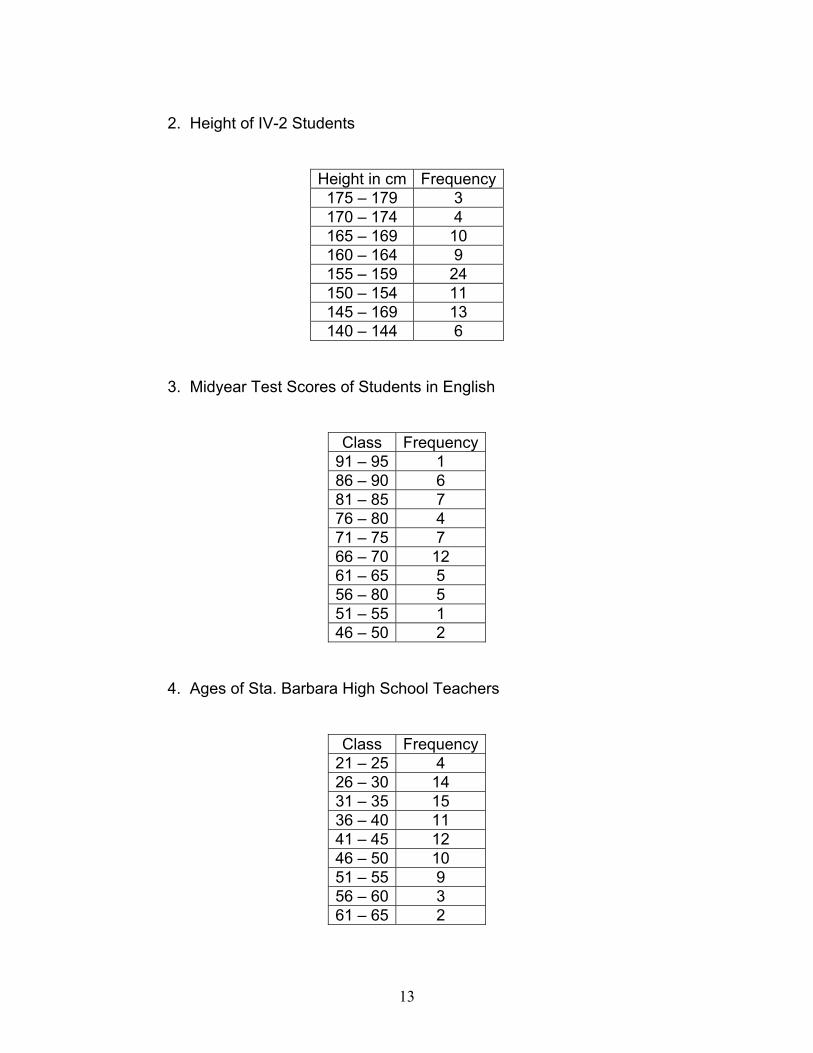
2. Height of IV-2 Students
Height in cm Frequency175 – 179 3 170 – 174 4 165 – 169 10 160 – 164 9 155 – 159 24 150 – 154 11 145 – 169 13 140 – 144 6
3. Midyear Test Scores of Students in English
Class Frequency91 – 95 1 86 – 90 6 81 – 85 7 76 – 80 4 71 – 75 7 66 – 70 12 61 – 65 5 56 – 80 5 51 – 55 1 46 – 50 2
4. Ages of Sta. Barbara High School Teachers
Class Frequency21 – 25 4 26 – 30 14 31 – 35 15 36 – 40 11 41 – 45 12 46 – 50 10 51 – 55 9 56 – 60 3 61 – 65 2
14
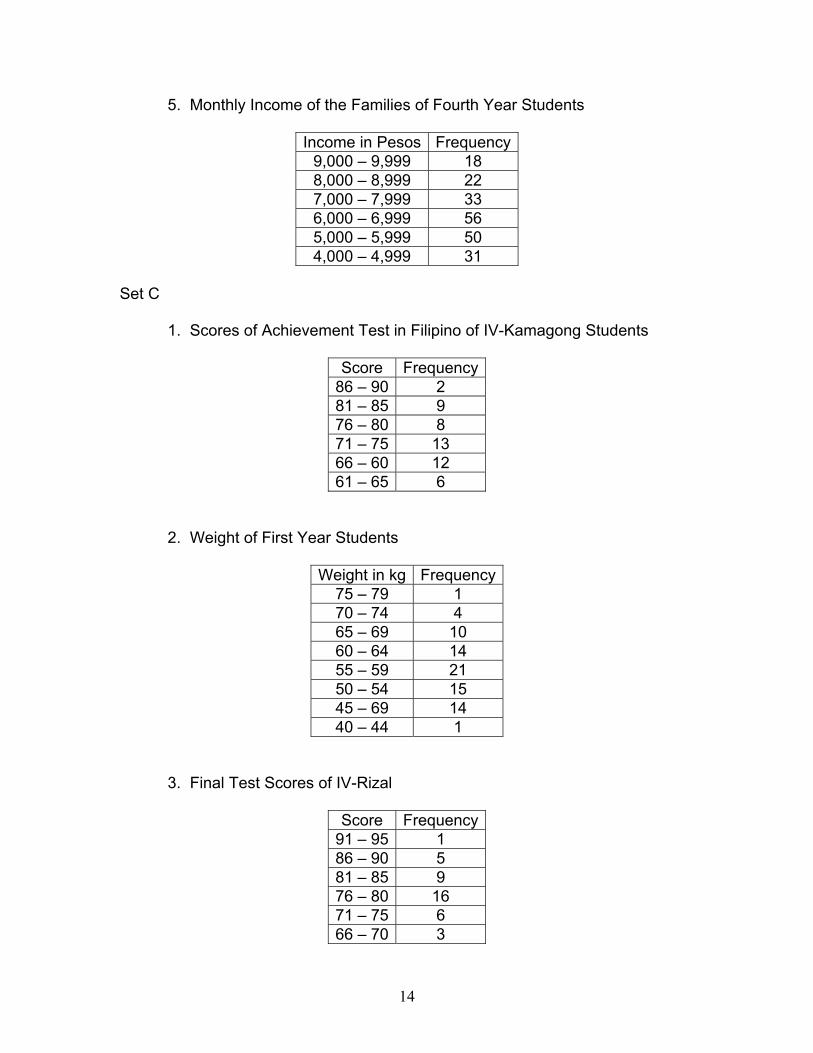
5. Monthly Income of the Families of Fourth Year Students
Income in Pesos Frequency9,000 – 9,999 18 8,000 – 8,999 22 7,000 – 7,999 33 6,000 – 6,999 56 5,000 – 5,999 50 4,000 – 4,999 31
Set C 1. Scores of Achievement Test in Filipino of IV-Kamagong Students
Score Frequency
86 – 90 2 81 – 85 9 76 – 80 8 71 – 75 13 66 – 60 12 61 – 65 6
2. Weight of First Year Students
Weight in kg Frequency75 – 79 1 70 – 74 4 65 – 69 10 60 – 64 14 55 – 59 21 50 – 54 15 45 – 69 14 40 – 44 1
3. Final Test Scores of IV-Rizal
Score Frequency91 – 95 1 86 – 90 5 81 – 85 9 76 – 80 16 71 – 75 6 66 – 70 3
15
4. Ages of Seniro Factory Employees
Age Frequency21 – 25 8 26 – 30 18 31 – 35 11 36 – 40 16 41 – 45 12 46 – 50 10 51 – 55 2 56 – 60 2 61 – 65 1
5. Average Grades of Students of Engineering Block in the First Semester
Average Grade Frequency
1.01 – 1.50 4 1.51 – 2.00 10 2.01 – 2.50 18 2.51 – 3.00 26 3.01 – 3.50 24 3.51 – 4.00 16 4.01 – 4.50 7 4.51 – 5.00 5
Lesson 3
The Median of Grouped Data
The median is the middle value in a set of quantities. It separates an ordered
set of data into two equal parts. Half of the quantities found above the median and the other half is found below it.
In computing for the median of grouped data, the following formula is used:
mcmc
f cf2Median lb i
f
∑ − = +
where: lbmc is the lower boundary of the median class f is the frequency of each class cf is the cumulative frequency of the lower class next to the median class
16
fmc is the frequency of the median class i is the class interval
The median class is the class that contains the f2∑ th quantity. The
computed median must be within the median class.
Examples:
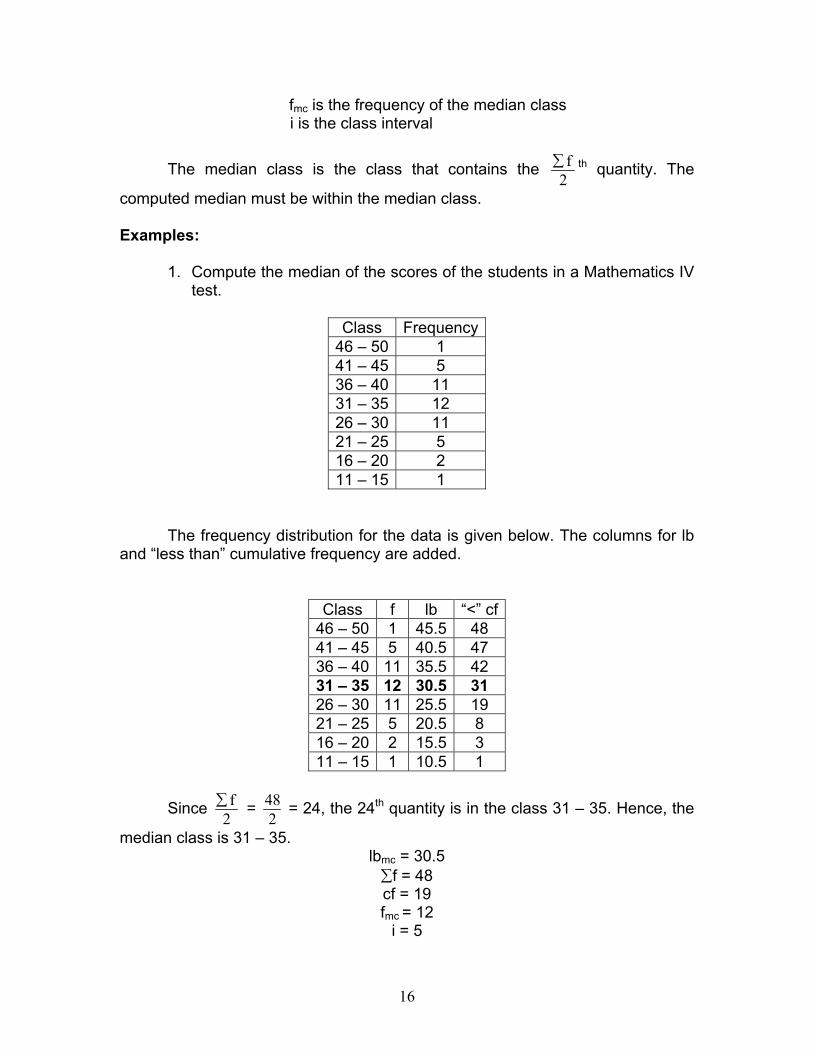
1. Compute the median of the scores of the students in a Mathematics IV test.
Class Frequency
46 – 50 1 41 – 45 5 36 – 40 11 31 – 35 12 26 – 30 11 21 – 25 5 16 – 20 2 11 – 15 1
The frequency distribution for the data is given below. The columns for lb and “less than” cumulative frequency are added.
Class f lb “<” cf46 – 50 1 45.5 48 41 – 45 5 40.5 47 36 – 40 11 35.5 42 31 – 35 12 30.5 31 26 – 30 11 25.5 19 21 – 25 5 20.5 8 16 – 20 2 15.5 3 11 – 15 1 10.5 1
Since f2∑ = 48
2 = 24, the 24th quantity is in the class 31 – 35. Hence, the
median class is 31 – 35. lbmc = 30.5 ∑f = 48 cf = 19 fmc = 12
i = 5
17
mcmc
f cf2Median lb i
f
∑ − = +
48 192Median 30.5 (5)
12
− = +
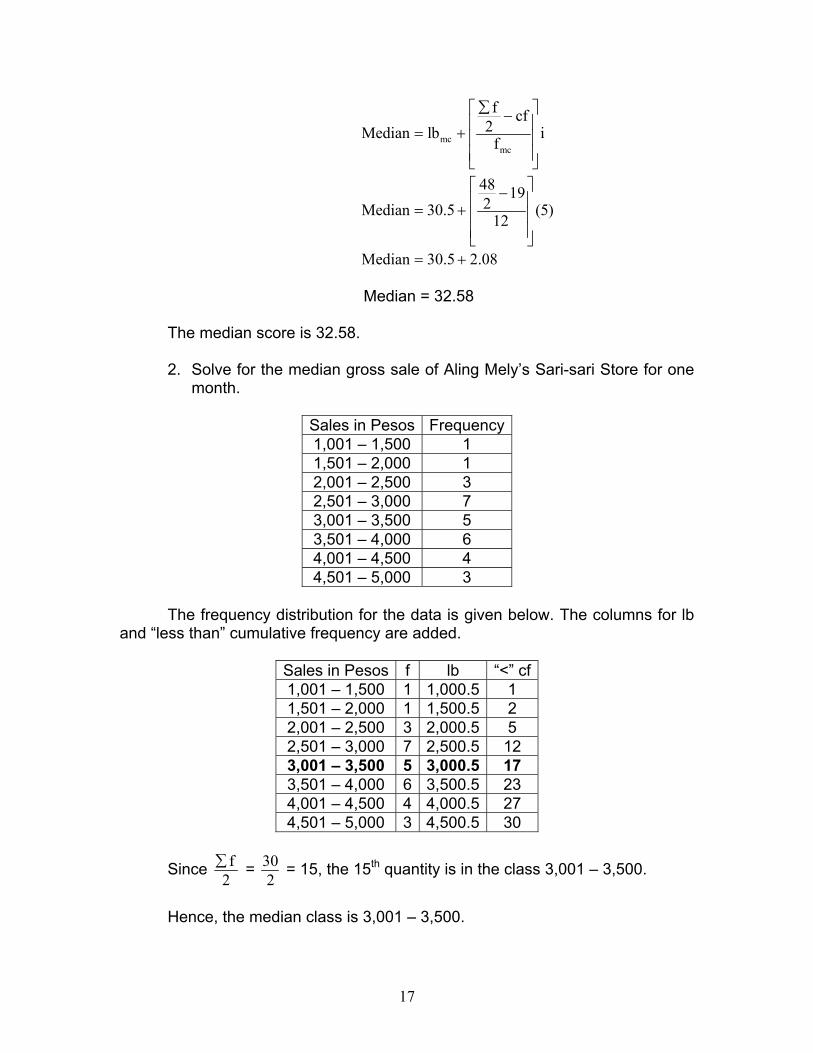
Median 30.5 2.08= + Median = 32.58
The median score is 32.58.
2. Solve for the median gross sale of Aling Mely’s Sari-sari Store for one month.
Sales in Pesos Frequency1,001 – 1,500 1 1,501 – 2,000 1 2,001 – 2,500 3 2,501 – 3,000 7 3,001 – 3,500 5 3,501 – 4,000 6 4,001 – 4,500 4 4,501 – 5,000 3
The frequency distribution for the data is given below. The columns for lb
and “less than” cumulative frequency are added.
Sales in Pesos f lb “<” cf1,001 – 1,500 1 1,000.5 1 1,501 – 2,000 1 1,500.5 2 2,001 – 2,500 3 2,000.5 5 2,501 – 3,000 7 2,500.5 12 3,001 – 3,500 5 3,000.5 17 3,501 – 4,000 6 3,500.5 23 4,001 – 4,500 4 4,000.5 27 4,501 – 5,000 3 4,500.5 30
Since f2∑ = 30
2 = 15, the 15th quantity is in the class 3,001 – 3,500.
Hence, the median class is 3,001 – 3,500.
18
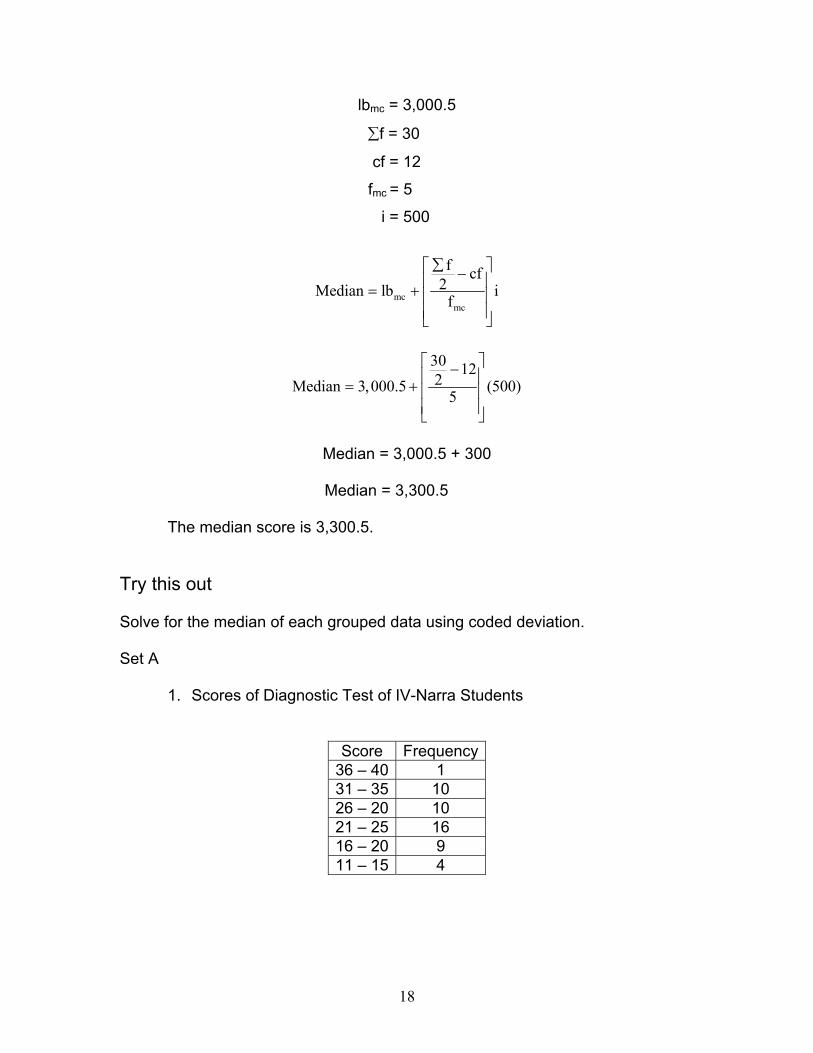
lbmc = 3,000.5
∑f = 30
cf = 12
fmc = 5
i = 500
mcmc
f cf2Median lb i
f
∑ − = +
30 122Median 3,000.5 (500)
5
− = +
Median = 3,000.5 + 300
Median = 3,300.5
The median score is 3,300.5.
Try this out
Solve for the median of each grouped data using coded deviation. Set A
1. Scores of Diagnostic Test of IV-Narra Students
Score Frequency36 – 40 1 31 – 35 10 26 – 20 10 21 – 25 16 16 – 20 9 11 – 15 4
19
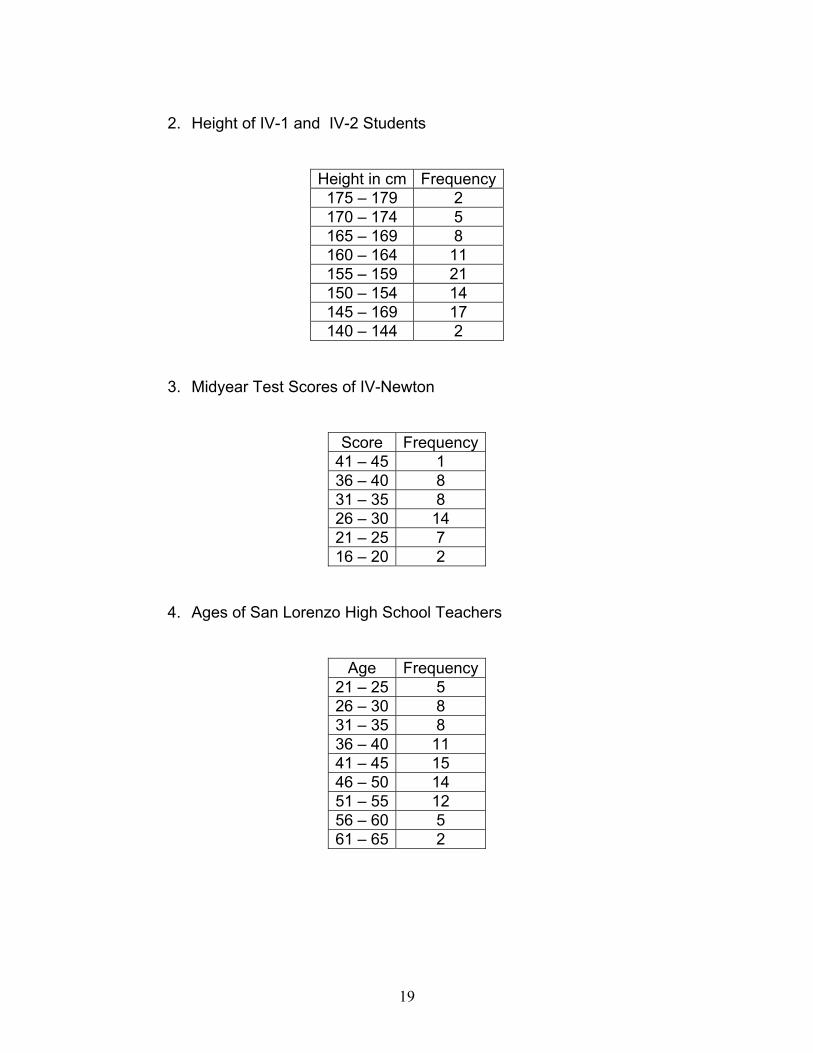
2. Height of IV-1 and IV-2 Students
Height in cm Frequency175 – 179 2 170 – 174 5 165 – 169 8 160 – 164 11 155 – 159 21 150 – 154 14 145 – 169 17 140 – 144 2
3. Midyear Test Scores of IV-Newton
Score Frequency41 – 45 1 36 – 40 8 31 – 35 8 26 – 30 14 21 – 25 7 16 – 20 2
4. Ages of San Lorenzo High School Teachers
Age Frequency21 – 25 5 26 – 30 8 31 – 35 8 36 – 40 11 41 – 45 15 46 – 50 14 51 – 55 12 56 – 60 5 61 – 65 2
20
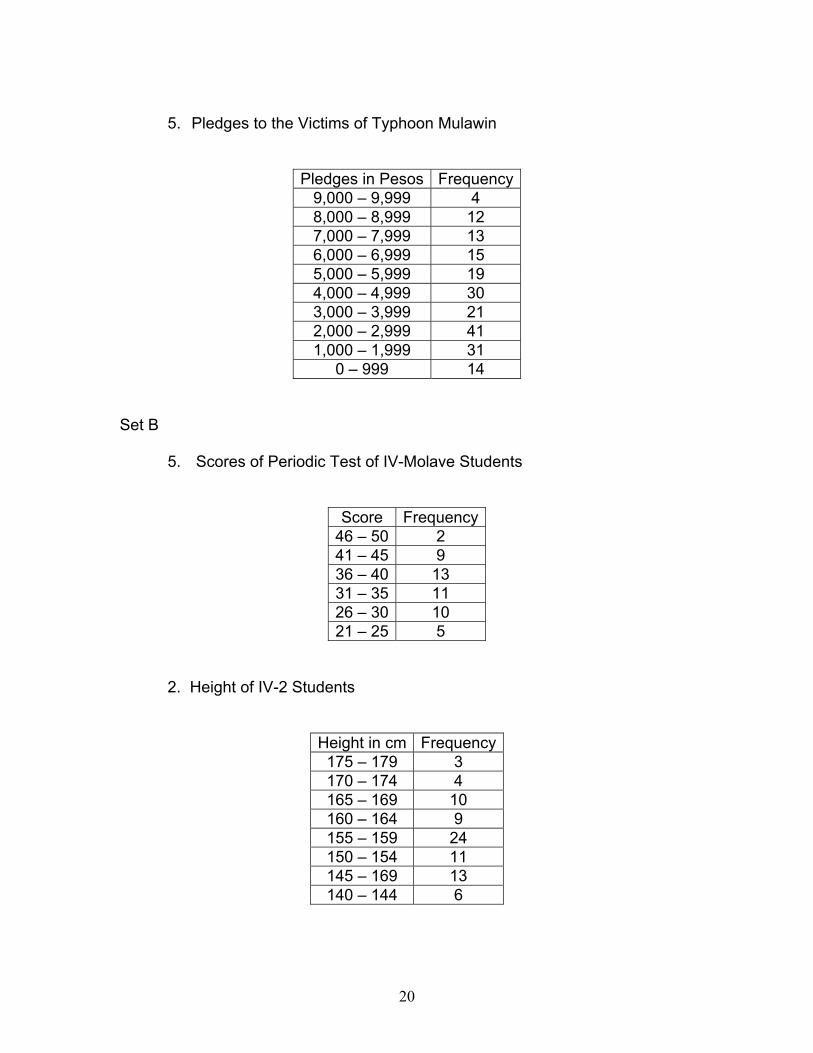
5. Pledges to the Victims of Typhoon Mulawin
Pledges in Pesos Frequency9,000 – 9,999 4 8,000 – 8,999 12 7,000 – 7,999 13 6,000 – 6,999 15 5,000 – 5,999 19 4,000 – 4,999 30 3,000 – 3,999 21 2,000 – 2,999 41 1,000 – 1,999 31
0 – 999 14 Set B
5. Scores of Periodic Test of IV-Molave Students
Score Frequency46 – 50 2 41 – 45 9 36 – 40 13 31 – 35 11 26 – 30 10 21 – 25 5
2. Height of IV-2 Students
Height in cm Frequency175 – 179 3 170 – 174 4 165 – 169 10 160 – 164 9 155 – 159 24 150 – 154 11 145 – 169 13 140 – 144 6
21
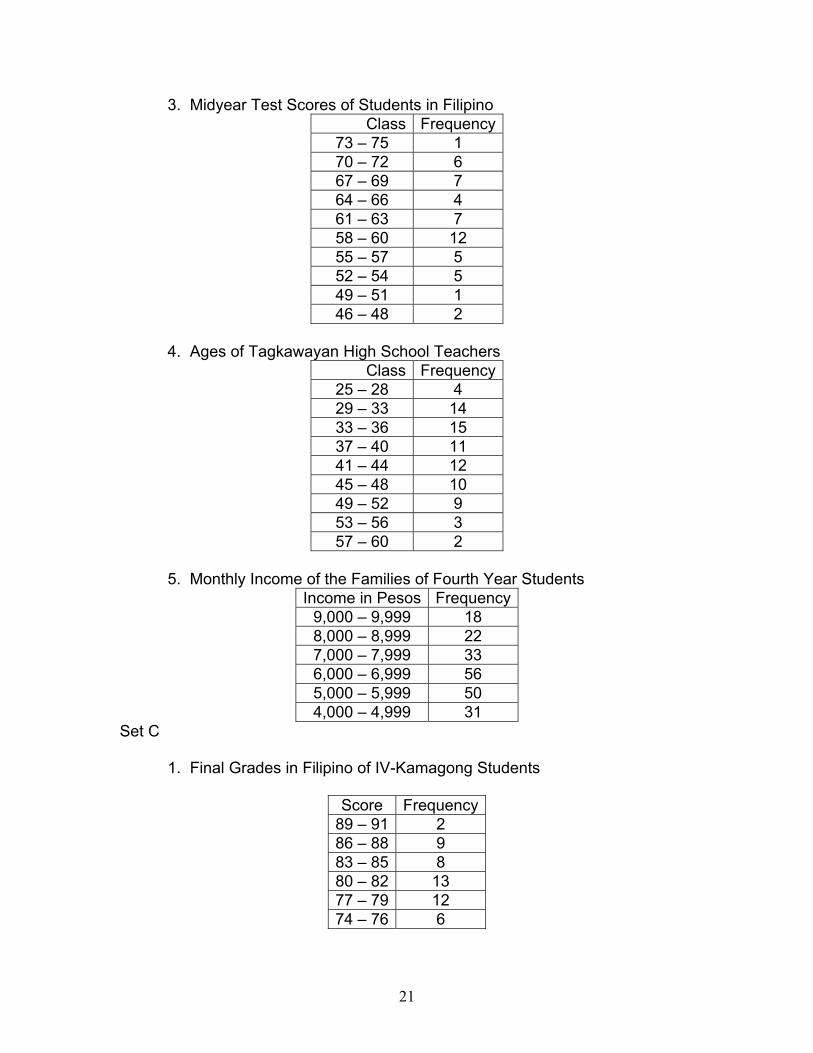
3. Midyear Test Scores of Students in Filipino Class Frequency
73 – 75 1 70 – 72 6 67 – 69 7 64 – 66 4 61 – 63 7 58 – 60 12 55 – 57 5 52 – 54 5 49 – 51 1 46 – 48 2
4. Ages of Tagkawayan High School Teachers
Class Frequency25 – 28 4 29 – 33 14 33 – 36 15 37 – 40 11 41 – 44 12 45 – 48 10 49 – 52 9 53 – 56 3 57 – 60 2
5. Monthly Income of the Families of Fourth Year Students
Income in Pesos Frequency9,000 – 9,999 18 8,000 – 8,999 22 7,000 – 7,999 33 6,000 – 6,999 56 5,000 – 5,999 50 4,000 – 4,999 31
Set C 1. Final Grades in Filipino of IV-Kamagong Students
Score Frequency
89 – 91 2 86 – 88 9 83 – 85 8 80 – 82 13 77 – 79 12 74 – 76 6
22
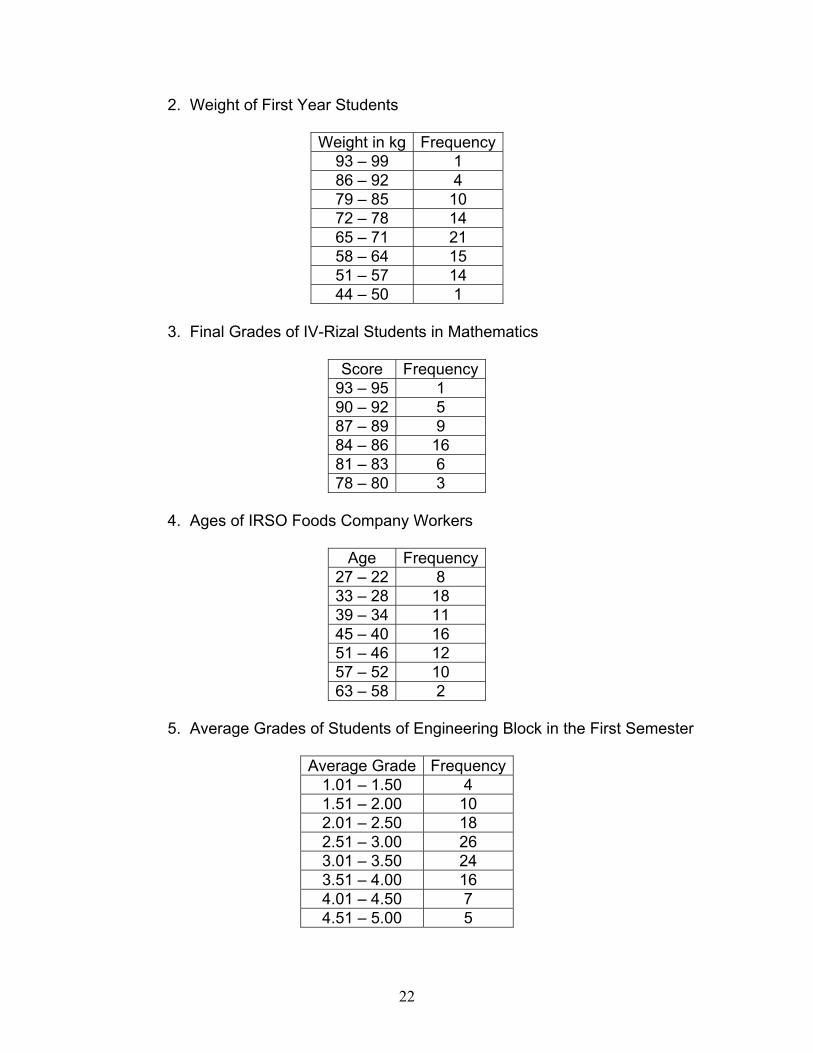
2. Weight of First Year Students
Weight in kg Frequency93 – 99 1 86 – 92 4 79 – 85 10 72 – 78 14 65 – 71 21 58 – 64 15 51 – 57 14 44 – 50 1
3. Final Grades of IV-Rizal Students in Mathematics
Score Frequency
93 – 95 1 90 – 92 5 87 – 89 9 84 – 86 16 81 – 83 6 78 – 80 3
4. Ages of IRSO Foods Company Workers
Age Frequency
27 – 22 8 33 – 28 18 39 – 34 11 45 – 40 16 51 – 46 12 57 – 52 10 63 – 58 2
5. Average Grades of Students of Engineering Block in the First Semester
Average Grade Frequency
1.01 – 1.50 4 1.51 – 2.00 10 2.01 – 2.50 18 2.51 – 3.00 26 3.01 – 3.50 24 3.51 – 4.00 16 4.01 – 4.50 7 4.51 – 5.00 5
23
Lesson 4
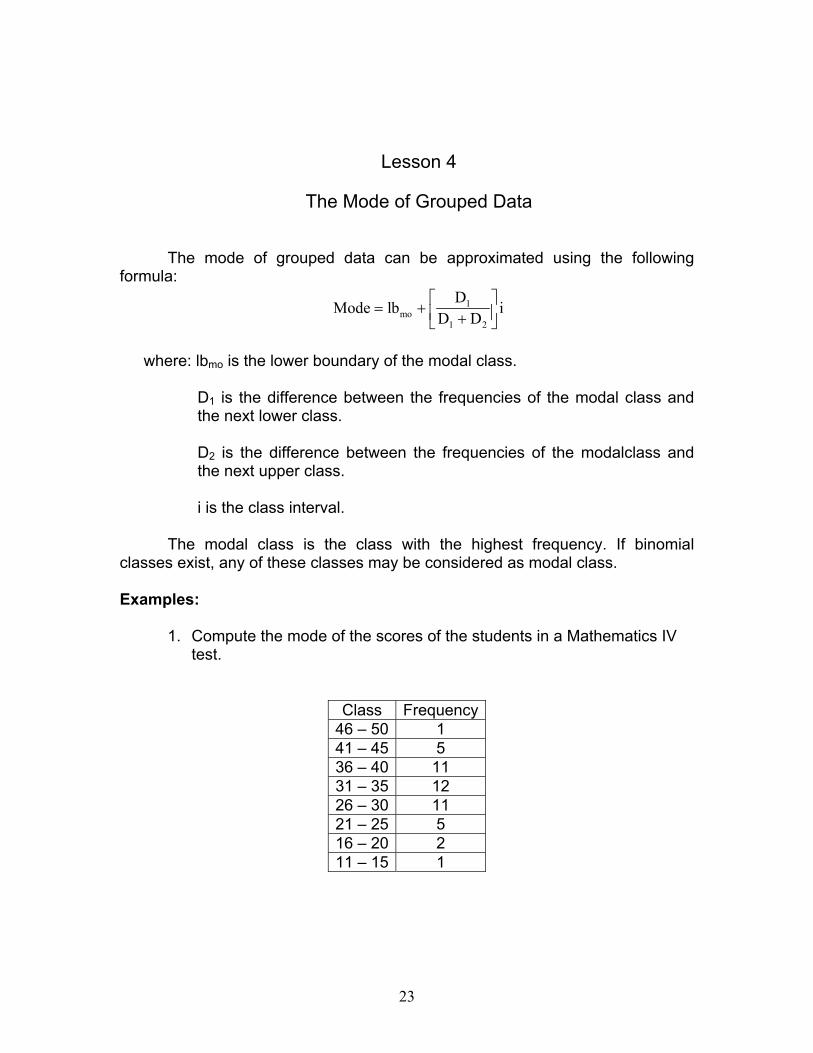
The Mode of Grouped Data
The mode of grouped data can be approximated using the following formula:
1mo
1 2
DMode lb i
D D = + +
where: lbmo is the lower boundary of the modal class.
D1 is the difference between the frequencies of the modal class and the next lower class. D2 is the difference between the frequencies of the modalclass and the next upper class. i is the class interval.
The modal class is the class with the highest frequency. If binomial classes exist, any of these classes may be considered as modal class. Examples:
1. Compute the mode of the scores of the students in a Mathematics IV
test.
Class Frequency46 – 50 1 41 – 45 5 36 – 40 11 31 – 35 12 26 – 30 11 21 – 25 5 16 – 20 2 11 – 15 1
24
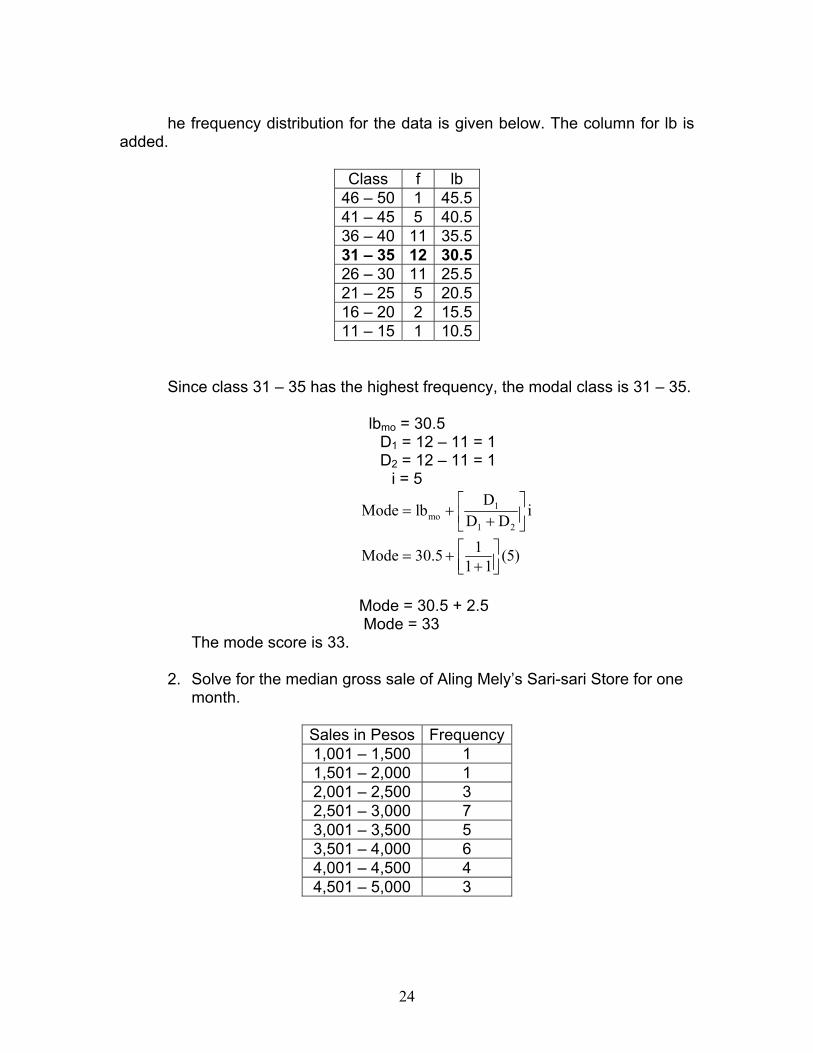
he frequency distribution for the data is given below. The column for lb is
added.
Class f lb 46 – 50 1 45.541 – 45 5 40.536 – 40 11 35.531 – 35 12 30.526 – 30 11 25.521 – 25 5 20.516 – 20 2 15.511 – 15 1 10.5
Since class 31 – 35 has the highest frequency, the modal class is 31 – 35.
lbmo = 30.5 D1 = 12 – 11 = 1 D2 = 12 – 11 = 1
i = 5
1mo
1 2
DMode lb i
D D = + +
1Mode 30.5 (5)1 1 = + +
Mode = 30.5 + 2.5 Mode = 33
The mode score is 33.
2. Solve for the median gross sale of Aling Mely’s Sari-sari Store for one month.
Sales in Pesos Frequency1,001 – 1,500 1 1,501 – 2,000 1 2,001 – 2,500 3 2,501 – 3,000 7 3,001 – 3,500 5 3,501 – 4,000 6 4,001 – 4,500 4 4,501 – 5,000 3
25
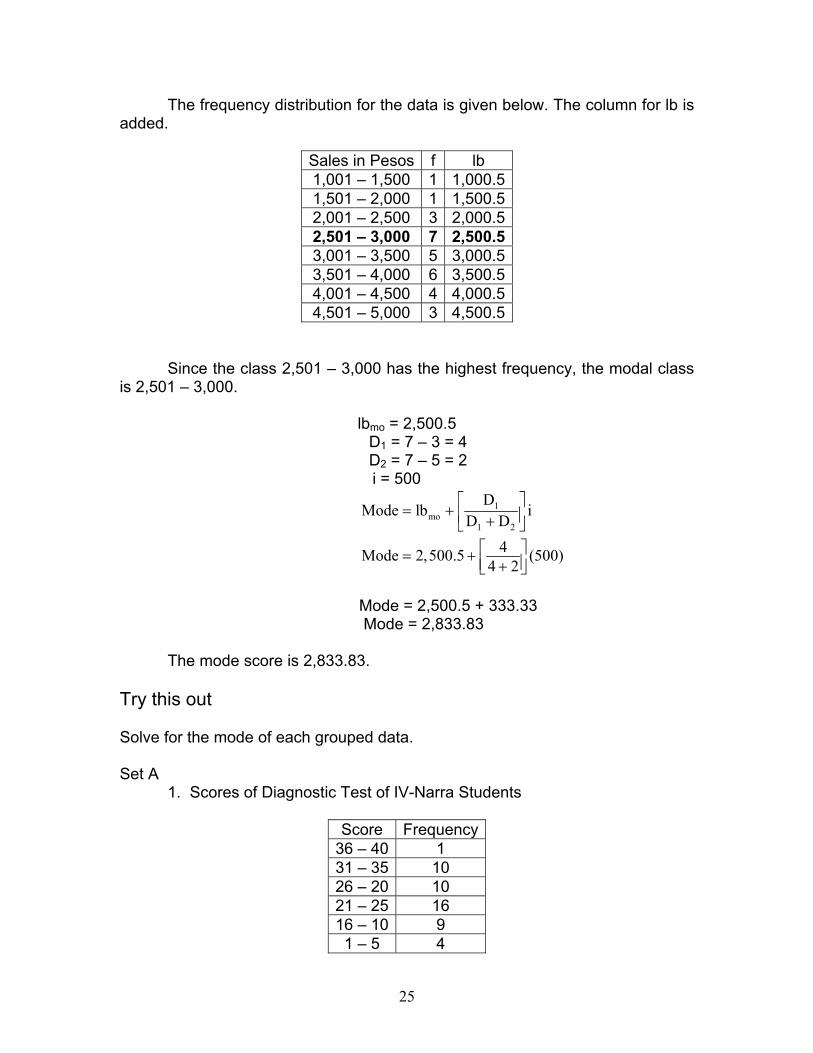
The frequency distribution for the data is given below. The column for lb is added.
Sales in Pesos f lb 1,001 – 1,500 1 1,000.51,501 – 2,000 1 1,500.52,001 – 2,500 3 2,000.52,501 – 3,000 7 2,500.53,001 – 3,500 5 3,000.53,501 – 4,000 6 3,500.54,001 – 4,500 4 4,000.54,501 – 5,000 3 4,500.5
Since the class 2,501 – 3,000 has the highest frequency, the modal class is 2,501 – 3,000.
lbmo = 2,500.5
D1 = 7 – 3 = 4 D2 = 7 – 5 = 2
i = 500
1mo
1 2
DMode lb i
D D = + +
4Mode 2,500.5 (500)4 2 = + +
Mode = 2,500.5 + 333.33 Mode = 2,833.83
The mode score is 2,833.83.
Try this out
Solve for the mode of each grouped data. Set A 1. Scores of Diagnostic Test of IV-Narra Students
Score Frequency
36 – 40 1 31 – 35 10 26 – 20 10 21 – 25 16 16 – 10 9 1 – 5 4
26
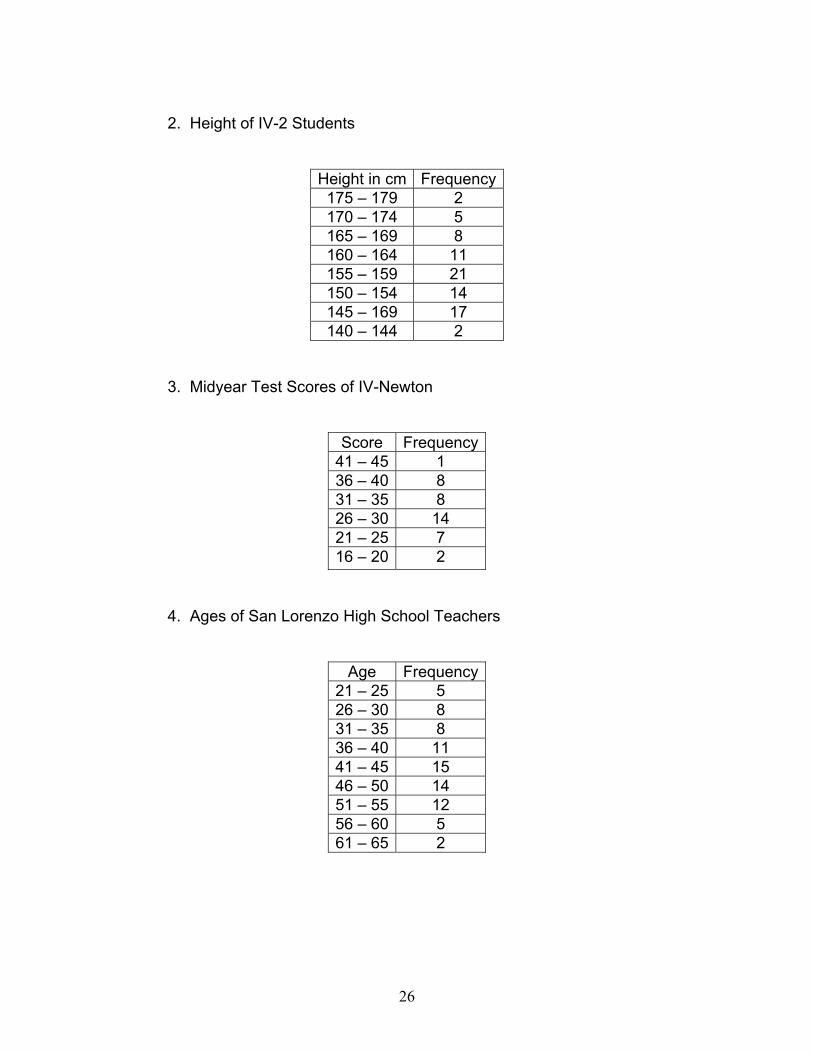
2. Height of IV-2 Students
Height in cm Frequency175 – 179 2 170 – 174 5 165 – 169 8 160 – 164 11 155 – 159 21 150 – 154 14 145 – 169 17 140 – 144 2
3. Midyear Test Scores of IV-Newton
Score Frequency
41 – 45 1 36 – 40 8 31 – 35 8 26 – 30 14 21 – 25 7 16 – 20 2
4. Ages of San Lorenzo High School Teachers
Age Frequency
21 – 25 5 26 – 30 8 31 – 35 8 36 – 40 11 41 – 45 15 46 – 50 14 51 – 55 12 56 – 60 5 61 – 65 2
27
5. Pledges to the Victims of Typhoon Mulawin
Pledges in Pesos Frequency9,000 – 9,999 4 8,000 – 8,999 12 7,000 – 7,999 13 6,000 – 6,999 15 5,000 – 5,999 19 4,000 – 4,999 30 3,000 – 3,999 21 2,000 – 2,999 41 1,000 – 1,999 31
0 – 999 14
Set B 1. Scores of Periodic Test of IV-Molave Students
Score Frequency46 – 50 2 41 – 45 9 36 – 40 13 31 – 35 11 26 – 30 10 21 – 25 5
2. Height of IV-2 Students
Height in cm Frequency175 – 179 3 170 – 174 4 165 – 169 10 160 – 164 9 155 – 159 24 150 – 154 11 145 – 169 13 140 – 144 6
28
3. Midyear Test Scores of Students in English
Class Frequency91 – 95 1 86 – 90 6 81 – 85 7 76 – 80 4 71 – 75 7 66 – 70 12 61 – 65 5 56 – 80 5 51 – 55 1 46 – 50 2
4. Ages of Sta. Barbara High School Teachers
Class Frequency21 – 25 4 26 – 30 14 31 – 35 15 36 – 40 11 41 – 45 12 46 – 50 10 51 – 55 9 56 – 60 3 61 – 65 1
5. Monthly Income of the Families of Fourth Year Students
Income in Pesos Frequency9,000 – 9,999 18 8,000 – 8,999 22 7,000 – 7,999 33 6,000 – 6,999 56 5,000 – 5,999 50 4,000 – 4,999 31
29
Set C 1. Scores of Achievement Test in Filipino of IV-Kamagong Students
Score Frequency86 – 90 2 81 – 85 9 76 – 80 8 71 – 75 13 66 – 60 12 61 – 65 6
2. Weight of First Year Students
Weight in kg Frequency75 – 79 1 70 – 74 4 65 – 69 10 60 – 64 14 55 – 59 21 50 – 54 15 45 – 69 14 40 – 44 1
3. Final Test Scores of IV-Rizal
Score Frequency91 – 95 1 86 – 90 5 81 – 85 9 76 – 80 16 71 – 75 6 56 – 70 3
4. Ages of Seniro Factory Employees
Age Frequency21 – 25 8 26 – 30 18 31 – 35 11 36 – 40 16 41 – 45 12 46 – 50 10 51 – 55 2 56 – 60 2 61 – 65 1
30
5. Average Grades of Students of Engineering Block in the First
Semester
Average Grade Frequency1.01 – 1.50 4 1.51 – 2.00 10 2.01 – 2.50 18 2.51 – 3.00 26 3.01 – 3.50 24 3.51 – 4.00 16 4.01 – 4.50 7 4.51 – 5.00 5
Let’s summarize
1. When the number of items in a set of data is too big, items are grouped for
convenience. The manner of computing for the mean of grouped data is given by the formula:
(fX)Meanf
∑=
∑
where: f is the frequency of each class
X is the class mark of class
2. An alternative formula for computing the mean of grouped data makes use of coded deviation:
(fd)Mean A.M. i
f∑ = + ∑
where: A.M. is the assumed mean
f is the frequency of each class
d is the coded deviation from A.M.
i is the class interval
Any class mark can be considered as assumed mean. But it is convenient to choose the class mark with the highest frequency. The class chosen to contain A.M. is given a 0 deviation. Subsequently, consecutive positive integers are assigned to the classes upward and negative integers to the classes downward.
.
31
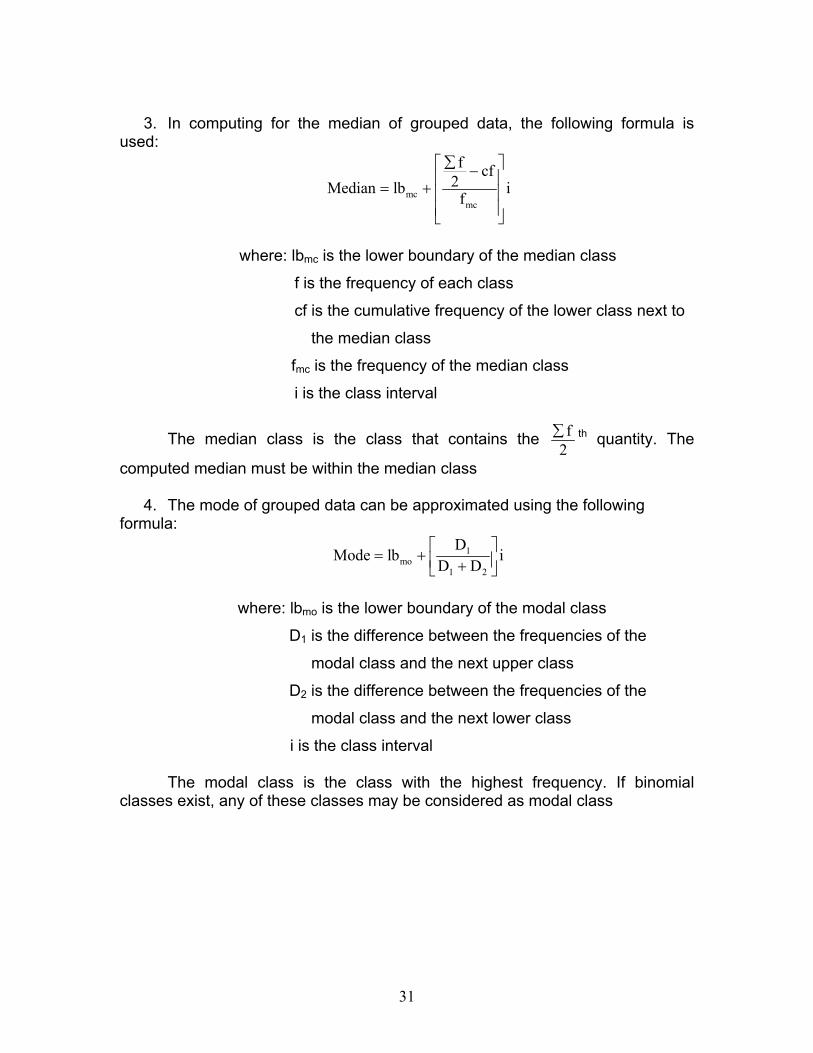
3. In computing for the median of grouped data, the following formula is
used:
mcmc
f cf2Median lb i
f
∑ − = +
where: lbmc is the lower boundary of the median class
f is the frequency of each class
cf is the cumulative frequency of the lower class next to
the median class
fmc is the frequency of the median class
i is the class interval
The median class is the class that contains the f2∑ th quantity. The
computed median must be within the median class 4. The mode of grouped data can be approximated using the following
formula: 1
mo1 2
DMode lb i
D D = + +
where: lbmo is the lower boundary of the modal class
D1 is the difference between the frequencies of the
modal class and the next upper class
D2 is the difference between the frequencies of the
modal class and the next lower class
i is the class interval
The modal class is the class with the highest frequency. If binomial classes exist, any of these classes may be considered as modal class
32
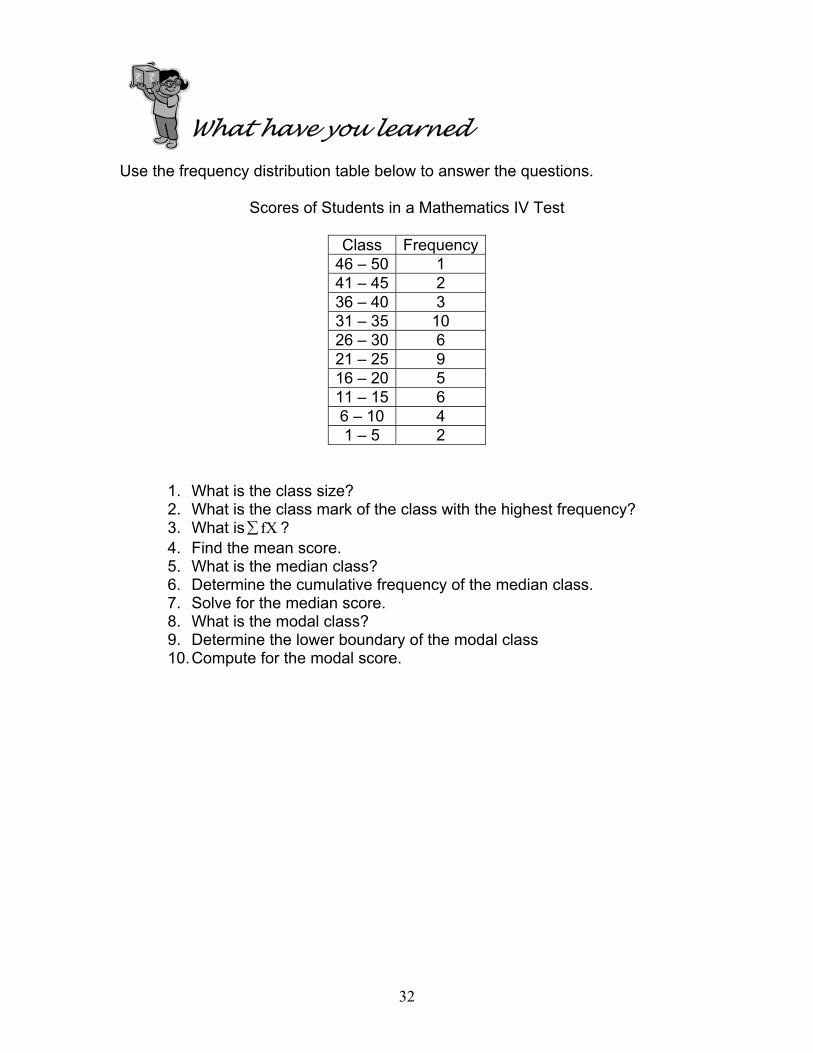
What have you learned
Use the frequency distribution table below to answer the questions.
Scores of Students in a Mathematics IV Test
Class Frequency46 – 50 1 41 – 45 2 36 – 40 3 31 – 35 10 26 – 30 6 21 – 25 9 16 – 20 5 11 – 15 6 6 – 10 4 1 – 5 2
1. What is the class size? 2. What is the class mark of the class with the highest frequency? 3. What is fX∑ ? 4. Find the mean score. 5. What is the median class? 6. Determine the cumulative frequency of the median class. 7. Solve for the median score. 8. What is the modal class? 9. Determine the lower boundary of the modal class 10. Compute for the modal score.
33
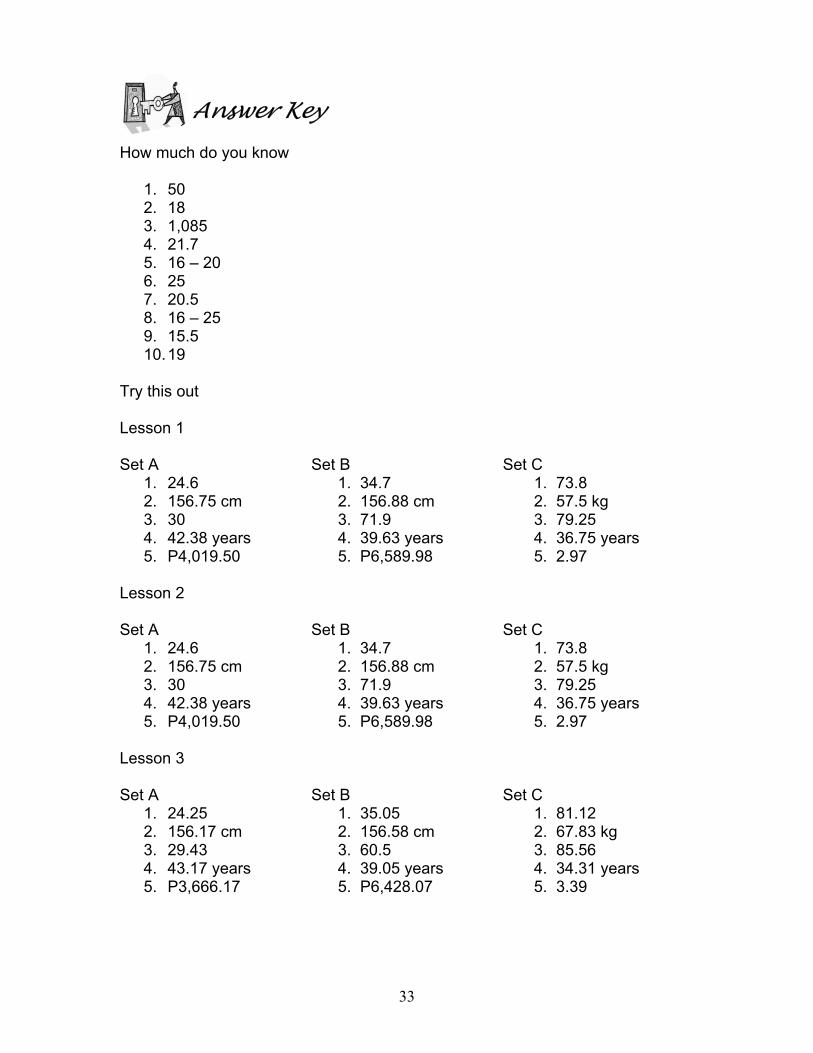
Answer Key How much do you know
1. 50 2. 18 3. 1,085 4. 21.7 5. 16 – 20 6. 25 7. 20.5 8. 16 – 25 9. 15.5 10. 19
Try this out Lesson 1 Set A Set B Set C
1. 24.6 1. 34.7 1. 73.8 2. 156.75 cm 2. 156.88 cm 2. 57.5 kg 3. 30 3. 71.9 3. 79.25 4. 42.38 years 4. 39.63 years 4. 36.75 years 5. P4,019.50 5. P6,589.98 5. 2.97
Lesson 2 Set A Set B Set C
1. 24.6 1. 34.7 1. 73.8 2. 156.75 cm 2. 156.88 cm 2. 57.5 kg 3. 30 3. 71.9 3. 79.25 4. 42.38 years 4. 39.63 years 4. 36.75 years 5. P4,019.50 5. P6,589.98 5. 2.97
Lesson 3 Set A Set B Set C
1. 24.25 1. 35.05 1. 81.12 2. 156.17 cm 2. 156.58 cm 2. 67.83 kg 3. 29.43 3. 60.5 3. 85.56 4. 43.17 years 4. 39.05 years 4. 34.31 years 5. P3,666.17 5. P6,428.07 5. 3.39
34
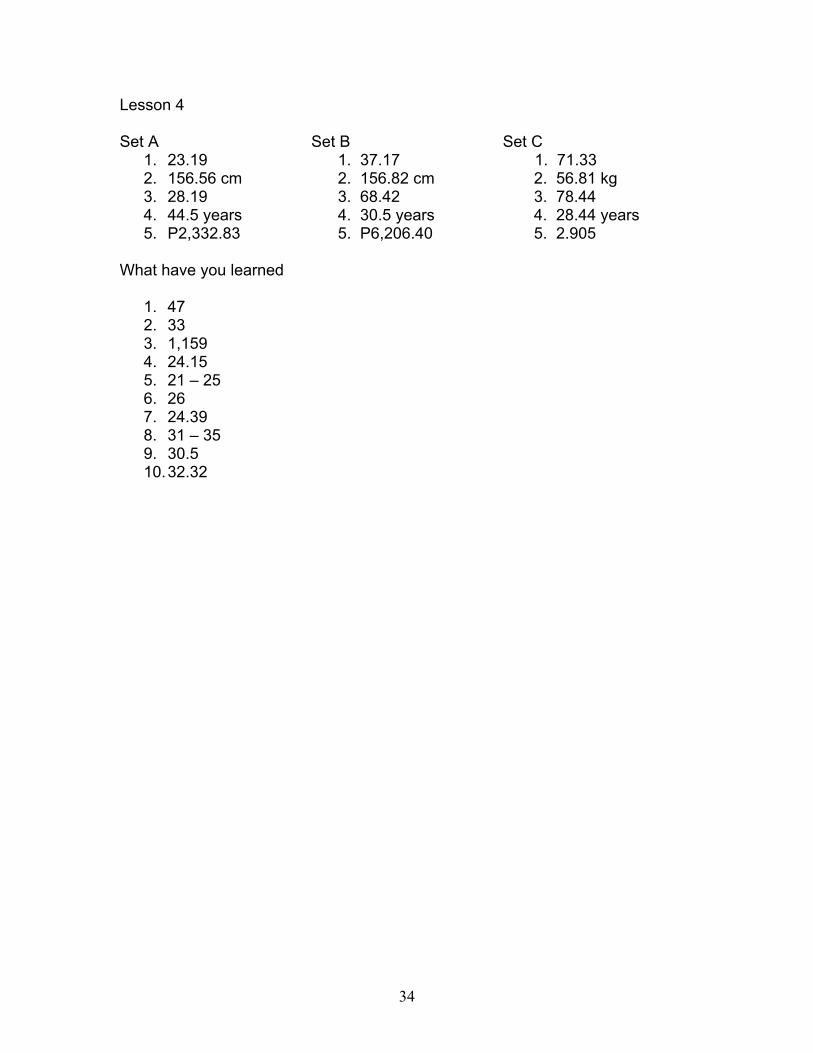
Lesson 4 Set A Set B Set C
1. 23.19 1. 37.17 1. 71.33 2. 156.56 cm 2. 156.82 cm 2. 56.81 kg 3. 28.19 3. 68.42 3. 78.44 4. 44.5 years 4. 30.5 years 4. 28.44 years 5. P2,332.83 5. P6,206.40 5. 2.905
What have you learned
1. 47 2. 33 3. 1,159 4. 24.15 5. 21 – 25 6. 26 7. 24.39 8. 31 – 35 9. 30.5 10. 32.32