Embed Size (px)
Citation preview
Models and UncertaintyNGWA Environmental Law ConferenceDublin, Ohio July 25, 2007
Todd R. CrawfordCrawford Independent Analysts
Dr. Willem A. SchreüderPrincipia Mathematica
Uncertainty
A measurement of the state of knowledge of the error
Absolute error is unknowable Uncertainty may be expressed as Confidence
Interval The 95% CI of X is y,z …95% of the measurements of X will fall between
the values of y and z Uncertainty statements are not used often
enough in environmental investigations!
Models
A representation of the situation using the best available knowledge
Combine known factors with unknown factors Use models to fill in the site-specific
knowledge gaps with reasonable values Increased knowledge is associated with
increased costs Caveat emptor! GIGO
Monte Carlo
MC Method – a procedure using random numbers and probability to solve problems
MC Simulation – a method of iteratively evaluating a model using sets of random numbers as inputs
Excellent overview and application notes: Wittwer J.W., “Monte Carlo Simulation
Basics” from Vertex24.com, June 1, 2004 http://vertex24.com/ExcelArticles/mc/MonteCarloSimulation.html
NGWA Environmental Law Conference 2006 – Review Uncertainty Approach to the Johnson and
Ettinger Vapor Intrusion Model – Schreüder 2006
A Monte Carlo simulation of the J&E Model was demonstrated
The simulation was evaluated on a dataset from a large vapor intrusion investigation
In general, the comparison between the predicted and observed concentrations was quite favorable
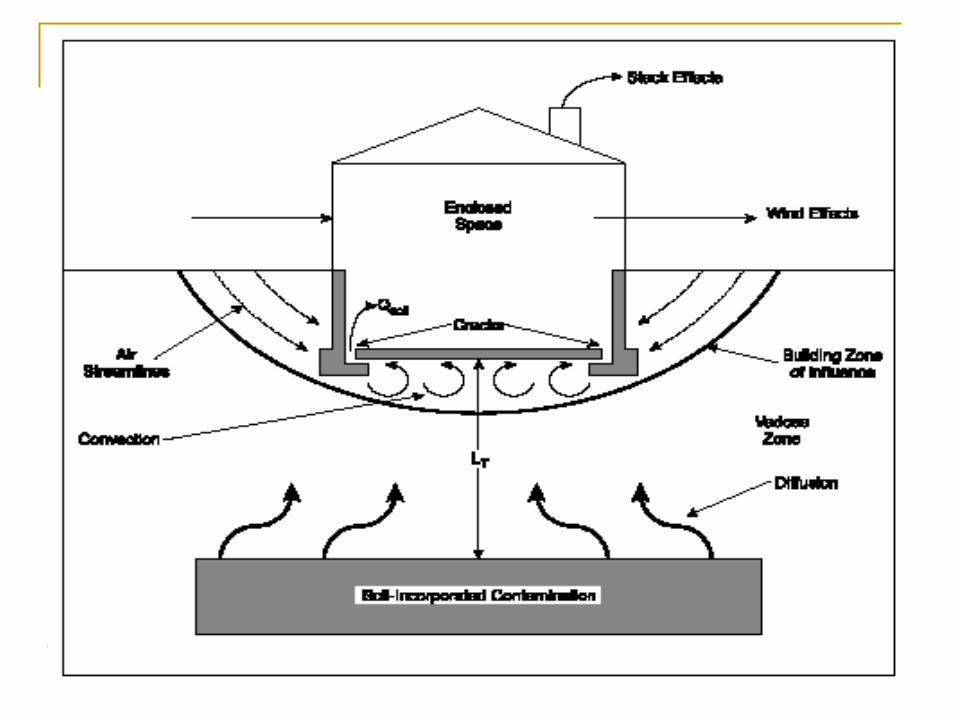
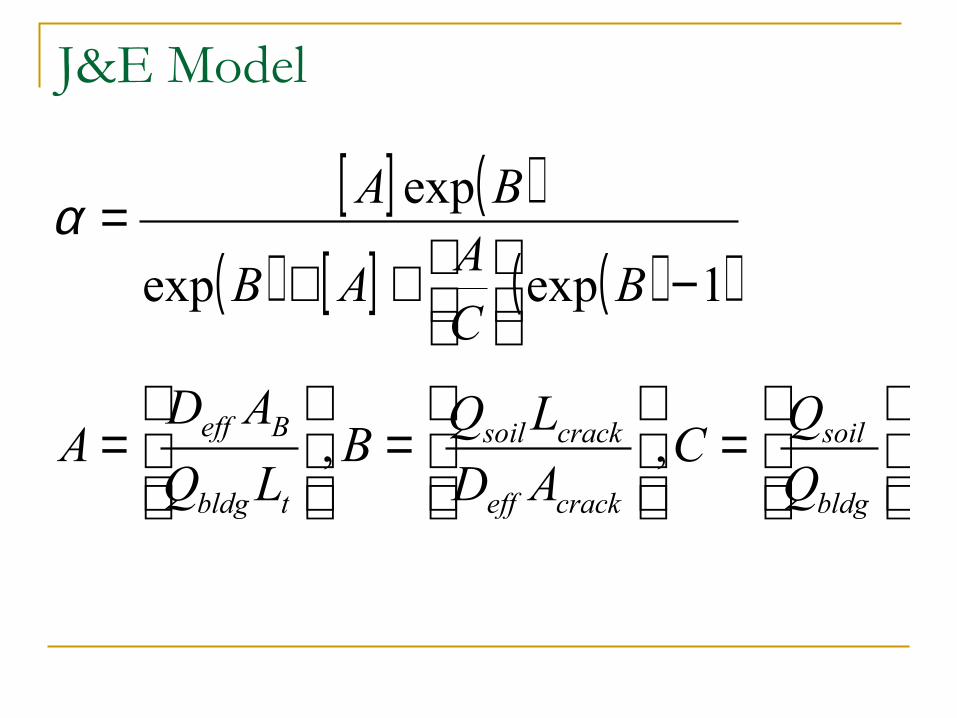
J&E Model
[ ] ( )( ) [ ] ( )( )
=
=
=
−
++
=
bldg
soil
crackeff
cracksoil
tbldg
Beff
Q
QC
AD
LQB
LQ
ADA
BCA
AB
BA
,,
1expexp
expα
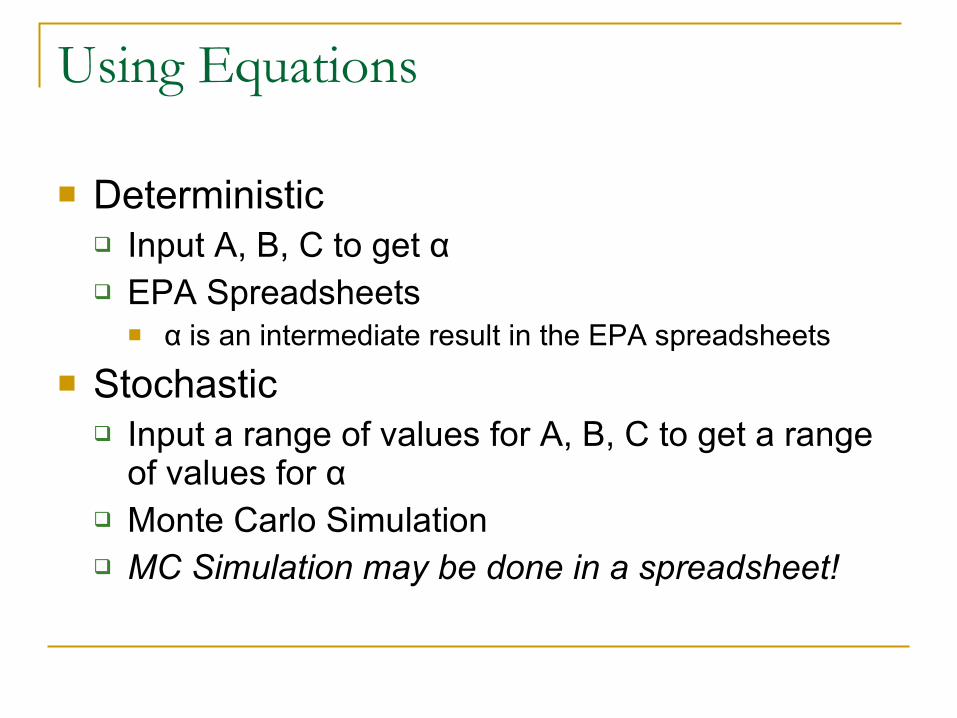
Using Equations
Deterministic Input A, B, C to get α EPA Spreadsheets
α is an intermediate result in the EPA spreadsheets
Stochastic Input a range of values for A, B, C to get a range
of values for α Monte Carlo Simulation MC Simulation may be done in a spreadsheet!
A Deterministic Approach
Use EPA spreadsheets Input best case values Input worst case values May span several orders of magnitude Almost certainly, the results will not match the
on-site observations
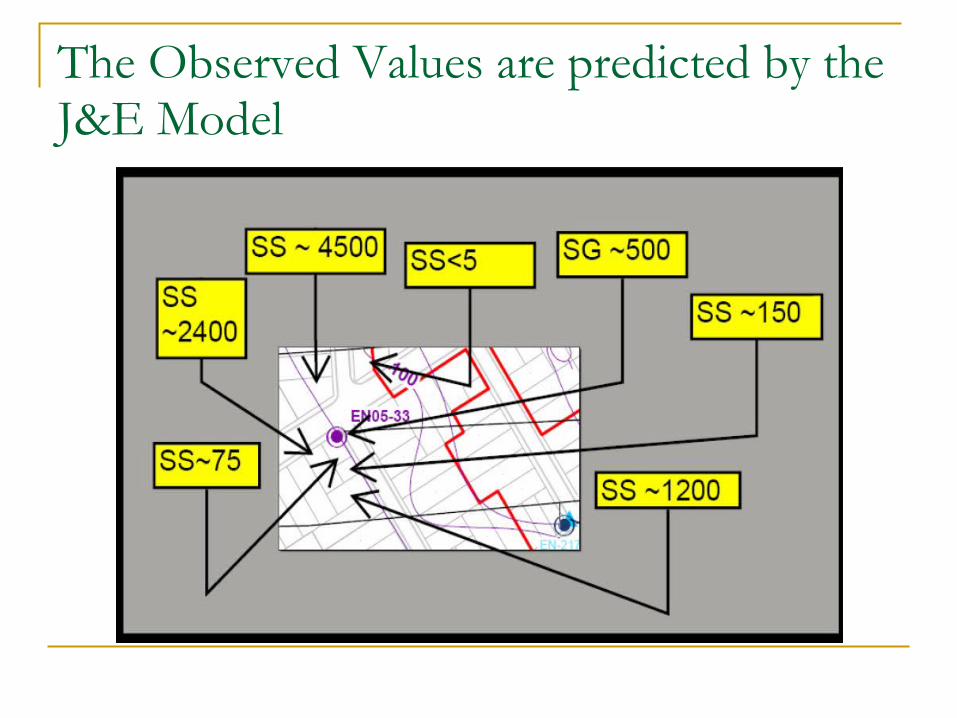
The Observed Values are predicted by the J&E Model
What’s the Most Likely Result? Calculate whether all of
Jessica Simpson’s clothes will suddenly jump off her body!
Getting an output doesn’t mean we will get that result!
Getting Reasonable Values for α
Need to have reasonable inputs Johnson 2005, “Identification of Application-
Specific Critical Inputs for the 1991 Johnson and Ettinger Vapor Intrusion Algorithm” Groundwater Monitoring and Remediation 25:63-78
EPA 2004, “User’s Guide for Evaluating Subsurface Vapor Intrusion into Buildings”
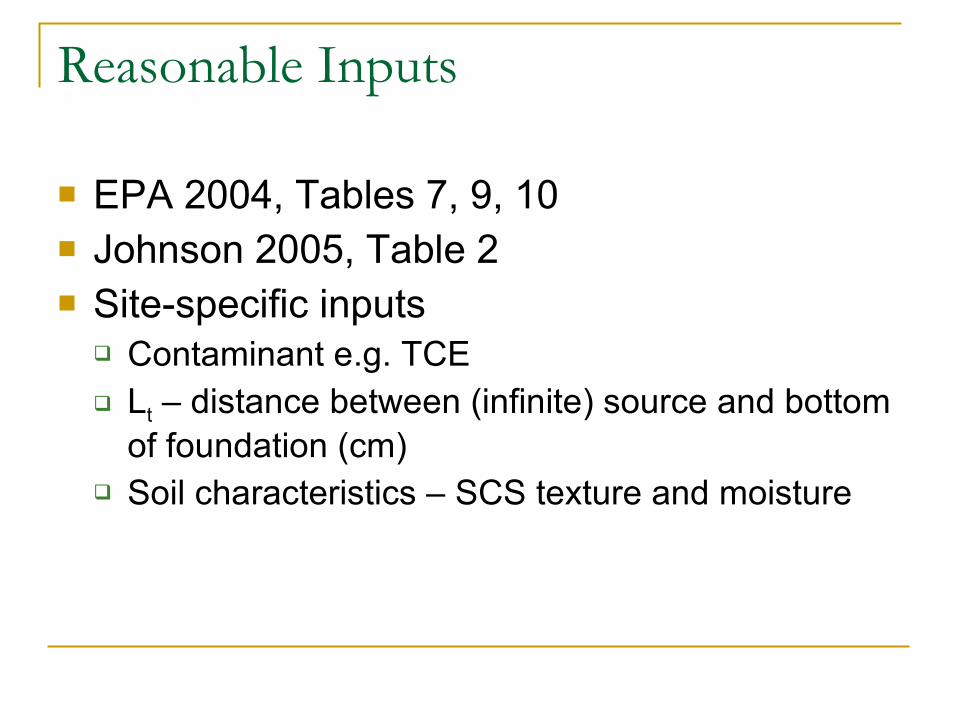
Reasonable Inputs
EPA 2004, Tables 7, 9, 10 Johnson 2005, Table 2 Site-specific inputs
Contaminant e.g. TCE Lt – distance between (infinite) source and bottom
of foundation (cm) Soil characteristics – SCS texture and moisture
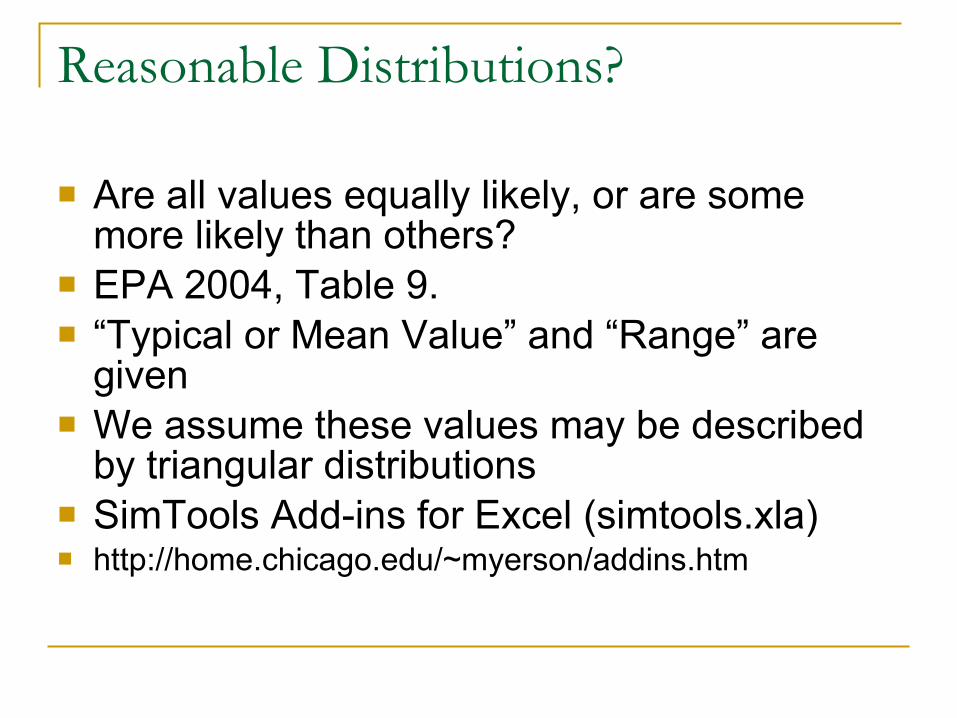
Reasonable Distributions?
Are all values equally likely, or are some more likely than others?
EPA 2004, Table 9. “Typical or Mean Value” and “Range” are
given We assume these values may be described
by triangular distributions SimTools Add-ins for Excel (simtools.xla) http://home.chicago.edu/~myerson/addins.htm
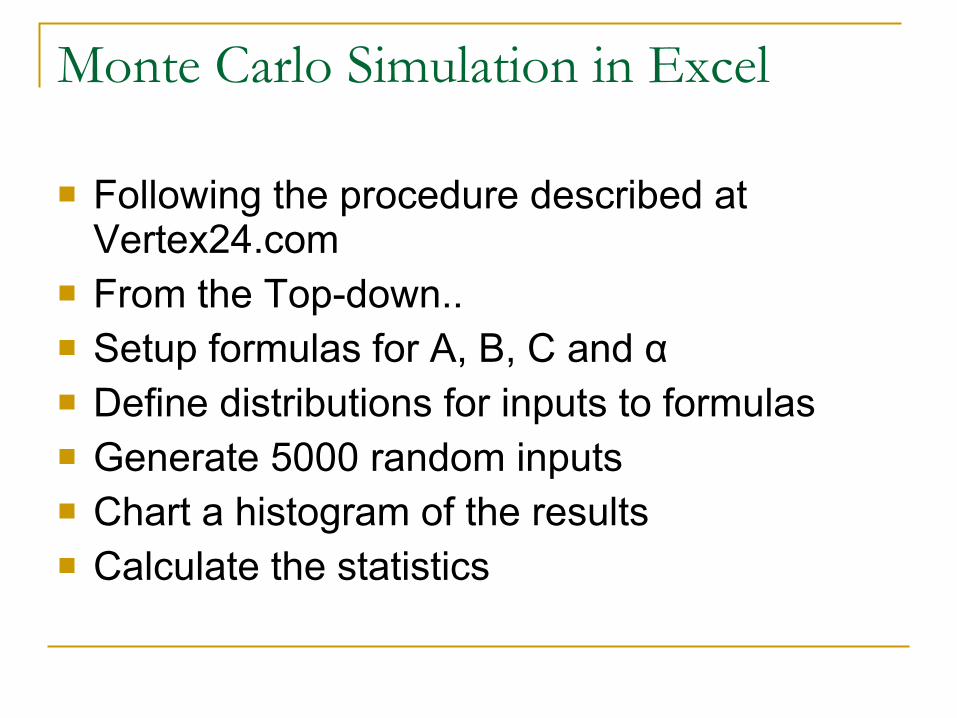
Monte Carlo Simulation in Excel
Following the procedure described at Vertex24.com
From the Top-down.. Setup formulas for A, B, C and α Define distributions for inputs to formulas Generate 5000 random inputs Chart a histogram of the results Calculate the statistics
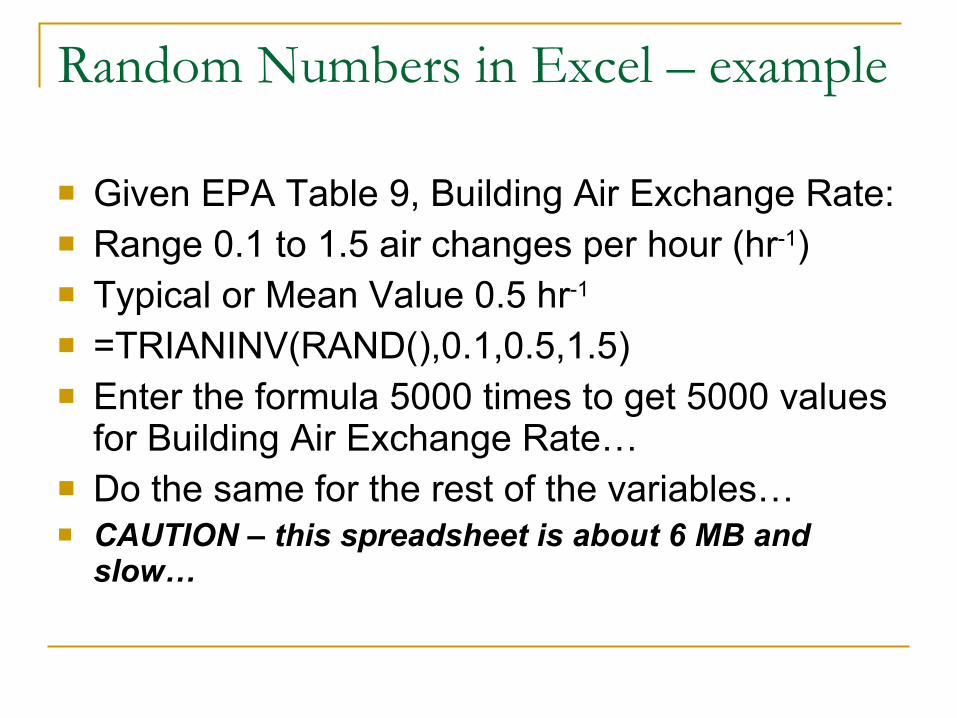
Random Numbers in Excel – example
Given EPA Table 9, Building Air Exchange Rate: Range 0.1 to 1.5 air changes per hour (hr-1) Typical or Mean Value 0.5 hr-1
=TRIANINV(RAND(),0.1,0.5,1.5) Enter the formula 5000 times to get 5000 values
for Building Air Exchange Rate… Do the same for the rest of the variables… CAUTION – this spreadsheet is about 6 MB and
slow…
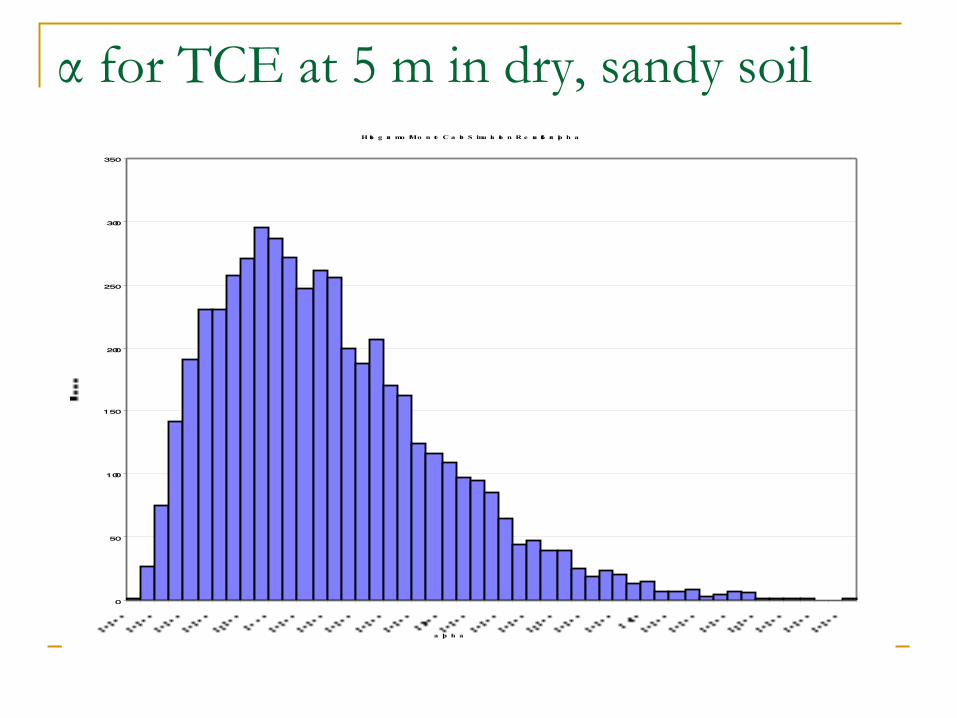
α for TCE at 5 m in dry, sandy soil H isto g ra mo fMo n te C a rlo S imu la tio n R e su ltsfo ra lp h a
0
50
100
150
200
250
300
350
a lp h a
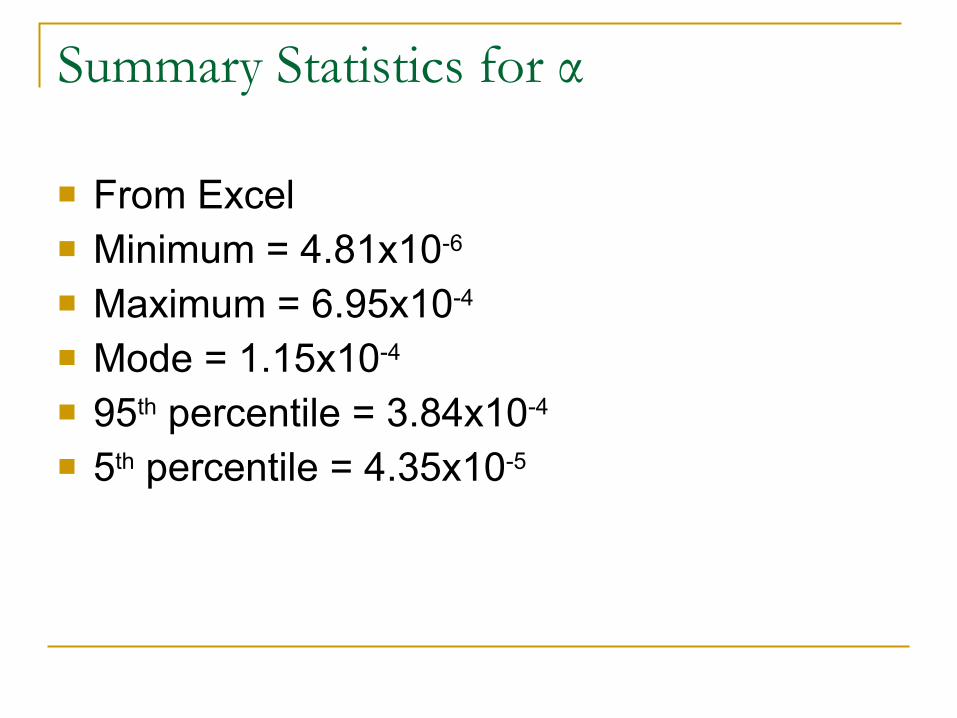
Summary Statistics for α
From Excel Minimum = 4.81x10⁻⁶
Maximum = 6.95x10⁻⁴
Mode = 1.15x10⁻⁴
95th percentile = 3.84x10⁻⁴
5th percentile = 4.35x10⁻⁵
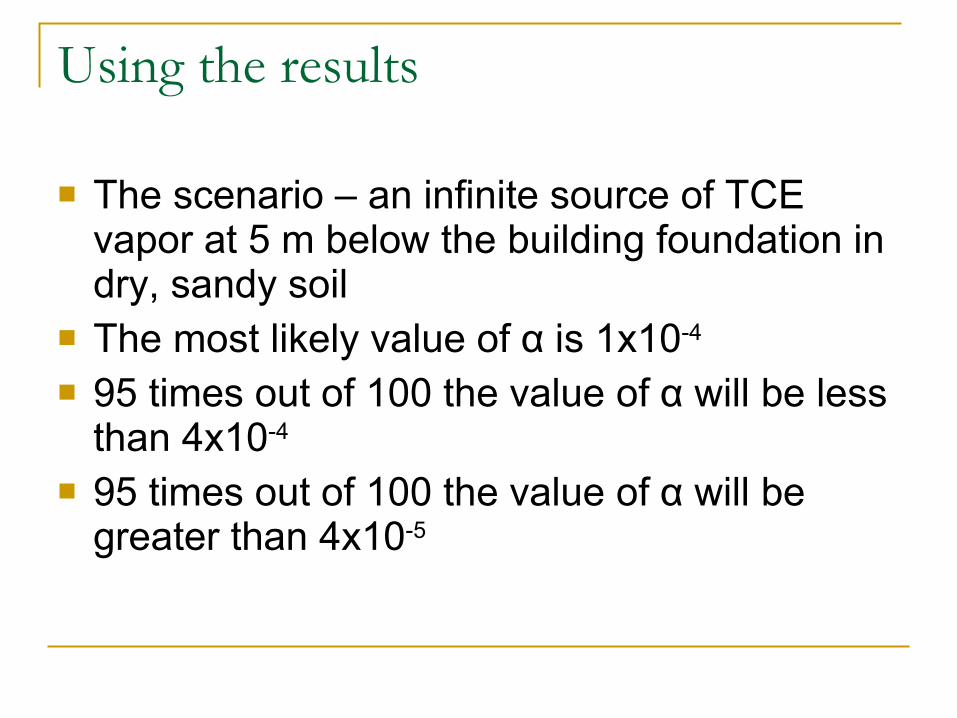
Using the results
The scenario – an infinite source of TCE vapor at 5 m below the building foundation in dry, sandy soil
The most likely value of α is 1x10⁻⁴
95 times out of 100 the value of α will be less than 4x10⁻⁴
95 times out of 100 the value of α will be greater than 4x10⁻⁵
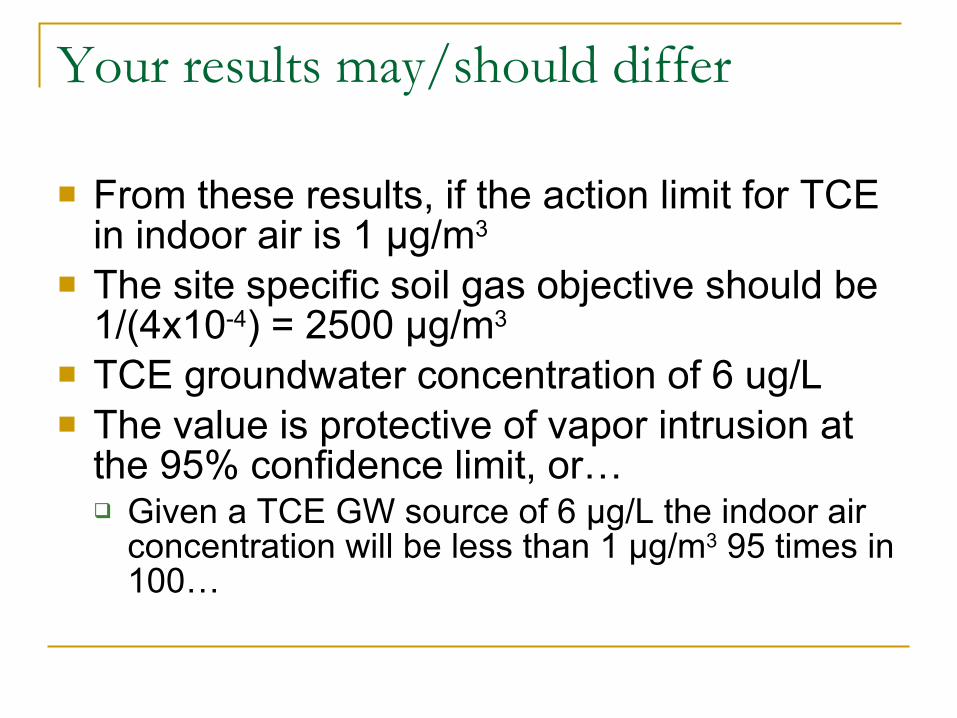
Your results may/should differ
From these results, if the action limit for TCE in indoor air is 1 μg/m3
The site specific soil gas objective should be 1/(4x10-4) = 2500 μg/m3
TCE groundwater concentration of 6 ug/L The value is protective of vapor intrusion at
the 95% confidence limit, or… Given a TCE GW source of 6 μg/L the indoor air
concentration will be less than 1 μg/m3 95 times in 100…
To Do List
Simplify the spreadsheet (use a macro to run the calculation more times without tying up the spreadsheet…)
Verify the calculations are correct Consistently state confidence intervals when
using the J&E Model