Embed Size (px)
Citation preview

TRAINING WEBINARJULY 2015
Audio : use your microphone and speakers (VoIP) or call in using your phonePhone: 1- 646-307-1716Access Code: 422-060-040Audio PIN: Shown after joining the webinar
2
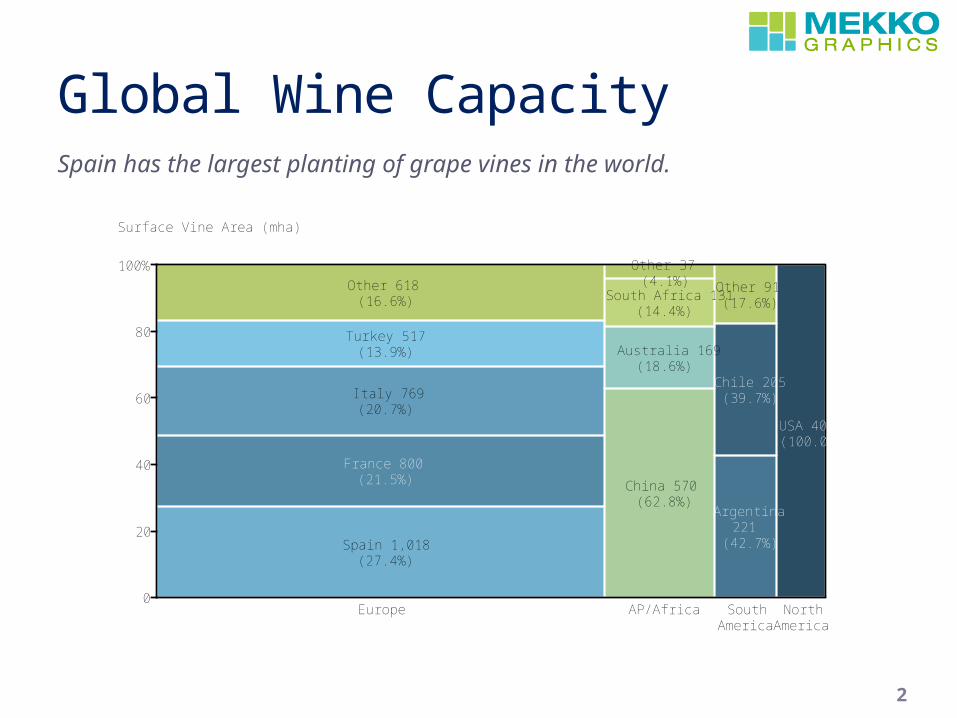
Global Wine CapacitySpain has the largest planting of grape vines in the world.
0
20
40
60
80
100%
Surface Vine Area (mha)
Europe
France 800 (21.5%)
Italy 769 (20.7%)
Spain 1,018 (27.4%)
Turkey 517 (13.9%)
Other 618 (16.6%)
AP/Africa
Australia 169 (18.6%)
China 570 (62.8%)
South Africa 131 (14.4%)
South America
Chile 205 (39.7%)
Argentina 221
(42.7%)
Other 91 (17.6%)
North America
Other 37 (4.1%)
USA 407 (100.0%)
3
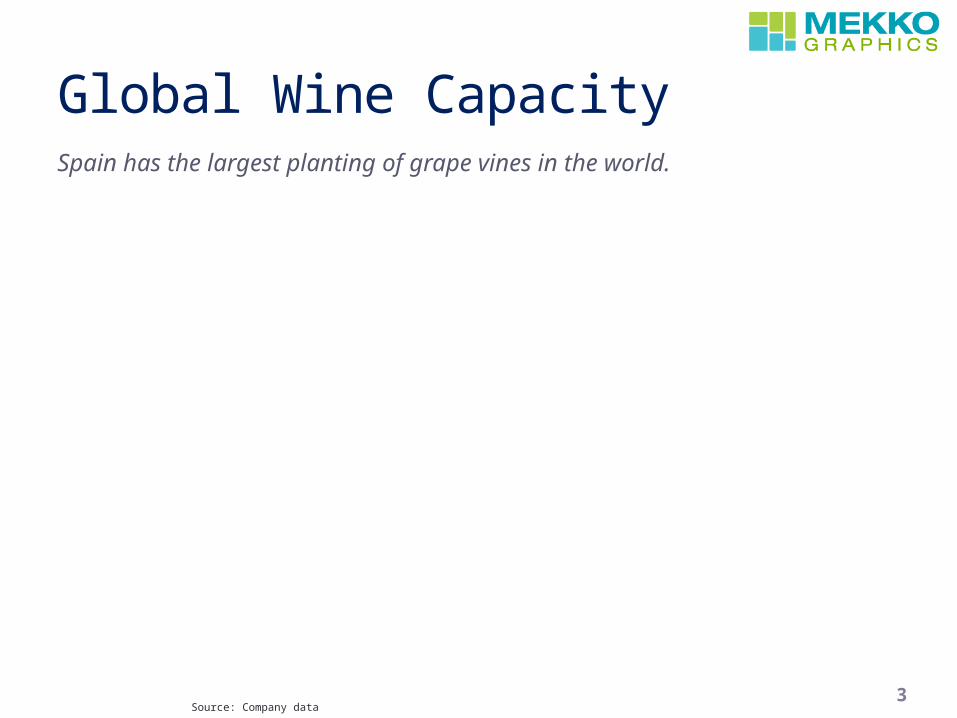
Global Wine CapacitySpain has the largest planting of grape vines in the world.
Source: Company data

4
Preference Manager

5
2,000
2,200
2,400
2,600
2,800
3,000
3,200
3,400
Millions of Cases
1995
2,800
Old World
229
New World
154
China
35
Other
80
2004
3,298
Old World
-460
New World
25
China
111
Other
-186
2012
2,788
-15%-15%
Global Wine ProductionProduction was rising until 2004 but it has since fallen by 15%, primarily in old world markets.
Source: OVI

6
Global Wine ProductionProduction was rising until 2004 but it has since fallen by 15%, primarily in old world markets.
Source: OVI
7
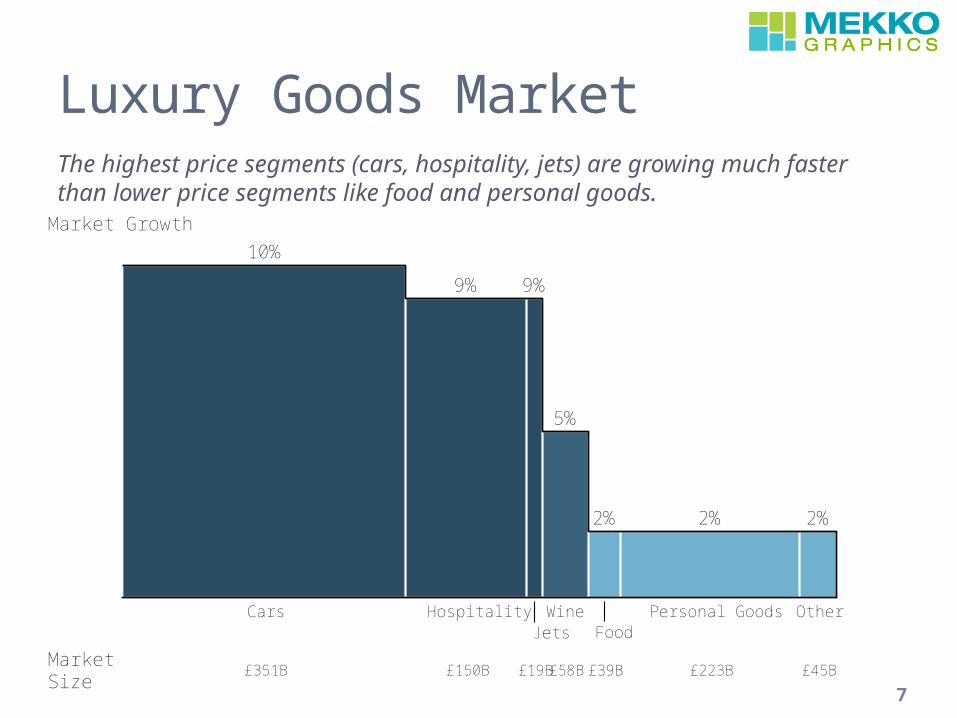
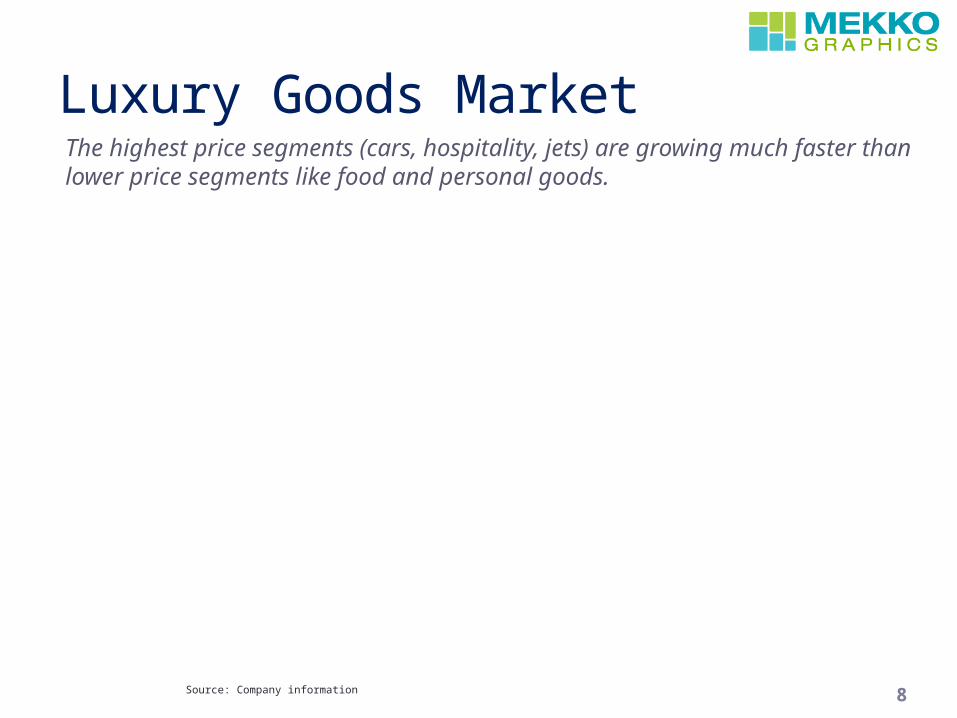
Luxury Goods MarketThe highest price segments (cars, hospitality, jets) are growing much faster than lower price segments like food and personal goods.
Market Growth
Cars
10%
Hospitality
9% 9%
Wine
5%
2%
Personal Goods
2%
Other
2%
£351B £150B £19B£58B£39B £223B £45BMarket Size
Jets Food
8
Luxury Goods MarketThe highest price segments (cars, hospitality, jets) are growing much faster than lower price segments like food and personal goods.
Source: Company information

9
-10.0
-5.0
0.0
5.0
10.0
15.0%
0 15 20 25 30 35 40 45 50 55 60Liter
300M Population
Consumption Volume per Capita
Consumption Growth
China
U.S.
Germany
France
UK
ItalySpain
Argentina
300M Population
Australia
Portugal
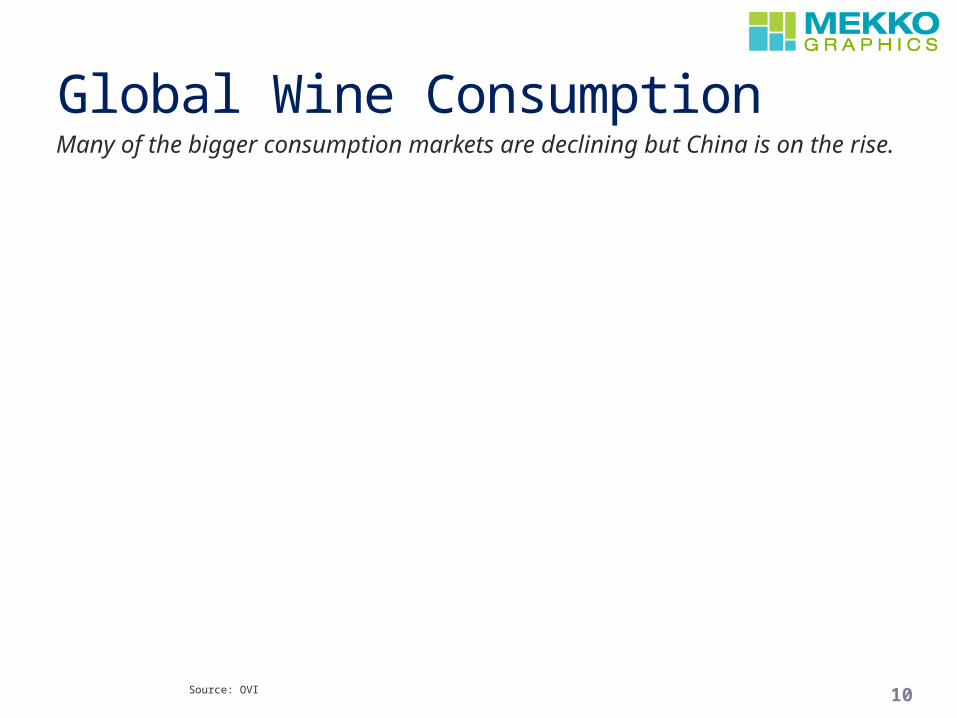
Global Wine ConsumptionMany of the bigger consumption markets are declining but China is on the rise.
Source: OVI
10
Global Wine ConsumptionMany of the bigger consumption markets are declining but China is on the rise.
Source: OVI

11
0
100
200
300
400
500
Millions of Cases
2007
60
2008
85
2009
135
2010
170
2011
200
2012
245
2013
300
2014E
340
2015E
370
2016E
450
+650%
23%
33%
2007-2016CAGR
+650%
Domestic Production
Imports
Wine Consumption in ChinaWine consumption in China has exploded. While domestic production has also grown, import volumes have grown even faster to keep pace with demand.
Source: OVI

12
Wine Consumption in ChinaWine consumption in China has exploded. While domestic production has also grown, import volumes have grown even faster to keep pace with demand.
Source: OVI

13
Starbucks Growth by RegionGrowth in the Americas been relatively steady, EMEA has rebounded and growth has moderated in China and AP.
Source: Company data
-10
0
10
20
30%
Same Stores Sales Growth
Average 8%
1Q11 2Q11 3Q11 4Q11 1Q12 2Q12 3Q12 4Q12 1Q13 2Q13 3Q13 4Q13
Average 8%
AmericasEMEA
China/AP
14
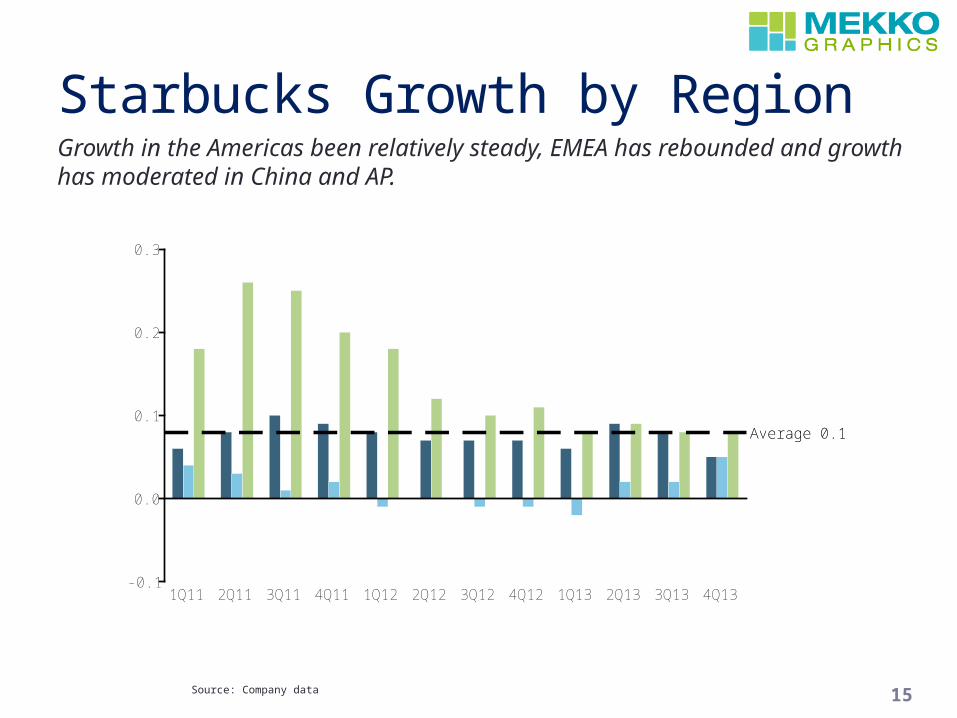
Starbucks Growth by RegionGrowth in the Americas been relatively steady, EMEA has rebounded and growth has moderated in China and AP.
Source: Company data
15
Starbucks Growth by RegionGrowth in the Americas been relatively steady, EMEA has rebounded and growth has moderated in China and AP.
Source: Company data
-0.1
0.0
0.1
0.2
0.3
Average 0.1
1Q11 2Q11 3Q11 4Q11 1Q12 2Q12 3Q12 4Q12 1Q13 2Q13 3Q13 4Q13
Average 0.1

16
Restaurant StocksInvestors are paying a premium for earnings growth at Dunkin, Dominos and Starbucks.
Source: Bloomberg, Company information
0
11
12
13
14
15
16
17
18
19
20
0 10 20 30 40%
Earnings Growth
Valuation EV/EBITDA
Yum!
Wendy's
Tim Horton's
Starbucks
McDonald's
Dunkin
Dominos

17
Restaurant StocksInvestors are paying a premium for earnings growth at Dunkin, Dominos and Starbucks.
Source: Bloomberg, Company information
18
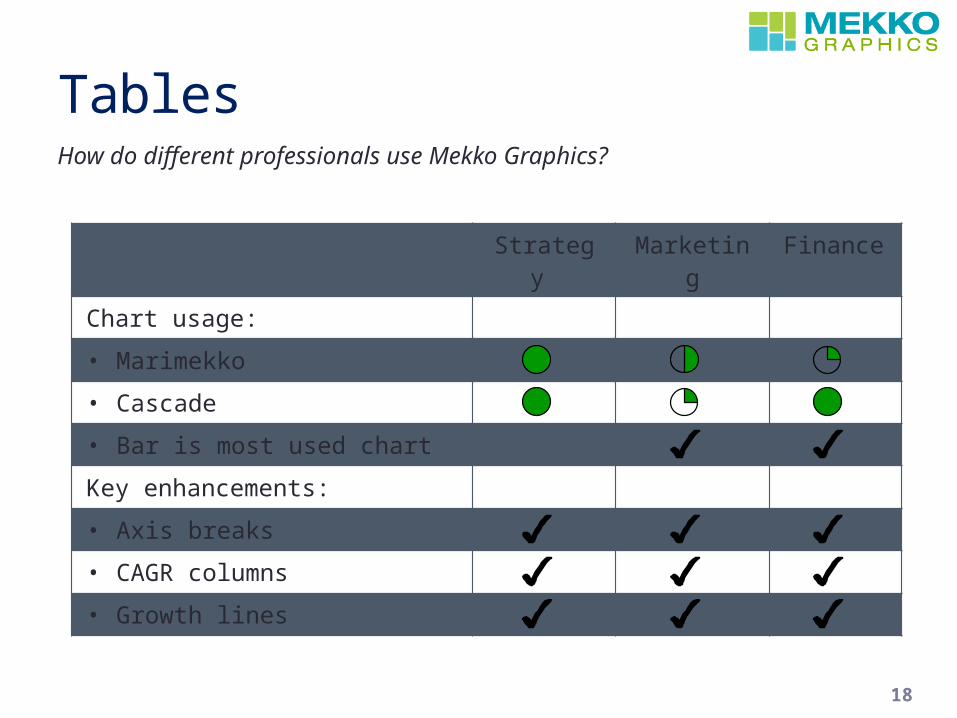
TablesHow do different professionals use Mekko Graphics?
Strategy Marketing Finance
Chart usage:
• Marimekko
• Cascade
• Bar is most used chart
Key enhancements:
• Axis breaks
• CAGR columns
• Growth lines
19
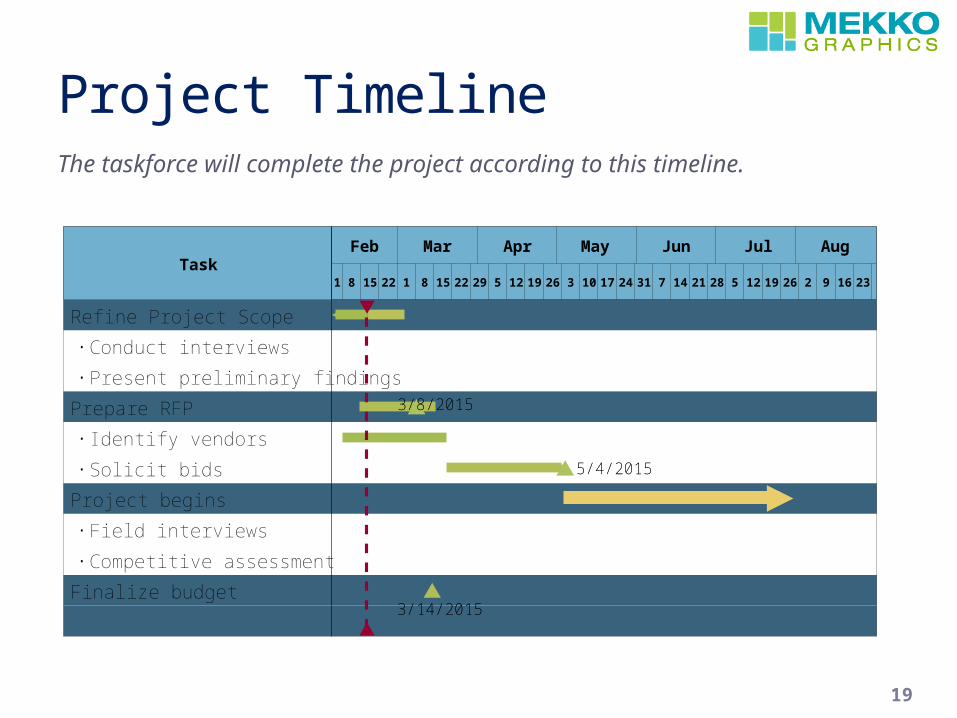
Project TimelineThe taskforce will complete the project according to this timeline.
Task
Refine Project Scope
•Conduct interviews
•Present preliminary findings
Prepare RFP 3/8/2015
• Identify vendors
•Solicit bids 5/4/2015
Project begins
•Field interviews
•Competitive assessment
Finalize budget 3/14/2015
Feb Mar Apr May Jun Jul Aug
1 8 15 22 1 8 15 22 29 5 12 19 26 3 10 17 24 31 7 14 21 28 5 12 19 26 2 9 16 23
3/8/2015
5/4/2015
3/14/2015
20
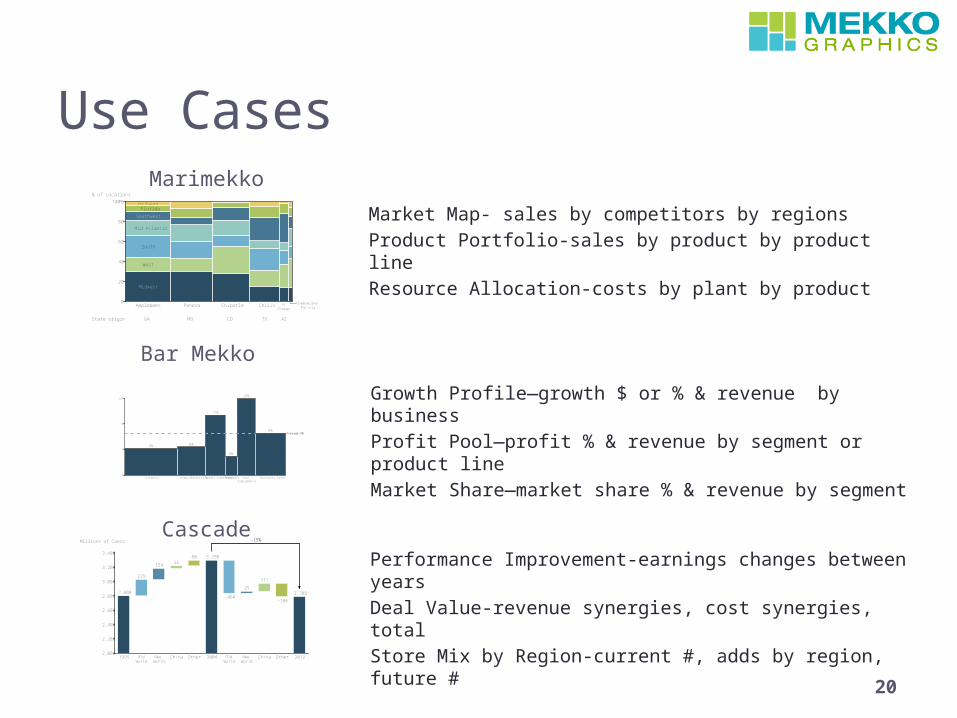
Use Cases
0
20
40
60
80
100%
% of Locations
Applebees
Midwest
West
South
Mid Atlantic
Southwest
FloridaNew England
Panera Chipotle Chilis PF Changs
GA TX AZCOMOState origin
Cheesecake Factory
0
5
10
15%
Average 8%
Vitamins
5%
Herbs/Botanicals
6%
Sports Nutrition
12%
Minerals
4%
Meal Supplements
15%
Specialty/Other
8%Average 8%
Marimekko
Bar Mekko
Cascade
Market Map- sales by competitors by regionsProduct Portfolio-sales by product by product lineResource Allocation-costs by plant by product
Growth Profile—growth $ or % & revenue by businessProfit Pool—profit % & revenue by segment or product lineMarket Share—market share % & revenue by segment
Performance Improvement-earnings changes between yearsDeal Value-revenue synergies, cost synergies, totalStore Mix by Region-current #, adds by region, future #
2,000
2,200
2,400
2,600
2,800
3,000
3,200
3,400
Millions of Cases
1995
2,800
Old World
229
New World
154
China
35
Other
80
2004
3,298
Old World
-460
New World
25
China
111
Other
-186
2012
2,788
-15%-15%
21
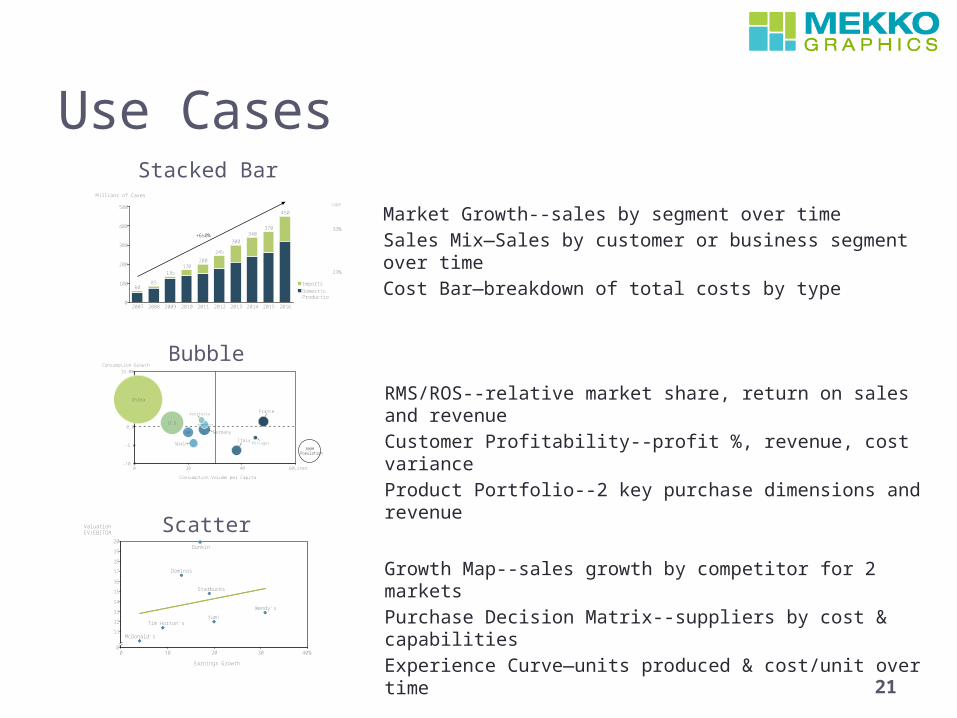
Use Cases
0
11
12
13
14
15
16
17
18
19
20
0 10 20 30 40%
Earnings Growth
Valuation EV/EBITDA
Yum!
Wendy's
Tim Horton's
Starbucks
McDonald's
Dunkin
Dominos
Stacked Bar
Bubble
Scatter
Market Growth--sales by segment over timeSales Mix—Sales by customer or business segment over timeCost Bar—breakdown of total costs by type
RMS/ROS--relative market share, return on sales and revenueCustomer Profitability--profit %, revenue, cost varianceProduct Portfolio--2 key purchase dimensions and revenue
Growth Map--sales growth by competitor for 2 marketsPurchase Decision Matrix--suppliers by cost & capabilitiesExperience Curve—units produced & cost/unit over time
-10.0
-5.0
0.0
5.0
10.0
15.0%
0 20 40 60Liter
300M Population
Consumption Volume per Capita
Consumption Growth
China
U.S.
Germany
France
UK
ItalySpain
Argentina
300M Population
Australia
Portugal
0
100
200
300
400
500
Millions of Cases
2007
60
2008
85
2009
135
2010
170
2011
200
2012
245
2013
300
2014
340
2015
370
2016
450
+650%
23%
33%
CAGR
+650%
Domestic Production
Imports
22
Resources
Learn Ask Connect
Training videosSample chartsPresentations Strategy Consultant’s ToolkitBlogFAQsDocumentationPalettes
Mekko Graphics Toolbar
MekkoGraphics.com

23
Questions?

24
Additional Features
0
10
20
30
40%
New York
37%
Chicago
32%
Los Angeles
25%
Boston
18%15%
Close Rate Last 12 Months
Denver
Apply Cell Colors from Spreadsheet or using Conditional Formatting
Values Scaling
0
200,000
400,000
600,000
800,000
1,000,000
Units (Thousands)
Android
758,720
iOS
150,786
Microsoft
30,843
Blackberry
18,606