Embed Size (px)
Citation preview
Mastering Depreciation© American Institute of Professional Bookkeepers, 2012
Mastering Depreciation
American Institute of Professional Bookkeepers
Mastering Depreciation
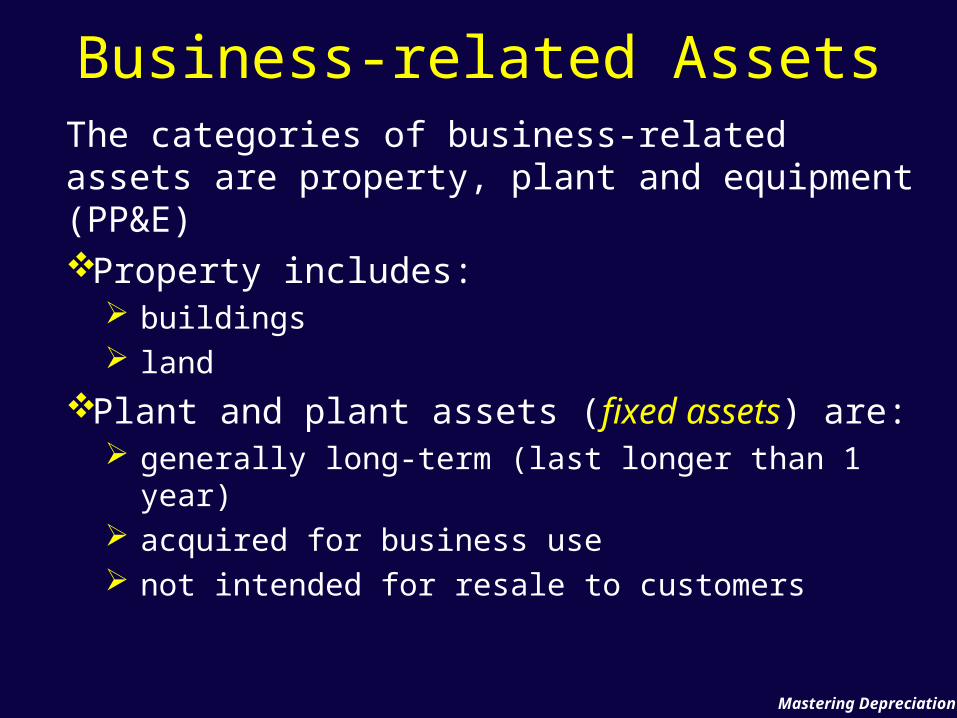
Business-related AssetsThe categories of business-related assets are property, plant and equipment (PP&E)Property includes:
buildings land
Plant and plant assets (fixed assets) are: generally long-term (last longer than 1 year) acquired for business use not intended for resale to customers
Mastering DepreciationSlide 3
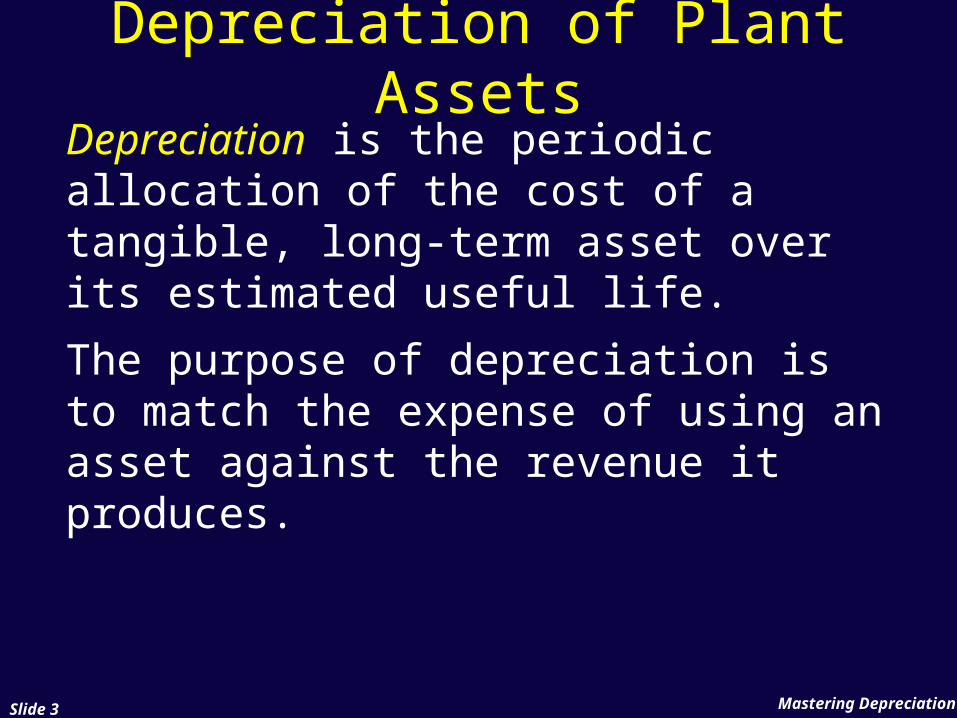
Depreciation of Plant AssetsDepreciation is the periodic allocation of the cost of a tangible, long-term asset over its estimated useful life.
The purpose of depreciation is to match the expense of using an asset against the revenue it produces.
Mastering DepreciationSlide 4
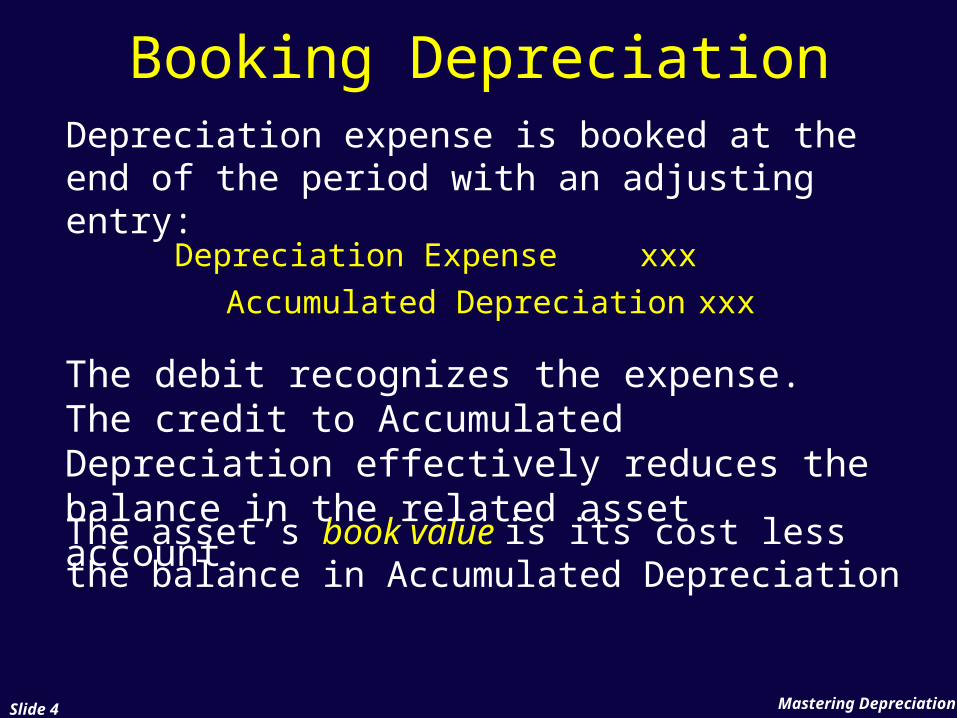
Booking DepreciationDepreciation expense is booked at the end of the period with an adjusting entry:
The asset’s book value is its cost less the balance in Accumulated Depreciation
Depreciation Expense
Accumulated Depreciation
xxx
xxx
The debit recognizes the expense. The credit to Accumulated Depreciation effectively reduces the balance in the related asset account.
Mastering DepreciationSlide 5
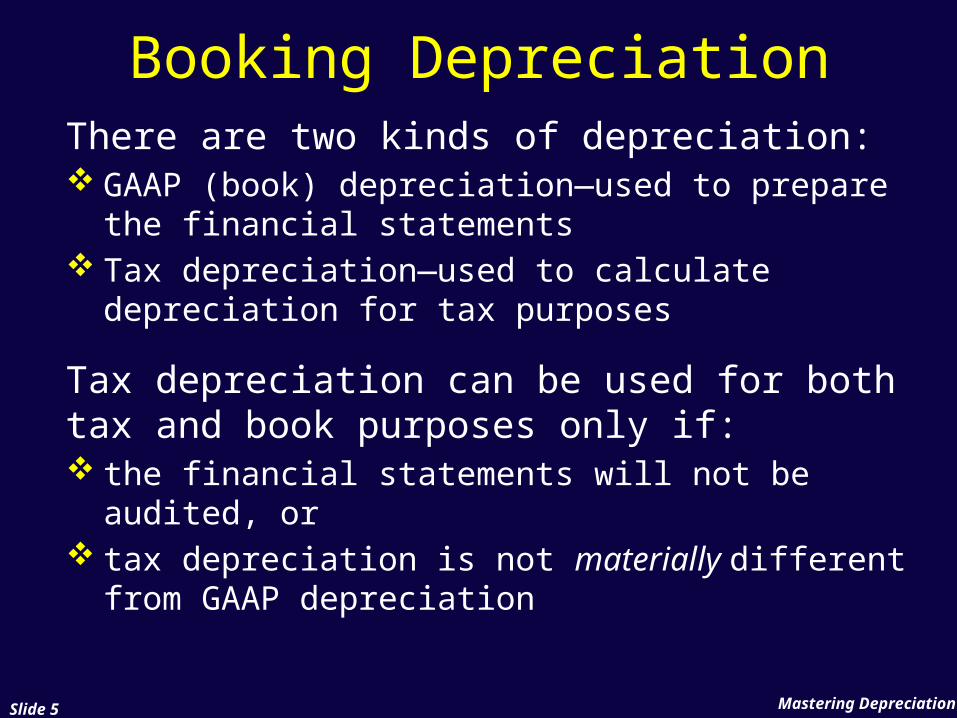
Booking DepreciationThere are two kinds of depreciation: GAAP (book) depreciation—used to prepare
the financial statements Tax depreciation—used to calculate
depreciation for tax purposes
Tax depreciation can be used for both tax and book purposes only if: the financial statements will not be audited, or tax depreciation is not materially different
from GAAP depreciation
Mastering DepreciationSlide 6
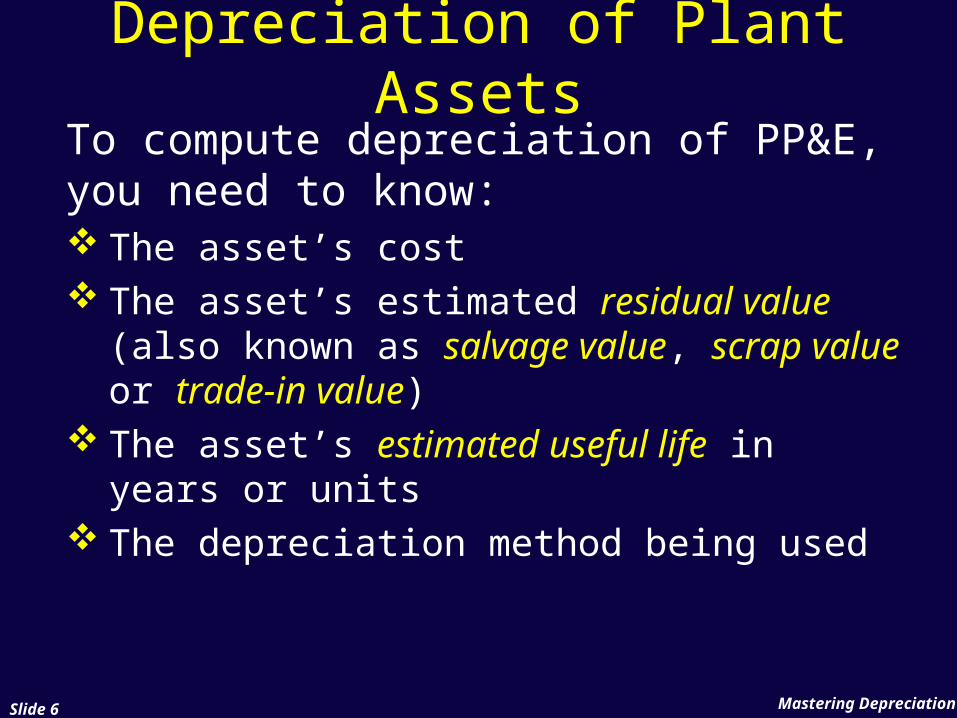
Depreciation of Plant AssetsTo compute depreciation of PP&E, you need to know: The asset’s cost The asset’s estimated residual value (also
known as salvage value, scrap value or trade-in value)
The asset’s estimated useful life in years or units
The depreciation method being used
Mastering DepreciationSlide 7
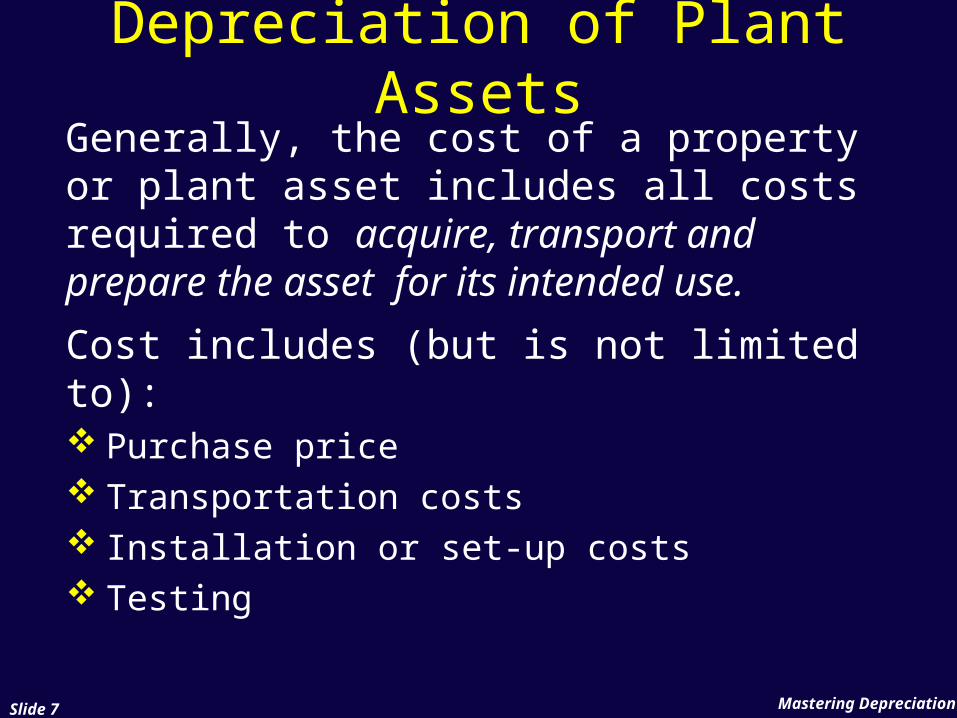
Depreciation of Plant AssetsGenerally, the cost of a property or plant asset includes all costs required to acquire, transport and prepare the asset for its intended use.
Cost includes (but is not limited to): Purchase price Transportation costs Installation or set-up costs Testing
Mastering DepreciationSlide 8
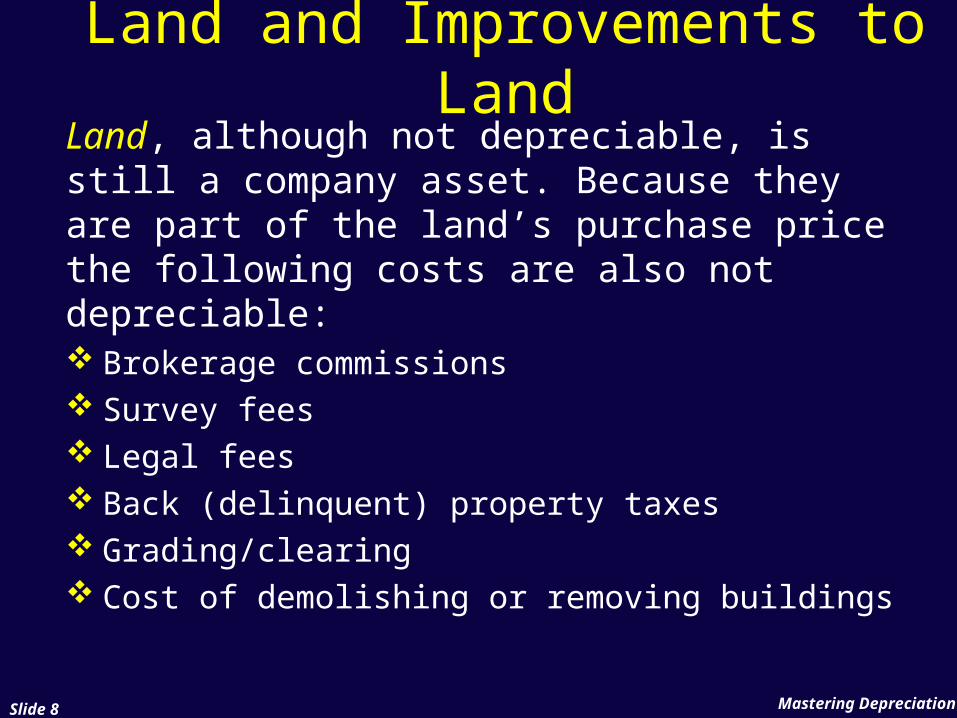
Land and Improvements to Land
Land, although not depreciable, is still a company asset. Because they are part of the land’s purchase price the following costs are also not depreciable: Brokerage commissions Survey fees Legal fees Back (delinquent) property taxes Grading/clearing Cost of demolishing or removing buildings
Mastering DepreciationSlide 9
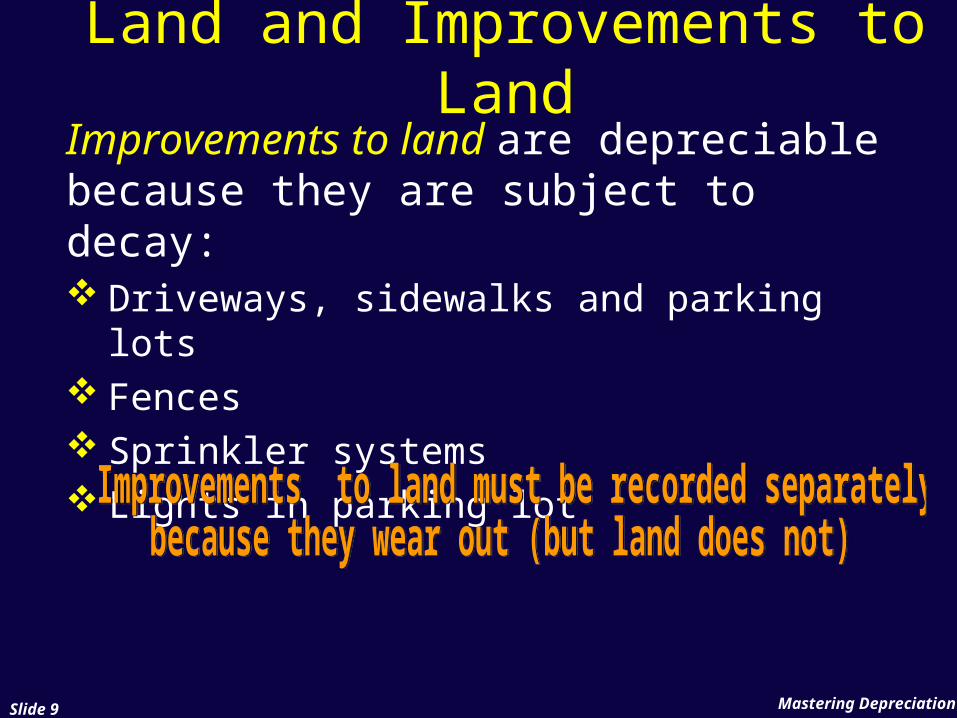
Land and Improvements to Land
Improvements to land are depreciable because they are subject to decay: Driveways, sidewalks and parking lots Fences Sprinkler systems Lights in parking lot
Mastering DepreciationSlide 10
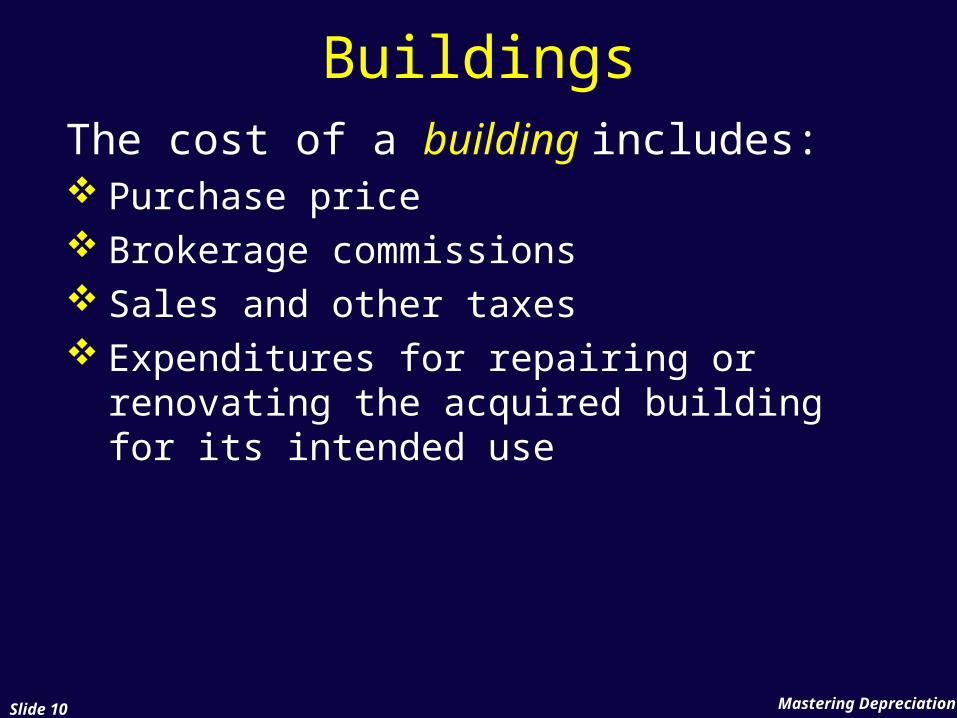
BuildingsThe cost of a building includes: Purchase price Brokerage commissions Sales and other taxes Expenditures for repairing or renovating
the acquired building for its intended use
Mastering DepreciationSlide 11
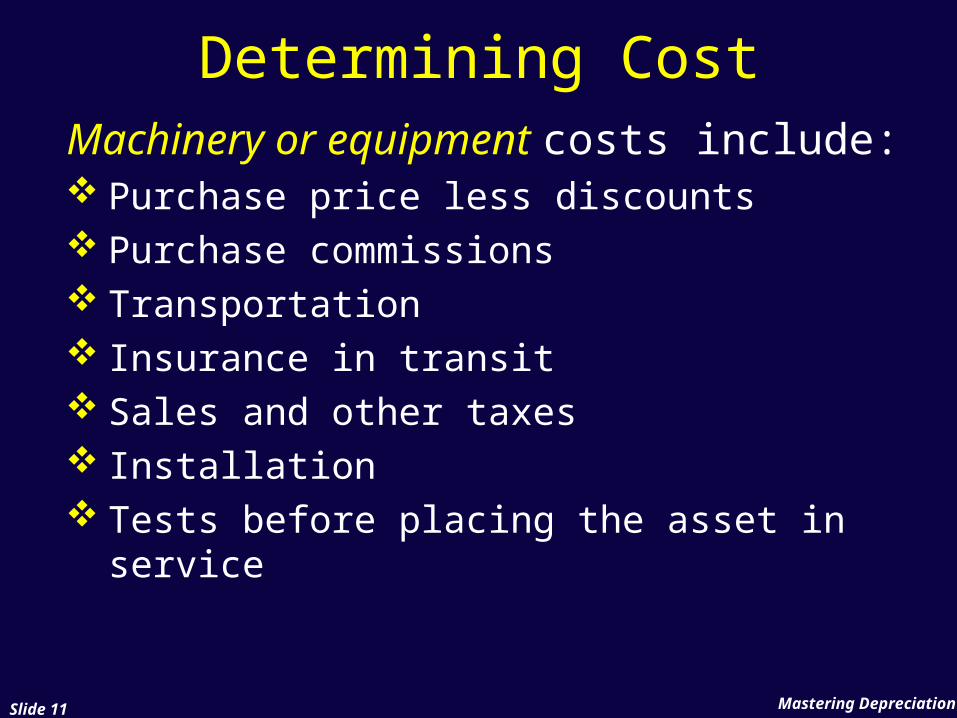
Determining CostMachinery or equipment costs include: Purchase price less discounts Purchase commissions Transportation Insurance in transit Sales and other taxes Installation Tests before placing the asset in service
Mastering DepreciationSlide 12
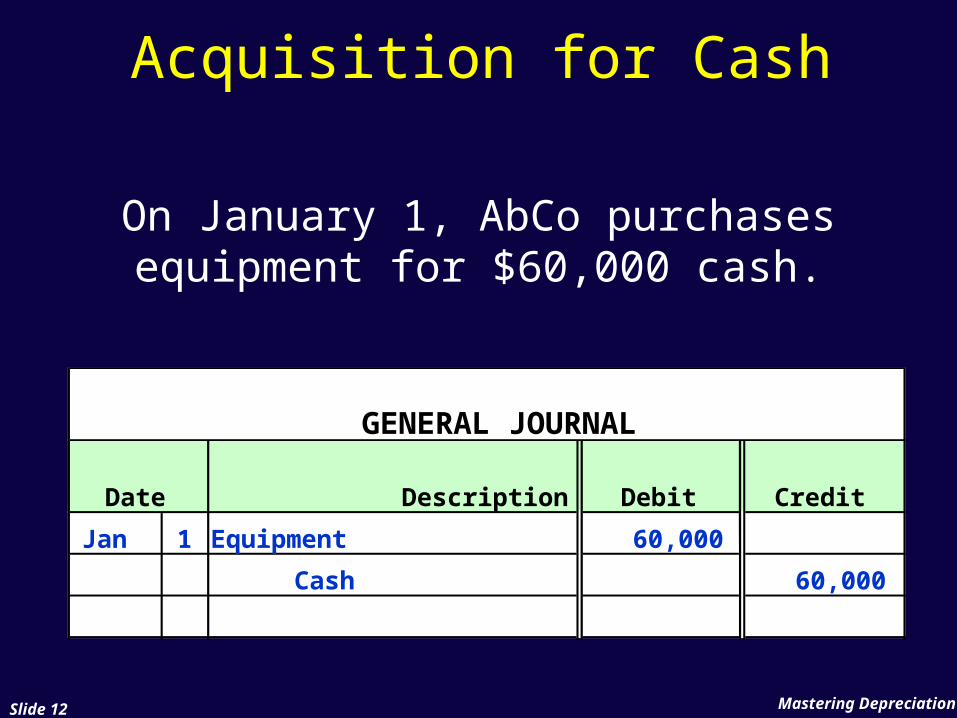
Acquisition for Cash
On January 1, AbCo purchasesequipment for $60,000 cash.
GENERAL JOURNAL
Date Description Debit Credit
Jan 1 Equipment 60,000
Cash 60,000
Mastering DepreciationSlide 13
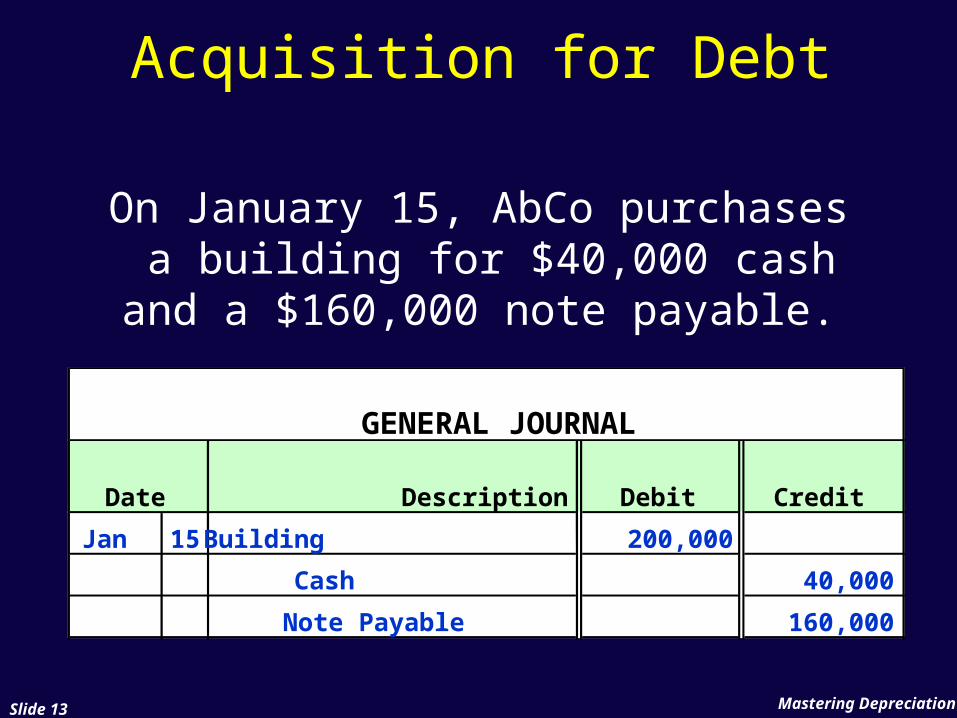
Acquisition for Debt
On January 15, AbCo purchases a building for $40,000 cash and a
$160,000 note payable.
GENERAL JOURNAL
Date Description Debit Credit
Jan 15 Building 200,000
Cash 40,000
Note Payable 160,000
Mastering DepreciationSlide 14
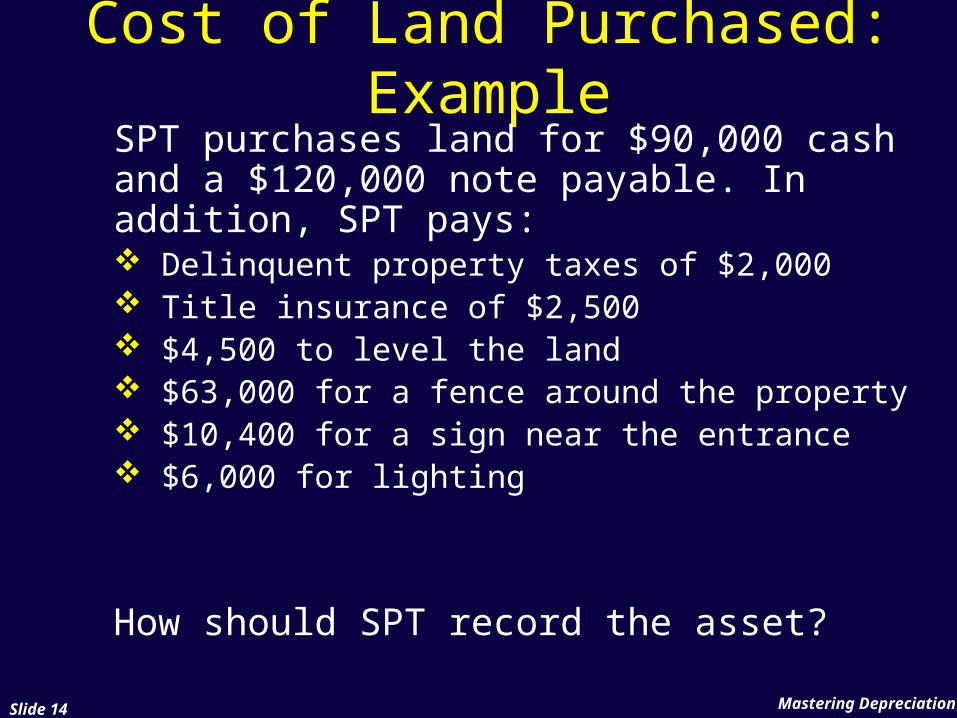
Cost of Land Purchased: Example
SPT purchases land for $90,000 cash and a $120,000 note payable. In addition, SPT pays: Delinquent property taxes of $2,000 Title insurance of $2,500 $4,500 to level the land $63,000 for a fence around the property $10,400 for a sign near the entrance $6,000 for lighting
How should SPT record the asset?
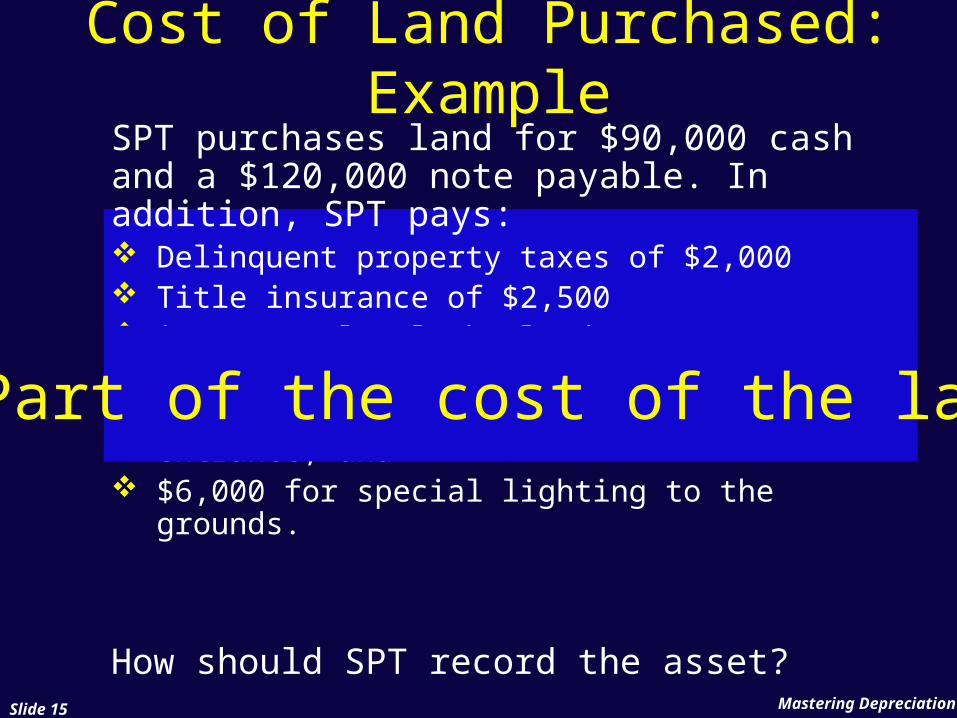
SPT purchases land for $90,000 cash and a $120,000 note payable. In addition, SPT pays: Delinquent property taxes of $2,000 Title insurance of $2,500 $4,500 to level the land $63,000 for a fence around the property; $10,400 for a company sign near the
entrance; and $6,000 for special lighting to the grounds.
How should SPT record the asset?Mastering DepreciationSlide 15
Cost of Land Purchased: Example
Part of the cost of the land
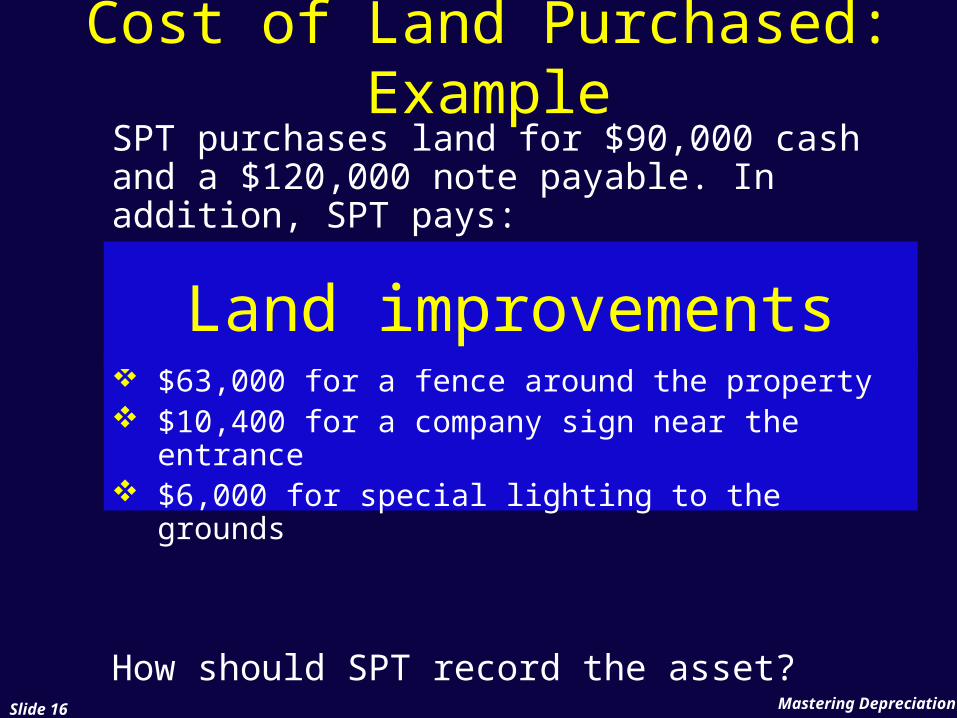
SPT purchases land for $90,000 cash and a $120,000 note payable. In addition, SPT pays: Delinquent property taxes of $2,000 Title insurance costing $2,500 $4,500 for leveling the land; $63,000 for a fence around the property $10,400 for a company sign near the
entrance $6,000 for special lighting to the grounds
How should SPT record the asset?Mastering DepreciationSlide 16
Cost of Land Purchased: Example
Land improvements
Mastering DepreciationSlide 17
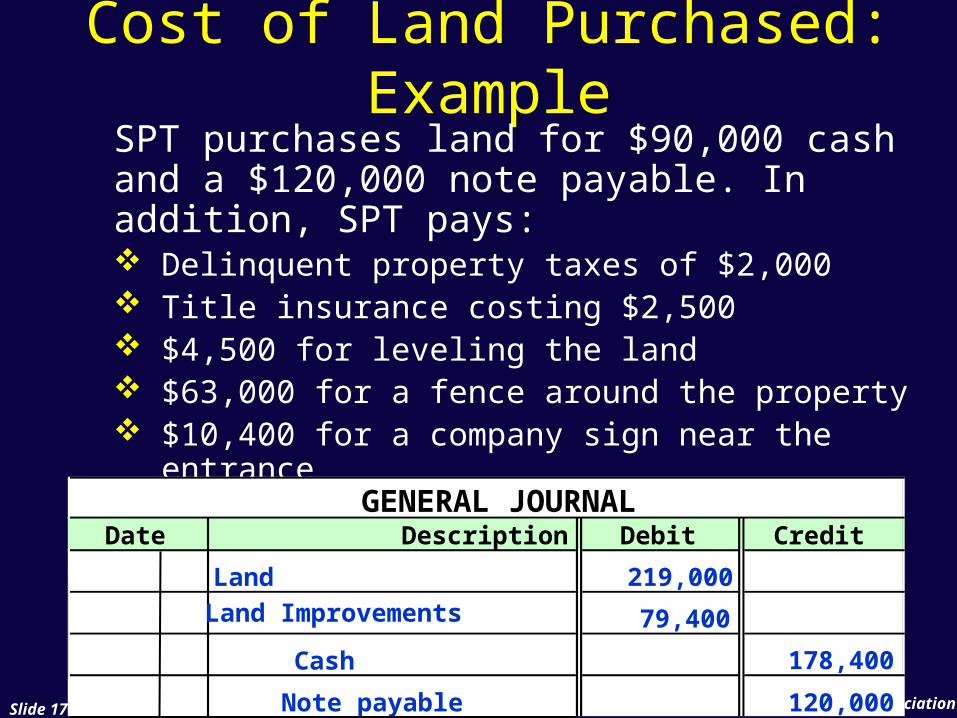
Cost of Land Purchased: Example
SPT purchases land for $90,000 cash and a $120,000 note payable. In addition, SPT pays: Delinquent property taxes of $2,000 Title insurance costing $2,500 $4,500 for leveling the land $63,000 for a fence around the property $10,400 for a company sign near the
entrance $6,000 for special lighting to the grounds
GENERAL JOURNAL
Date Description Debit Credit
Land 219,000
Cash
79,400
Note payable
178,400
Land Improvements
120,000
Mastering DepreciationSlide 18
Group PurchasesWhen two or more assets are purchased for a single price:
the cost is allocated among the individual assets
the portion of the cost allocated to each asset is calculated by dividing the fair market value (FMV) of each asset by the FMV of the group.
Mastering DepreciationSlide 19
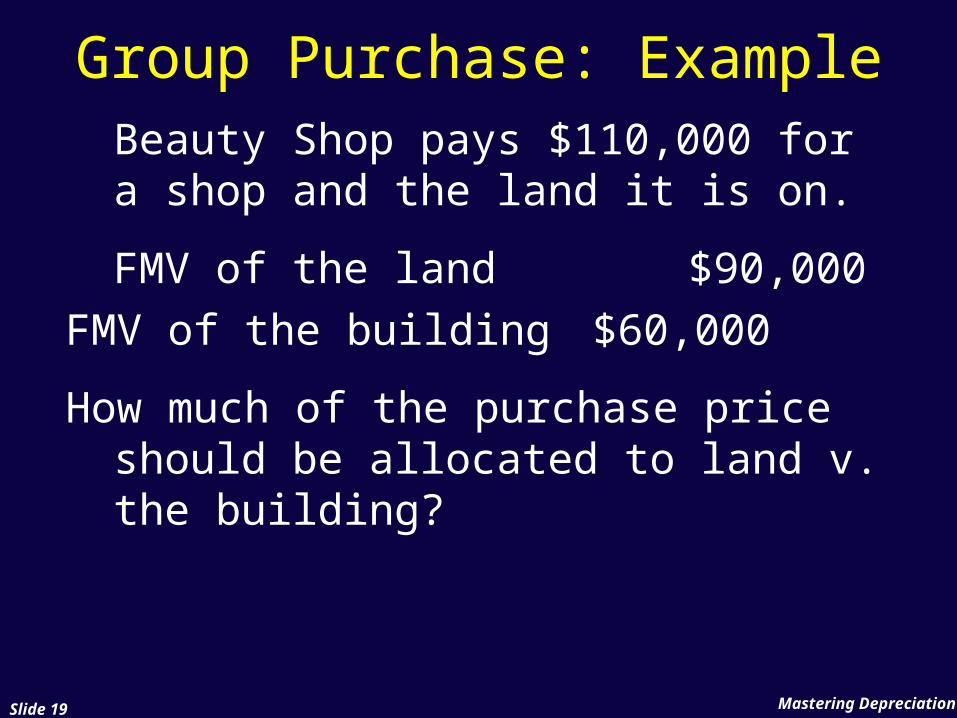
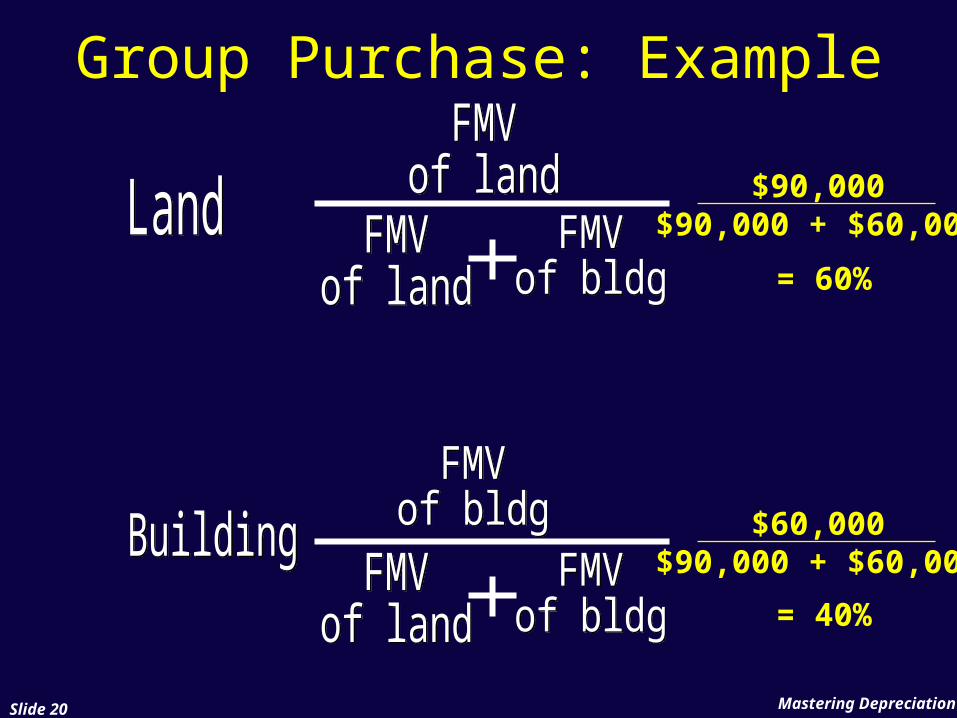
Group Purchase: ExampleBeauty Shop pays $110,000 for a shop and the land it is on.
FMV of the land $90,000 FMV of the building $60,000
How much of the purchase price should be allocated to land v. the building?
Mastering DepreciationSlide 20
Group Purchase: Example
$90,000$90,000 + $60,000
$60,000$90,000 + $60,000
= 60%
= 40%
Mastering DepreciationSlide 21
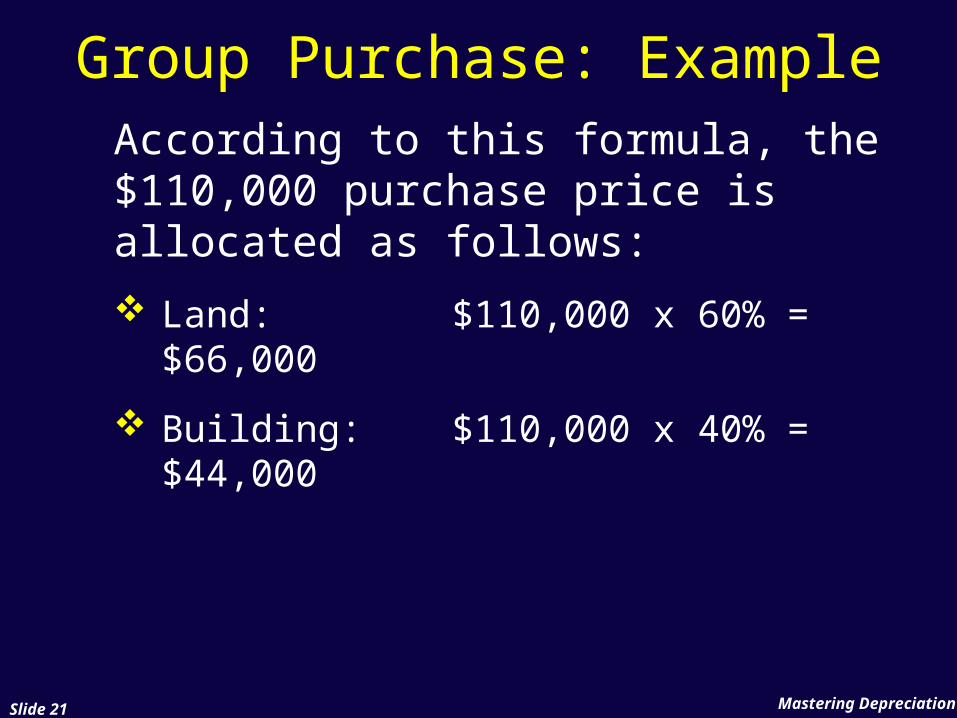
Group Purchase: ExampleAccording to this formula, the $110,000 purchase price is allocated as follows:
Land: $110,000 x 60% = $66,000
Building: $110,000 x 40% = $44,000
Mastering DepreciationSlide 22
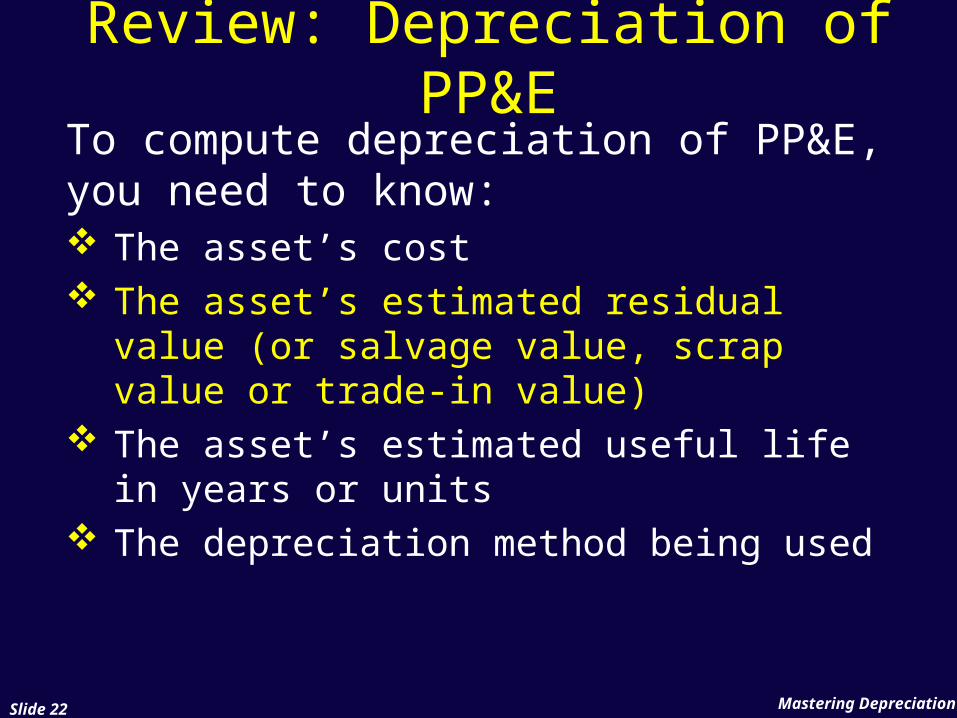
Review: Depreciation of PP&E
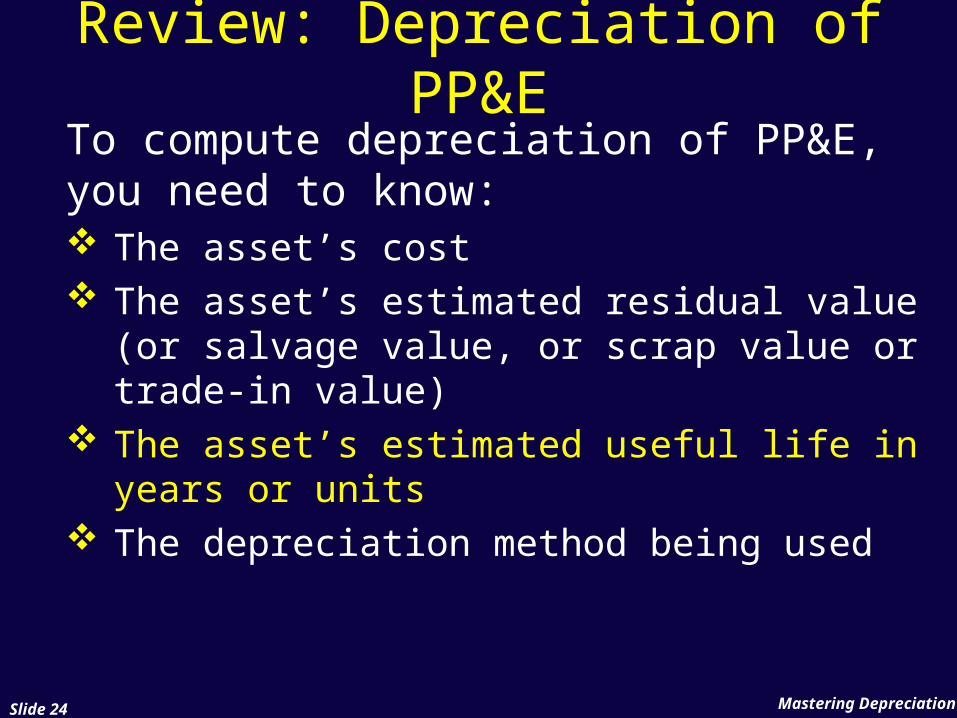
To compute depreciation of PP&E, you need to know: The asset’s cost The asset’s estimated residual value (or
salvage value, scrap value or trade-in value)
The asset’s estimated useful life in years or units
The depreciation method being used
Mastering DepreciationSlide 23
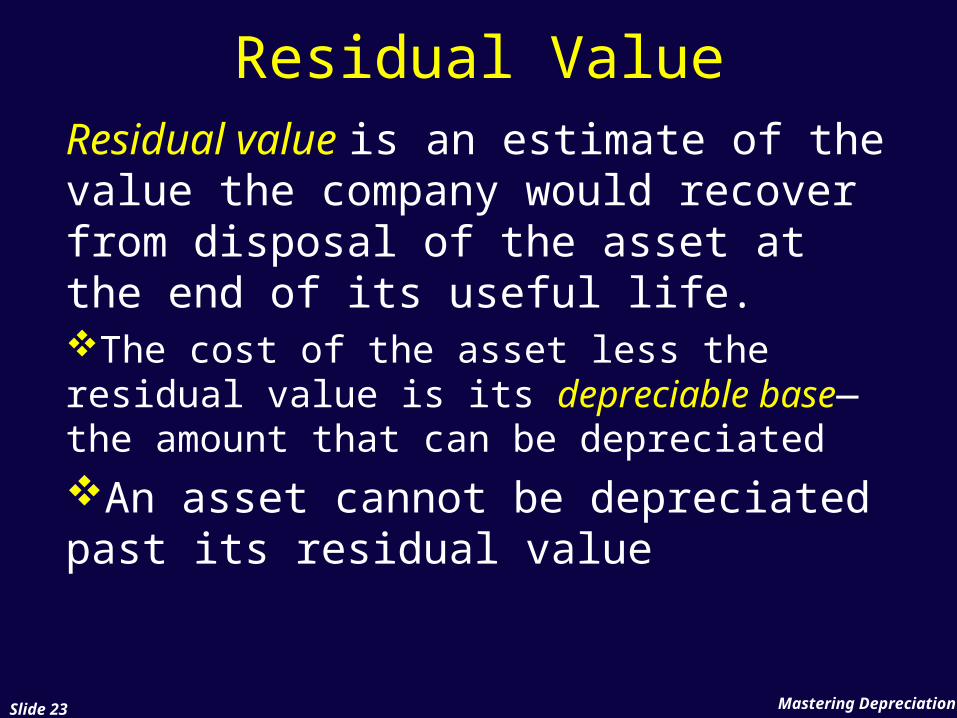
Residual ValueResidual value is an estimate of the value the company would recover from disposal of the asset at the end of its useful life.The cost of the asset less the residual value is its depreciable base—the amount that can be depreciatedAn asset cannot be depreciated past its residual value
Mastering DepreciationSlide 24
Review: Depreciation of PP&E
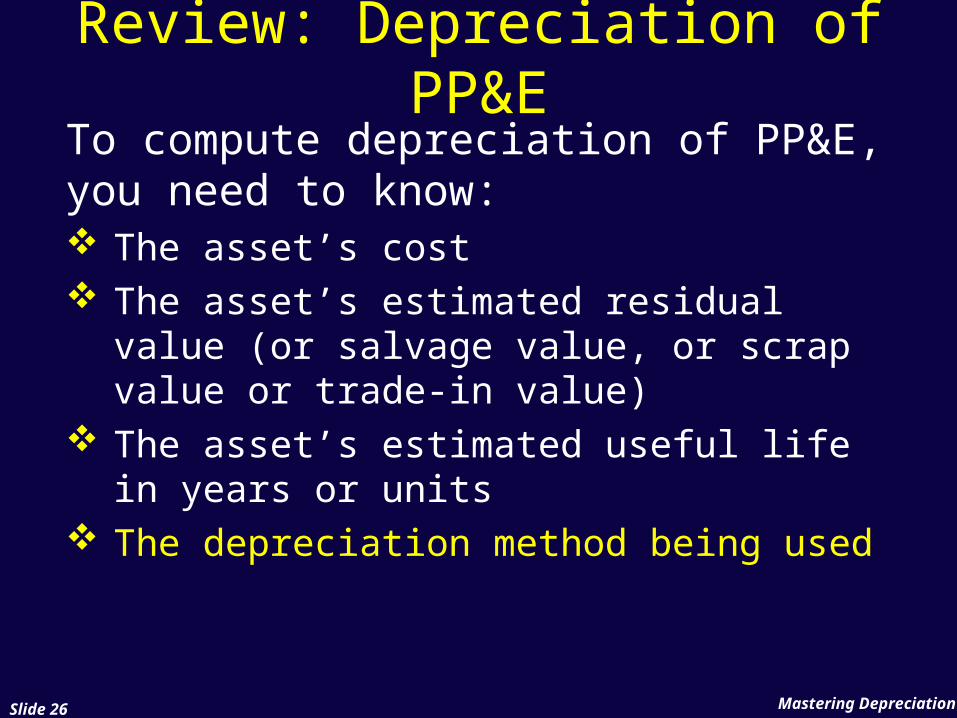
To compute depreciation of PP&E, you need to know: The asset’s cost The asset’s estimated residual value (or
salvage value, or scrap value or trade-in value)
The asset’s estimated useful life in years or units
The depreciation method being used
Mastering DepreciationSlide 25
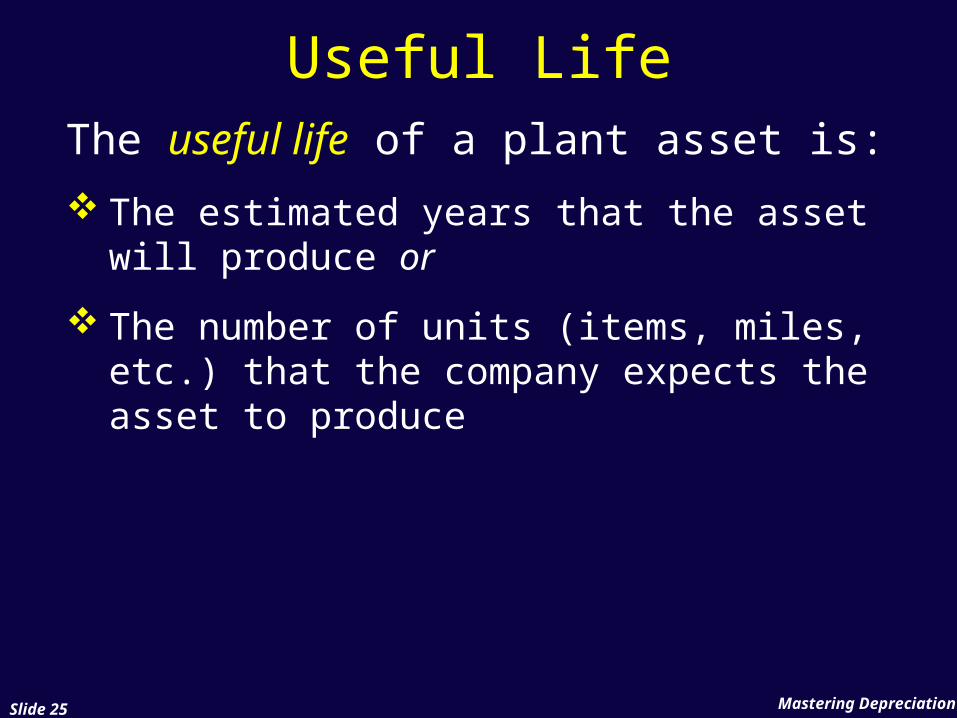
Useful LifeThe useful life of a plant asset is:
The estimated years that the asset will produce or
The number of units (items, miles, etc.) that the company expects the asset to produce
Mastering DepreciationSlide 26
Review: Depreciation of PP&E
To compute depreciation of PP&E, you need to know: The asset’s cost The asset’s estimated residual value (or
salvage value, or scrap value or trade-in value)
The asset’s estimated useful life in years or units
The depreciation method being used
Mastering DepreciationSlide 27
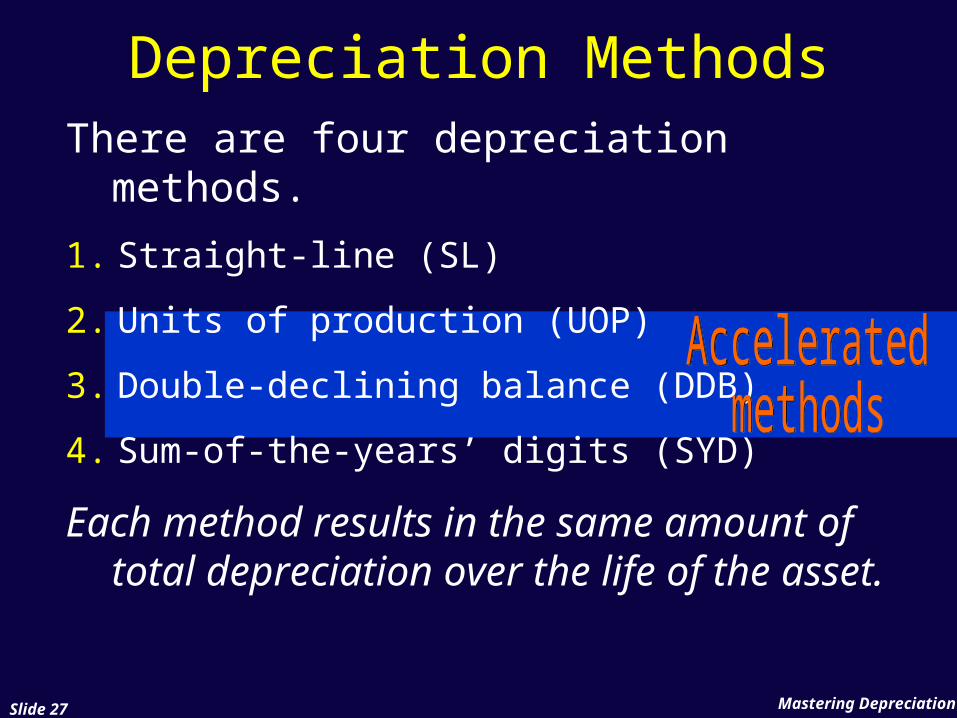
Depreciation MethodsThere are four depreciation methods.
1. Straight-line (SL)
2. Units of production (UOP)
3. Double-declining balance (DDB)
4. Sum-of-the-years’ digits (SYD)
Each method results in the same amount of total depreciation over the life of the asset.
Mastering DepreciationSlide 28
The Straight-Line (SL) Method
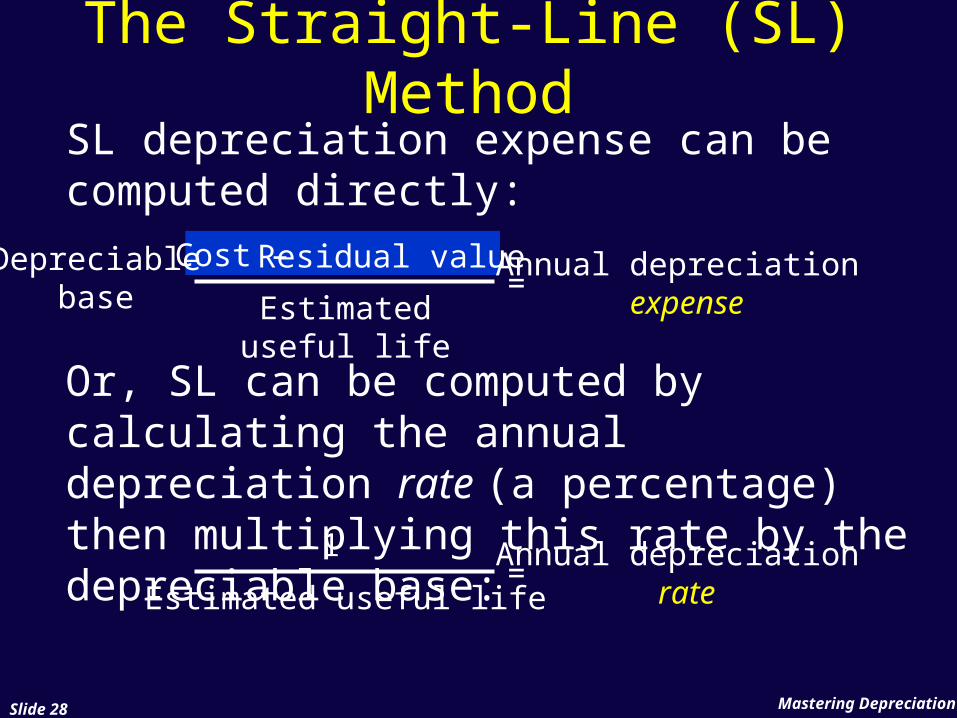
SL depreciation expense can be computed directly:
Or, SL can be computed by calculating the annual depreciation rate (a percentage) then multiplying this rate by the depreciable base:
Cost – Residual value
Estimated useful life
=Annual depreciation
expenseDepreciable
base
1
Estimated useful life=Annual depreciation
rate
Mastering DepreciationSlide 29
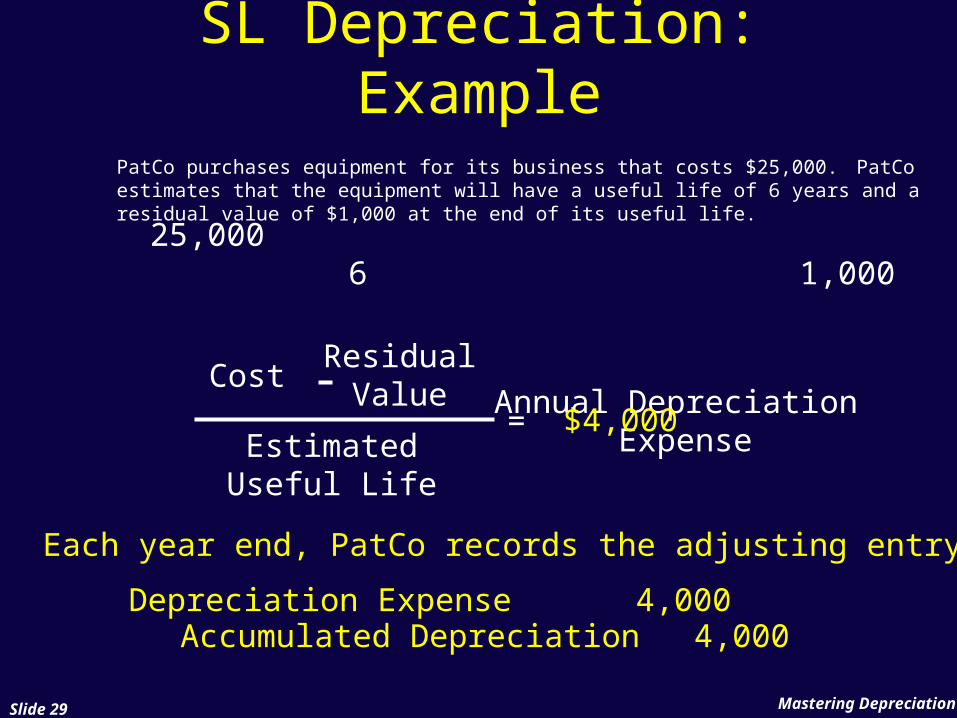
SL Depreciation: Example
PatCo purchases equipment for its business that costs $25,000. PatCo estimates that the equipment will have a useful life of 6 years and a residual value of $1,000 at the end of its useful life.
CostResidual
Value
EstimatedUseful Life
=Annual Depreciation
Expense
25,0001,0006
$4,000
Each year end, PatCo records the adjusting entry:
Depreciation ExpenseAccumulated Depreciation
4,0004,000
Mastering DepreciationSlide 30
SL Depreciation: Example
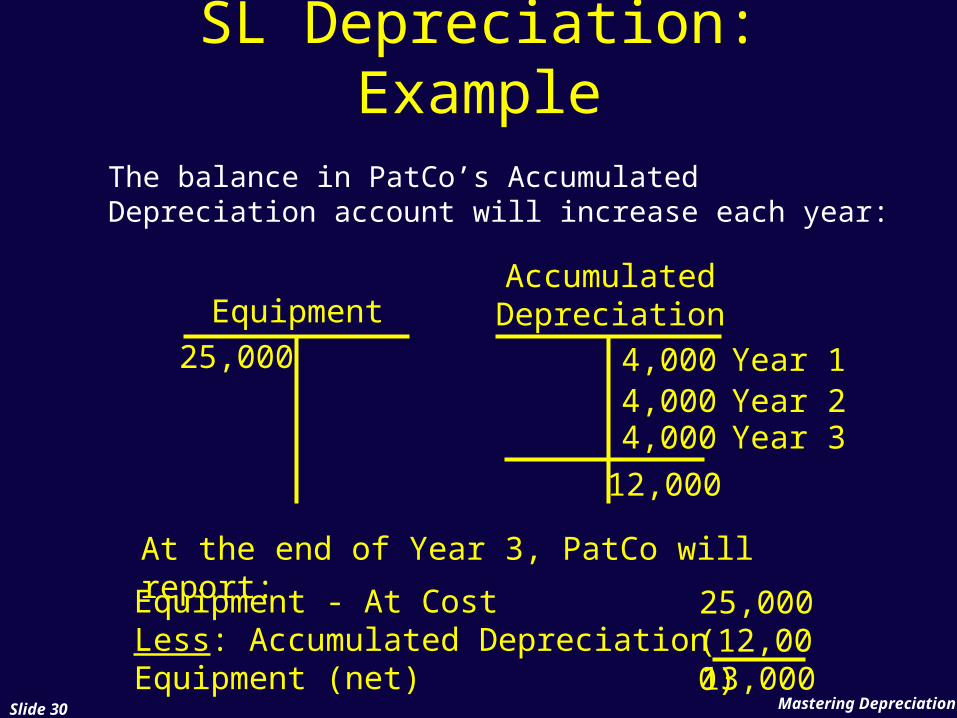
The balance in PatCo’s Accumulated Depreciation account will increase each year:
At the end of Year 3, PatCo will report:
EquipmentAccumulatedDepreciation
25,000 4,000 Year 14,000 Year 24,000 Year 3
12,000
25,000(12,000)13,000
Equipment - At CostLess: Accumulated DepreciationEquipment (net)
Mastering DepreciationSlide 31
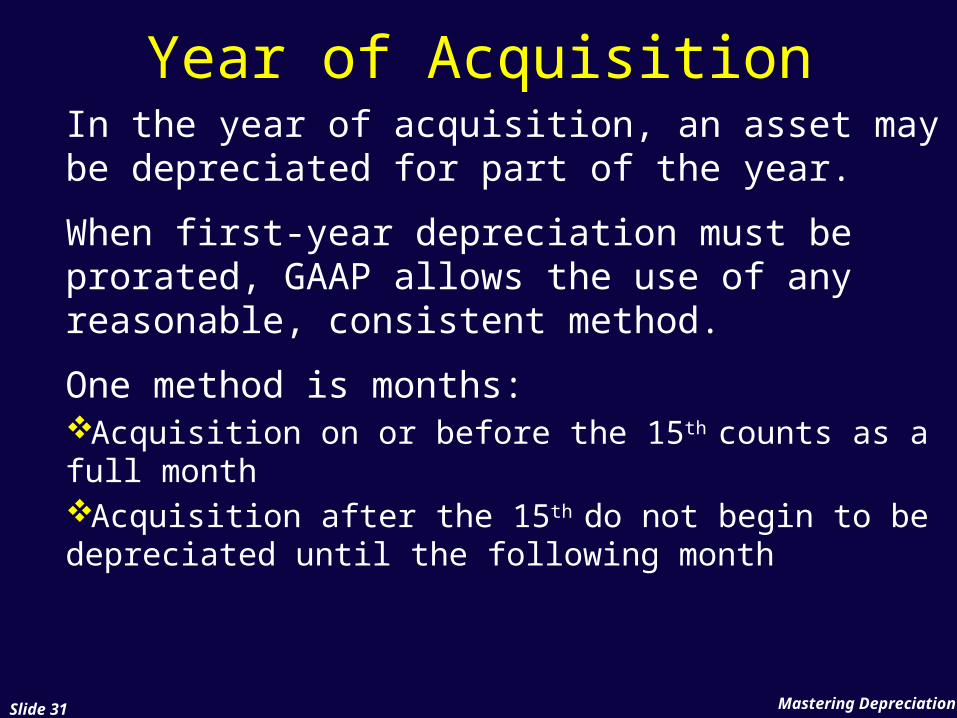
Year of AcquisitionIn the year of acquisition, an asset may be depreciated for part of the year.
When first-year depreciation must be prorated, GAAP allows the use of any reasonable, consistent method.
One method is months:Acquisition on or before the 15th counts as a full monthAcquisition after the 15th do not begin to be depreciated until the following month
Mastering DepreciationSlide 32
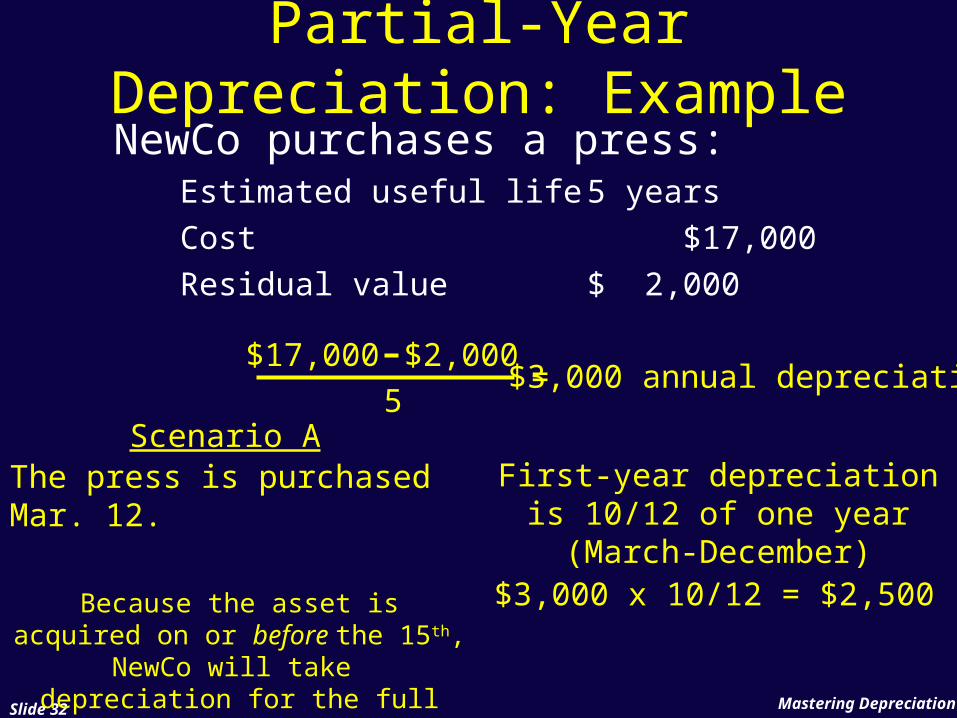
Partial-Year Depreciation: Example
NewCo purchases a press:Estimated useful life 5 yearsCost $17,000Residual value $ 2,000
Scenario AThe press is purchased Mar. 12.
Because the asset is acquired on or before the 15th, NewCo will take depreciation for the full
month
First-year depreciation is 10/12 of one year (March-
December)
$17,000 $2,0005
=$3,000 annual depreciation
$3,000 x 10/12 = $2,500
Mastering DepreciationSlide 33
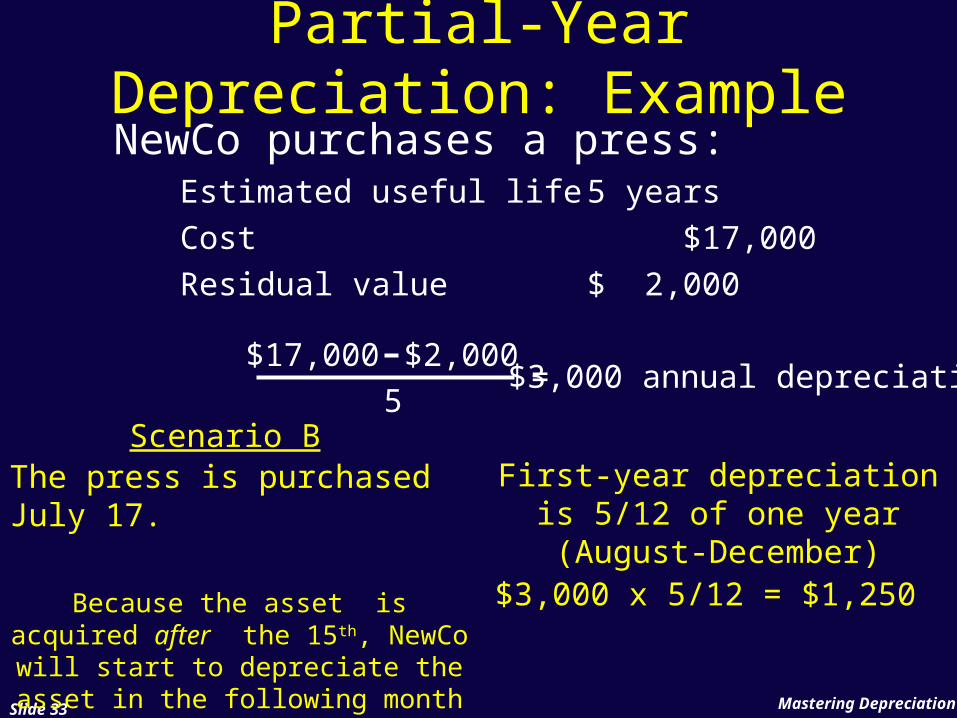
NewCo purchases a press:Estimated useful life 5 yearsCost $17,000Residual value $ 2,000
Scenario BThe press is purchased July 17.
Because the asset is acquired after the 15th, NewCo will start to
depreciate the asset in the following month
First-year depreciation is 5/12 of one year (August-
December)
$17,000 $2,0005
=$3,000 annual depreciation
$3,000 x 5/12 = $1,250
Partial-Year Depreciation: Example
Mastering DepreciationSlide 34
The Depreciation Schedule
DateAcquiredKind of Property Method
Rate orLife
DepreciableBase
ResidualValue
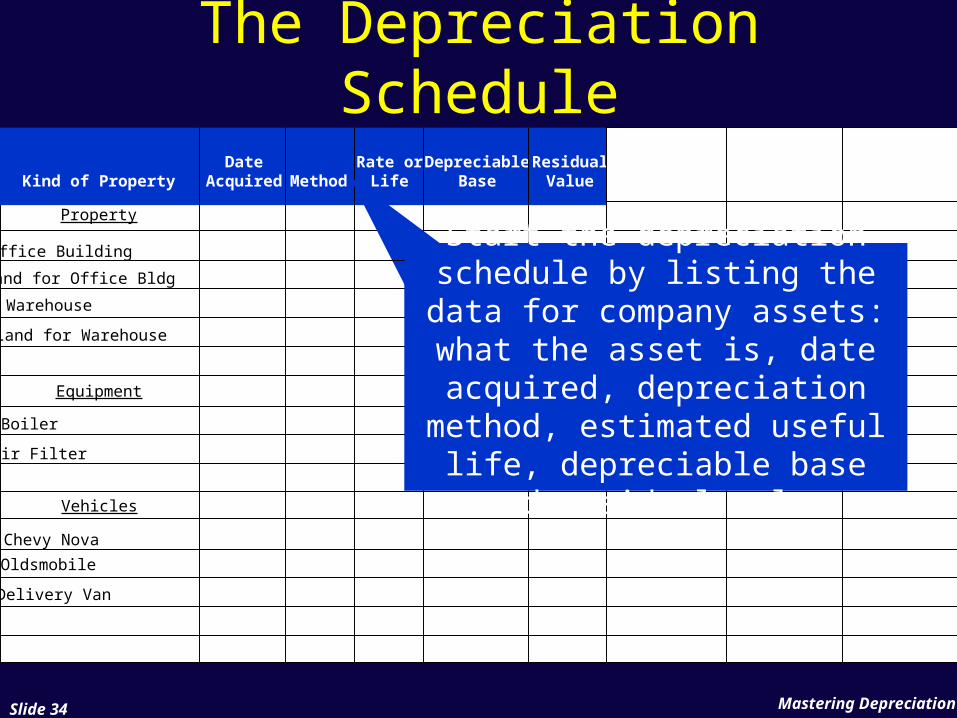
Start the depreciation schedule by listing the data
for company assets: what the asset is, date acquired, depreciation method, estimated useful life,
depreciable base and residual value
Property
Equipment
Vehicles
Office Building
Land for Office Bldg
Warehouse
Land for Warehouse
Boiler
Air Filter
Chevy Nova
Oldsmobile
Delivery Van
Mastering DepreciationSlide 35
The Depreciation Schedule
DateAcquiredKind of Property Method
Rate orLife
DepreciableBase
ResidualValue
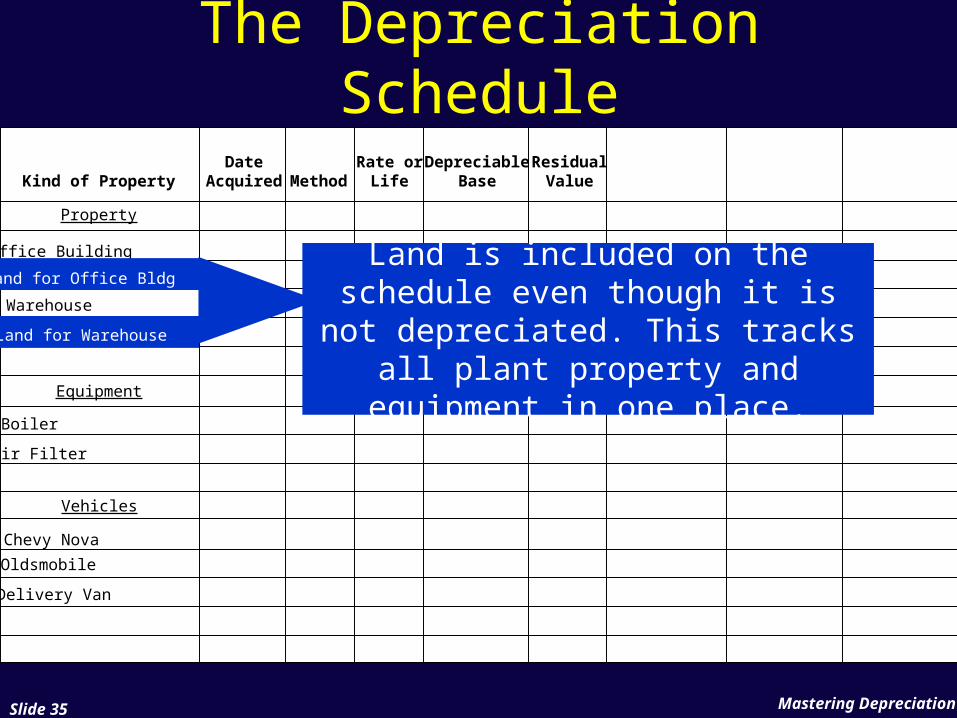
Land is included on the schedule even though it is not depreciated. This tracks all plant property and
equipment in one place.
Property
Equipment
Vehicles
Office Building
Land for Office Bldg
Warehouse
Land for Warehouse
Boiler
Air Filter
Chevy Nova
Oldsmobile
Delivery Van
ResidualValue
Mastering DepreciationSlide 36
The Depreciation Schedule
DateAcquiredKind of Property Method
Rate orLife
DepreciableBase
ResidualValue
Property
Equipment
Vehicles
Totals
Office Building
Land for Office Bldg
Warehouse
Land for Warehouse
Boiler
Air Filter
Chevy Nova
Oldsmobile
Delivery Van
1/5/00
1/5/00
11/12/72
11/12/72
1/1/01
7/2/03
1/1/00
11/3/04
1/14/05
SL
N/A
SL
N/A
SL
SL
SL
SL
SL
30 yrs
4%
15 yrs
8 yrs
5 yrs
6 yrs
20%
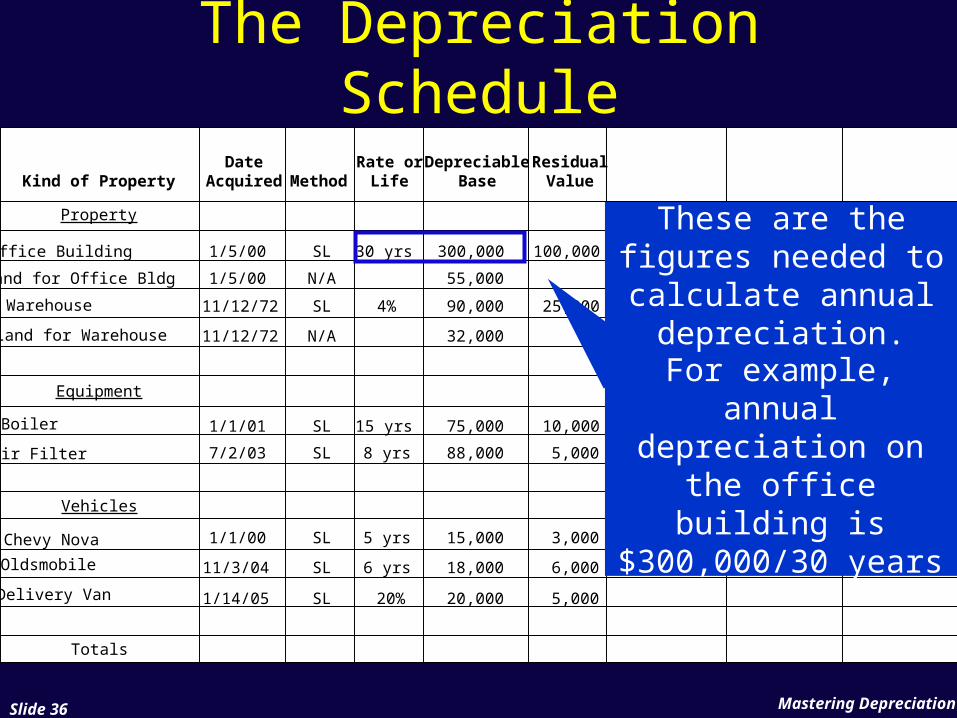
300,000
55,000
90,000
32,000
75,000
88,000
15,000
18,000
20,000
100,000
25,000
10,000
5,000
3,000
6,000
5,000
These are the figures needed to calculate annual
depreciation.For example, annual depreciation on the
office building is$300,000/30 years
Mastering DepreciationSlide 37
The Depreciation Schedule
DateAcquiredKind of Property Method
Rate orLife
DepreciableBase
ResidualValue
DepreciationIn Prior Years
Property
Equipment
Vehicles
Totals
Office Building
Land for Office Bldg
Warehouse
Land for Warehouse
Boiler
Air Filter
Chevy Nova
Oldsmobile
Delivery Van
1/5/00
1/5/00
11/12/72
11/12/72
1/1/01
7/2/03
1/1/00
11/3/04
1/14/05
SL
N/A
SL
N/A
SL
SL
SL
SL
SL
30 yrs
15 yrs
8 yrs
5 yrs
6 yrs
300,000
55,000
90,000
32,000
75,000
88,000
15,000
18,000
20,000
100,000
25,000
10,000
5,000
3,000
6,000
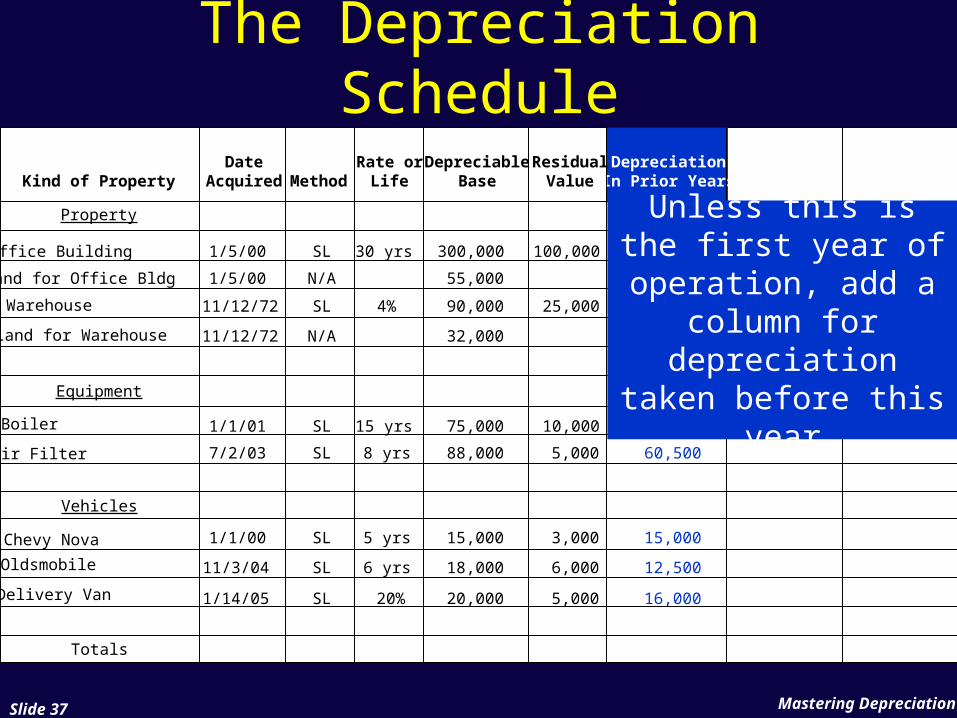
90,000
90,000
40,000
60,500
15,000
12,500
16,0005,000
Unless this is the first year of
operation, add a column for
depreciation taken before this year
4%
20%
Mastering DepreciationSlide 38
The Depreciation Schedule
DateAcquiredKind of Property Method
Rate orLife
DepreciableBase
ResidualValue
DepreciationIn Prior Years
Property
Equipment
Vehicles
Totals
Office Building
Warehouse
Boiler
Air Filter
Chevy Nova
Oldsmobile
Delivery Van
1/5/00
1/5/00
11/12/72
11/12/72
1/1/01
7/2/03
1/1/00
11/3/04
1/14/05
SL
N/A
SL
N/A
SL
SL
SL
SL
SL
30 yrs
15 yrs
8 yrs
5 yrs
6 yrs
300,000
55,000
90,000
32,000
75,000
88,000
15,000
18,000
20,000
100,000
25,000
10,000
5,000
3,000
6,000
90,000
90,000
40,000
60,500
15,000
12,500
16,0005,000
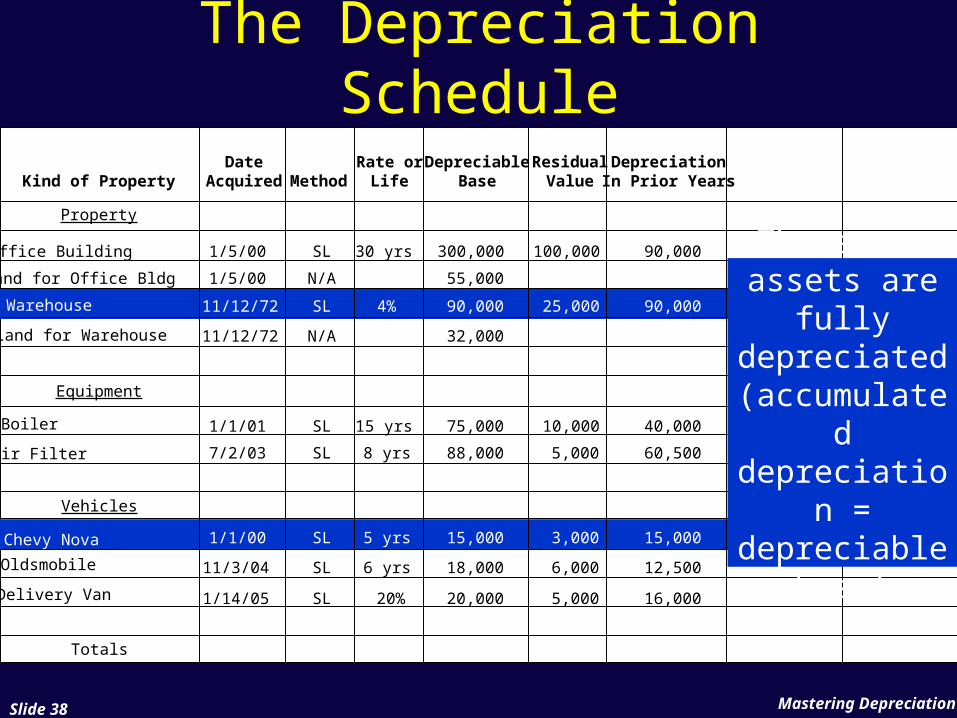
These two assets are
fully depreciated (accumulate
d depreciation
=depreciable
base)
Land for Office Bldg
Land for Warehouse
4%
20%
Mastering DepreciationSlide 39
The Depreciation Schedule
DateAcquiredKind of Property Method
Rate orLife
DepreciableBase
ResidualValue
DepreciationIn Prior Years
DepreciationFor the Y/E12/31/09
Property
Equipment
Vehicles
Totals
Office Building
Warehouse
Boiler
Air Filter
Chevy Nova
Oldsmobile
Delivery Van
1/5/00
1/5/00
11/12/72
11/12/72
1/1/01
7/2/03
1/1/00
11/3/04
1/14/05
SL
N/A
SL
N/A
SL
SL
SL
SL
SL
30 yrs
15 yrs
8 yrs
5 yrs
6 yrs
300,000
55,000
90,000
32,000
75,000
88,000
15,000
18,000
20,000
100,000
25,000
10,000
5,000
3,000
6,000
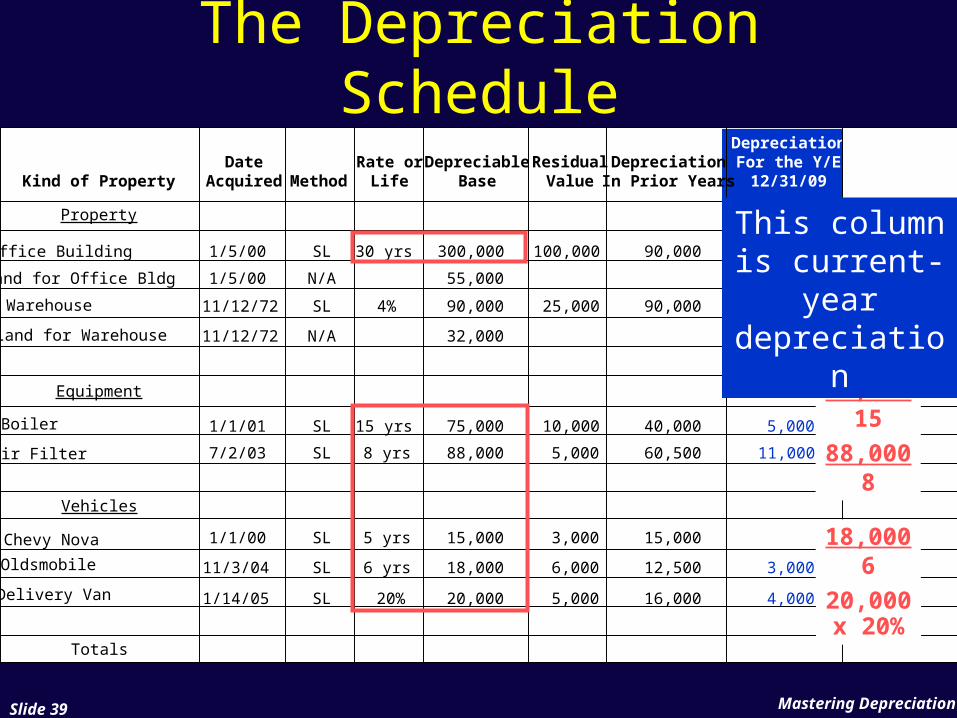
5,000
90,000
90,000
40,000
60,500
15,000
12,500
16,000
10,000
5,000
11,000
3,000
4,000
300,00030
75,00015
88,0008
18,0006
20,000x 20%
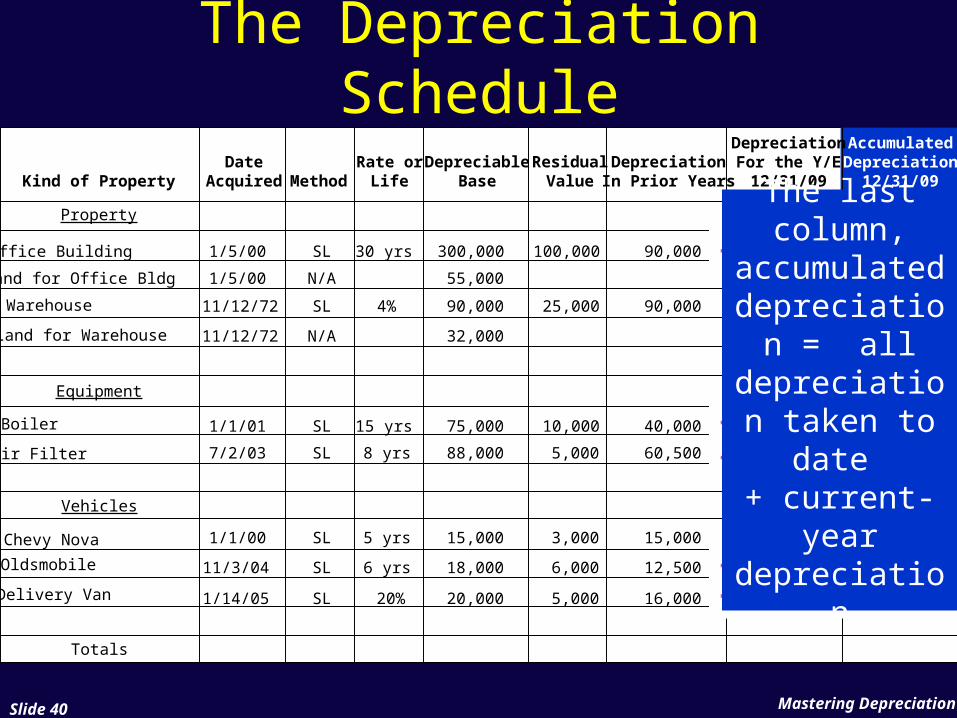
This column is current-
year depreciation
Land for Office Bldg
Land for Warehouse
4%
20%
Mastering DepreciationSlide 40
The Depreciation Schedule
DateAcquiredKind of Property Method
Rate orLife
DepreciableBase
ResidualValue
DepreciationIn Prior Years
DepreciationFor the Y/E12/31/09
AccumulatedDepreciation
12/31/09
Property
Equipment
Vehicles
Totals
Office Building
Warehouse
Boiler
Air Filter
Chevy Nova
Oldsmobile
Delivery Van
1/5/00
1/5/00
11/12/72
11/12/72
1/1/01
7/2/03
1/1/00
11/3/04
1/14/05
SL
N/A
SL
N/A
SL
SL
SL
SL
SL
30 yrs
15 yrs
8 yrs
5 yrs
6 yrs
300,000
55,000
90,000
32,000
75,000
88,000
15,000
18,000
20,000
100,000
25,000
10,000
5,000
3,000
6,000
5,000
90,000
90,000
40,000
60,500
15,000
12,500
16,000
10,000
5,000
11,000
3,000
4,000
100,000
90,000
45,000
71,500
15,000
15,500
20,000
+ =
+ =+ =
+ =+ =
Land for Office Bldg
Land for Warehouse
4%
20%
The last column,
accumulated depreciation
= all depreciation taken to date
+ current-year
depreciation
Mastering DepreciationSlide 41
The Depreciation Schedule
DateAcquiredKind of Property Method
Rate orLife
DepreciableBase
ResidualValue
DepreciationIn Prior Years
DepreciationFor the Y/E12/31/09
AccumulatedDepreciation
12/31/09
Property
Equipment
Vehicles
Totals
Office Building
Warehouse
Boiler
Air Filter
Chevy Nova
Oldsmobile
Delivery Van
1/5/00
1/5/00
11/12/72
11/12/72
1/1/01
7/2/03
1/1/00
11/3/04
1/14/05
SL
N/A
SL
N/A
SL
SL
SL
SL
SL
30 yrs
4%
15 yrs
8 yrs
5 yrs
6 yrs
300,000
55,000
90,000
32,000
75,000
88,000
15,000
18,000
20,000
100,000
25,000
10,000
5,000
3,000
6,000
5,000
90,000
90,000
40,000
60,500
15,000
12,500
16,000
10,000
5,000
11,000
3,000
4,000
100,000
90,000
45,000
71,500
15,000
15,500
20,000
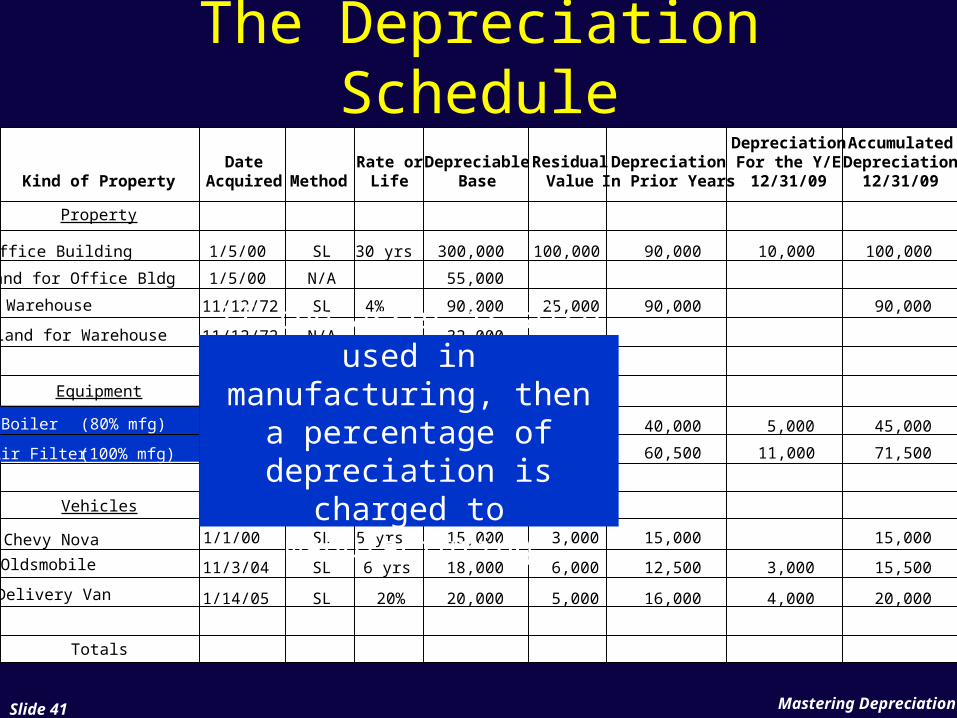
If the asset is also used in manufacturing, then a
percentage of depreciation is charged
to manufacturing
(80% mfg)
(100% mfg)
Land for Office Bldg
Land for Warehouse
20%
Mastering DepreciationSlide 42
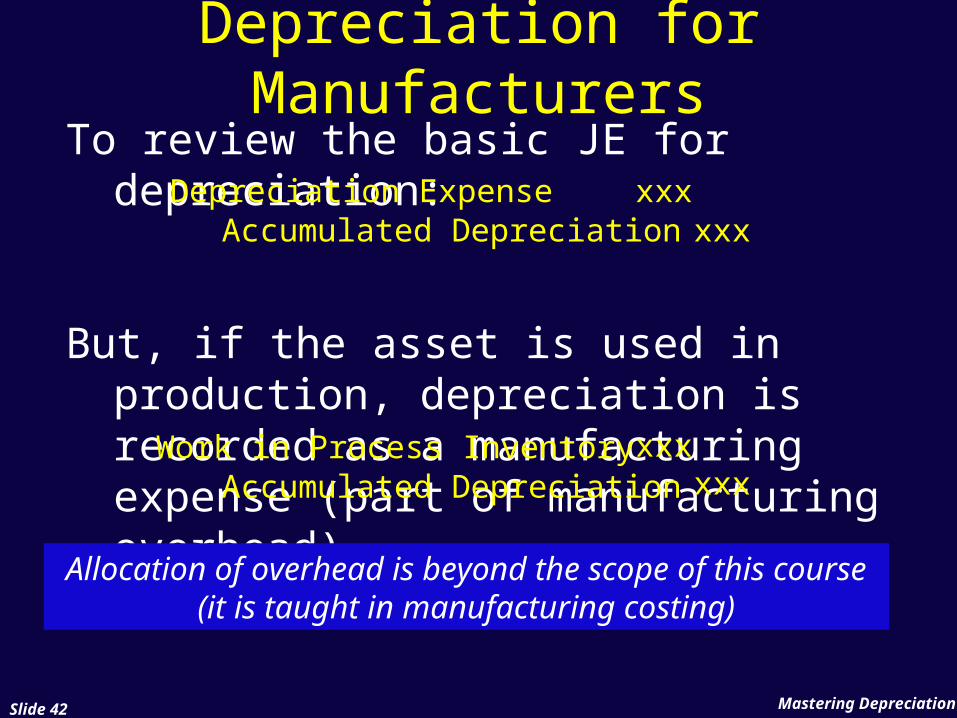
Depreciation for Manufacturers
To review the basic JE for depreciation:
But, if the asset is used in production, depreciation is recorded as a manufacturing expense (part of manufacturing overhead)
Allocation of overhead is beyond the scope of this course (it is taught in manufacturing costing)
Depreciation ExpenseAccumulated Depreciation
xxxxxx
Work in Process InventoryAccumulated Depreciation
xxxxxx
Mastering DepreciationSlide 43
The Depreciation Schedule
DateAcquiredKind of Property Method
Rate orLife
DepreciableBase
ResidualValue
DepreciationIn Prior Years
DepreciationFor the Y/E12/31/09
AccumulatedDepreciation
12/31/09
Property
Equipment
Vehicles
Totals
Office Building
Warehouse
Boiler
Air Filter
Chevy Nova
Oldsmobile
Delivery Van
1/5/00
1/5/00
11/12/72
11/12/72
1/1/01
7/2/03
1/1/00
11/3/04
1/14/05
SL
N/A
SL
N/A
SL
SL
SL
SL
SL
30 yrs
4%
15 yrs
8 yrs
5 yrs
6 yrs
300,000
55,000
90,000
32,000
75,000
88,000
15,000
18,000
20,000
100,000
25,000
10,000
5,000
3,000
6,000
5,000
90,000
90,000
40,000
60,500
15,000
12,500
16,000
10,000
5,000
11,000
3,000
4,000
100,000
90,000
45,000
71,500
15,000
15,500
20,000
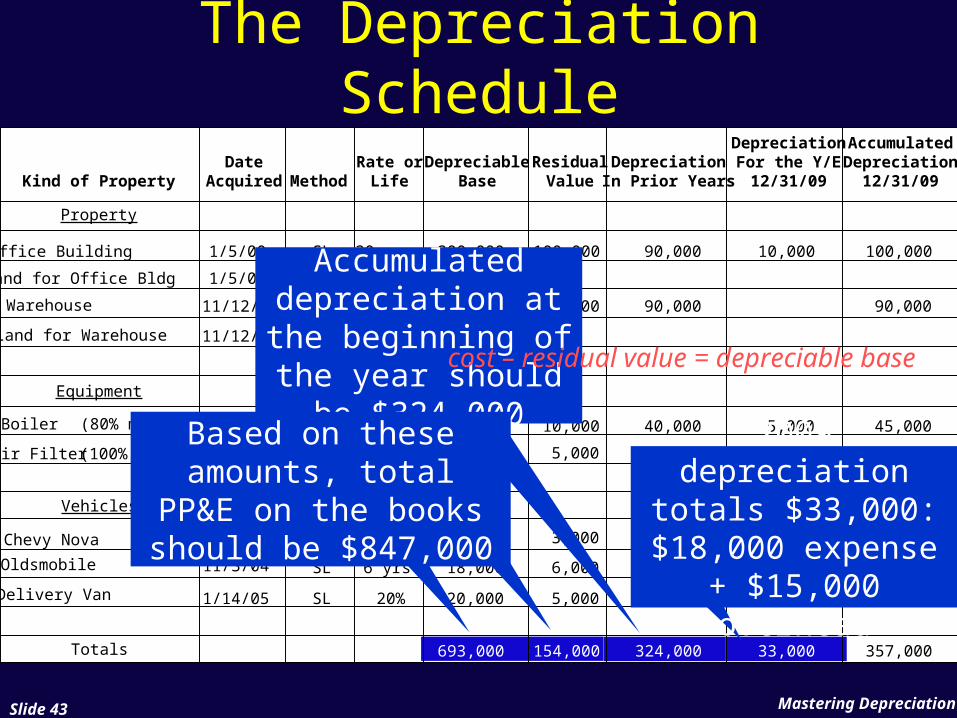
693,000 154,000 324,000 33,000 357,000
(80% mfg)
(100% mfg)
Accumulated depreciation at the
beginning of the year should be
$324,0002009 depreciation
totals $33,000: $18,000 expense
+ $15,000 overhead
Land for Office Bldg
Land for Warehouse
cost – residual value = depreciable base
20%
Based on these amounts, total PP&E on the books should
be $847,000
Mastering DepreciationSlide 44
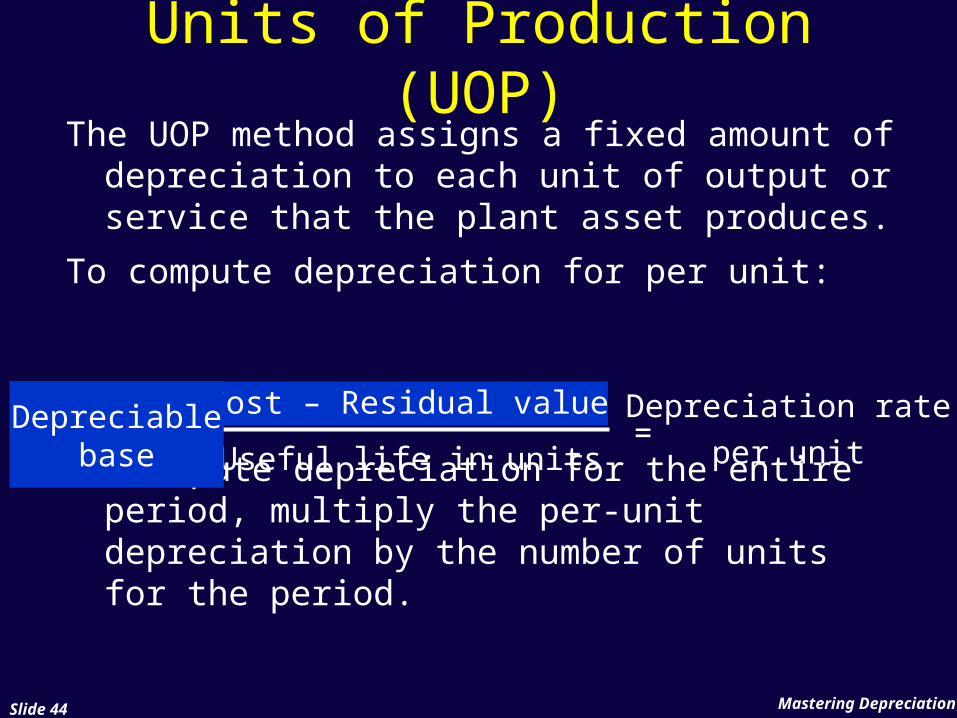
Units of Production (UOP)The UOP method assigns a fixed amount of
depreciation to each unit of output or service that the plant asset produces.
To compute depreciation for per unit:
To compute depreciation for the entire period, multiply the per-unit depreciation by the number of units for the period.
Cost – Residual value
Useful life in unitsDepreciable
base
Depreciation rateper unit
=
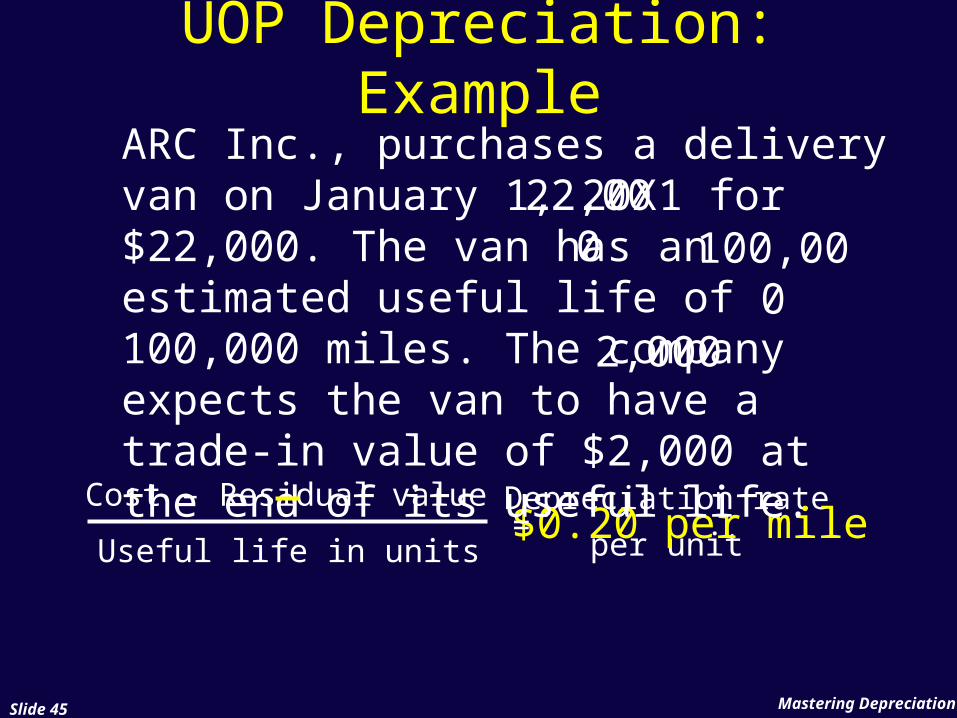
Depreciation rateper unit$0.20 per mile
Mastering DepreciationSlide 45
UOP Depreciation: ExampleARC Inc., purchases a delivery van on January 1, 20X1 for $22,000. The van has an estimated useful life of 100,000 miles. The company expects the van to have a trade-in value of $2,000 at the end of its useful life.
22,000 100,00
02,000
Cost – Residual value
Useful life in units=
Mastering DepreciationSlide 46
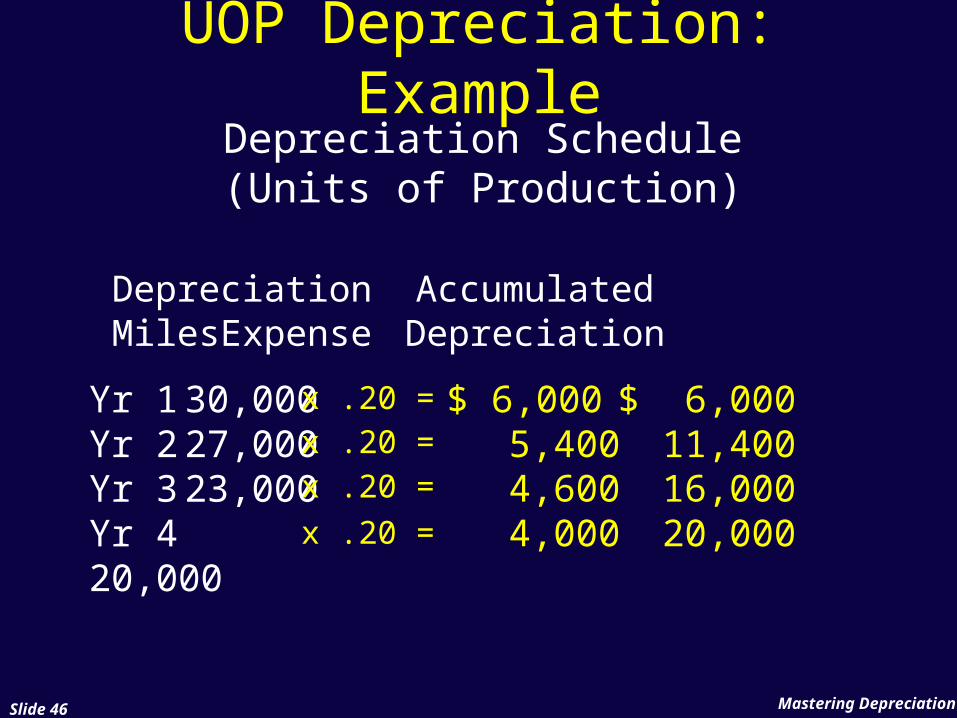
UOP Depreciation: ExampleDepreciation Schedule(Units of Production)
DepreciationAccumulatedMiles Expense Depreciation
Yr 1 30,000Yr 2 27,000Yr 3 23,000Yr 4 20,000
$ 6,000 $ 6,000 5,400 11,400 4,600 16,000 4,000 20,000
x .20 =x .20 =x .20 =x .20 =
Mastering DepreciationSlide 47
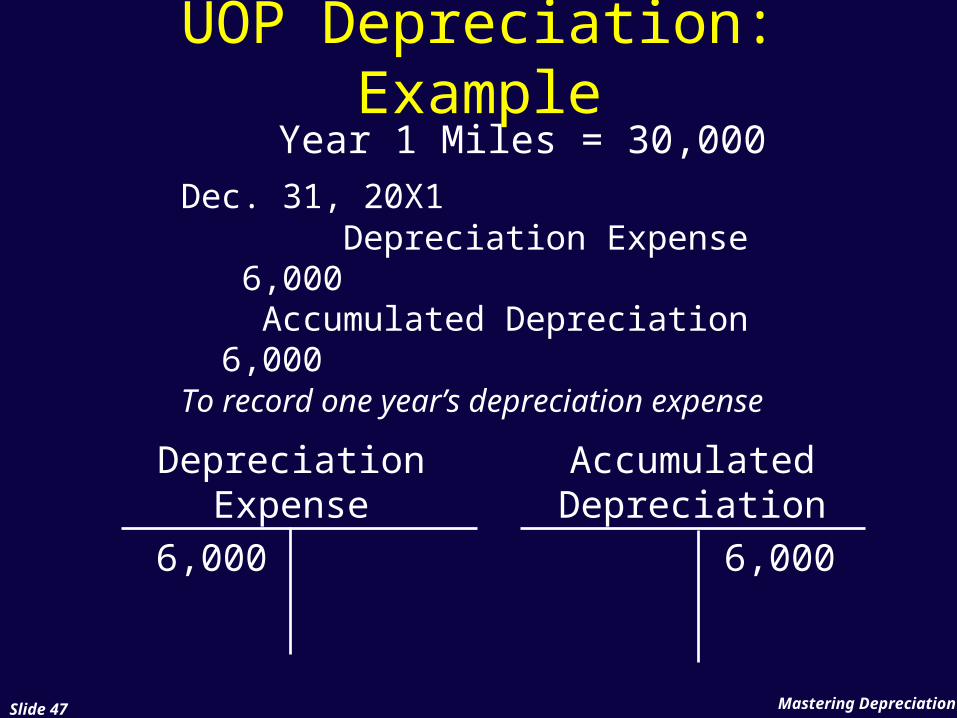
UOP Depreciation: ExampleYear 1 Miles = 30,000
Dec. 31, 20X1 Depreciation Expense 6,000 Accumulated Depreciation 6,000 To record one year’s depreciation expense
DepreciationExpense
AccumulatedDepreciation
6,000 6,000
Mastering DepreciationSlide 48
UOP Depreciation: Example
DepreciationExpense
AccumulatedDepreciation
5,400 6,0005,400
11,400
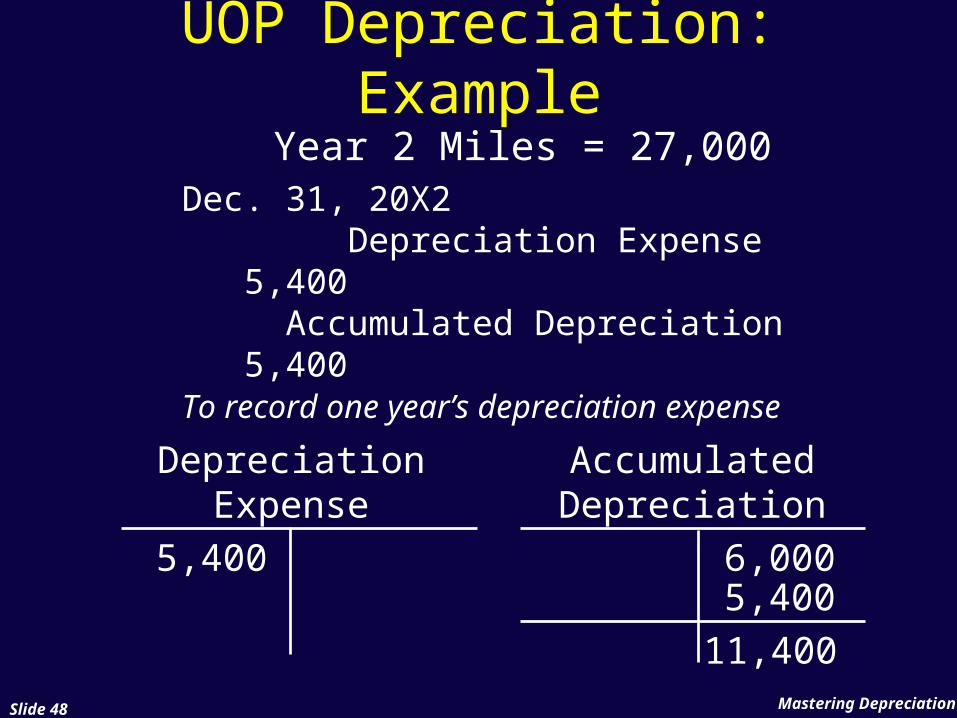
Year 2 Miles = 27,000Dec. 31, 20X2 Depreciation Expense 5,400 Accumulated Depreciation 5,400To record one year’s depreciation expense
Mastering DepreciationSlide 49
Year of AcquisitionUnder UOP, there is no need to
compute partial year depreciation because this method is based on production—not time.
Mastering DepreciationSlide 50
The Depreciation Schedule
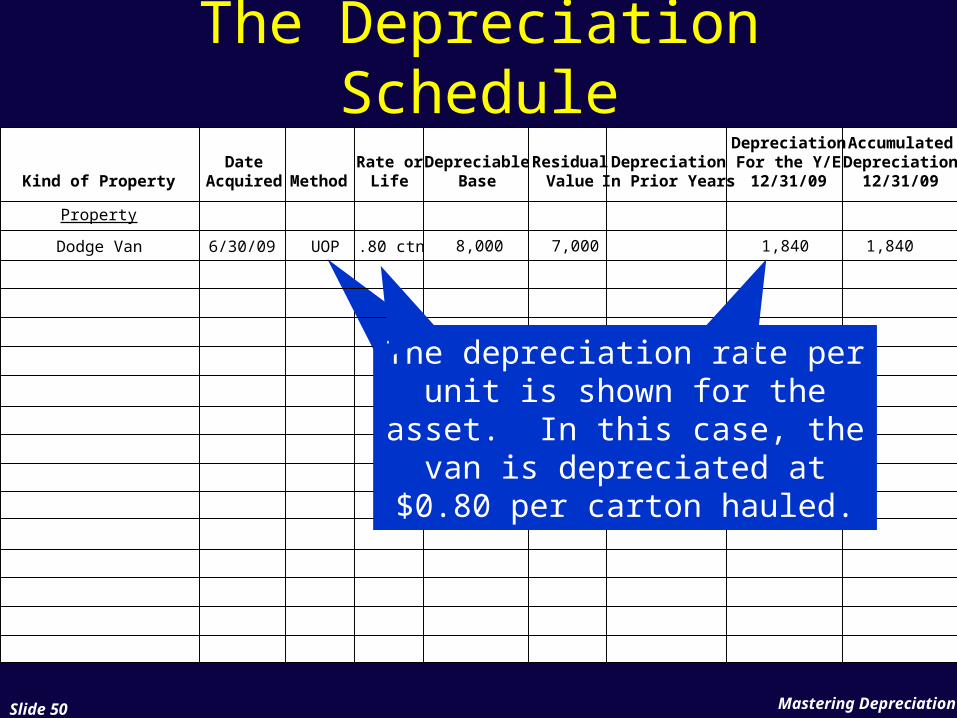
If the van is used to deliver 2,300 cartons, the
depreciation expense is 2,300 x $0.80 = $1,840
An asset being depreciated using units of production is
easily shown on the depreciation schedule.
The depreciation rate per unit is shown for the asset. In this case, the van is depreciated at $0.80 per carton hauled.
Property
DateAcquiredKind of Property Method
Rate orLife
DepreciableBase
ResidualValue
DepreciationIn Prior Years
DepreciationFor the Y/E12/31/09
AccumulatedDepreciation
12/31/09
Dodge Van 6/30/09 UOP .80 ctn 8,000 7,000 1,840 1,840
Mastering DepreciationSlide 51
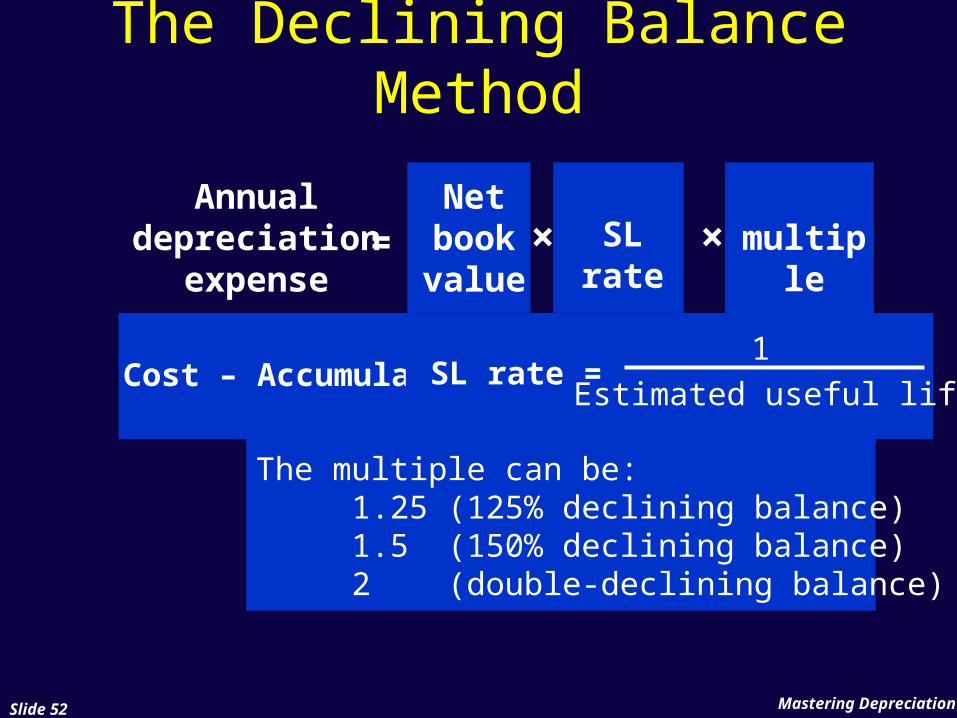
The Declining Balance Method
Declining balance (DB) is an accelerated method that yields higher depreciation in the early years and lower depreciation in later years.
Generally, the DB method is used for an asset that will be more productive (generate more revenue) early in its life.
Mastering DepreciationSlide 52
Annualdepreciation
expense
Netbookvalue
= × SL rate × multiple
Cost – Accumulated Depreciation1
Estimated useful lifeSL rate =
The multiple can be:1.25 (125% declining balance)1.5 (150% declining balance)2 (double-declining balance)
The Declining Balance Method
Mastering DepreciationSlide 53
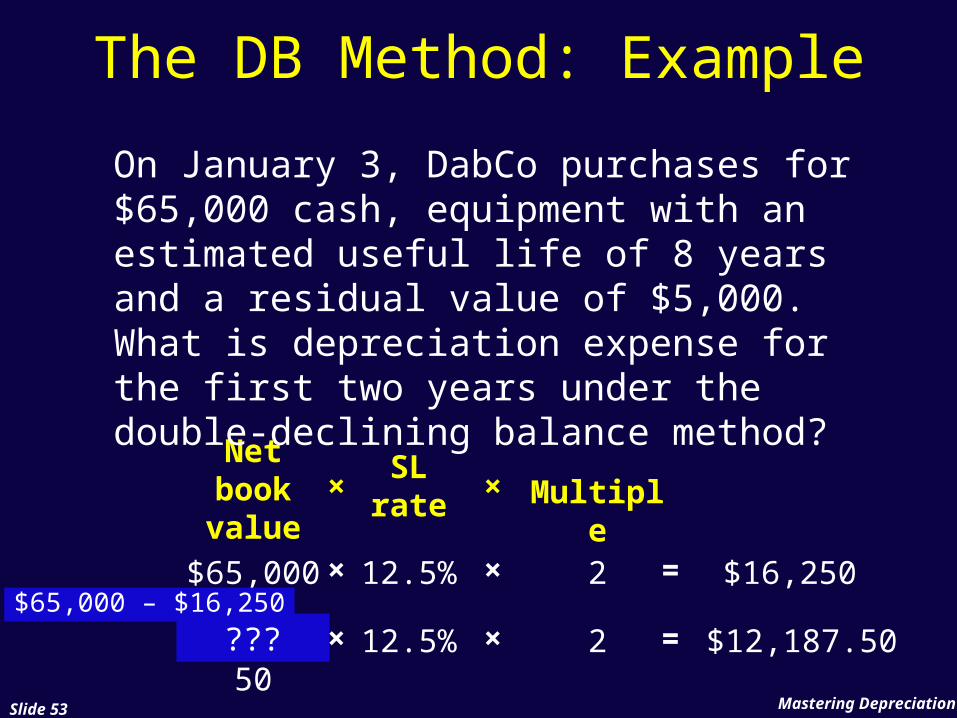
$48,750
???
Netbookvalue
SL rate
The DB Method: Example
On January 3, DabCo purchases for $65,000 cash, equipment with an estimated useful life of 8 years and a residual value of $5,000. What is depreciation expense for the first two years under the double-declining balance method?
× × Multiple
$65,000 12.5% 2× × = $16,250
12.5% 2× × = $12,187.50$65,000 – $16,250
Mastering DepreciationSlide 54
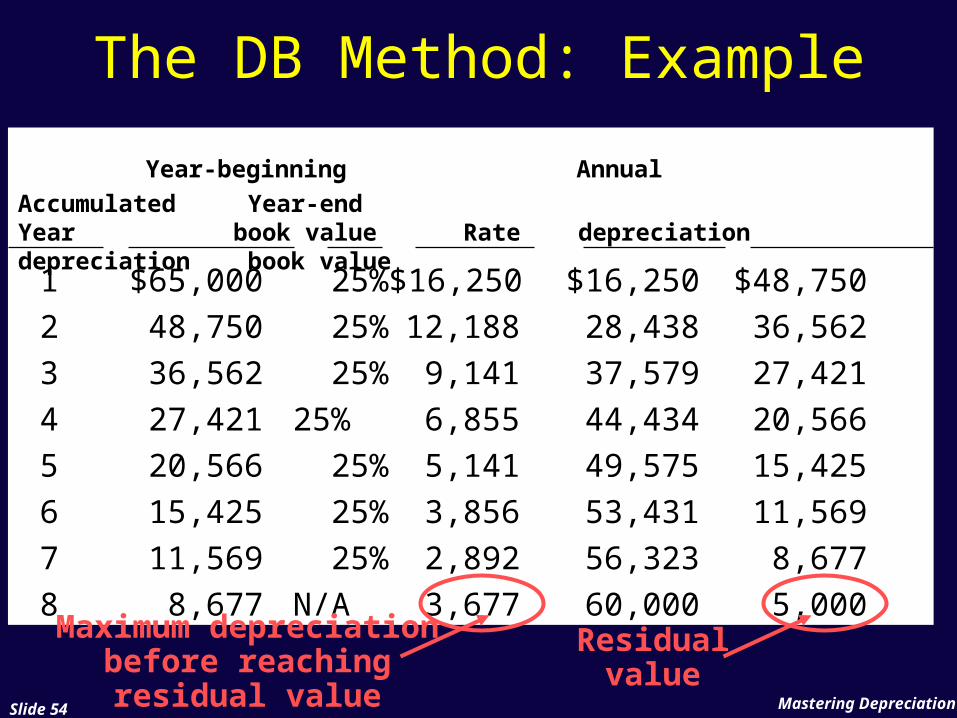
Year-beginning Annual Accumulated Year-endYear book value Rate depreciation depreciation book value
1 $65,000 25% $16,250 $16,250 $48,750
2 48,750 25% 12,188 28,438 36,562
3 36,562 25% 9,141 37,579 27,421
4 27,421 25% 6,855 44,434 20,566
5 20,566 25% 5,141 49,575 15,425
6 15,425 25% 3,856 53,431 11,569
7 11,569 25% 2,892 56,323 8,677
8 8,677 N/A 3,677 60,000 5,000Residual
value
The DB Method: Example
Maximum depreciation before reaching residual
value
Mastering DepreciationSlide 55
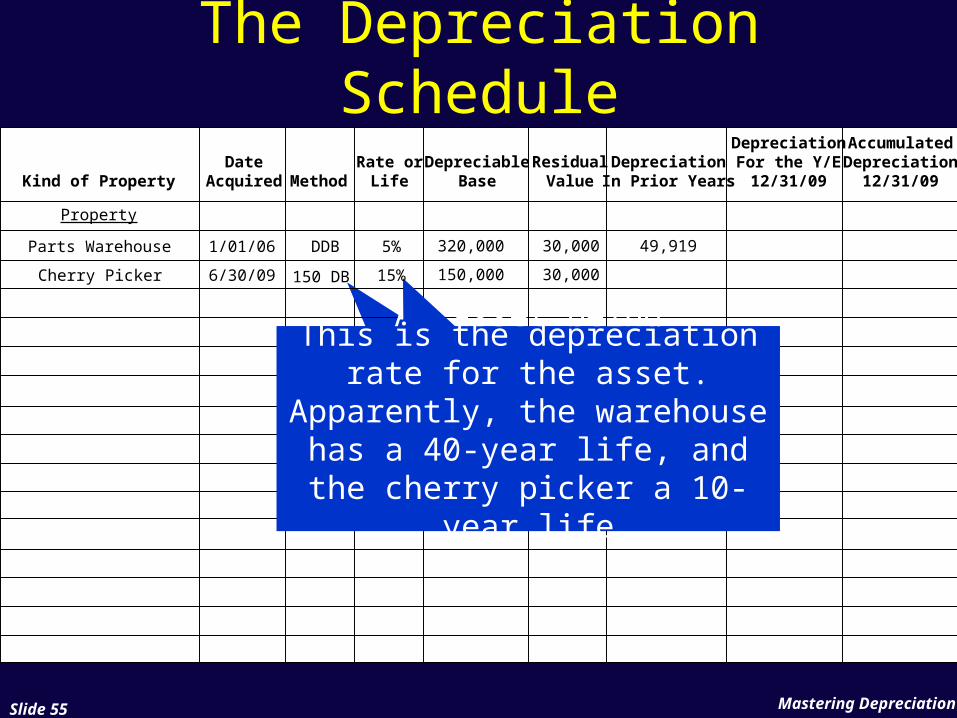
The Depreciation Schedule
An asset being depreciated using a declining balance method is shown on the
schedule as 125 DB, 150 DB, or DDB.
Property
DateAcquiredKind of Property Method
Rate orLife
DepreciableBase
ResidualValue
DepreciationIn Prior Years
DepreciationFor the Y/E12/31/09
AccumulatedDepreciation
12/31/09
Parts Warehouse 1/01/06 DDB 5% 320,000 30,000
Cherry Picker 150 DB6/30/09
49,919
15% 150,000 30,000
This is the depreciation rate for the asset. Apparently, the warehouse has a 40-year life, and the cherry picker a 10-
year life
Mastering DepreciationSlide 56
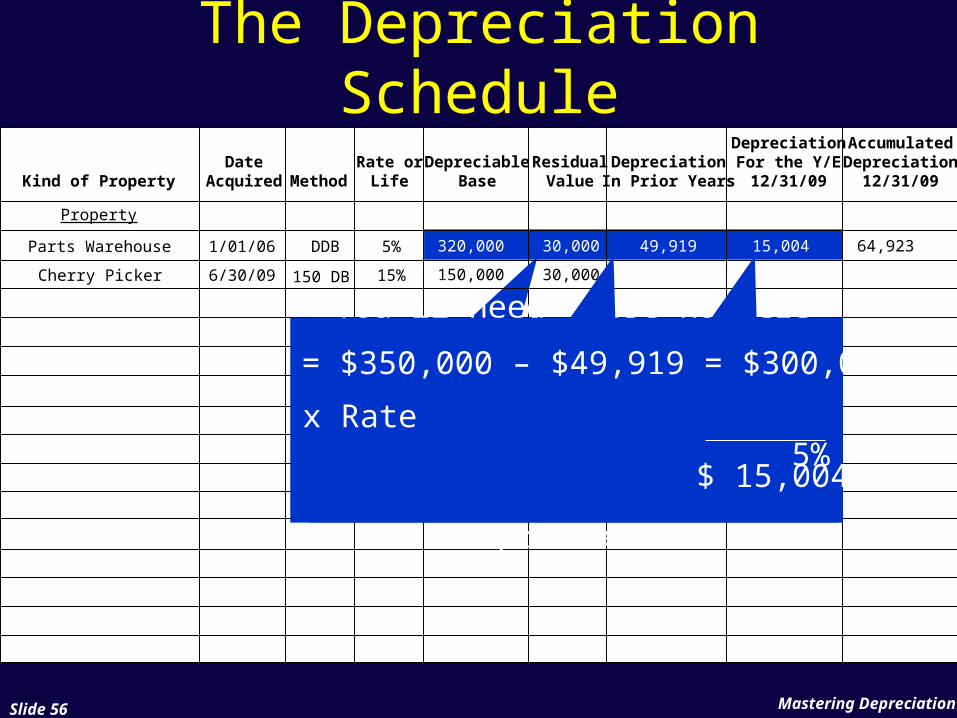
The Depreciation Schedule
You’ll need these numbers to calculate the depreciation since it is based on cost
(depreciable base plus residual value) less accumulated
depreciation
Property
DateAcquiredKind of Property Method
Rate orLife
DepreciableBase
ResidualValue
DepreciationIn Prior Years
DepreciationFor the Y/E12/31/09
AccumulatedDepreciation
12/31/09
Parts Warehouse 1/01/06 DDB 5% 320,000 30,000 15,004 64,923
Cherry Picker 150 DB6/30/09
49,919
15% 150,000 30,000
BV = $350,000 – $49,919 = $300,081
x Rate 5%
$ 15,004
Mastering DepreciationSlide 57
Year of AcquisitionIn the year of acquisition: Calculate the full year’s depreciation
Prorate depreciation based on the period when it occurs (as under SL depreciation)
For Year 2 depreciation, calculate normally using the depreciable base (the book value less Year 1 depreciation).
Mastering DepreciationSlide 58
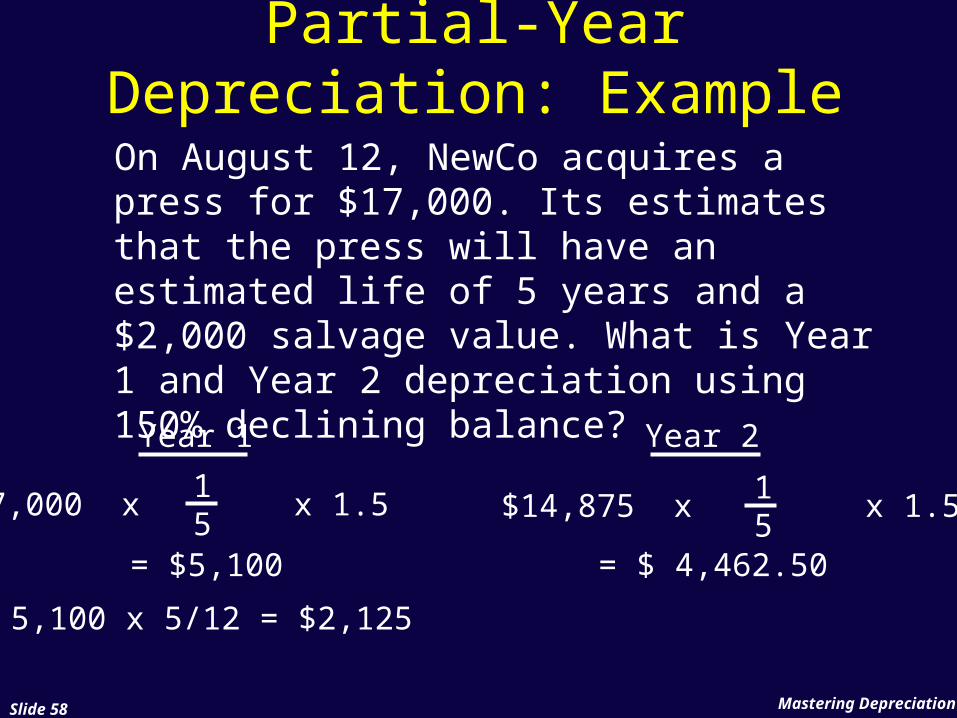
Partial-Year Depreciation: Example
On August 12, NewCo acquires a press for $17,000. Its estimates that the press will have an estimated life of 5 years and a $2,000 salvage value. What is Year 1 and Year 2 depreciation using 150% declining balance?
Year 1
15
$17,000 x x 1.5
= $5,100
$ 5,100 x 5/12 = $2,125
Year 2
$14,875 x x 1.5
= $ 4,462.50
15
Mastering DepreciationSlide 59
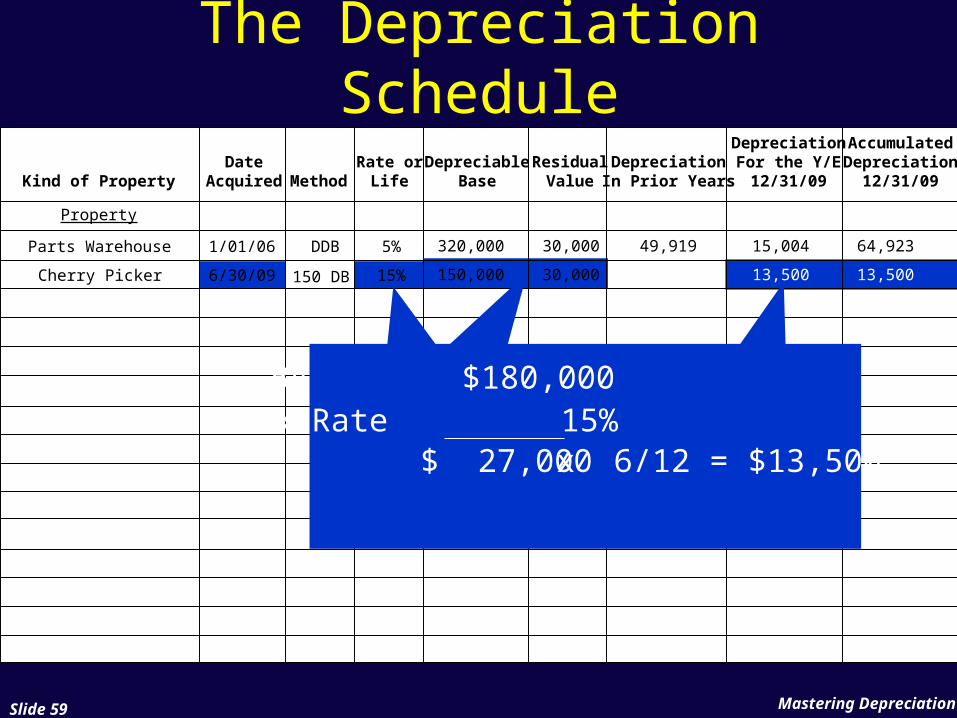
The Depreciation Schedule
Property
DateAcquiredKind of Property Method
Rate orLife
DepreciableBase
ResidualValue
DepreciationIn Prior Years
DepreciationFor the Y/E12/31/09
AccumulatedDepreciation
12/31/09
Parts Warehouse 1/01/06 DDB 5% 320,000 30,000 15,004 64,923
Cherry Picker 150 DB6/30/09
49,919
15% 150,000 30,000 13,500 13,500
BV $180,000x Rate 15%
$ 27,000 x 6/12 = $13,500
Mastering DepreciationSlide 60
Sum-of-the-Years’ Digits (SYD)
This method, another kind of accelerated depreciation, is rarely used today.
The year-to-year decline in depreciation is typically more gradual than under the declining balance method.
Mastering DepreciationSlide 61
Sum-of-the-Years’ Digits (SYD)
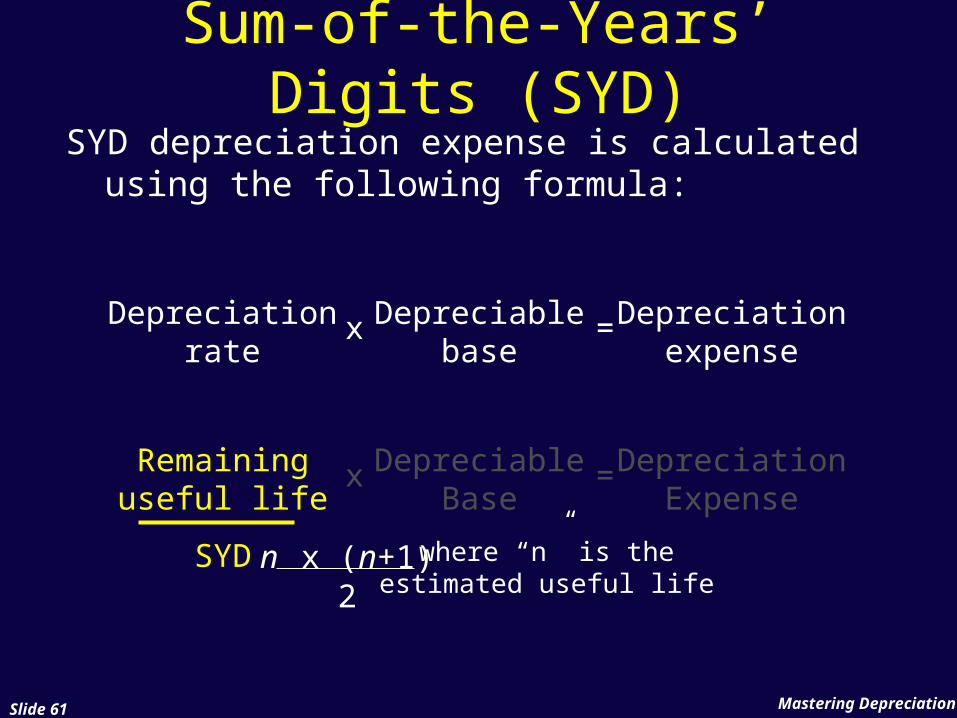
SYD depreciation expense is calculated using the following formula:
Depreciationrate
Depreciablebase
Depreciationexpense
x =
Remaininguseful life
DepreciableBase
DepreciationExpense
x =
SYD n x (n+1)2
where “n” is theestimated useful life
Mastering DepreciationSlide 62
SYD Depreciation in Year 1: Example
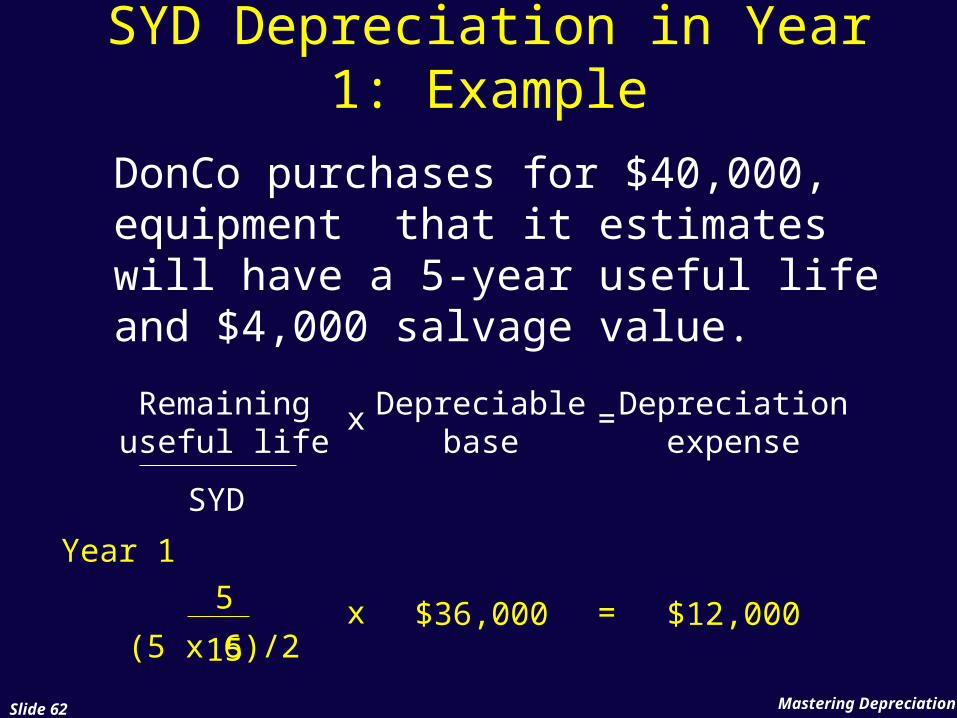
DonCo purchases for $40,000, equipment that it estimates will have a 5-year useful life and $4,000 salvage value.
Remaininguseful life
Depreciablebase
Depreciationexpense
x =
Year 1
5 $36,000 $12,000x =15
SYD
(5 x 6)/2
Mastering DepreciationSlide 63
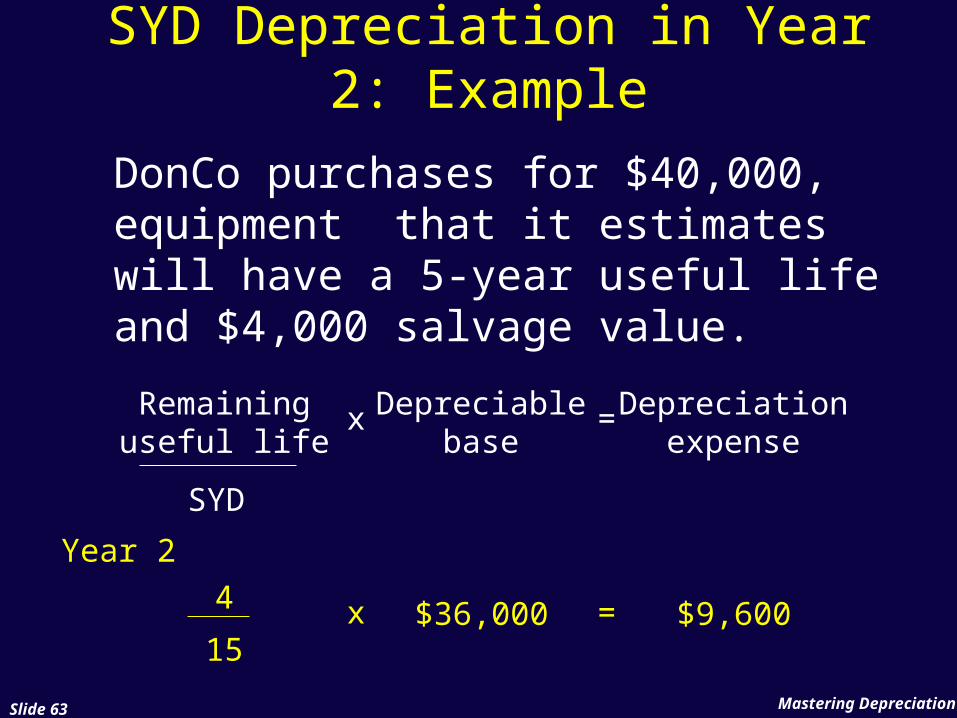
SYD Depreciation in Year 2: Example
Remaininguseful life
Depreciablebase
Depreciationexpense
x =
Year 2
4 $36,000 $9,600x =15
SYD
DonCo purchases for $40,000, equipment that it estimates will have a 5-year useful life and $4,000 salvage value.
Mastering DepreciationSlide 64
Partial-Year SYD Depreciation
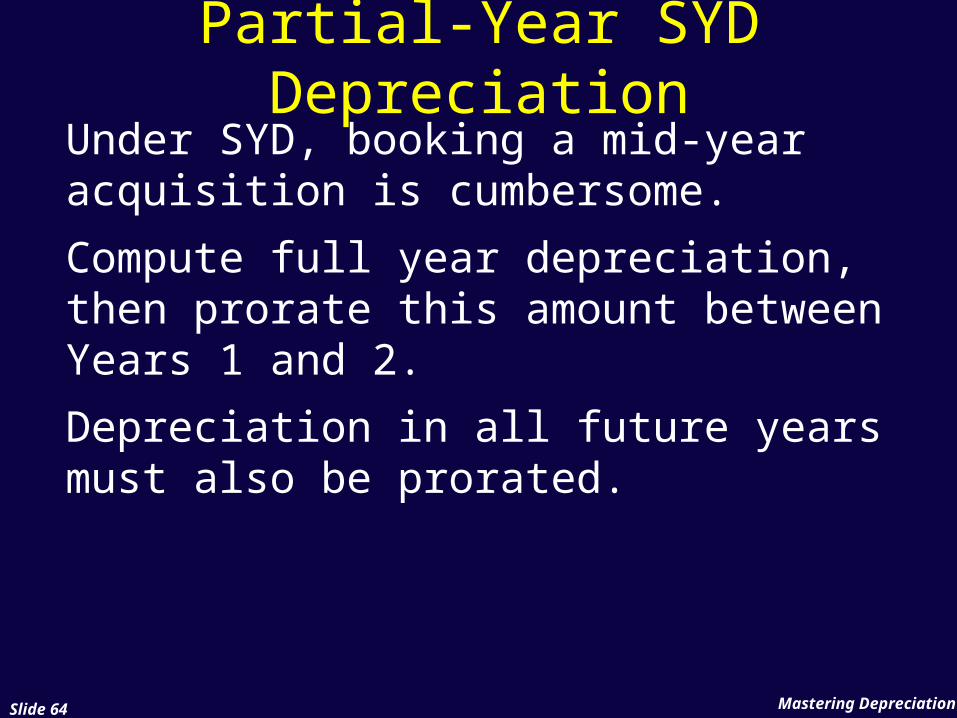
Under SYD, booking a mid-year acquisition is cumbersome.
Compute full year depreciation, then prorate this amount between Years 1 and 2.
Depreciation in all future years must also be prorated.
Mastering DepreciationSlide 65
Partial Year SYD: Example
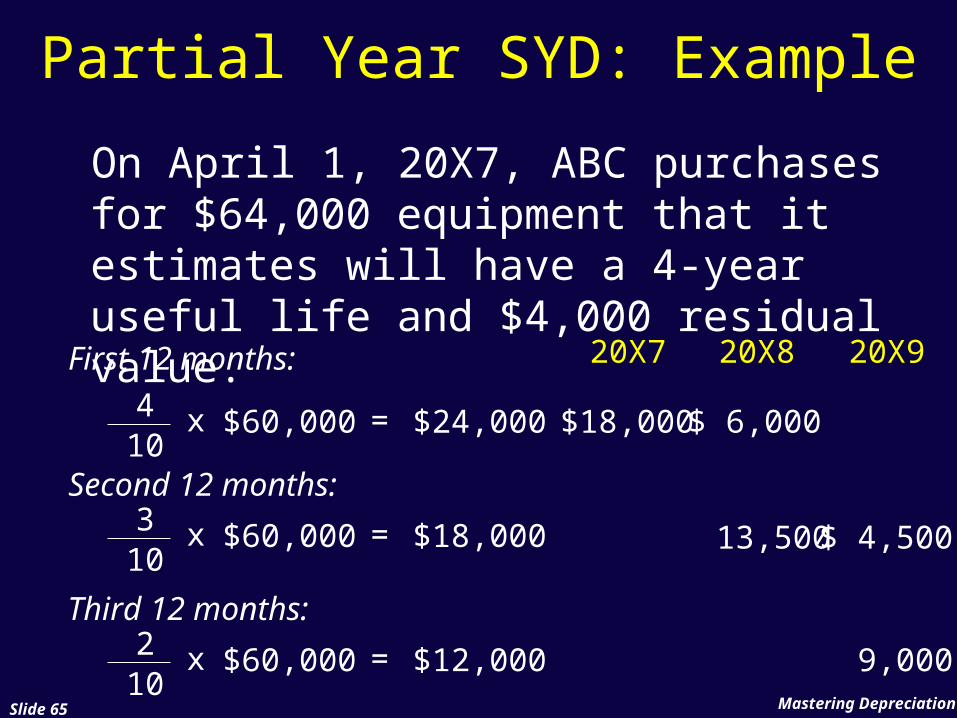
On April 1, 20X7, ABC purchases for $64,000 equipment that it estimates will have a 4-year useful life and $4,000 residual value.
First 12 months:
4 $60,000 $24,000x =10
Second 12 months:3 $60,000 $18,000x =10
Third 12 months:2 $60,000 $12,000x =10
20X7 20X8 20X9
$18,000$ 6,000
13,500$ 4,500
9,000
Mastering DepreciationSlide 66
Tax v. Book Depreciation
Book Book DepreciationDepreciation
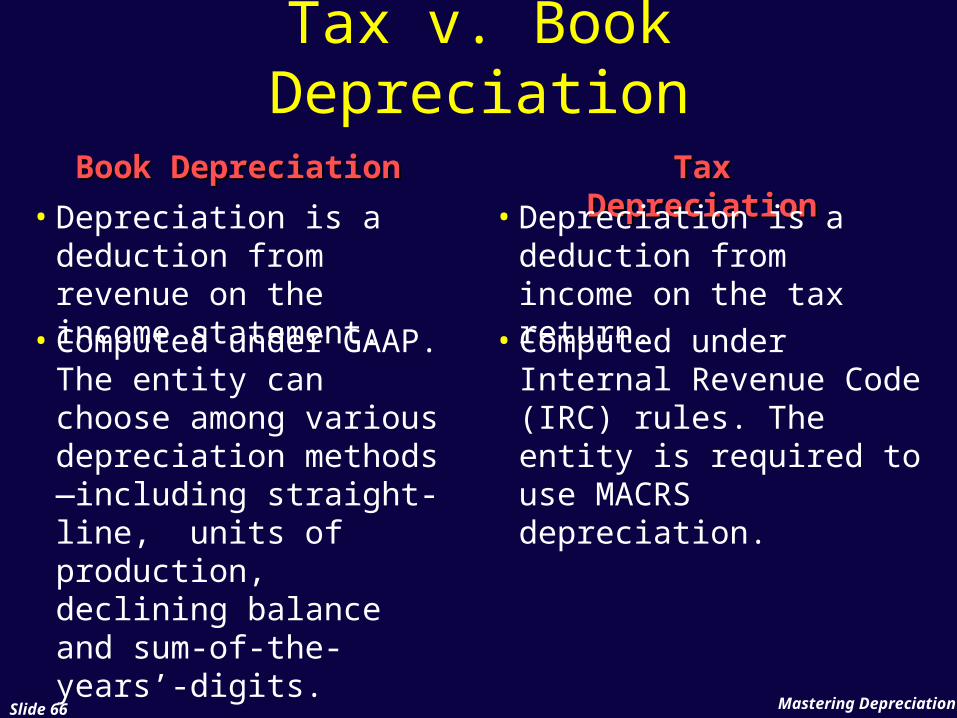
Tax Tax DepreciationDepreciation• Depreciation is a
deduction from revenue on the income statement.
• Depreciation is a deduction from income on the tax return.
• Computed under GAAP. The entity can choose among various depreciation methods—including straight-line, units of production, declining balance and sum-of-the-years’-digits.
• Computed under Internal Revenue Code (IRC) rules. The entity is required to use MACRS depreciation.
Mastering DepreciationSlide 67
Tax v. Book Depreciation
Book Book DepreciationDepreciation
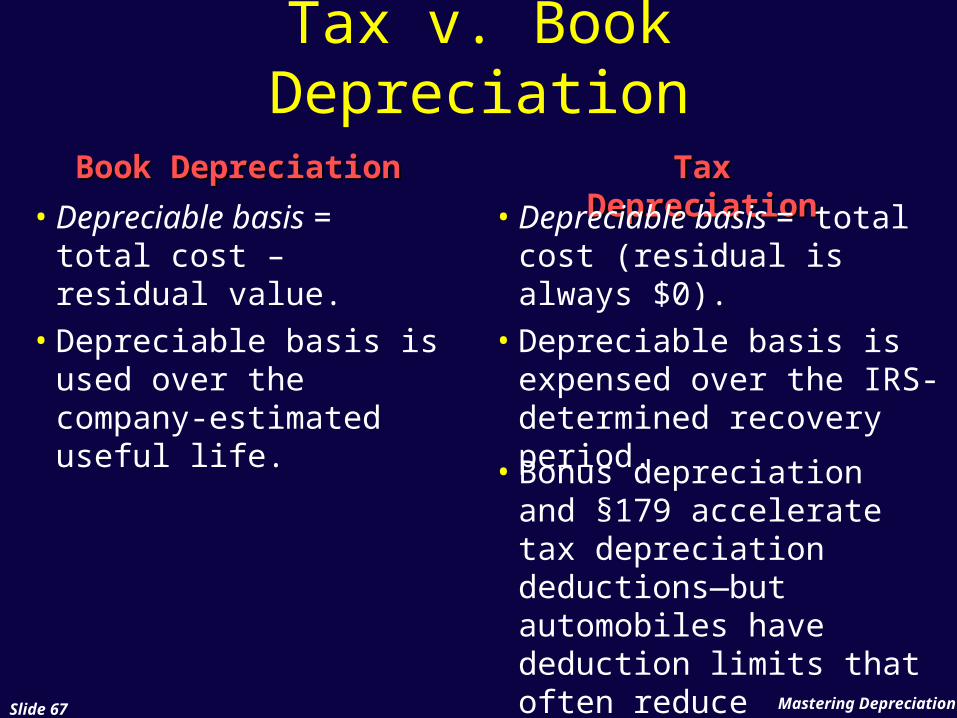
Tax Tax DepreciationDepreciation• Depreciable basis =
total cost – residual value.
• Depreciable basis = total cost (residual is always $0).
• Depreciable basis is used over the company-estimated useful life.
• Depreciable basis is expensed over the IRS-determined recovery period. • Bonus depreciation and §179 accelerate tax depreciation deductions—but automobiles have deduction limits that often reduce deductions.
Mastering DepreciationSlide 68
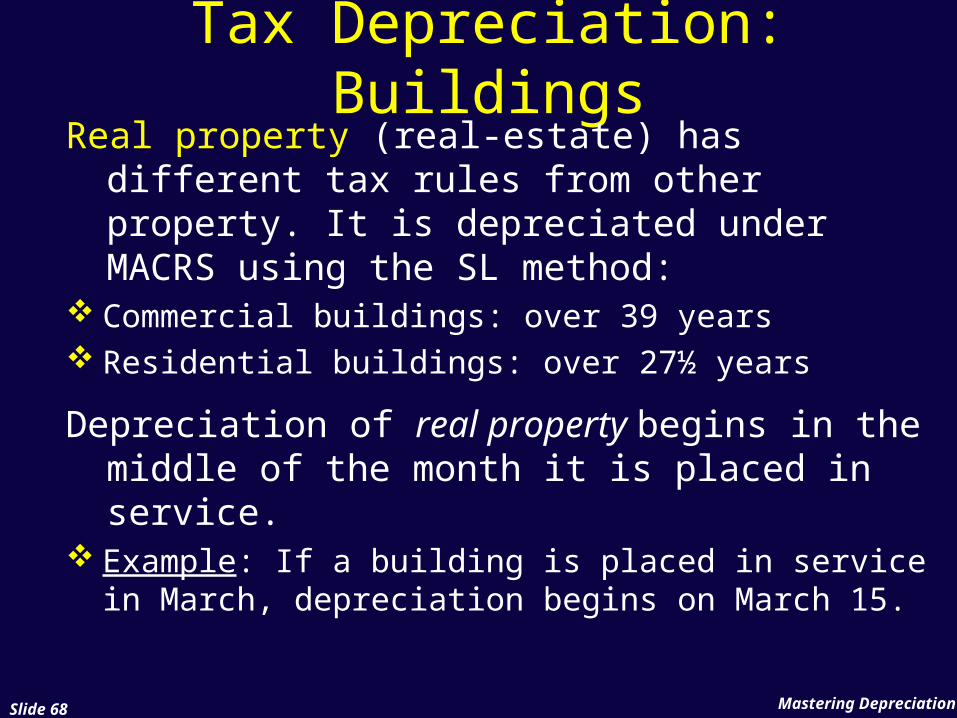
Tax Depreciation: BuildingsReal property (real-estate) has different tax
rules from other property. It is depreciated under MACRS using the SL method:
Commercial buildings: over 39 years Residential buildings: over 27½ years
Depreciation of real property begins in the middle of the month it is placed in service.
Example: If a building is placed in service in March, depreciation begins on March 15.
Use the depreciation rate in the column that corresponds to the month of the year that the property is placed in
service
Mastering DepreciationSlide 69
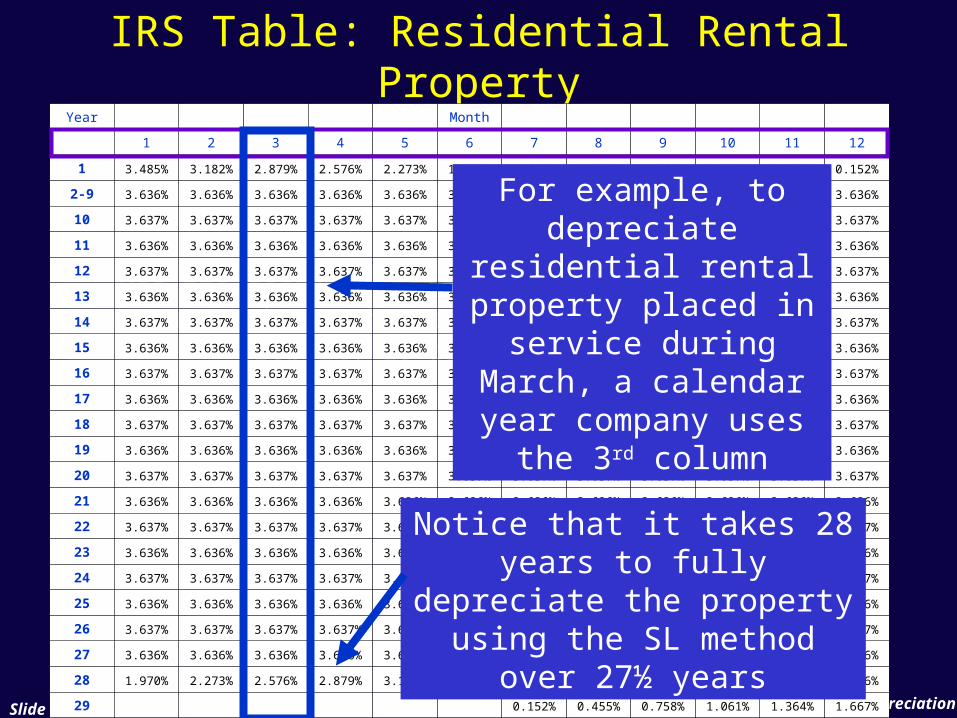
IRS Table: Residential Rental PropertyYear Month
1 2 3 4 5 6 7 8 9 10 11 12
1 3.485% 3.182% 2.879% 2.576% 2.273% 1.970% 1.667% 1.364% 1.061% 0.758% 0.455% 0.152%
2-9 3.636% 3.636% 3.636% 3.636% 3.636% 3.636% 3.636% 3.636% 3.636% 3.636% 3.636% 3.636%
10 3.637% 3.637% 3.637% 3.637% 3.637% 3.637% 3.637% 3.637% 3.637% 3.637% 3.637% 3.637%
11 3.636% 3.636% 3.636% 3.636% 3.636% 3.636% 3.636% 3.636% 3.636% 3.636% 3.636% 3.636%
12 3.637% 3.637% 3.637% 3.637% 3.637% 3.637% 3.637% 3.637% 3.637% 3.637% 3.637% 3.637%
13 3.636% 3.636% 3.636% 3.636% 3.636% 3.636% 3.636% 3.636% 3.636% 3.636% 3.636% 3.636%
14 3.637% 3.637% 3.637% 3.637% 3.637% 3.637% 3.637% 3.637% 3.637% 3.637% 3.637% 3.637%
15 3.636% 3.636% 3.636% 3.636% 3.636% 3.636% 3.636% 3.636% 3.636% 3.636% 3.636% 3.636%
16 3.637% 3.637% 3.637% 3.637% 3.637% 3.637% 3.637% 3.637% 3.637% 3.637% 3.637% 3.637%
17 3.636% 3.636% 3.636% 3.636% 3.636% 3.636% 3.636% 3.636% 3.636% 3.636% 3.636% 3.636%
18 3.637% 3.637% 3.637% 3.637% 3.637% 3.637% 3.637% 3.637% 3.637% 3.637% 3.637% 3.637%
19 3.636% 3.636% 3.636% 3.636% 3.636% 3.636% 3.636% 3.636% 3.636% 3.636% 3.636% 3.636%
20 3.637% 3.637% 3.637% 3.637% 3.637% 3.637% 3.637% 3.637% 3.637% 3.637% 3.637% 3.637%
21 3.636% 3.636% 3.636% 3.636% 3.636% 3.636% 3.636% 3.636% 3.636% 3.636% 3.636% 3.636%
22 3.637% 3.637% 3.637% 3.637% 3.637% 3.637% 3.637% 3.637% 3.637% 3.637% 3.637% 3.637%
23 3.636% 3.636% 3.636% 3.636% 3.636% 3.636% 3.636% 3.636% 3.636% 3.636% 3.636% 3.636%
24 3.637% 3.637% 3.637% 3.637% 3.637% 3.637% 3.637% 3.637% 3.637% 3.637% 3.637% 3.637%
25 3.636% 3.636% 3.636% 3.636% 3.636% 3.636% 3.636% 3.636% 3.636% 3.636% 3.636% 3.636%
26 3.637% 3.637% 3.637% 3.637% 3.637% 3.637% 3.637% 3.637% 3.637% 3.637% 3.637% 3.637%
27 3.636% 3.636% 3.636% 3.636% 3.636% 3.636% 3.636% 3.636% 3.636% 3.636% 3.636% 3.636%
28 1.970% 2.273% 2.576% 2.879% 3.182% 3.485% 3.636% 3.636% 3.636% 3.636% 3.636% 3.636%
29 0.152% 0.455% 0.758% 1.061% 1.364% 1.667%
For example, to depreciate residential rental property placed
in service during March, a calendar
year company uses the 3rd column
Notice that it takes 28 years to fully depreciate the property using the SL method over 27½ years
Mastering DepreciationSlide 70
IRS Table: Residential Rental PropertyYear Month
1 2 3 4 5 6 7 8 9 10 11 12
1 3.485% 3.182% 2.879% 2.576% 2.273% 1.970% 1.667% 1.364% 1.061% 0.758% 0.455% 0.152%
2-9 3.636% 3.636% 3.636% 3.636% 3.636% 3.636% 3.636% 3.636% 3.636% 3.636% 3.636% 3.636%
10 3.637% 3.637% 3.637% 3.637% 3.637% 3.637% 3.637% 3.637% 3.637% 3.637% 3.637% 3.637%
11 3.636% 3.636% 3.636% 3.636% 3.636% 3.636% 3.636% 3.636% 3.636% 3.636% 3.636% 3.636%
12 3.637% 3.637% 3.637% 3.637% 3.637% 3.637% 3.637% 3.637% 3.637% 3.637% 3.637% 3.637%
13 3.636% 3.636% 3.636% 3.636% 3.636% 3.636% 3.636% 3.636% 3.636% 3.636% 3.636% 3.636%
14 3.637% 3.637% 3.637% 3.637% 3.637% 3.637% 3.637% 3.637% 3.637% 3.637% 3.637% 3.637%
15 3.636% 3.636% 3.636% 3.636% 3.636% 3.636% 3.636% 3.636% 3.636% 3.636% 3.636% 3.636%
16 3.637% 3.637% 3.637% 3.637% 3.637% 3.637% 3.637% 3.637% 3.637% 3.637% 3.637% 3.637%
17 3.636% 3.636% 3.636% 3.636% 3.636% 3.636% 3.636% 3.636% 3.636% 3.636% 3.636% 3.636%
18 3.637% 3.637% 3.637% 3.637% 3.637% 3.637% 3.637% 3.637% 3.637% 3.637% 3.637% 3.637%
19 3.636% 3.636% 3.636% 3.636% 3.636% 3.636% 3.636% 3.636% 3.636% 3.636% 3.636% 3.636%
20 3.637% 3.637% 3.637% 3.637% 3.637% 3.637% 3.637% 3.637% 3.637% 3.637% 3.637% 3.637%
21 3.636% 3.636% 3.636% 3.636% 3.636% 3.636% 3.636% 3.636% 3.636% 3.636% 3.636% 3.636%
22 3.637% 3.637% 3.637% 3.637% 3.637% 3.637% 3.637% 3.637% 3.637% 3.637% 3.637% 3.637%
23 3.636% 3.636% 3.636% 3.636% 3.636% 3.636% 3.636% 3.636% 3.636% 3.636% 3.636% 3.636%
24 3.637% 3.637% 3.637% 3.637% 3.637% 3.637% 3.637% 3.637% 3.637% 3.637% 3.637% 3.637%
25 3.636% 3.636% 3.636% 3.636% 3.636% 3.636% 3.636% 3.636% 3.636% 3.636% 3.636% 3.636%
26 3.637% 3.637% 3.637% 3.637% 3.637% 3.637% 3.637% 3.637% 3.637% 3.637% 3.637% 3.637%
27 3.636% 3.636% 3.636% 3.636% 3.636% 3.636% 3.636% 3.636% 3.636% 3.636% 3.636% 3.636%
28 1.970% 2.273% 2.576% 2.879% 3.182% 3.485% 3.636% 3.636% 3.636% 3.636% 3.636% 3.636%
29 0.152% 0.455% 0.758% 1.061% 1.364% 1.667%
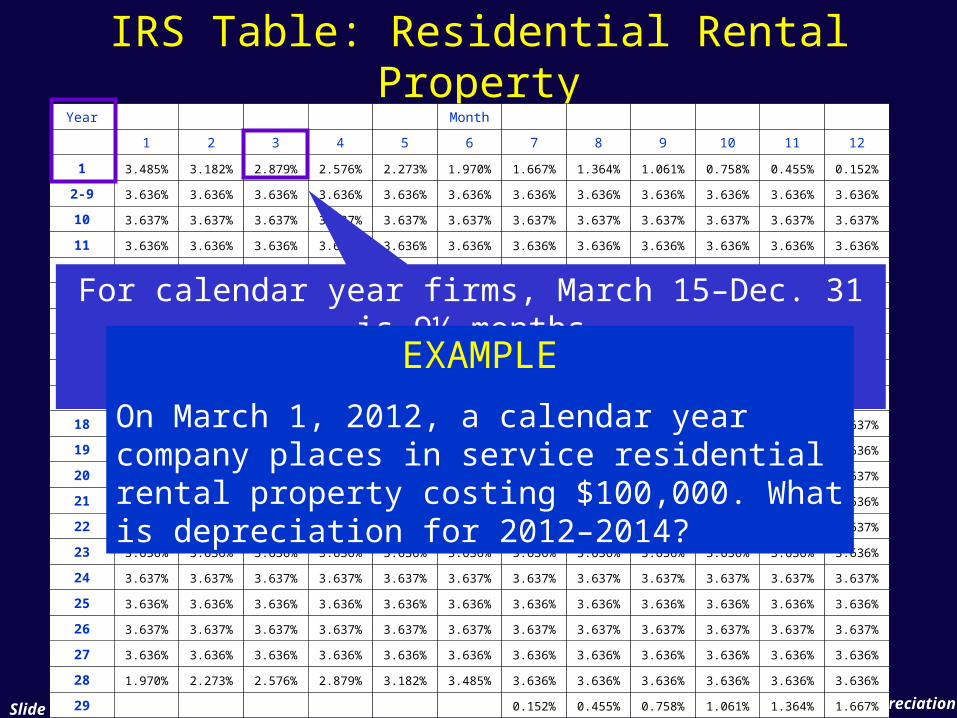
For calendar year firms, March 15–Dec. 31 is 9½ months
1/27.5 = 3.636% x 9.5/12 = 2.879%EXAMPLE
On March 1, 2012, a calendar year company places in service residential rental property costing $100,000. What is depreciation for 2012–2014?
Mastering DepreciationSlide 71
IRS Table: Residential Rental PropertyYear Month
1 2 3 4 5 6 7 8 9 10 11 12
1 3.485% 3.182% 2.879% 2.576% 2.273% 1.970% 1.667% 1.364% 1.061% 0.758% 0.455% 0.152%
2-9 3.636% 3.636% 3.636% 3.636% 3.636% 3.636% 3.636% 3.636% 3.636% 3.636% 3.636% 3.636%
10 3.637% 3.637% 3.637% 3.637% 3.637% 3.637% 3.637% 3.637% 3.637% 3.637% 3.637% 3.637%
11 3.636% 3.636% 3.636% 3.636% 3.636% 3.636% 3.636% 3.636% 3.636% 3.636% 3.636% 3.636%
12 3.637% 3.637% 3.637% 3.637% 3.637% 3.637% 3.637% 3.637% 3.637% 3.637% 3.637% 3.637%
13 3.636% 3.636% 3.636% 3.636% 3.636% 3.636% 3.636% 3.636% 3.636% 3.636% 3.636% 3.636%
14 3.637% 3.637% 3.637% 3.637% 3.637% 3.637% 3.637% 3.637% 3.637% 3.637% 3.637% 3.637%
15 3.636% 3.636% 3.636% 3.636% 3.636% 3.636% 3.636% 3.636% 3.636% 3.636% 3.636% 3.636%
16 3.637% 3.637% 3.637% 3.637% 3.637% 3.637% 3.637% 3.637% 3.637% 3.637% 3.637% 3.637%
17 3.636% 3.636% 3.636% 3.636% 3.636% 3.636% 3.636% 3.636% 3.636% 3.636% 3.636% 3.636%
18 3.637% 3.637% 3.637% 3.637% 3.637% 3.637% 3.637% 3.637% 3.637% 3.637% 3.637% 3.637%
19 3.636% 3.636% 3.636% 3.636% 3.636% 3.636% 3.636% 3.636% 3.636% 3.636% 3.636% 3.636%
20 3.637% 3.637% 3.637% 3.637% 3.637% 3.637% 3.637% 3.637% 3.637% 3.637% 3.637% 3.637%
21 3.636% 3.636% 3.636% 3.636% 3.636% 3.636% 3.636% 3.636% 3.636% 3.636% 3.636% 3.636%
22 3.637% 3.637% 3.637% 3.637% 3.637% 3.637% 3.637% 3.637% 3.637% 3.637% 3.637% 3.637%
23 3.636% 3.636% 3.636% 3.636% 3.636% 3.636% 3.636% 3.636% 3.636% 3.636% 3.636% 3.636%
24 3.637% 3.637% 3.637% 3.637% 3.637% 3.637% 3.637% 3.637% 3.637% 3.637% 3.637% 3.637%
25 3.636% 3.636% 3.636% 3.636% 3.636% 3.636% 3.636% 3.636% 3.636% 3.636% 3.636% 3.636%
26 3.637% 3.637% 3.637% 3.637% 3.637% 3.637% 3.637% 3.637% 3.637% 3.637% 3.637% 3.637%
27 3.636% 3.636% 3.636% 3.636% 3.636% 3.636% 3.636% 3.636% 3.636% 3.636% 3.636% 3.636%
28 1.970% 2.273% 2.576% 2.879% 3.182% 3.485% 3.636% 3.636% 3.636% 3.636% 3.636% 3.636%
29 0.152% 0.455% 0.758% 1.061% 1.364% 1.667%
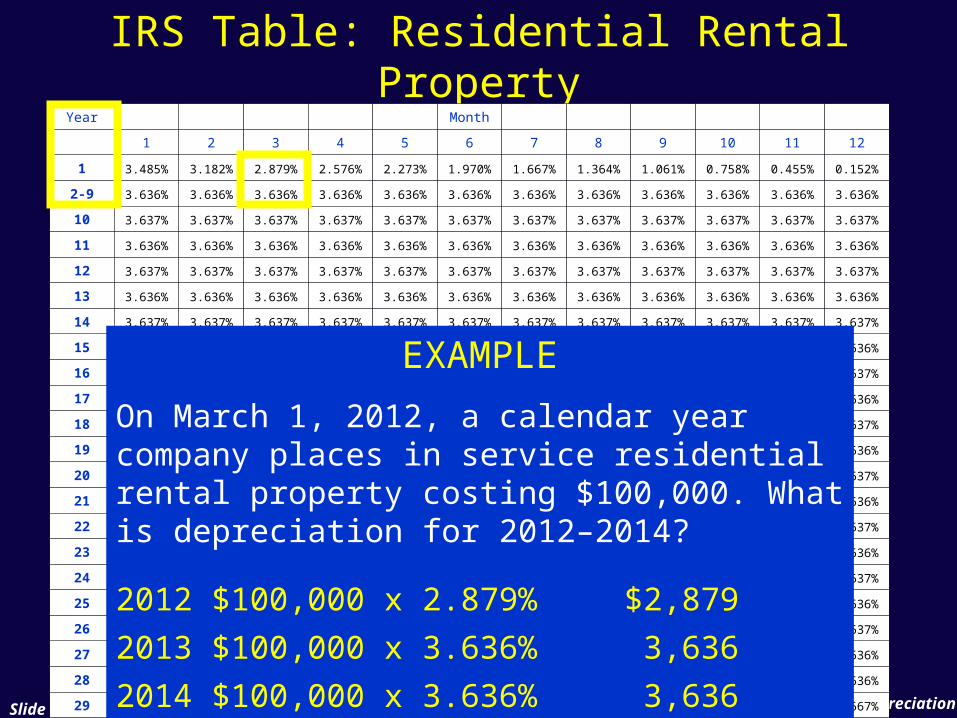
EXAMPLE
On March 1, 2012, a calendar year company places in service residential rental property costing $100,000. What is depreciation for 2012–2014?
2012 $100,000 x 2.879% $2,879
2013 $100,000 x 3.636% 3,636
2014 $100,000 x 3.636% 3,636
Mastering DepreciationSlide 72
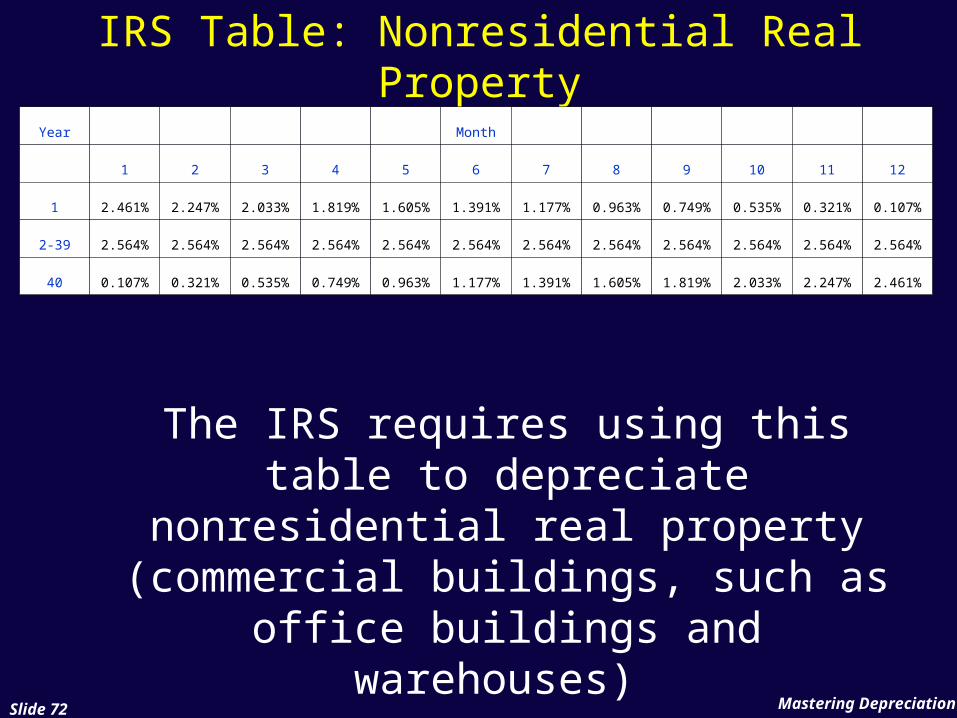
IRS Table: Nonresidential Real Property
Year Month
1 2 3 4 5 6 7 8 9 10 11 12
1 2.461% 2.247% 2.033% 1.819% 1.605% 1.391% 1.177% 0.963% 0.749% 0.535% 0.321% 0.107%
2-39 2.564% 2.564% 2.564% 2.564% 2.564% 2.564% 2.564% 2.564% 2.564% 2.564% 2.564% 2.564%
40 0.107% 0.321% 0.535% 0.749% 0.963% 1.177% 1.391% 1.605% 1.819% 2.033% 2.247% 2.461%
The IRS requires using this table to depreciate nonresidential real
property (commercial buildings, such as office buildings and warehouses)
Mastering DepreciationSlide 73
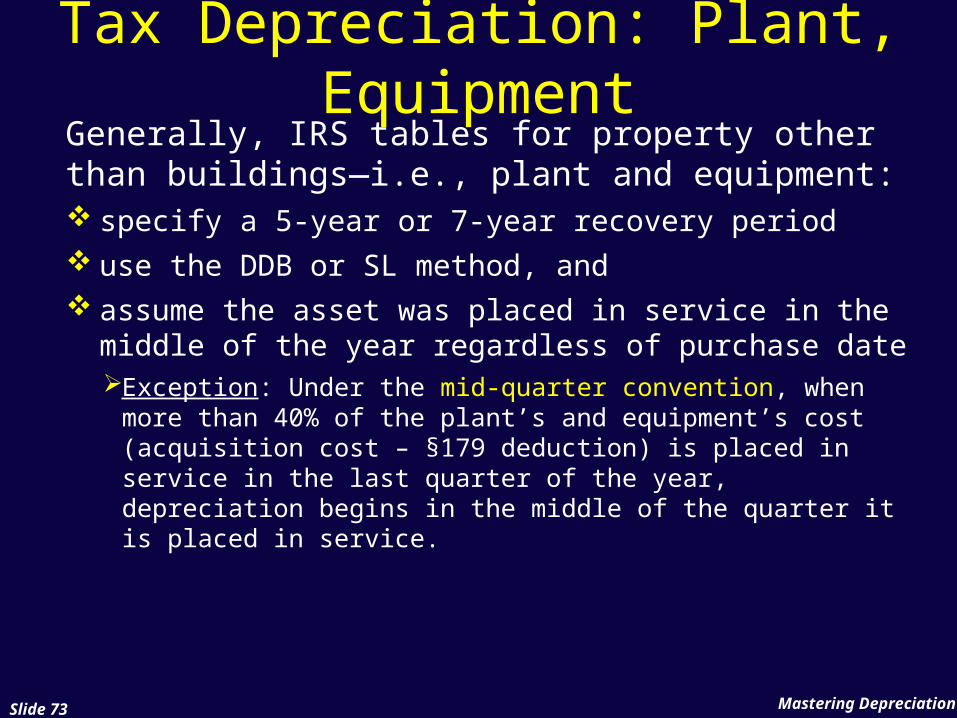
Tax Depreciation: Plant, Equipment
Generally, IRS tables for property other than buildings—i.e., plant and equipment: specify a 5-year or 7-year recovery period use the DDB or SL method, and assume the asset was placed in service in the
middle of the year regardless of purchase dateException: Under the mid-quarter convention, when
more than 40% of the plant’s and equipment’s cost (acquisition cost – §179 deduction) is placed in service in the last quarter of the year, depreciation begins in the middle of the quarter it is placed in service.
Mastering DepreciationSlide 74
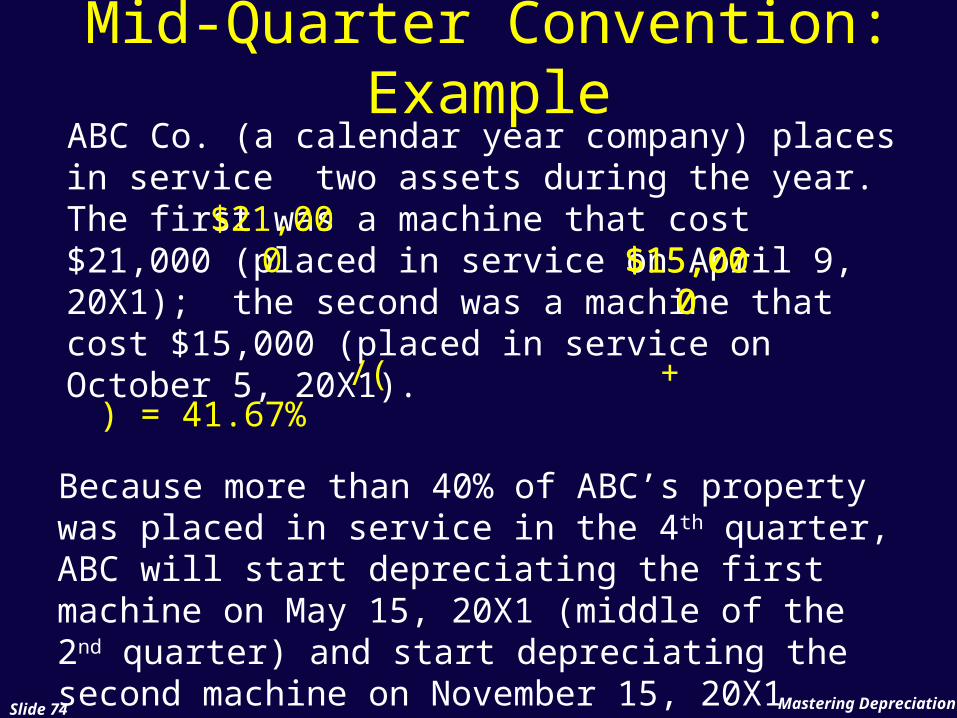
Mid-Quarter Convention: Example
ABC Co. (a calendar year company) places in service two assets during the year. The first was a machine that cost $21,000 (placed in service on April 9, 20X1); the second was a machine that cost $15,000 (placed in service on October 5, 20X1).
$15,000
$21,000 $15,00
0
/( + ) = 41.67%
Because more than 40% of ABC’s property was placed in service in the 4th quarter, ABC will start depreciating the first machine on May 15, 20X1 (middle of the 2nd quarter) and start depreciating the second machine on November 15, 20X1 (middle of the 4th quarter).
Mastering DepreciationSlide 75
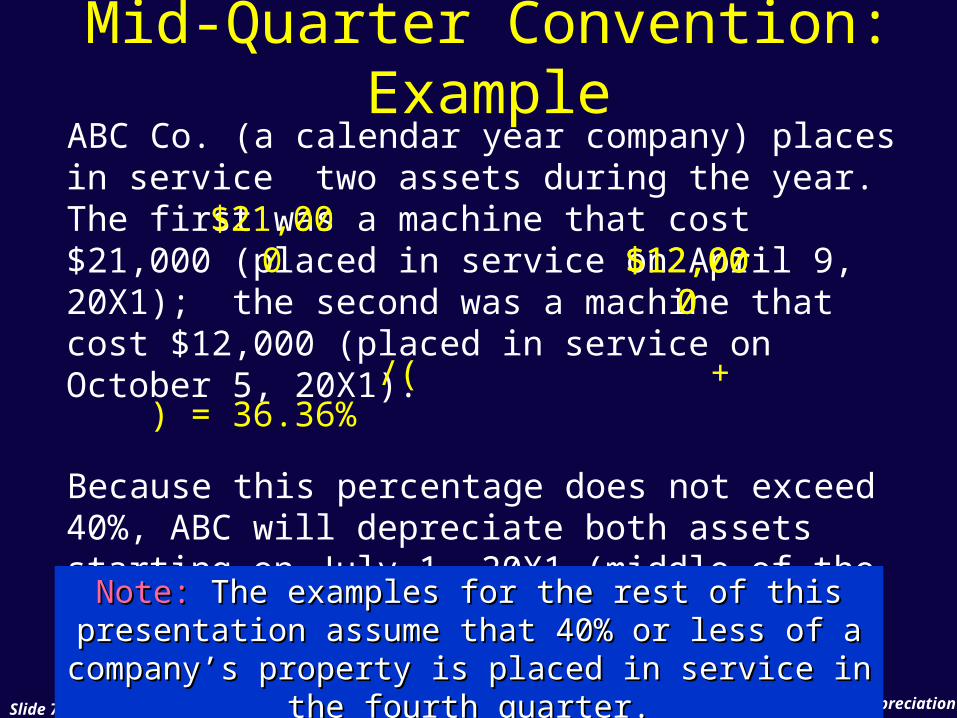
Mid-Quarter Convention: Example
ABC Co. (a calendar year company) places in service two assets during the year. The first was a machine that cost $21,000 (placed in service on April 9, 20X1); the second was a machine that cost $12,000 (placed in service on October 5, 20X1). /( + ) = 36.36%
Because this percentage does not exceed 40%, ABC will depreciate both assets starting on July 1, 20X1 (middle of the year).
$12,000
$21,000 $12,00
0
Note:Note: The examples for the rest of this The examples for the rest of this presentation assume that 40% or less of a presentation assume that 40% or less of a
company’s property is placed in service in the company’s property is placed in service in the fourth quarter.fourth quarter.
Mastering DepreciationSlide 76
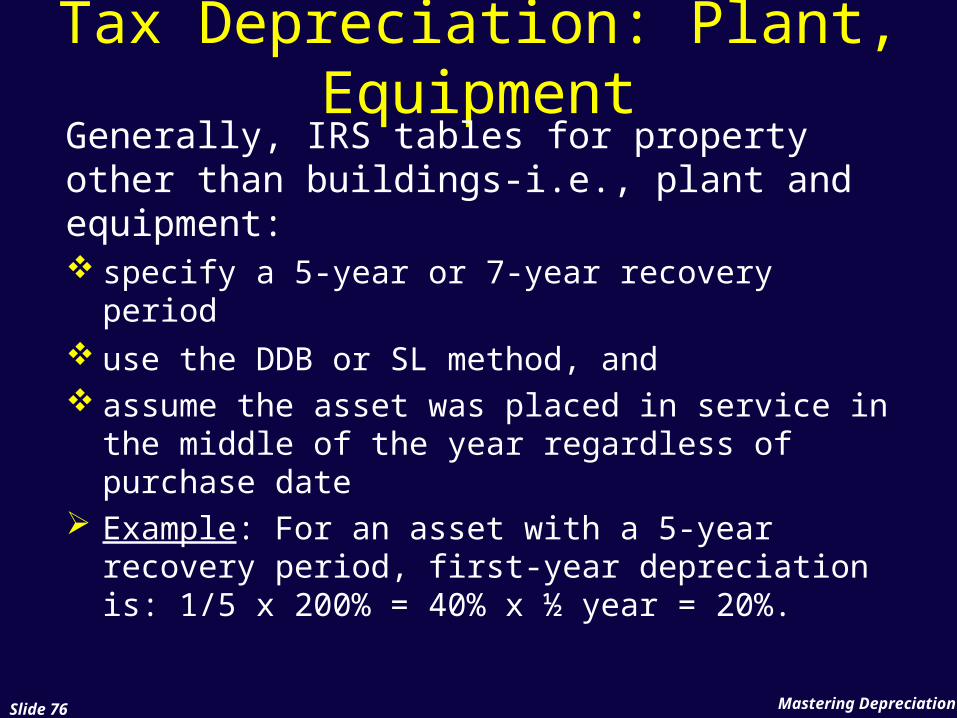
Tax Depreciation: Plant, Equipment
Generally, IRS tables for property other than buildings-i.e., plant and equipment: specify a 5-year or 7-year recovery period use the DDB or SL method, and assume the asset was placed in service in
the middle of the year regardless of purchase date
Example: For an asset with a 5-year recovery period, first-year depreciation is: 1/5 x 200% = 40% x ½ year = 20%.
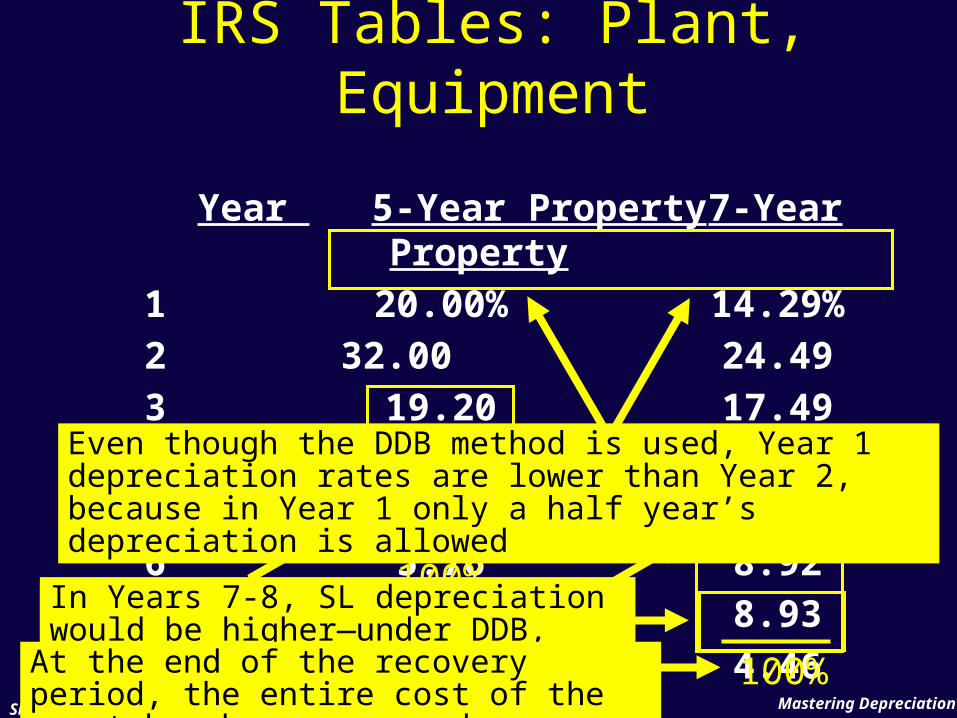
Year 5-Year Property 7-Year Property1 20.00% 14.29%2 32.00 24.493 19.20 17.494 11.52 12.495 11.52 8.936 5.76 8.927 8.938 4.46
Note that in the final year, a half year’s depreciation expense is allowed.
Mastering DepreciationSlide 77
100%
100%
IRS Tables: Plant, Equipment
Even though the DDB method is used, Year 1 depreciation rates are lower than Year 2, because in Year 1 only a half year’s depreciation is allowed
In Years 7-8, SL depreciation would be higher—under DDB, these years simply use up the remaining depreciationAt the end of the recovery period, the entire
cost of the asset has been expensed
Mastering DepreciationSlide 78
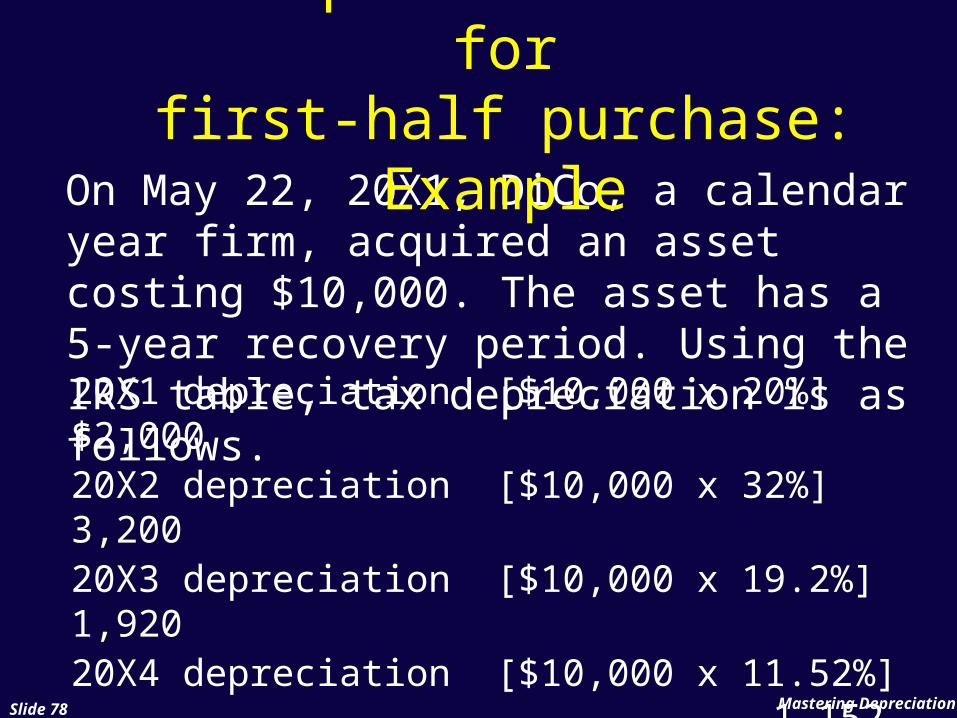
20X1 depreciation [$10,000 x 20%] $2,00020X2 depreciation [$10,000 x 32%] 3,20020X3 depreciation [$10,000 x 19.2%] 1,92020X4 depreciation [$10,000 x 11.52%] 1,15220X5 depreciation [$10,000 x 11.52%] 1,15220X6 depreciation [$10,000 x 5.76%] 576
On May 22, 20X1, DiCo, a calendar year firm, acquired an asset costing $10,000. The asset has a 5-year recovery period. Using the IRS table, tax depreciation is as follows.
Tax Depreciation Tables forfirst-half purchase: Example
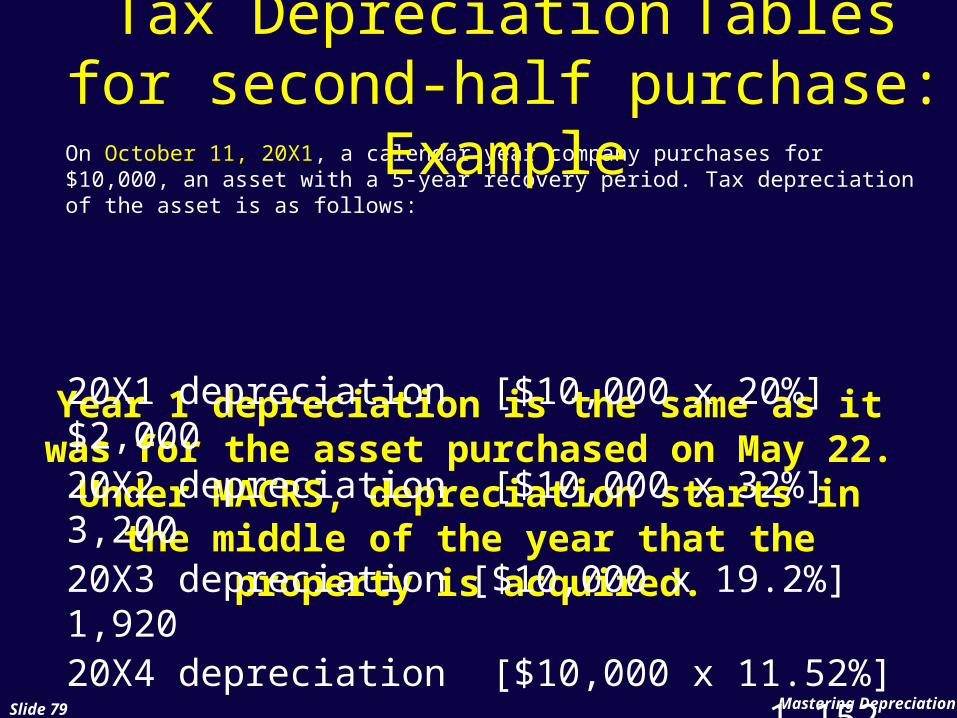
Year 1 depreciation is the same as it was for the asset purchased on May 22. Under MACRS, depreciation starts in the middle of the year that the property is
acquired.
Mastering DepreciationSlide 79
On October 11, 20X1, a calendar year company purchases for $10,000, an asset with a 5-year recovery period. Tax depreciation of the asset is as follows:
20X1 depreciation [$10,000 x 20%] $2,00020X2 depreciation [$10,000 x 32%] 3,20020X3 depreciation [$10,000 x 19.2%] 1,92020X4 depreciation [$10,000 x 11.52%] 1,15220X5 depreciation [$10,000 x 11.52%] 1,15220X6 depreciation [$10,000 x 5.76%] 576
Tax Depreciation Tables for second-half purchase:
Example
Mastering DepreciationSlide 80
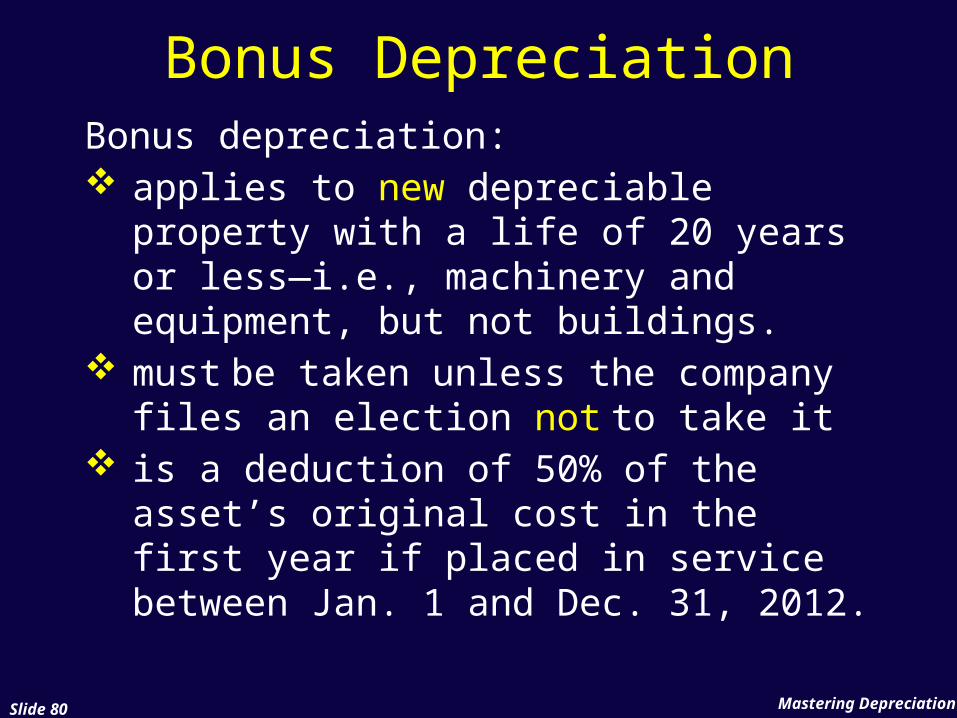
Bonus depreciation: applies to new depreciable property
with a life of 20 years or less—i.e., machinery and equipment, but not buildings.
must be taken unless the company files an election not to take it
is a deduction of 50% of the asset’s original cost in the first year if placed in service between Jan. 1 and Dec. 31, 2012.
Bonus Depreciation
Mastering DepreciationSlide 81
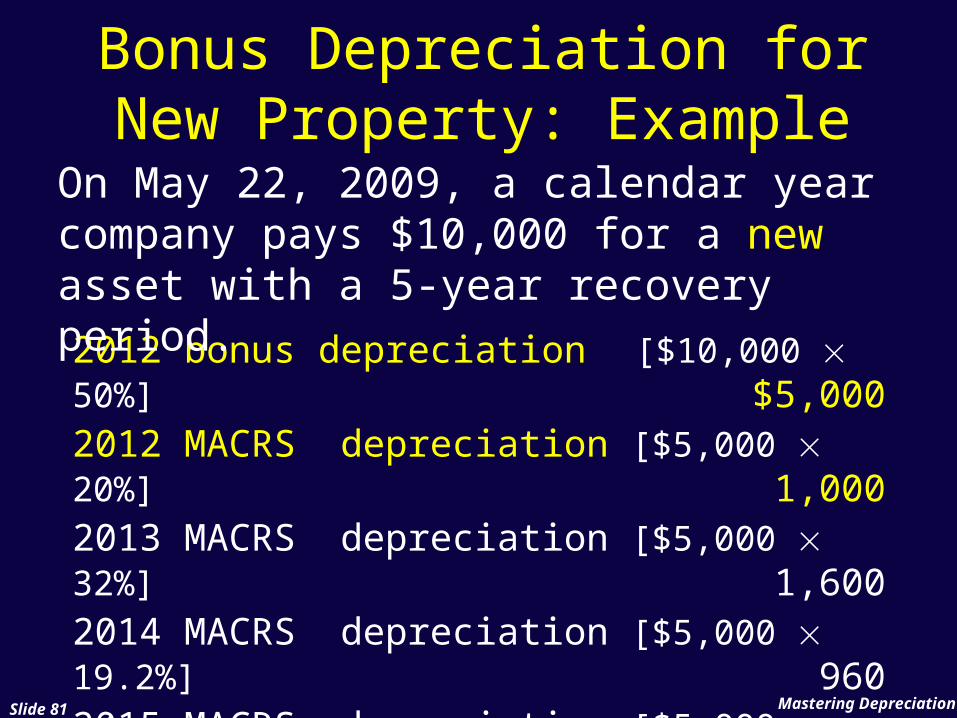
2012 bonus depreciation [$10,000 50%]$5,0002012 MACRS depreciation [$5,000 20%] 1,0002013 MACRS depreciation [$5,000 32%] 1,6002014 MACRS depreciation [$5,000 19.2%] 9602015 MACRS depreciation [$5,000 11.52%] 5762016 MACRS depreciation [$5,000 11.52%] 5762017 MACRS depreciation [$5,000 5.76%] 288
On May 22, 2009, a calendar year company pays $10,000 for a new asset with a 5-year recovery period.
Bonus Depreciation for New Property: Example
Mastering DepreciationSlide 82
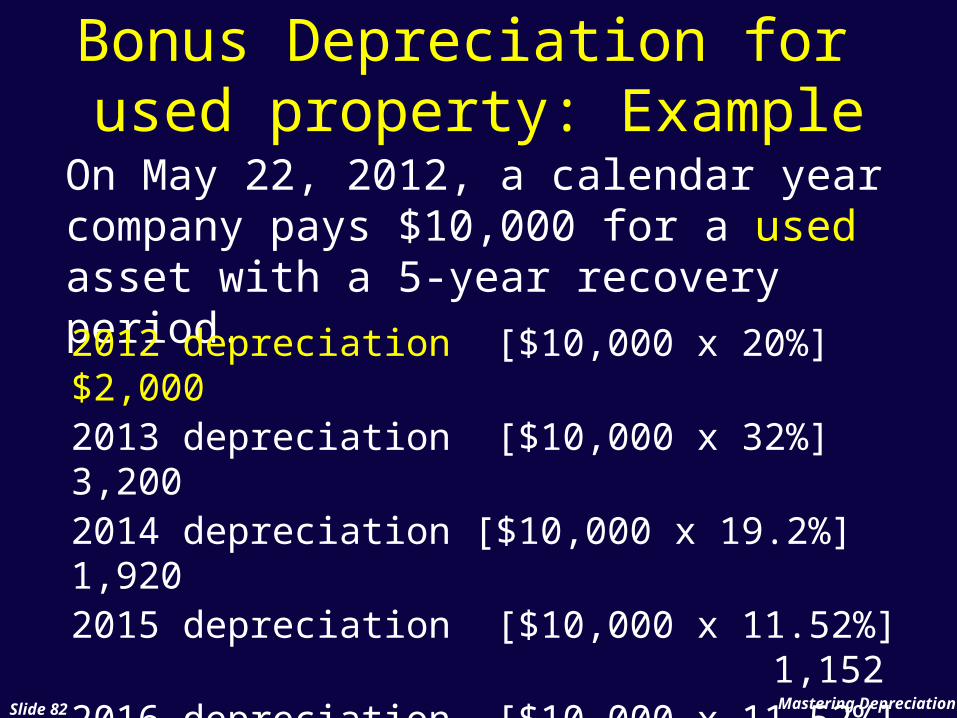
On May 22, 2012, a calendar year company pays $10,000 for a used asset with a 5-year recovery period.
2012 depreciation [$10,000 x 20%] $2,0002013 depreciation [$10,000 x 32%] 3,2002014 depreciation [$10,000 x 19.2%] 1,9202015 depreciation [$10,000 x 11.52%] 1,1522016 depreciation [$10,000 x 11.52%] 1,1522017 depreciation [$10,000 x 5.76%] 576
Bonus Depreciation for used property: Example
Mastering DepreciationSlide 83
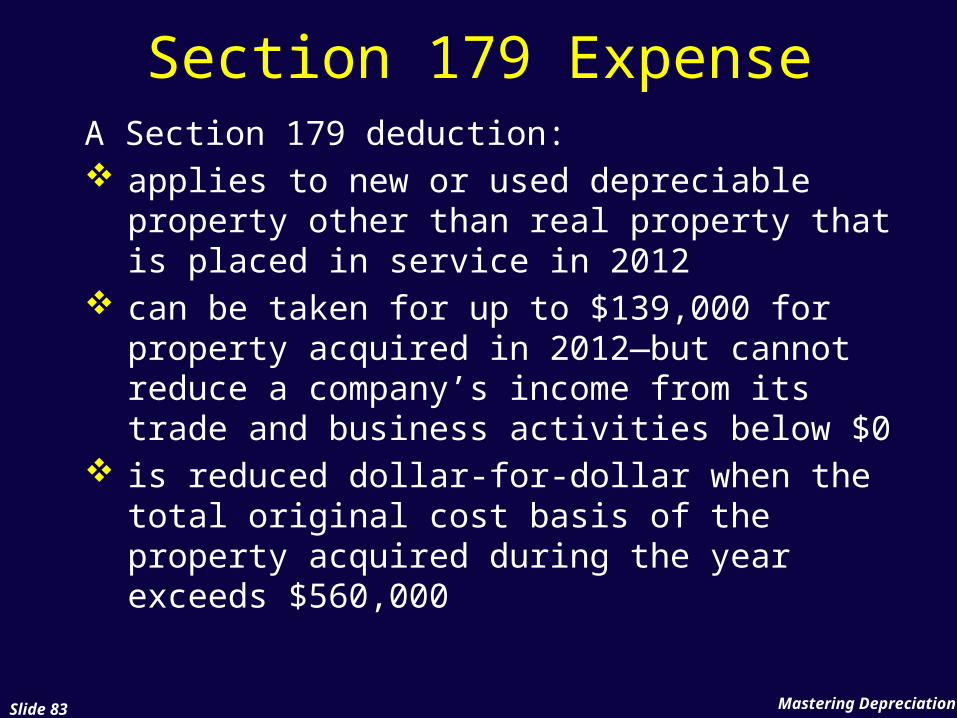
A Section 179 deduction: applies to new or used depreciable
property other than real property that is placed in service in 2012
can be taken for up to $139,000 for property acquired in 2012—but cannot reduce a company’s income from its trade and business activities below $0
is reduced dollar-for-dollar when the total original cost basis of the property acquired during the year exceeds $560,000
Section 179 Expense
Mastering DepreciationSlide 84
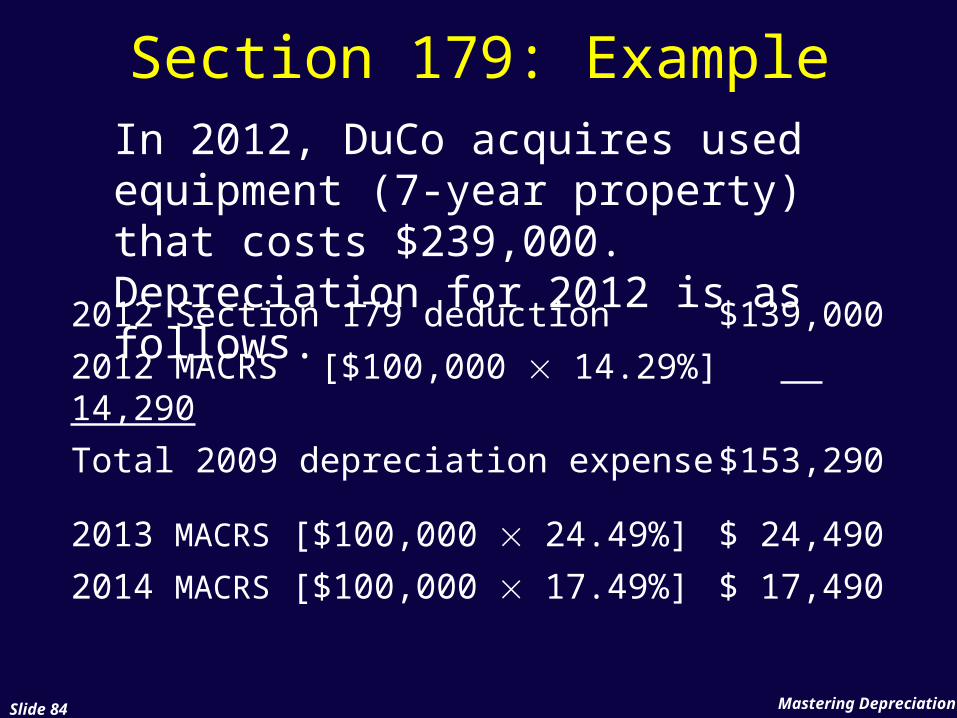
In 2012, DuCo acquires used equipment (7-year property) that costs $239,000. Depreciation for 2012 is as follows.2012 Section 179 deduction $139,000
2012 MACRS [$100,000 14.29%] 14,290
Total 2009 depreciation expense $153,290
2013 MACRS [$100,000 24.49%] $ 24,490
2014 MACRS [$100,000 17.49%] $ 17,490
Section 179: Example
Mastering DepreciationSlide 85
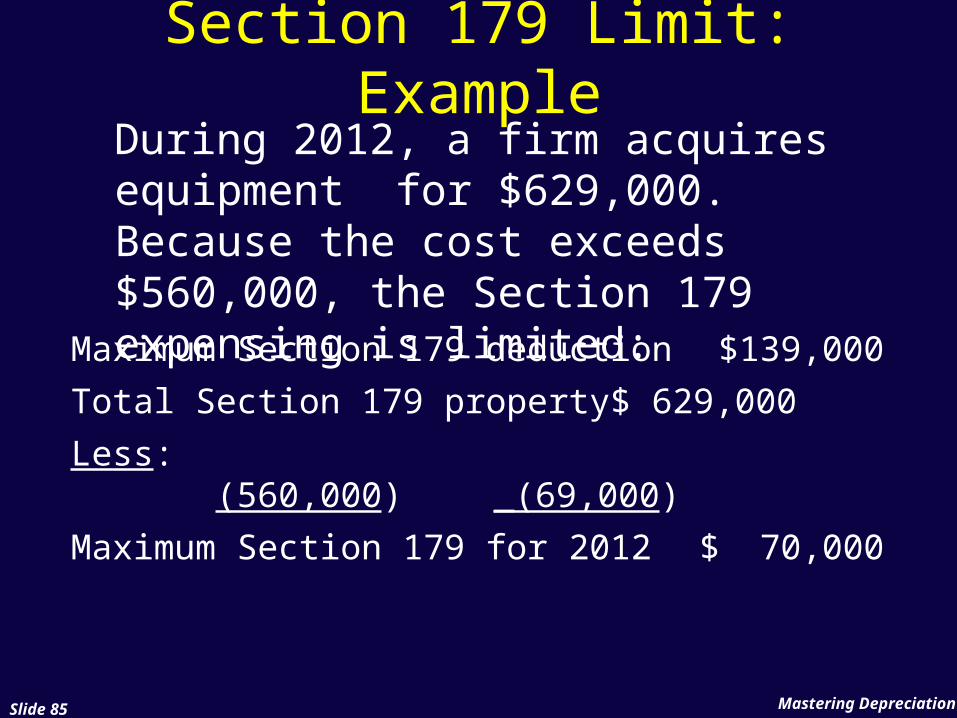
During 2012, a firm acquires equipment for $629,000. Because the cost exceeds $560,000, the Section 179 expensing is limited:
Maximum Section 179 deduction $139,000
Total Section 179 property $ 629,000
Less: (560,000) _(69,000)
Maximum Section 179 for 2012 $ 70,000
Section 179 Limit: Example
Mastering DepreciationSlide 86
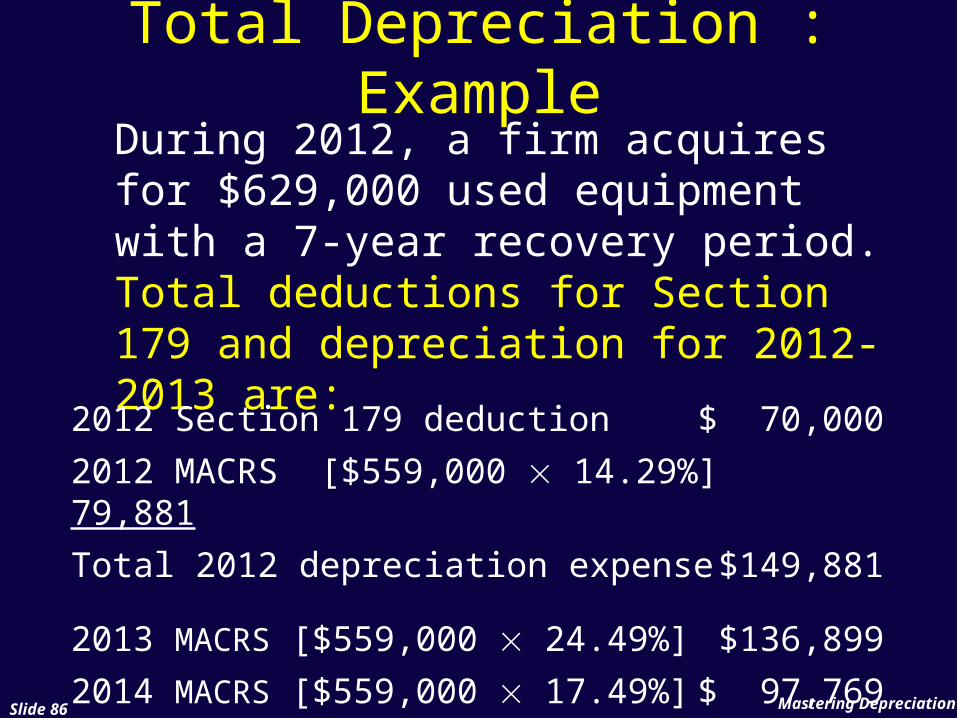
During 2012, a firm acquires for $629,000 used equipment with a 7-year recovery period. Total deductions for Section 179 and depreciation for 2012-2013 are:
Total Depreciation : Example
2012 Section 179 deduction $ 70,000
2012 MACRS [$559,000 14.29%] 79,881
Total 2012 depreciation expense $149,881
2013 MACRS [$559,000 24.49%] $136,899
2014 MACRS [$559,000 17.49%] $ 97,769
Mastering DepreciationSlide 87
Tax Depreciation of Vehicles
The IRC imposes limits on depreciation for certain vehicles. Passenger autos (most vehicles weighing 6,000 lbs or less) have annual limits. Heavy SUVs, pickups, and vans (generally, 6,000-14,000 lbs). Section 179 is limited to $25,000—but there are no limits on depreciation.
Mastering DepreciationSlide 88
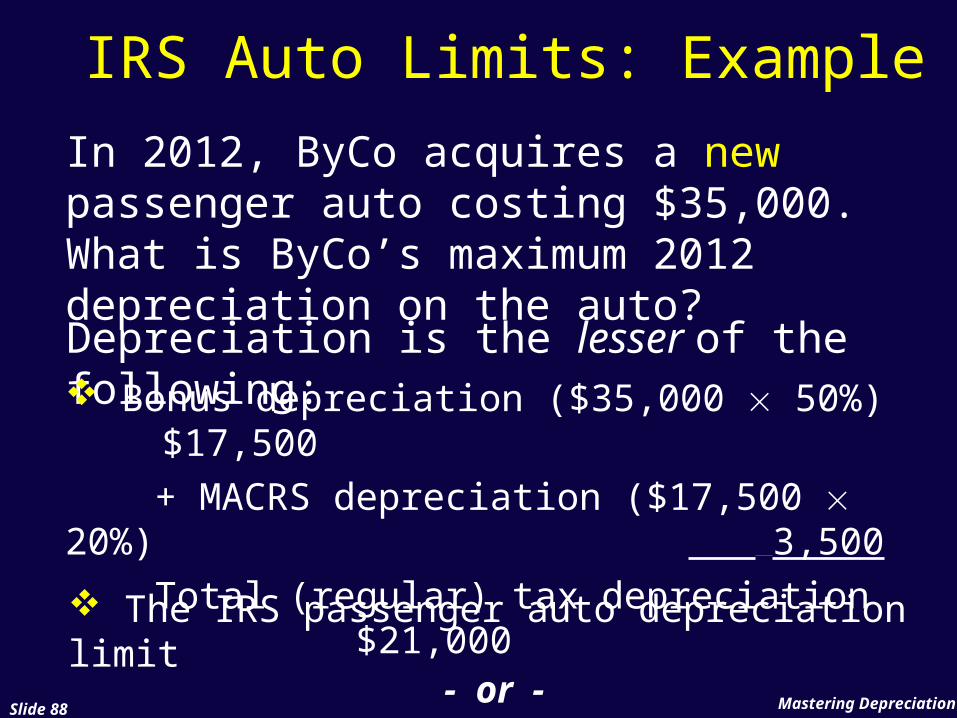
In 2012, ByCo acquires a new passenger auto costing $35,000. What is ByCo’s maximum 2012 depreciation on the auto?
IRS Auto Limits: Example
Depreciation is the lesser of the following: Bonus depreciation ($35,000 50%) $17,500
+ MACRS depreciation ($17,500 20%) 3,500
Total (regular) tax depreciation $21,000- or -
The IRS passenger auto depreciation limit
Mastering DepreciationSlide 89
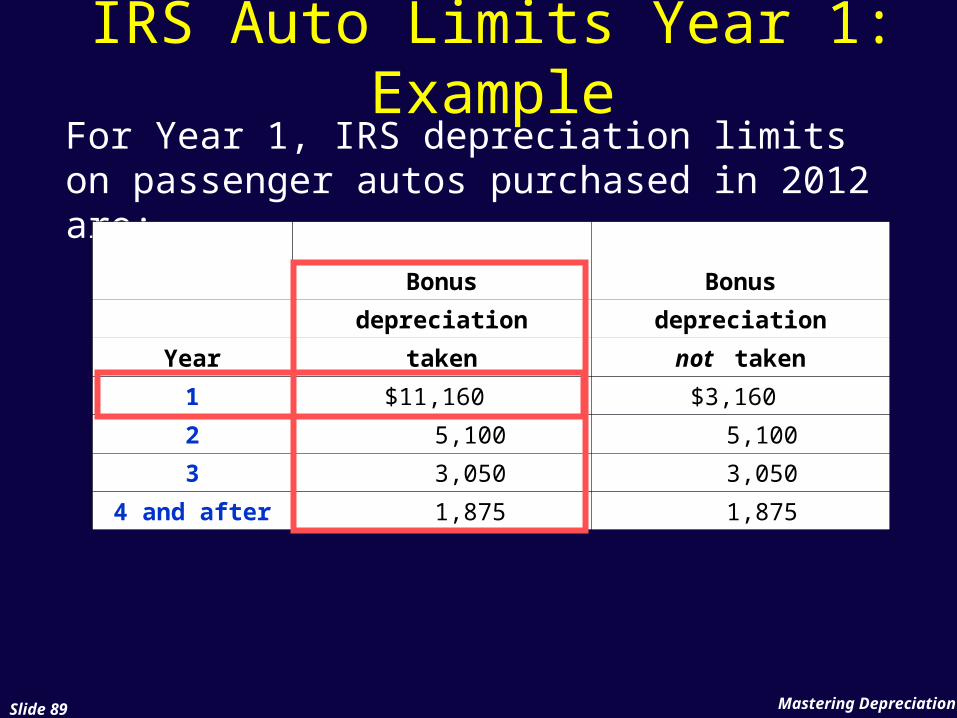
IRS Auto Limits Year 1: Example
For Year 1, IRS depreciation limits on passenger autos purchased in 2012 are:
Bonus Bonus
depreciation depreciation
Year taken not taken
1 $11,160 $3,160
2 5,100 5,100
3 3,050 3,050
4 and after 1,875 1,875
Mastering DepreciationSlide 90
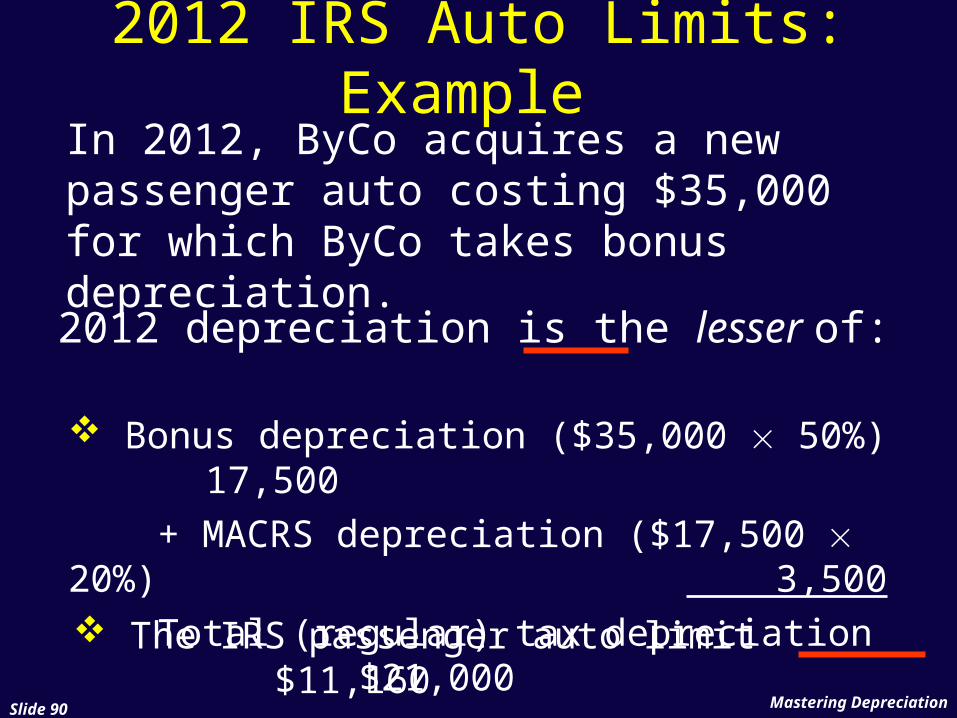
In 2012, ByCo acquires a new passenger auto costing $35,000 for which ByCo takes bonus depreciation.
2012 IRS Auto Limits: Example
The IRS passenger auto limit $11,160
Bonus depreciation ($35,000 50%) 17,500
+ MACRS depreciation ($17,500 20%) 3,500
Total (regular) tax depreciation $21,000- or -
2012 depreciation is the lesser of:
Mastering DepreciationSlide 91
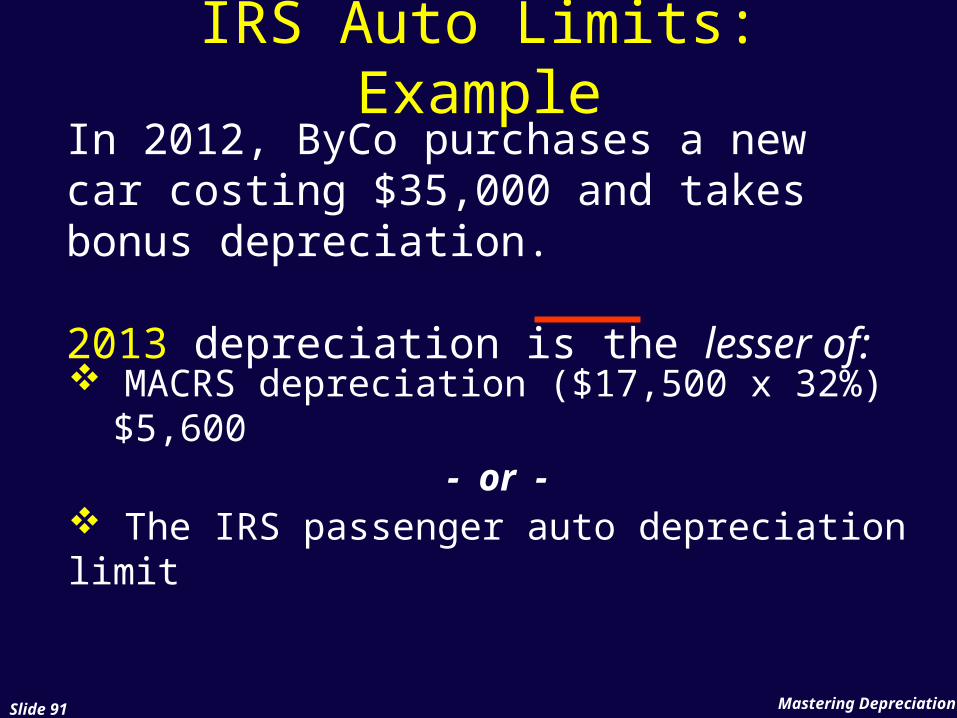
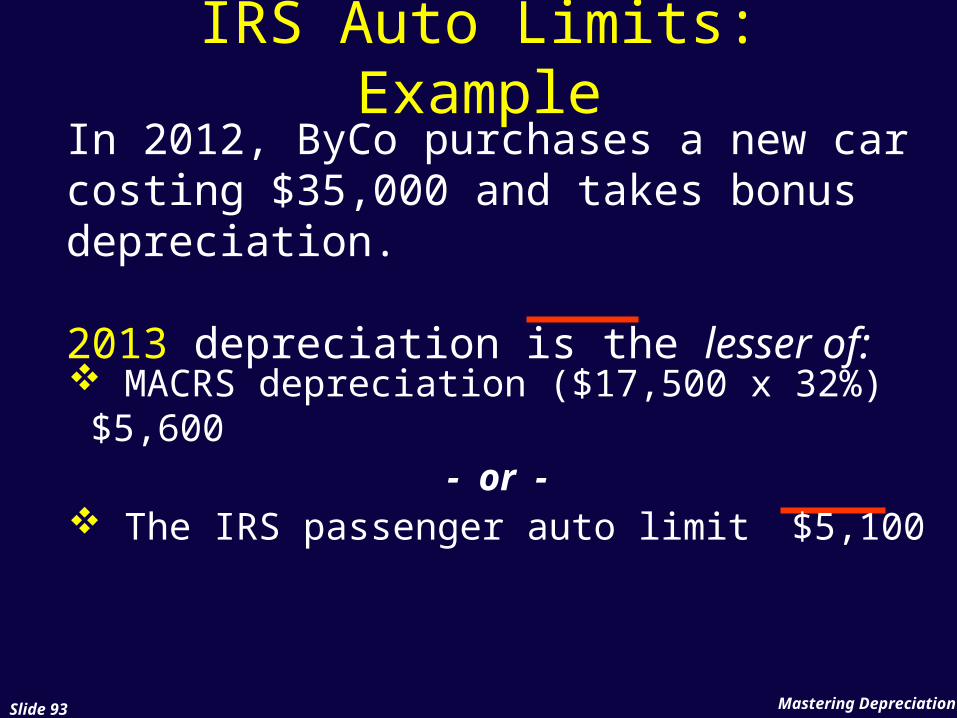
MACRS depreciation ($17,500 x 32%) $5,600- or -
The IRS passenger auto depreciation limit
IRS Auto Limits: ExampleIn 2012, ByCo purchases a new car costing $35,000 and takes bonus depreciation.
2013 depreciation is the lesser of:
Mastering DepreciationSlide 92
IRS Auto Limits Year 2: Example
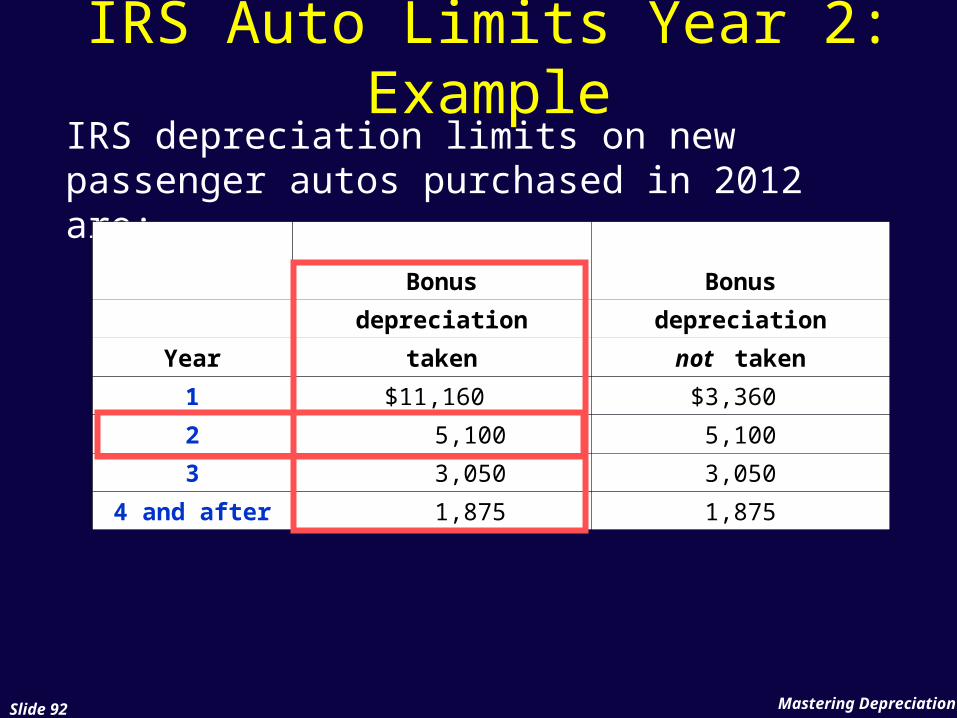
IRS depreciation limits on new passenger autos purchased in 2012 are:
Bonus Bonus
depreciation depreciation
Year taken not taken
1 $11,160 $3,360
2 5,100 5,100
3 3,050 3,050
4 and after 1,875 1,875
Mastering DepreciationSlide 93
In 2012, ByCo purchases a new car costing $35,000 and takes bonus depreciation. 2013 depreciation is the lesser of:
IRS Auto Limits: Example
MACRS depreciation ($17,500 x 32%) $5,600- or -
The IRS passenger auto limit $5,100
Mastering DepreciationSlide 94
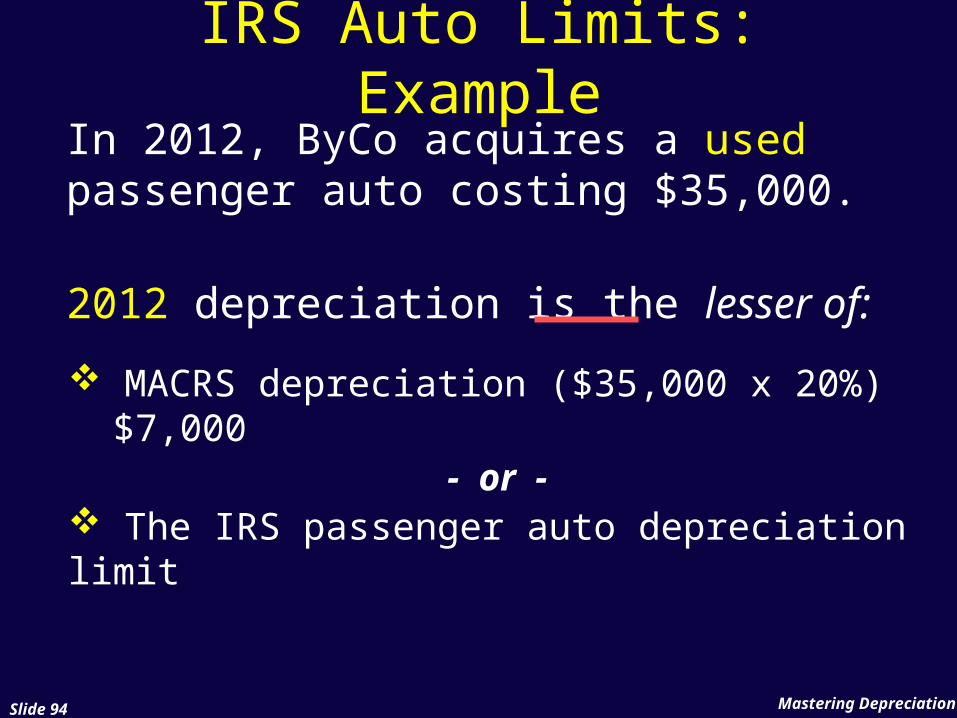
IRS Auto Limits: Example
MACRS depreciation ($35,000 x 20%) $7,000- or -
The IRS passenger auto depreciation limit
2012 depreciation is the lesser of:
In 2012, ByCo acquires a used passenger auto costing $35,000.
Mastering DepreciationSlide 95
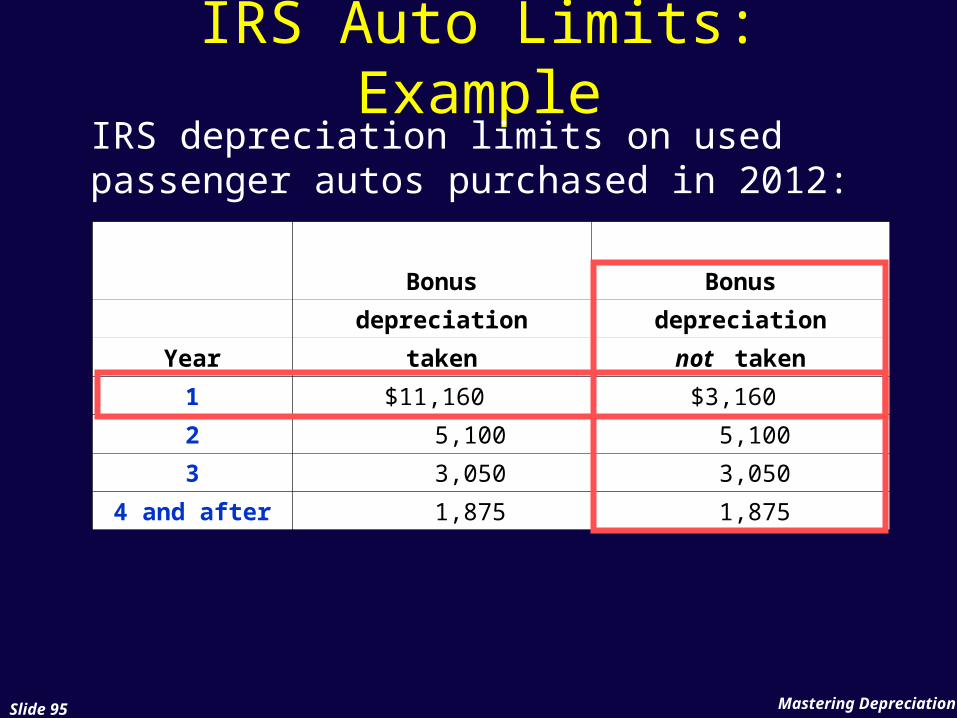
IRS Auto Limits: ExampleIRS depreciation limits on used passenger autos purchased in 2012:
Bonus Bonus
depreciation depreciation
Year taken not taken
1 $11,160 $3,160
2 5,100 5,100
3 3,050 3,050
4 and after 1,875 1,875
Mastering DepreciationSlide 96
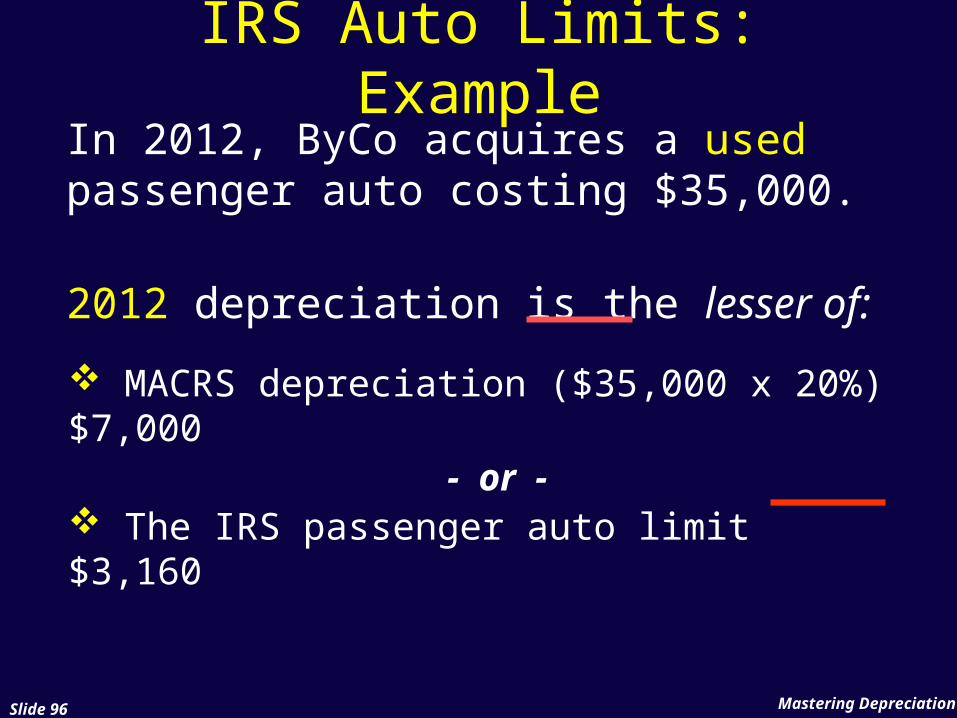
IRS Auto Limits: Example
MACRS depreciation ($35,000 x 20%) $7,000- or -
The IRS passenger auto limit $3,160
2012 depreciation is the lesser of:
In 2012, ByCo acquires a used passenger auto costing $35,000.
Mastering DepreciationSlide 97
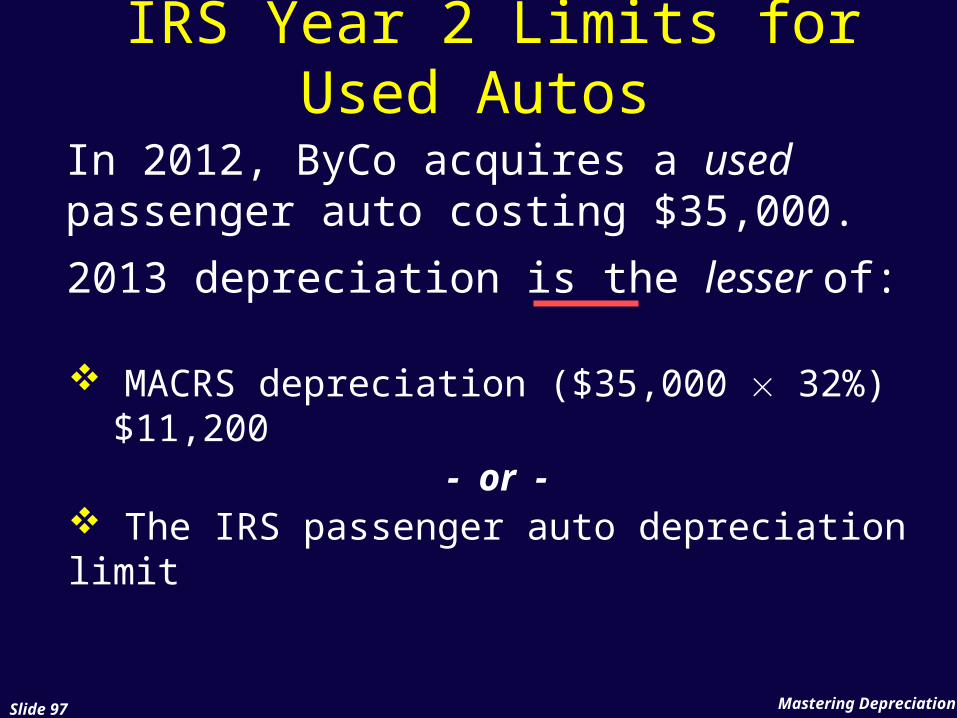
IRS Year 2 Limits for Used Autos
MACRS depreciation ($35,000 32%) $11,200
- or - The IRS passenger auto depreciation limit
2013 depreciation is the lesser of:
In 2012, ByCo acquires a used passenger auto costing $35,000.

Mastering DepreciationSlide 98
IRS Auto Limits: ExampleIRS depreciation limits on used passenger autos purchased in 2012:
Bonus Bonus
depreciation depreciation
Year taken not taken
1 $11,160 $3,160
2 5,100 5,100
3 3,050 3,050
4 and after 1,885 1,875
Mastering DepreciationSlide 99
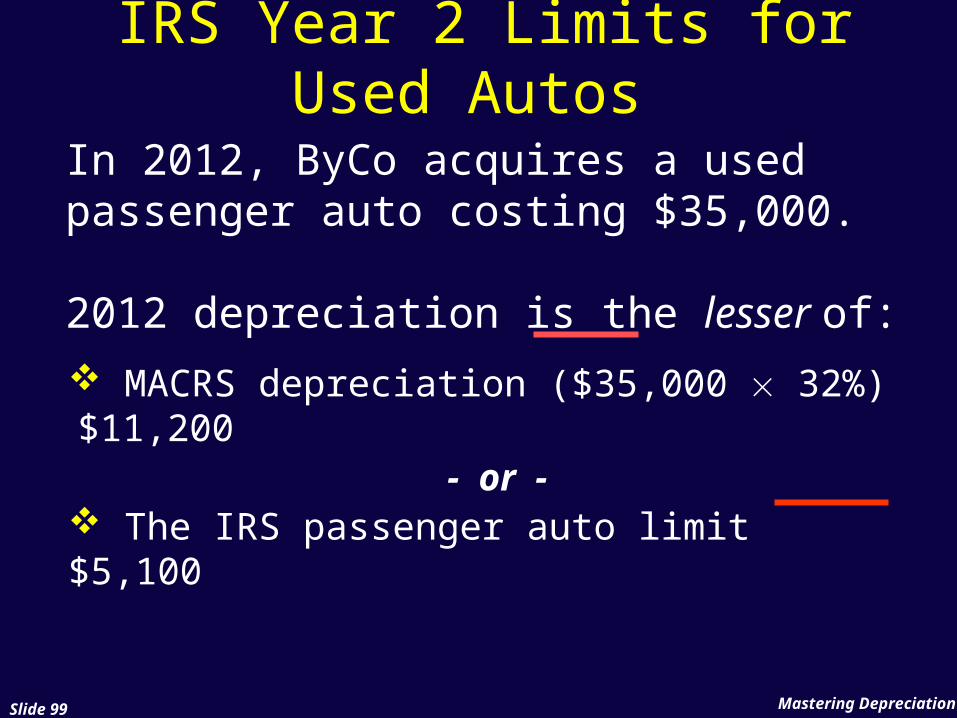
MACRS depreciation ($35,000 32%) $11,200- or -
The IRS passenger auto limit $5,100
In 2012, ByCo acquires a used passenger auto costing $35,000.
2012 depreciation is the lesser of:
IRS Year 2 Limits for Used Autos
Mastering DepreciationSlide 100
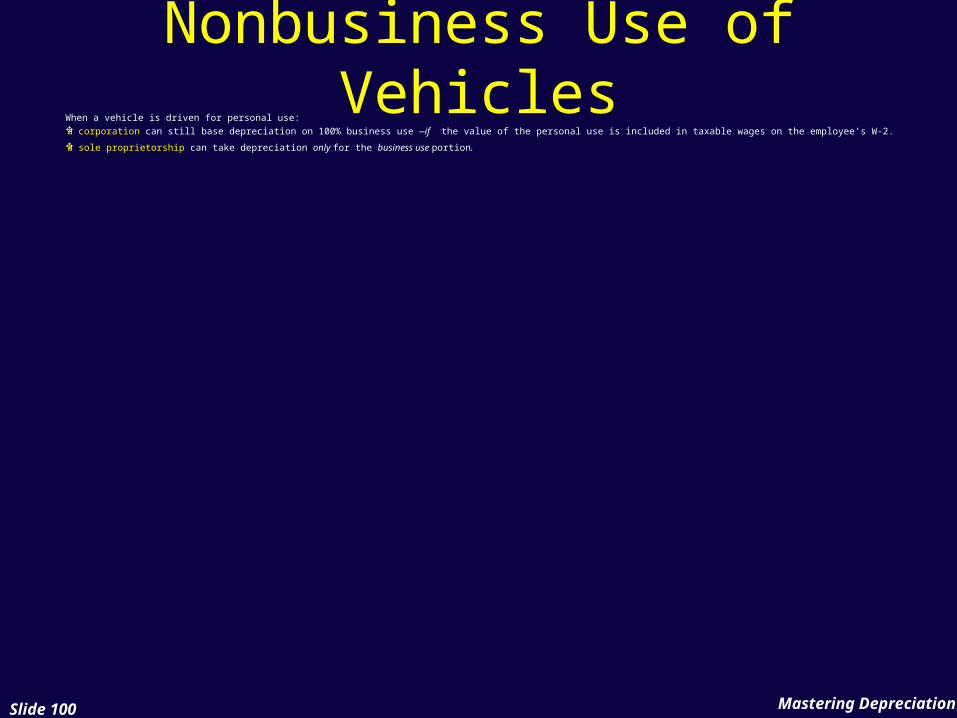
Nonbusiness Use of Vehicles
When a vehicle is driven for personal use:a corporation can still base depreciation on 100% business use —if the value of the personal use is included in taxable wages on the employee’s W-2.
a sole proprietorship can take depreciation only for the business use portion.
Mastering DepreciationSlide 101
In 2012, a corporate car is driven 80% for business and 20% for personal use.
The corporation can take 100% of the available depreciation on the car—if
the value of the 20% personal use is included in taxable wages on the employee’s W-2.
Nonbusiness Use: Example
Mastering DepreciationSlide 102
In 2012, a sole proprietor drives her car 80% for business and 20% personal use.
If the owner uses the car 80% for business, only 80% depreciation can be taken.
If the sole proprietor’s employee drives the owner’s car 80% for business and 20% for personal use, the owner has two options:
1.take 80% depreciation on the car, or
2.take 100% depreciation and include the value of the 20% personal use in wages on the employee’s W-2.
Nonbusiness Use: Example