Embed Size (px)
Citation preview

School Of Architecture, Building & Design
Foundation In Natural & Built Environment
Assignment Title : Financial Ratio Analysis
Group Members :
NAME STUDENT ID
SEET TIONG HONG 0320438
WONG DEVIN 0319814
BRYAN TEH QING DA 0318590
Basic Accounting [ACC30205 / FNBE0145]
Lecturer : Chang Jau Ho
Submission Date : 4th June 2015
Background History Of MASTEEL Malaysia Steel Works (KL) Berhad was founded in 1971 at Petaling Jaya, Selangor as a steel manufacturer producing commercial grade mild steel round bars and steel billets at their rolling mill. To further improve their competitiveness, they had upgraded their mill to become a entirely continuous mill with the addition of a new reheating furnace which was able to utilise one ton of steel billets. Besides, the company had further increased the mill capacity to 450,000 metric tonne every year. Due to ever rising demand of their customers, they installed a thermal quenching line that could produce grade 500 deformed bars. Notably, the mill obtained the ISO 9002 certification recognizing the company commitment and dedication to quality management system.
A new milestone in the history of Malaysia Steel Works (KL) Berhad was realised when their meltshop in Bukit Raja entered into commercial production in 1998. Their Danieli supplied billet production plant became one of the most advanced meltshop in the region as the electric arc furnace was featured with several advanced components such as ultrahigh power transformers (UHP), eccentric bottom tapping configuration (EBT) and fully automated furnace process control and alloy additive plant. In order to increase the output and quality of their products such as steel bars and steel billets, the company added a refining ladle furnace. As the company is growing stronger with strong balance sheet, they plan to go even further to increase their capacity of the meltshop to 700,000 metric tonne of billets per year by installing a multistand large curvature continuous casting machine which could cast highgrade billets up to 160mm x 160mm by end of 2014.
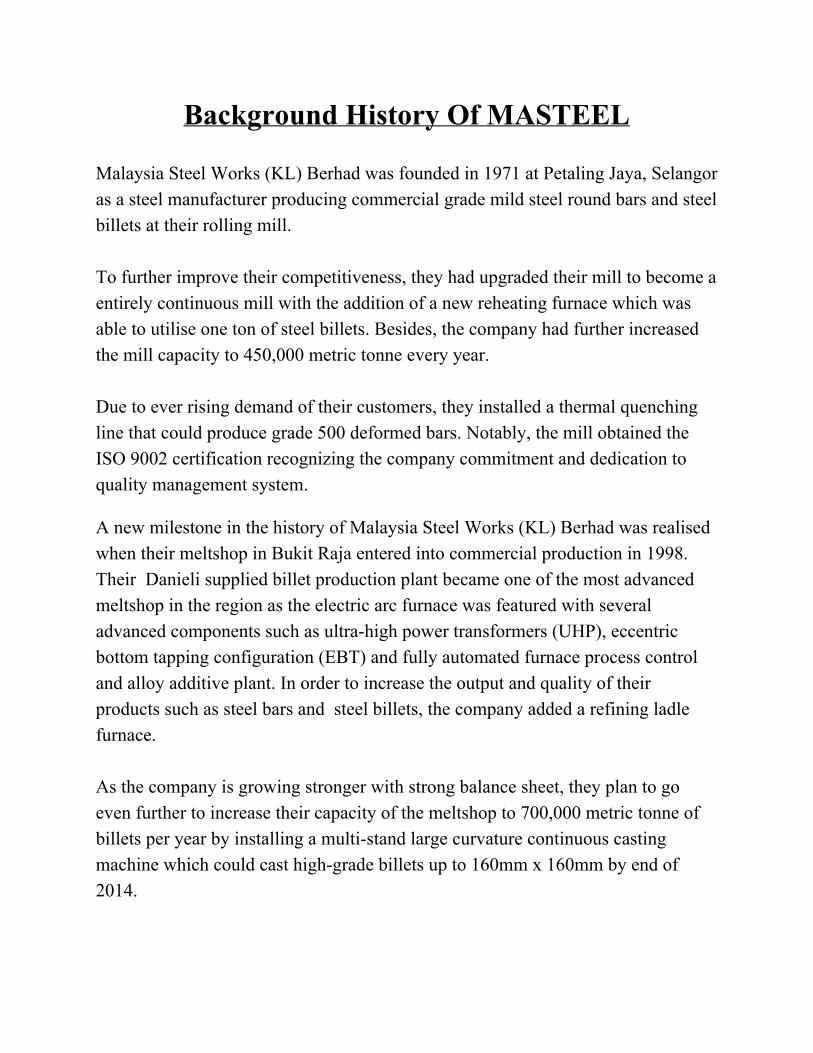
Furthermore, the domestic steel usage is going to increase due to several key projects under Malaysia’s Economic Transformation Programme such as Sungai BulohKajang MRT and Klang Valley LRT extension. This would boost the company’s revenue of 2015. The company is one of the premier steel manufacturer in Malaysia thanks to their high consistency of the quality products produced by the meltshop.
Steel Billets Rolling Steel Mill
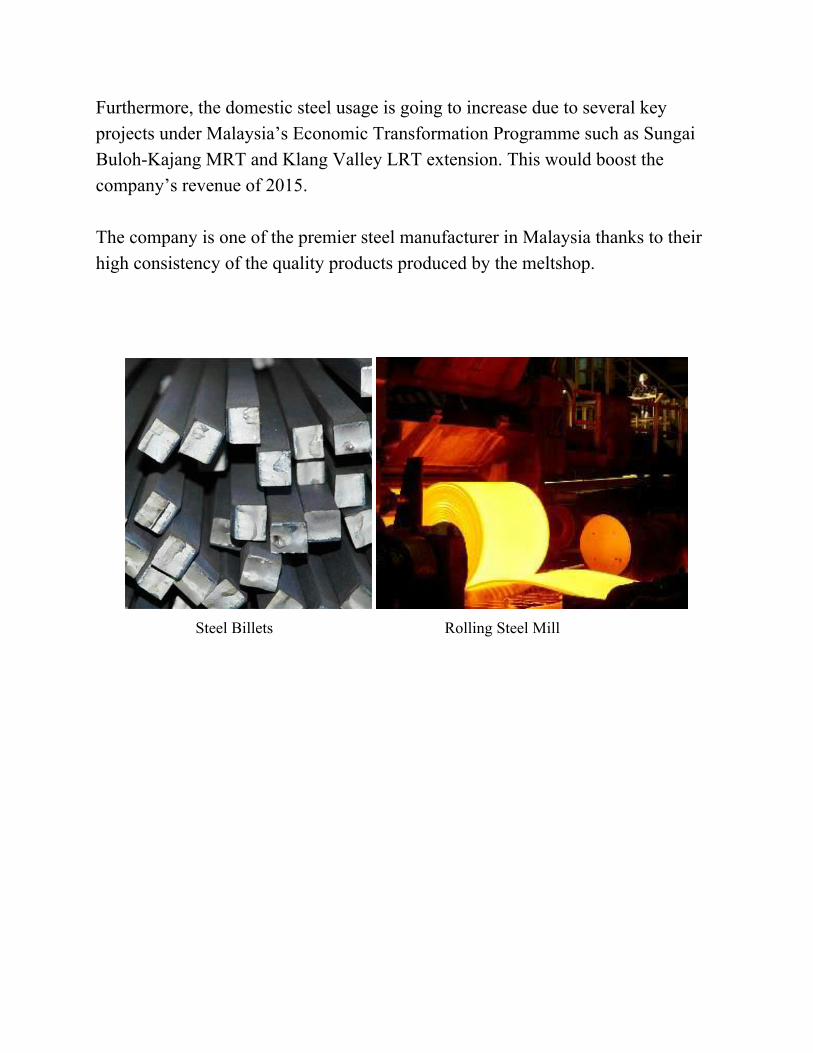
Financial Ration Of MASTEEL
Return Of Equity (ROE) eturn of Equity 00% R = ( Net Prof it
Average Owners Equity) × 1
ROE for 2013 = 00% ( 27,014,000540,501,500) × 1
= 5%
ROE for 2012 = 00% ( 24,346,000540,501,500) × 1
= 4.5% Over the period of year 2012 and 2013, the ROE of the business has increased from 4.5% to 5% . The owner is getting more return from his capital.
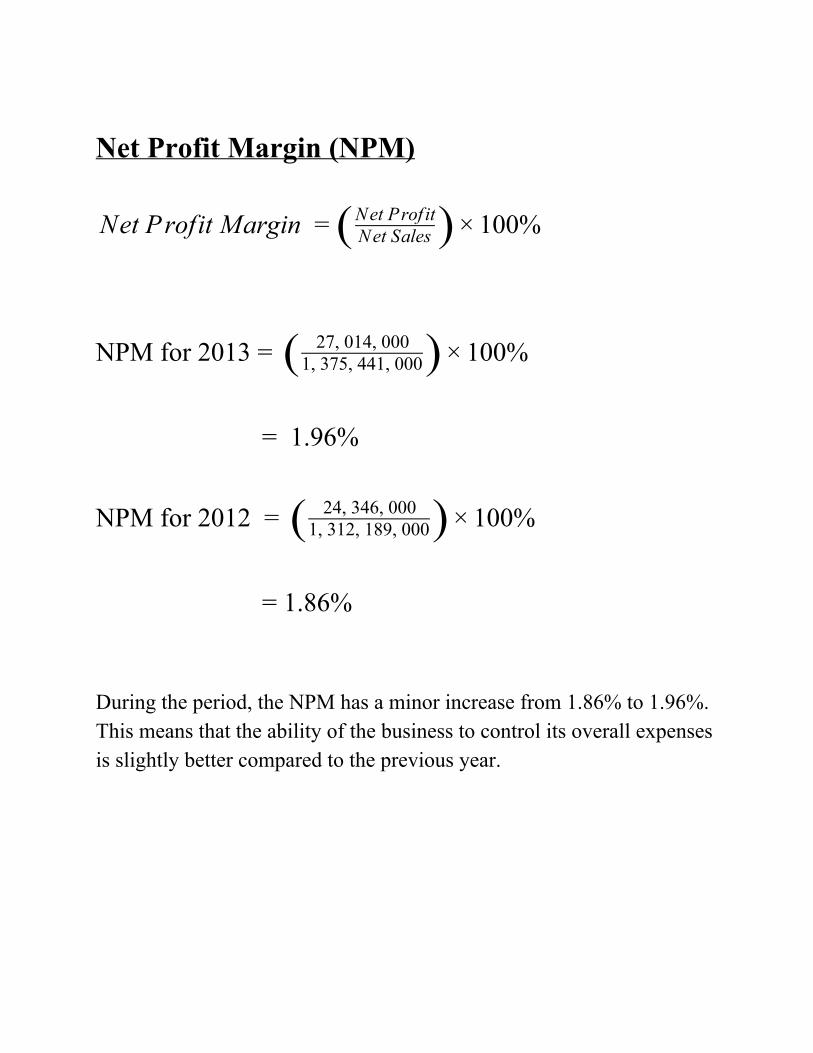
Net Profit Margin (NPM)
et Profit Margin 00% N = ( Net SalesNet Prof it) × 1
NPM for 2013 = 00% ( 27, 014, 0001, 375, 441, 000) × 1
= 1.96%
NPM for 2012 = 00% ( 24, 346, 0001, 312, 189, 000) × 1
= 1.86% During the period, the NPM has a minor increase from 1.86% to 1.96%. This means that the ability of the business to control its overall expenses is slightly better compared to the previous year.
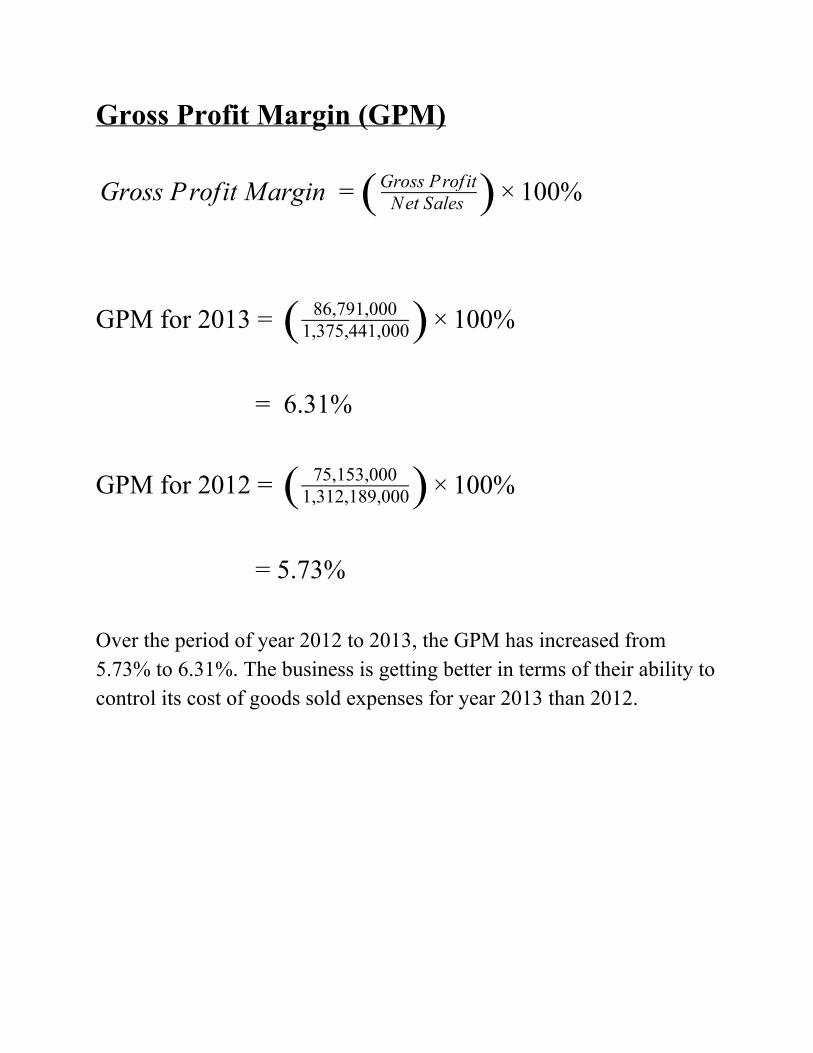
Gross Profit Margin (GPM)
ross Profit Margin 00% G = ( Net SalesGross Prof it) × 1
GPM for 2013 = 00% ( 86,791,0001,375,441,000) × 1
= 6.31%
GPM for 2012 = 00% ( 75,153,0001,312,189,000) × 1
= 5.73% Over the period of year 2012 to 2013, the GPM has increased from 5.73% to 6.31%. The business is getting better in terms of their ability to control its cost of goods sold expenses for year 2013 than 2012.
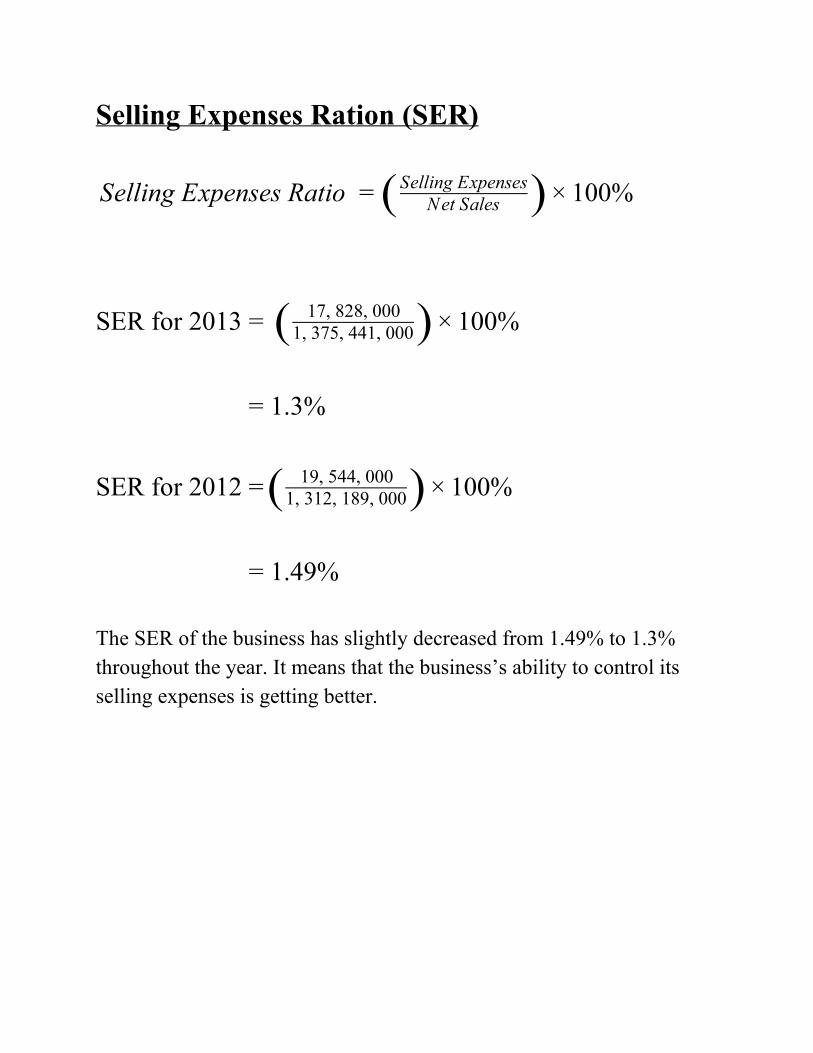
Selling Expenses Ration (SER)
elling Expenses Ratio 00% S = ( Net SalesSelling Expenses) × 1
SER for 2013 = 00% ( 17, 828, 0001, 375, 441, 000) × 1
= 1.3%
SER for 2012 = 00% ( 19, 544, 0001, 312, 189, 000) × 1
= 1.49% The SER of the business has slightly decreased from 1.49% to 1.3% throughout the year. It means that the business’s ability to control its selling expenses is getting better.
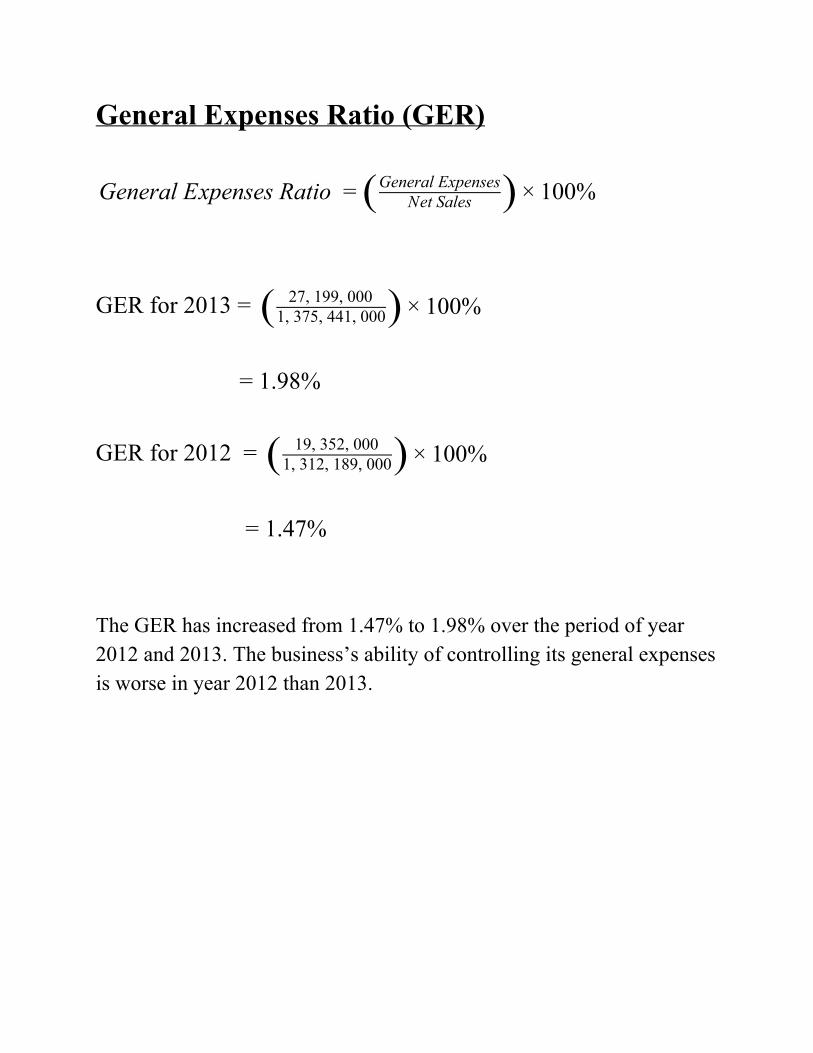
General Expenses Ratio (GER)
eneral Expenses Ratio 00% G = ( Net SalesGeneral Expenses) × 1
GER for 2013 = 00% ( 27, 199, 000
1, 375, 441, 000) × 1
= 1.98% GER for 2012 = 00% ( 19, 352, 000
1, 312, 189, 000) × 1
= 1.47% The GER has increased from 1.47% to 1.98% over the period of year 2012 and 2013. The business’s ability of controlling its general expenses is worse in year 2012 than 2013.
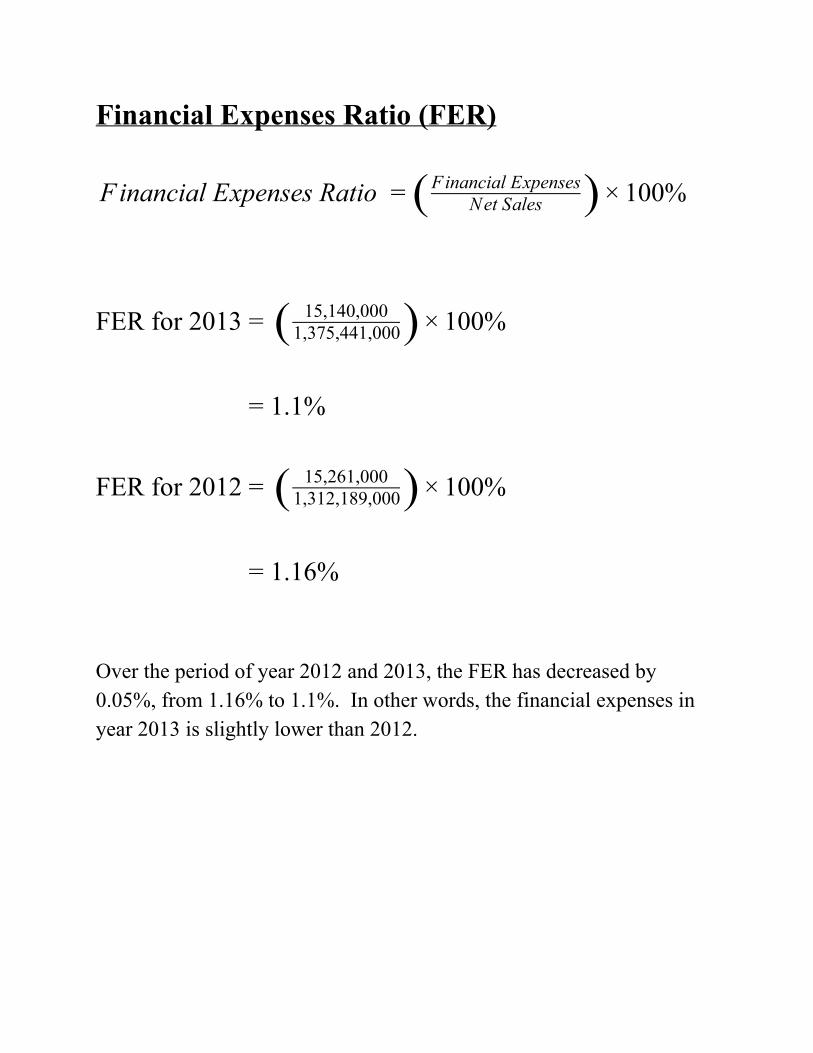
Financial Expenses Ratio (FER)
inancial Expenses Ratio 00% F = ( Net SalesFinancial Expenses) × 1
FER for 2013 = 00% ( 15,140,0001,375,441,000) × 1
= 1.1%
FER for 2012 = 00% ( 15,261,0001,312,189,000) × 1
= 1.16% Over the period of year 2012 and 2013, the FER has decreased by 0.05%, from 1.16% to 1.1%. In other words, the financial expenses in year 2013 is slightly lower than 2012.
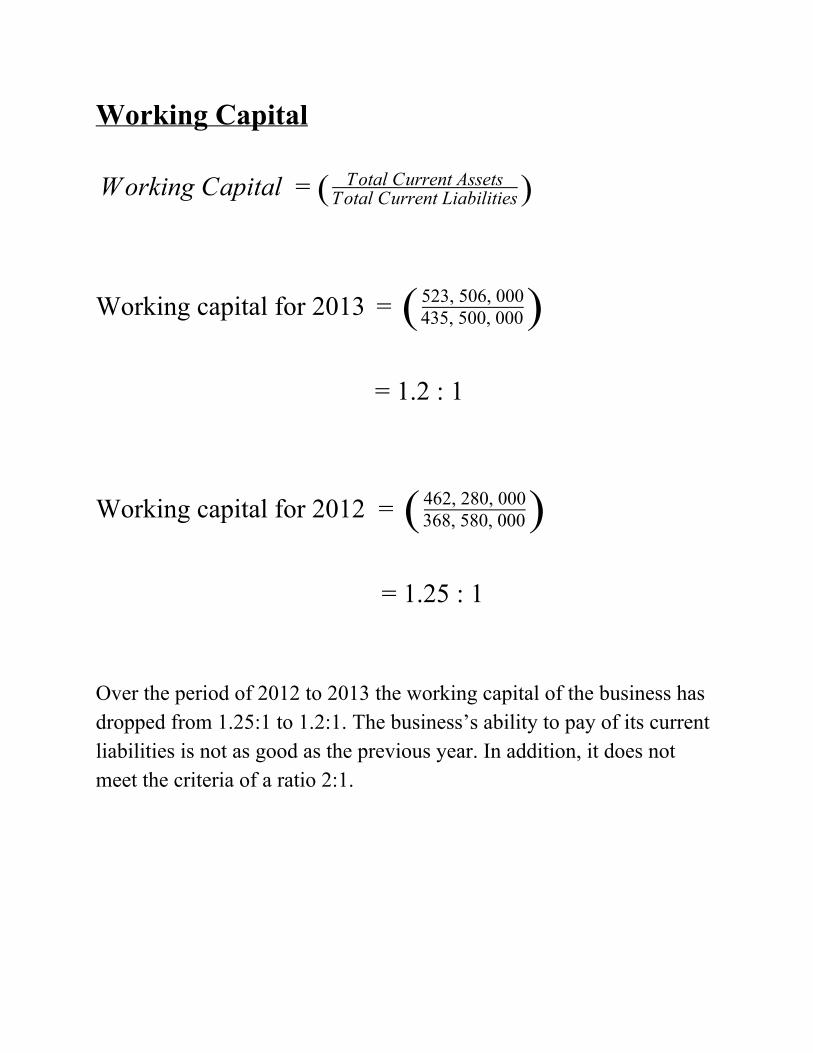
Working Capital orking Capital W = ( Total Current Assets
Total Current Liabilities)
Working capital for 2013 = ( 435, 500, 000523, 506, 000) = 1.2 : 1
Working capital for 2012 = ( 368, 580, 000462, 280, 000) = 1.25 : 1 Over the period of 2012 to 2013 the working capital of the business has dropped from 1.25:1 to 1.2:1. The business’s ability to pay of its current liabilities is not as good as the previous year. In addition, it does not meet the criteria of a ratio 2:1.
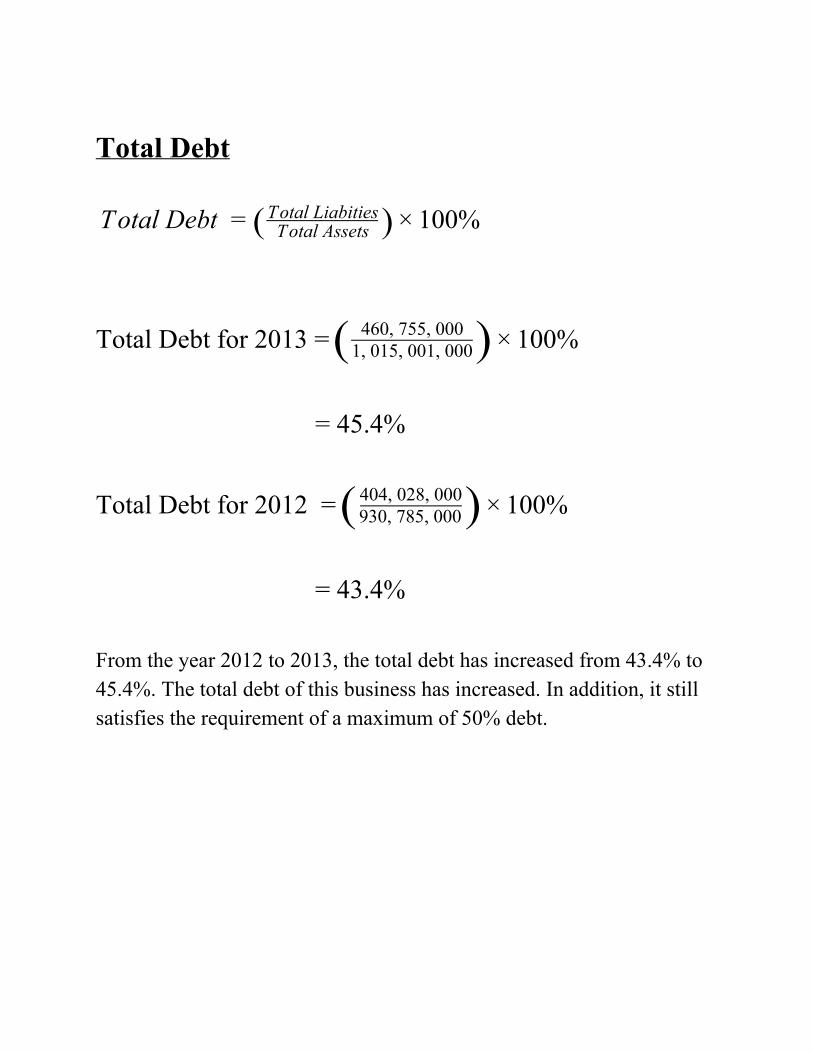
Total Debt otal Debt 00% T = ( Total Assets
Total Liabities) × 1
Total Debt for 2013 = 00% ( 460, 755, 0001, 015, 001, 000) × 1
= 45.4%
Total Debt for 2012 = 00% ( 930, 785, 000404, 028, 000) × 1
= 43.4% From the year 2012 to 2013, the total debt has increased from 43.4% to 45.4%. The total debt of this business has increased. In addition, it still satisfies the requirement of a maximum of 50% debt.
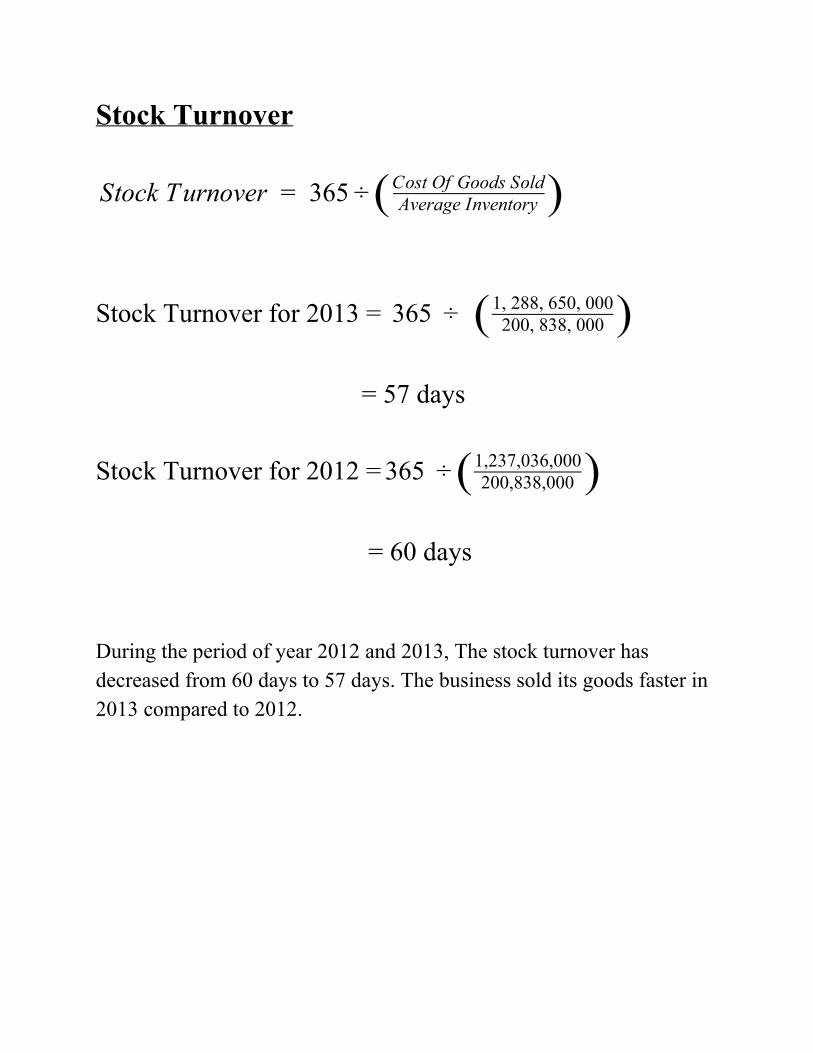
Stock Turnover
tock Turnover 365 S = ÷ ( Average InventoryCost Of Goods Sold)
Stock Turnover for 2013 = 65 3 ÷ ( 200, 838, 0001, 288, 650, 000)
= 57 days
Stock Turnover for 2012 = 65 3 ÷ ( 200,838,0001,237,036,000)
= 60 days During the period of year 2012 and 2013, The stock turnover has decreased from 60 days to 57 days. The business sold its goods faster in 2013 compared to 2012.
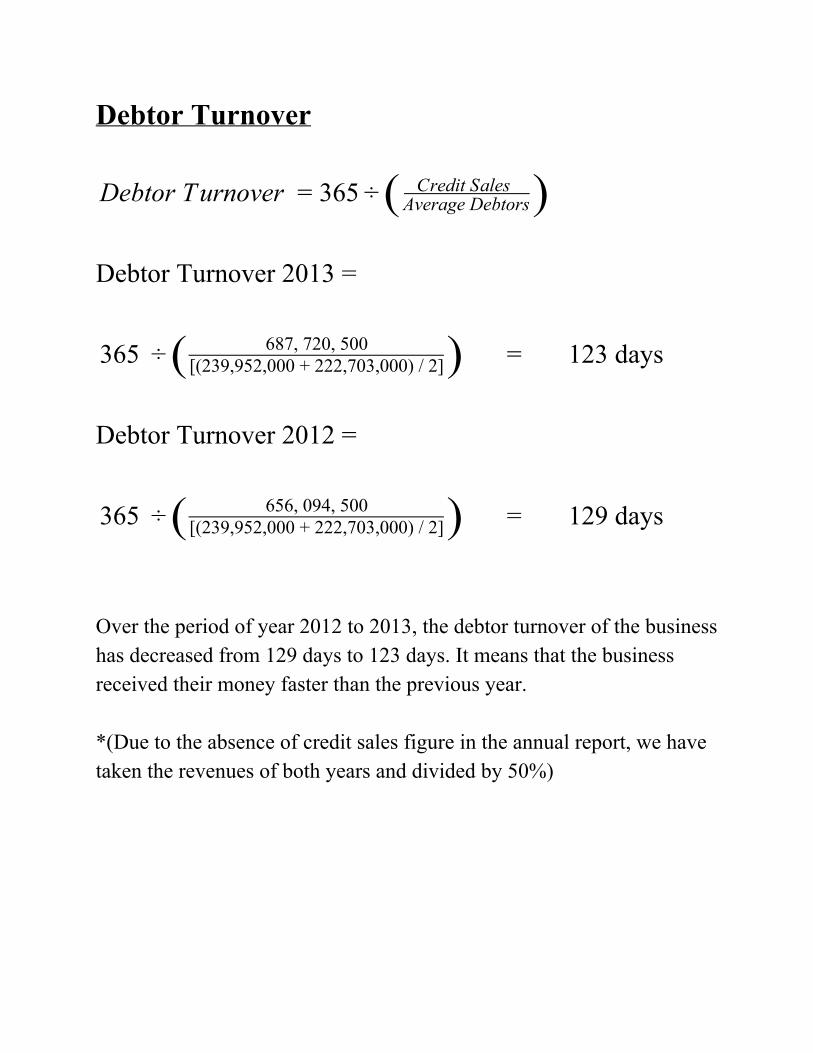
Debtor Turnover
ebtor Turnover 65 D = 3 ÷ ( Credit Sales Average Debtors)
Debtor Turnover 2013 =
= 123 days65 3 ÷ ( 687, 720, 500[(239,952,000 + 222,703,000) / 2])
Debtor Turnover 2012 =
= 129 days65 3 ÷ ( 656, 094, 500[(239,952,000 + 222,703,000) / 2])
Over the period of year 2012 to 2013, the debtor turnover of the business has decreased from 129 days to 123 days. It means that the business received their money faster than the previous year. *(Due to the absence of credit sales figure in the annual report, we have taken the revenues of both years and divided by 50%)
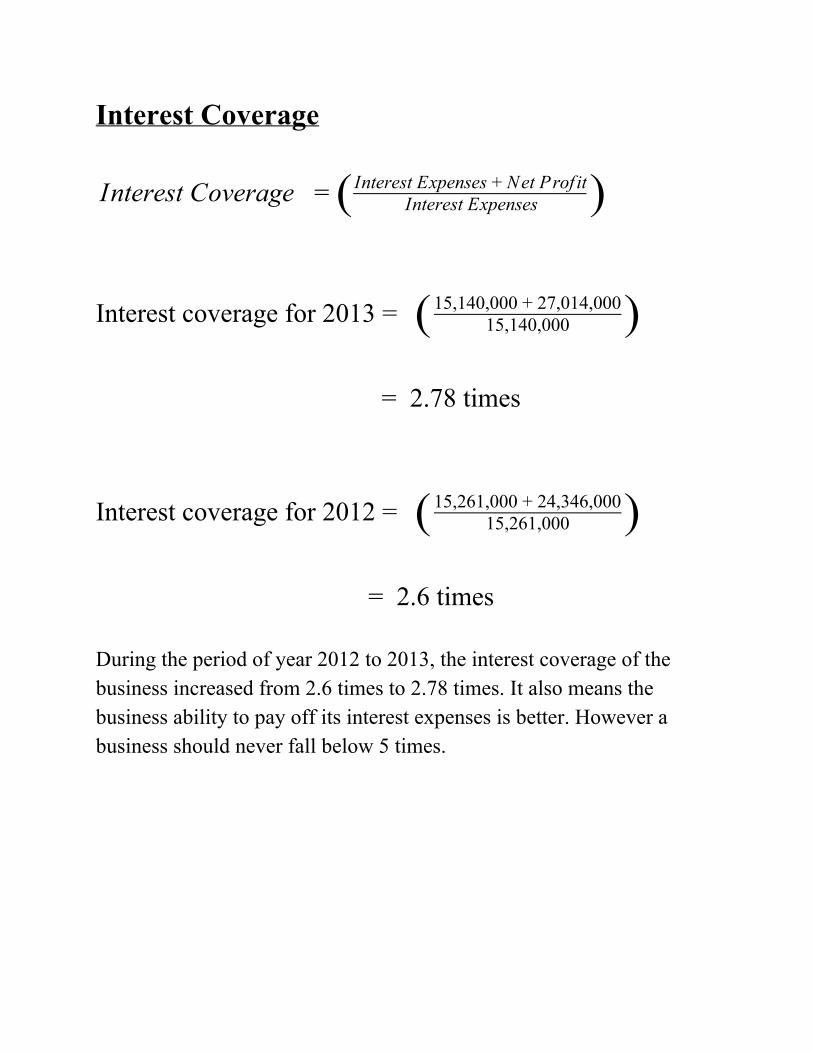
Interest Coverage
nterest Coverage I = ( Interest ExpensesInterest Expenses + Net Prof it)
Interest coverage for 2013 = ( 15,140,00015,140,000 + 27,014,000)
= 2.78 times
Interest coverage for 2012 = ( 15,261,00015,261,000 + 24,346,000)
= 2.6 times During the period of year 2012 to 2013, the interest coverage of the business increased from 2.6 times to 2.78 times. It also means the business ability to pay off its interest expenses is better. However a business should never fall below 5 times.
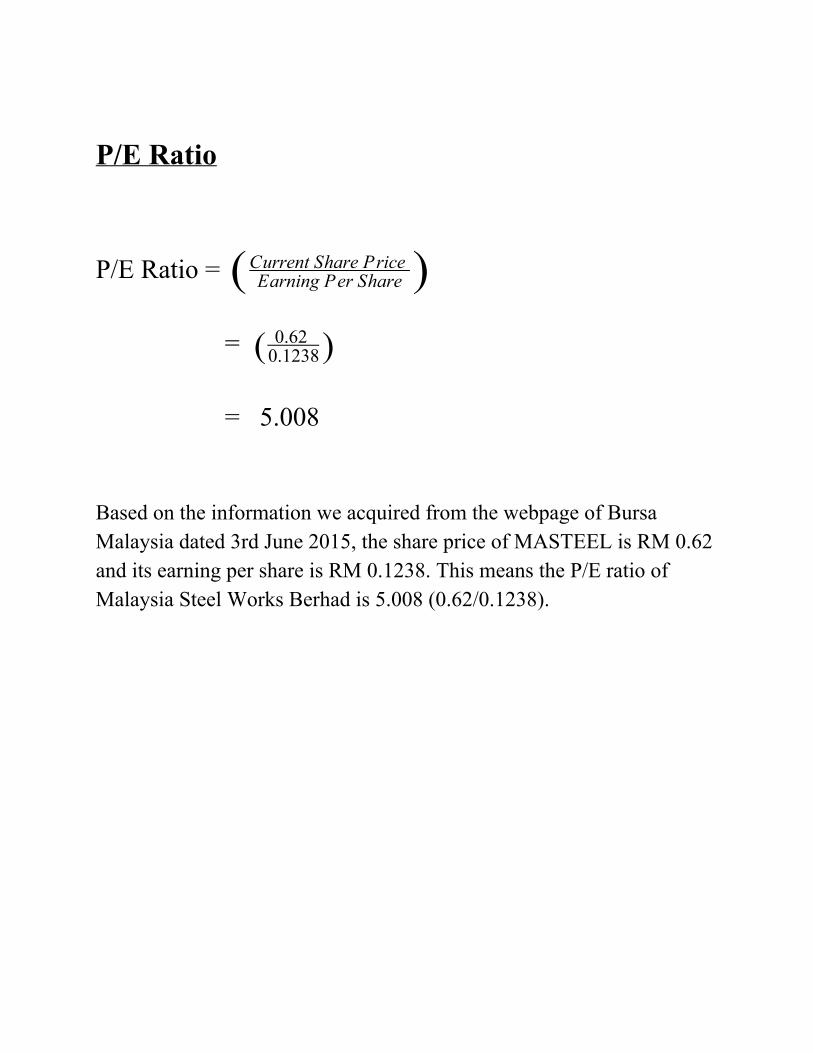
P/E Ratio
P/E Ratio = ( Earning Per Share
Current Share Price )
= ( 0.62 0.1238)
= 5.008
Based on the information we acquired from the webpage of Bursa Malaysia dated 3rd June 2015, the share price of MASTEEL is RM 0.62 and its earning per share is RM 0.1238. This means the P/E ratio of Malaysia Steel Works Berhad is 5.008 (0.62/0.1238).
CONCLUSION
Based on the information we had acquired through few sources, the profitability of the business is pretty satisfying. It has clearly shown that the owner is getting more return from his capital invested. The return of equity shows a positive increased by 0.5% from 4.5% to 5% over the period of year 2012 and 2013. Secondly, this business has also improved in terms of controlling its overall expenses over the year from the year 2012, Net Profit Margin shows a clear figure of a minor increase from 1.86% to 1.96%. Other than that, based on the increased numbers in the Gross Profit Margin (GPM), the business is getting better in terms of their ability to control its cost of goods sold expenses. Selling expenses are also being well controlled by the company as the Selling Expenses Ratio of the business had a slight decrease over the year 2012 and 2013. It has also shown a lower figure for the financial expenses of the business from year 2012 to the year 2013. Furthermore, the total debt of this business over the year 2012 and 2013 has increased from 43.4% to 45.4%. Although the total debt incurred has increased slightly, but it still remains below the maximum debt limit of 50%. The business has fulfilled the maximum total debt of 50%. Moreover, the business’s stock turnover has decreases from 60 days to 57 days which shows a significantly good result as the business managed to sell its goods at a faster rate at the year 2013 compared to year 2012. Not only that, the debtor turnover for the company has also decreased from 129 days to 123 days. It also means that the business received their money faster than the previous year. During the period of year 2012 to 2013, the business’s interest coverage has also increased from 2.6 times to 2.78 times which means that the business ability to pay off its interest expense has improved too.
However, on the down side, based on the figure of the working capital of the business, the business has dropped from the ratio of 1.25:1 to 1.2:1. It also means that the business’s ability to pay of its current liabilities is not as good as the previous year. Finally, the P/E ratio of MASTEEL is as low as 5.008. It lies below the reasonable P/E ratio which is 15. Although there are few lacklustre results acquired by calculating the financial ratios, this company is still worth investing as most of the results are positive and improving. Investors are encouraged to consider this steel manufacturing company into their investment portfolios. Our team would RECOMMEND this company to the canny investors. Investors are required to invest at own risks. Happy investing.
Appendix
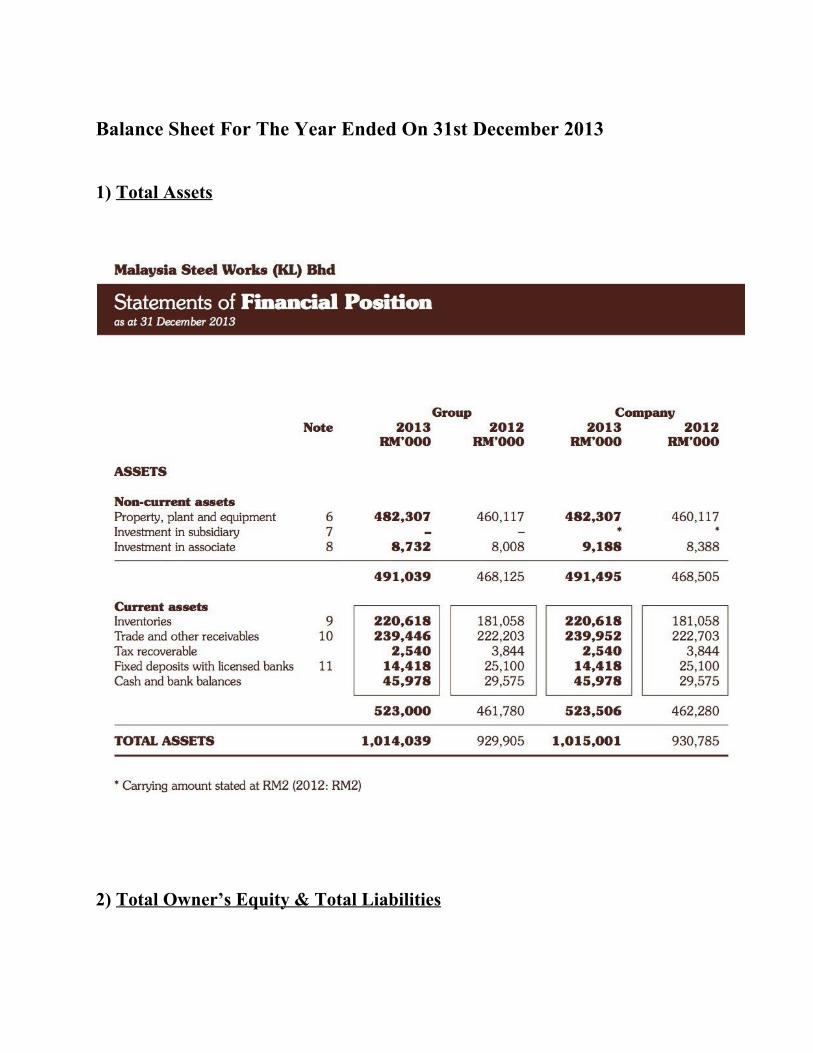
Balance Sheet For The Year Ended On 31st December 2013
1) Total Assets
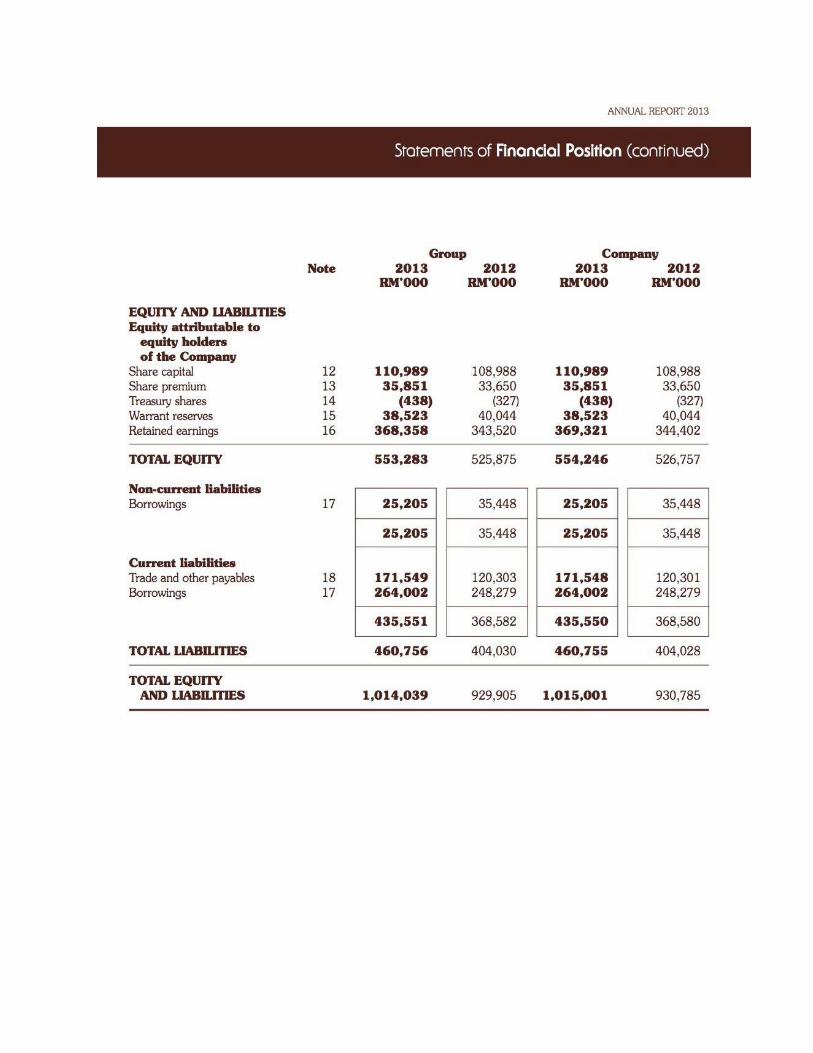
2) Total Owner’s Equity & Total Liabilities
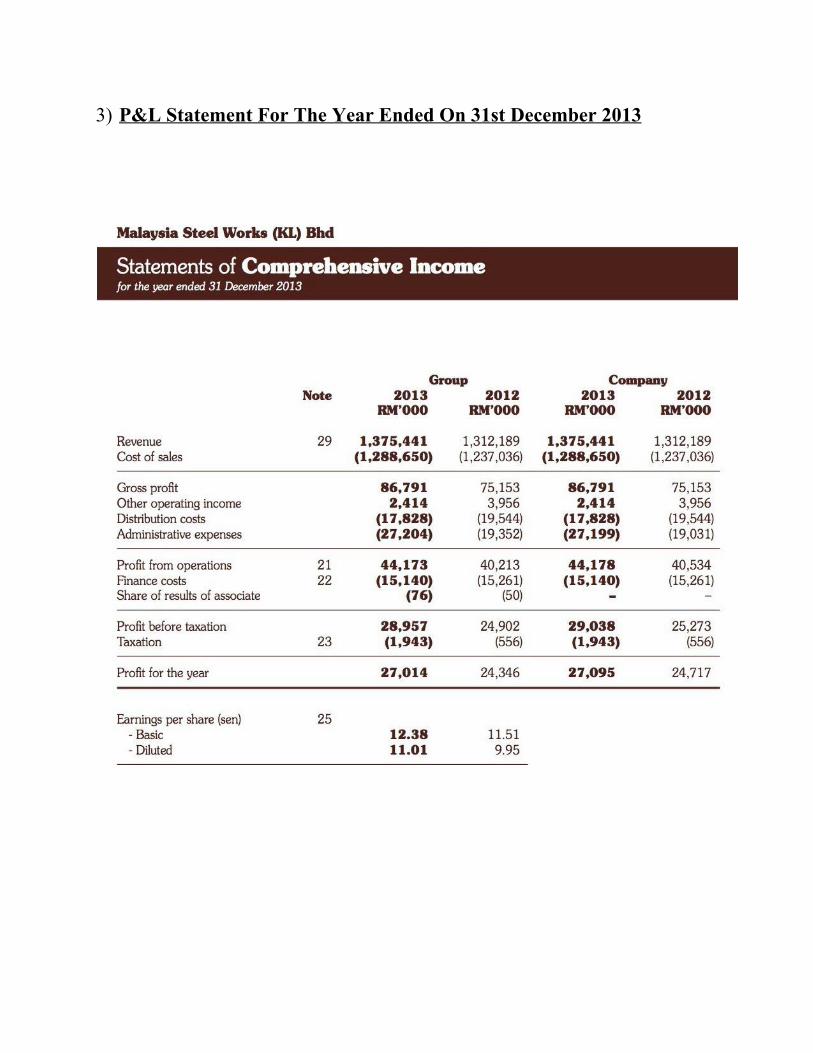
3) P&L Statement For The Year Ended On 31st December 2013
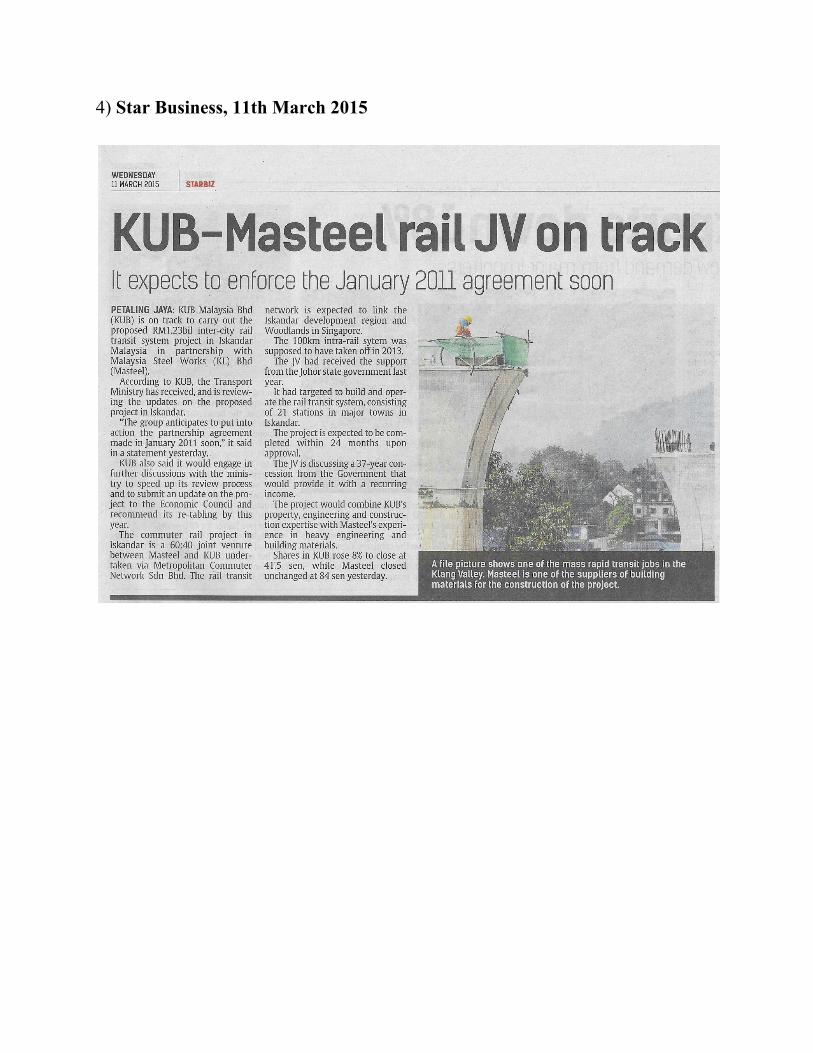
4) Star Business, 11th March 2015
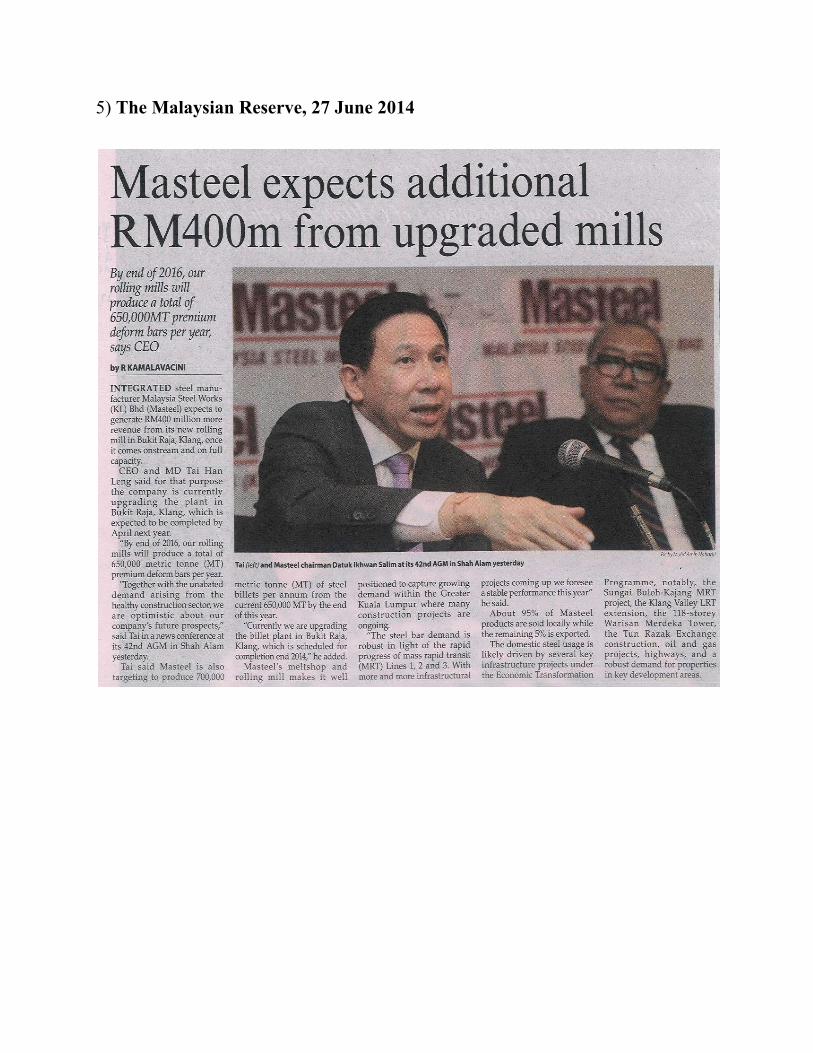
5) The Malaysian Reserve, 27 June 2014
REFERENCE
1) Company History. (n.d.). Retrieved June 1, 2015, from http://www.masteel.com.my/about2/briefhistorymilestone/
2) Malaysia Steel Works (KL) Berhad Information. (n.d.). Retrieved June 1,
2015, from http://www.bursamalaysia.com/market/listedcompanies/listofcompanies/plcprofile.html?stock_code=5098
3) Liz, L. (2014, August 30). Masteel's will of steel Business News | The Star
Online. Retrieved June 1, 2015, from http://www.thestar.com.my/Business/BusinessNews/2014/08/30/MasteelswillofsteelSteelproducerkeenforrailprojecttorunalongsideitscorebusiness/?style=biz