Embed Size (px)
Citation preview
REGIONAL RESEARCH CONFERENCE
AGRICULTURAL TRANSFORMATION AND FOOD SECURITY IN CENTRAL ASIA
Market Integration and Price Transmission in Tajikistan’s Wheat
Markets: Rising like rockets but falling like feathers?
Jarilkasin Ilyasov+*, Kamiljon Akramov+, Linde Goetzⱡ and Paul Dorosh+
+ International Food Policy Research Institute (IFPRI), Washington, DC, United States ⱡ Leibniz Institute of Agricultural Development in Transition Economies (IAMO), Halle (Salle), Germany
* Corresponding author’s email address: [email protected]
Contribute to the understanding of wheat markets in Central Asia, particularly from market integration and price transmission perspective.
Goal
(i) How well wheat markets in Tajikistan are integrated with international and regional wheat prices, as well as domestically?
(ii) What is the nature of price transmission between different markets? And, does asymmetric price adjustment (a.k.a“rockets and feathers”) prevail in Tajikistan wheat markets?
Research questions
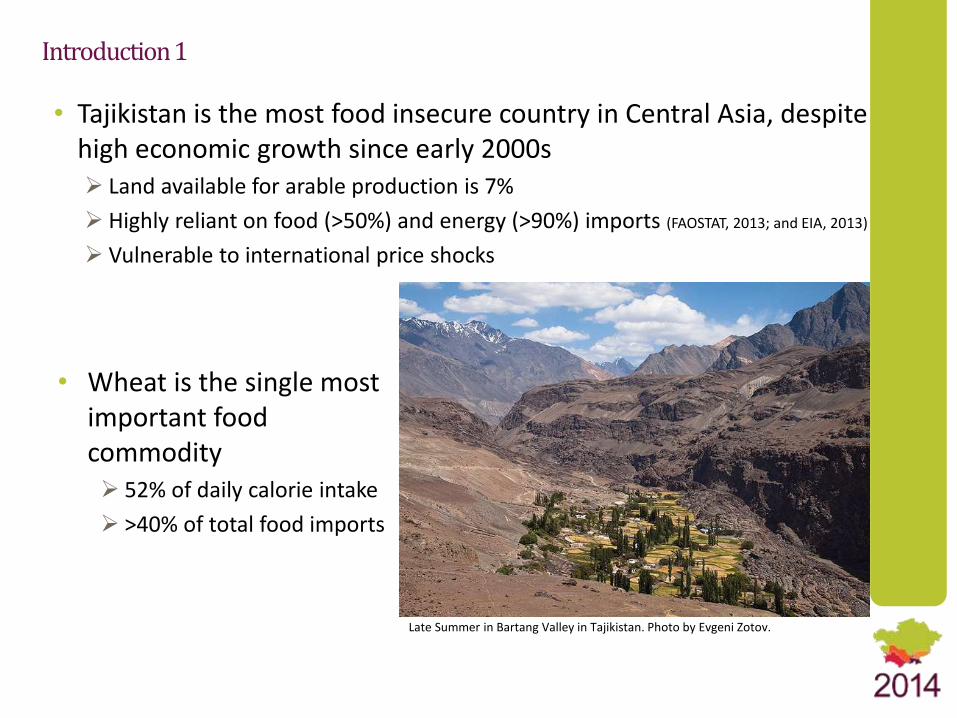
Introduction 1
• Tajikistan is the most food insecure country in Central Asia, despite high economic growth since early 2000s Land available for arable production is 7%
Highly reliant on food (>50%) and energy (>90%) imports (FAOSTAT, 2013; and EIA, 2013)
Vulnerable to international price shocks
• Wheat is the single most important food commodity 52% of daily calorie intake
>40% of total food imports
Late Summer in Bartang Valley in Tajikistan. Photo by Evgeni Zotov.
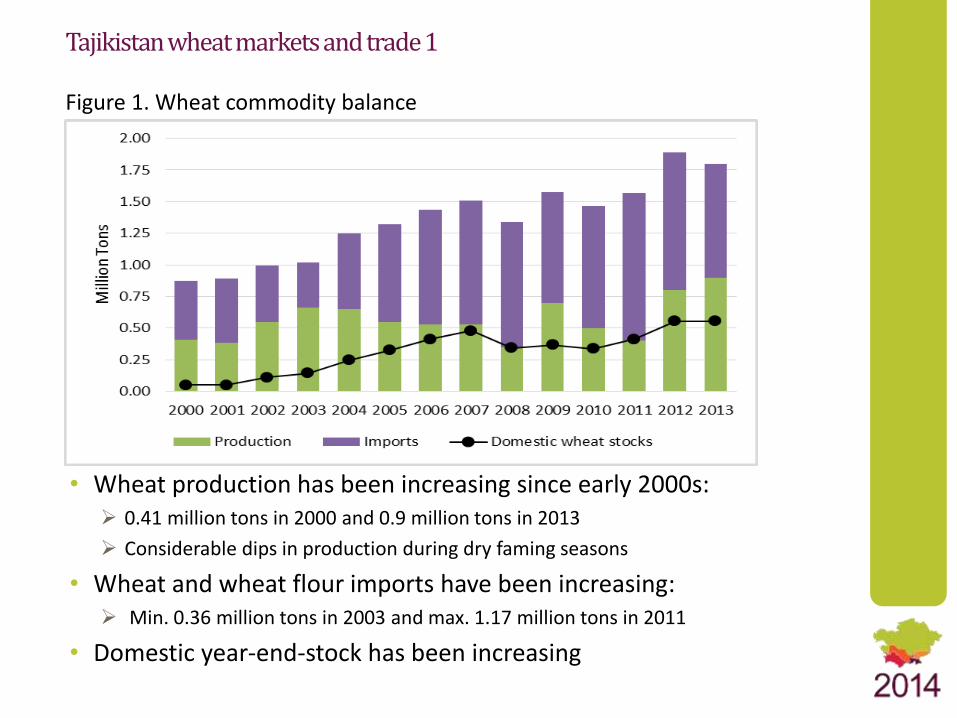
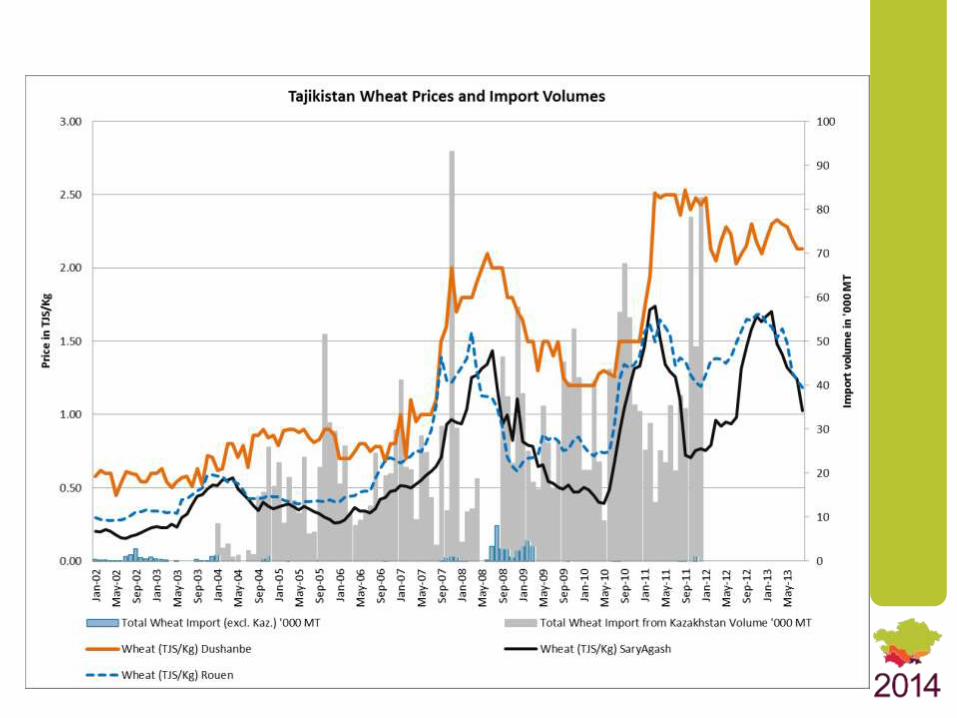
• Wheat production has been increasing since early 2000s: 0.41 million tons in 2000 and 0.9 million tons in 2013
Considerable dips in production during dry faming seasons
• Wheat and wheat flour imports have been increasing: Min. 0.36 million tons in 2003 and max. 1.17 million tons in 2011
• Domestic year-end-stock has been increasing
Figure 1. Wheat commodity balance
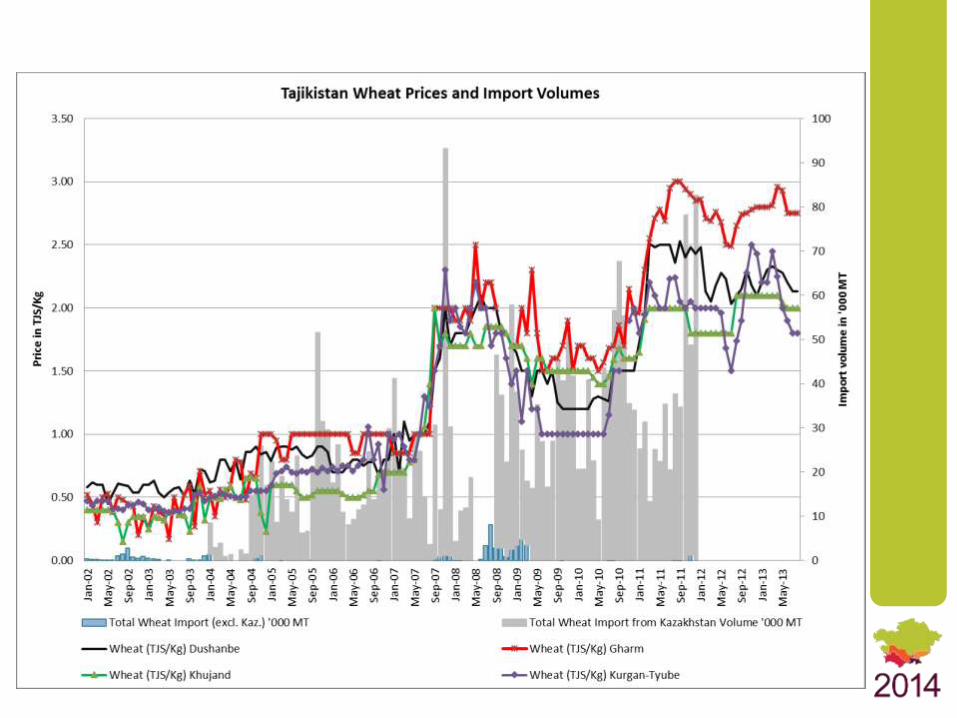
Tajikistan wheat markets and trade 1
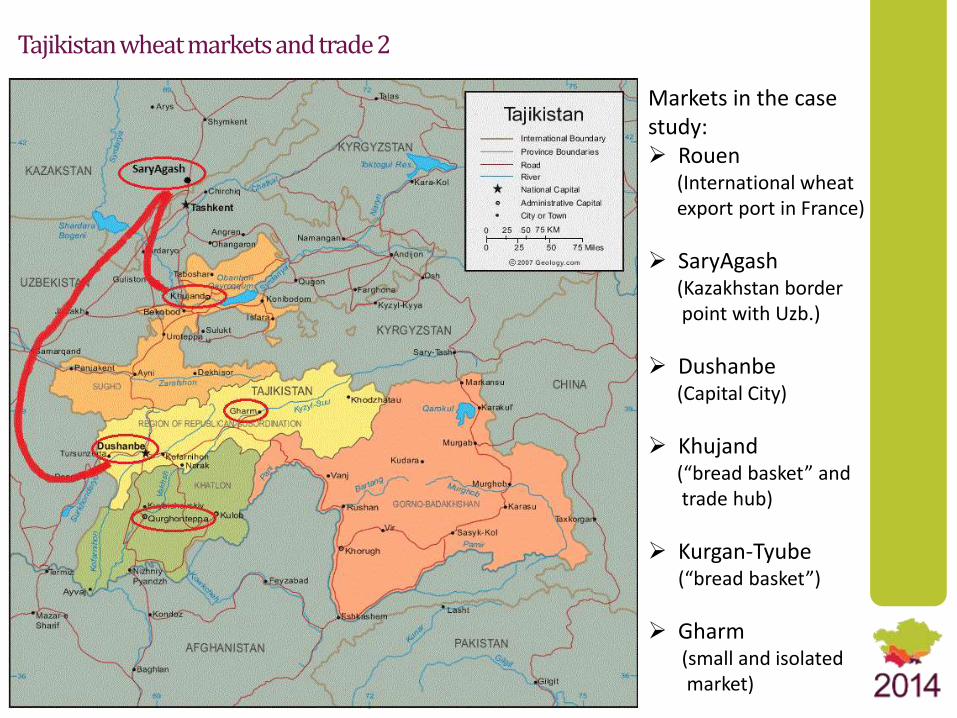
Tajikistan wheat markets and trade 2
Markets in the case study: Rouen
(International wheat export port in France)
SaryAgash(Kazakhstan border point with Uzb.)
Dushanbe(Capital City)
Khujand(“bread basket” and trade hub)
Kurgan-Tyube(“bread basket”)
Gharm(small and isolated market)
Theoretical Framework and Methodology 1
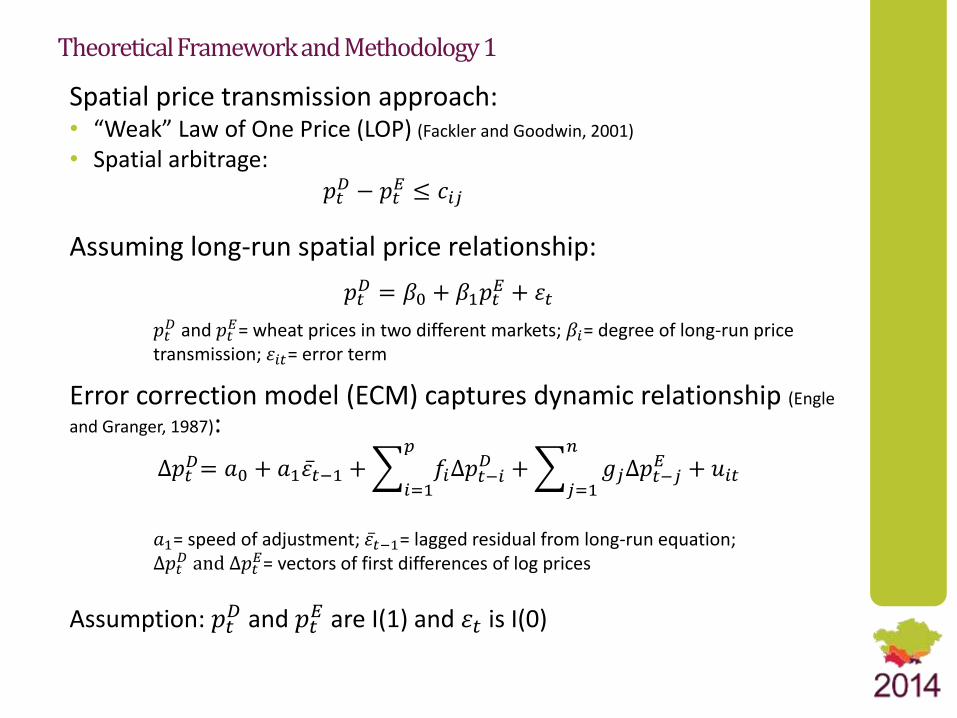
Spatial price transmission approach:• “Weak” Law of One Price (LOP) (Fackler and Goodwin, 2001)
• Spatial arbitrage: 𝑝𝑡𝐷 − 𝑝𝑡
𝐸 ≤ 𝑐𝑖𝑗
Assuming long-run spatial price relationship:
𝑝𝑡𝐷 = 𝛽0 + 𝛽1𝑝𝑡
𝐸 + 𝜀𝑡
𝑝𝑡𝐷 and 𝑝𝑡
𝐸= wheat prices in two different markets; 𝛽𝑖= degree of long-run price transmission; 𝜀𝑖𝑡= error term
Error correction model (ECM) captures dynamic relationship (Engle
and Granger, 1987):
∆𝑝𝑡𝐷= 𝑎0 + 𝑎1 𝜀𝑡−1 +
𝑖=1
𝑝
𝑓𝑖∆𝑝𝑡−𝑖𝐷 +
𝑗=1
𝑛
𝑔𝑗∆𝑝𝑡−𝑗𝐸 + 𝑢𝑖𝑡
𝑎1= speed of adjustment; 𝜀𝑡−1= lagged residual from long-run equation; ∆𝑝𝑡
𝐷 and ∆𝑝𝑡𝐸= vectors of first differences of log prices
Assumption: 𝑝𝑡𝐷 and 𝑝𝑡
𝐸 are I(1) and 𝜀𝑡 is I(0)
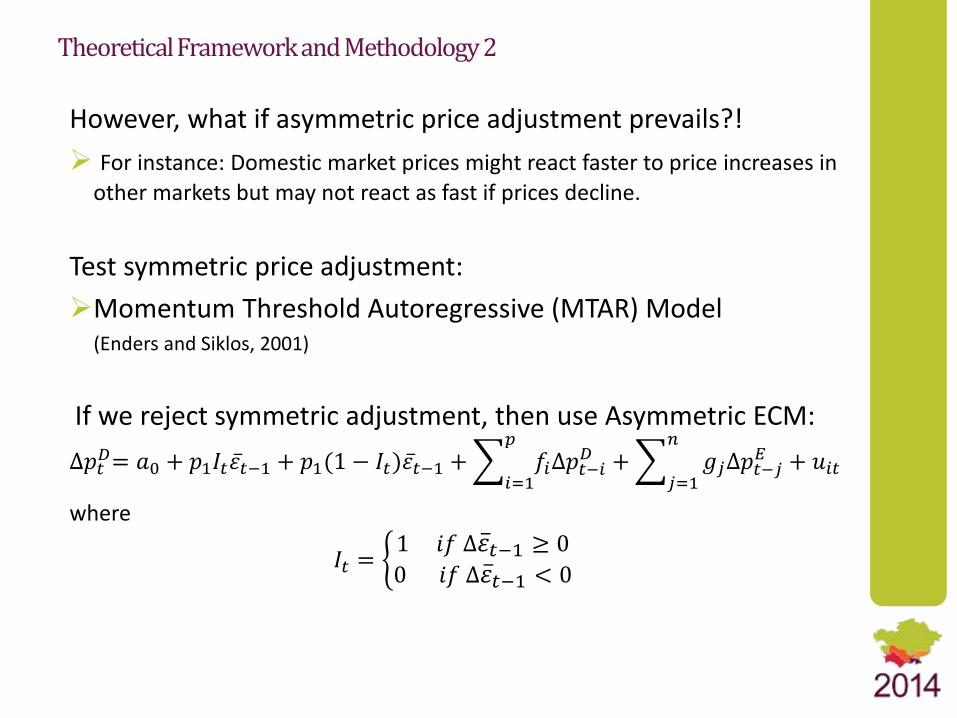
However, what if asymmetric price adjustment prevails?!
For instance: Domestic market prices might react faster to price increases in
other markets but may not react as fast if prices decline.
Test symmetric price adjustment:
Momentum Threshold Autoregressive (MTAR) Model (Enders and Siklos, 2001)
If we reject symmetric adjustment, then use Asymmetric ECM:
∆𝑝𝑡𝐷= 𝑎0 + 𝑝1𝐼𝑡 𝜀𝑡−1 + 𝑝1(1 − 𝐼𝑡) 𝜀𝑡−1 +
𝑖=1
𝑝
𝑓𝑖∆𝑝𝑡−𝑖𝐷 +
𝑗=1
𝑛
𝑔𝑗∆𝑝𝑡−𝑗𝐸 + 𝑢𝑖𝑡
where
𝐼𝑡 = 1 𝑖𝑓 ∆ 𝜀𝑡−1 ≥ 0
0 𝑖𝑓 ∆ 𝜀𝑡−1 < 0
Theoretical Framework and Methodology 2
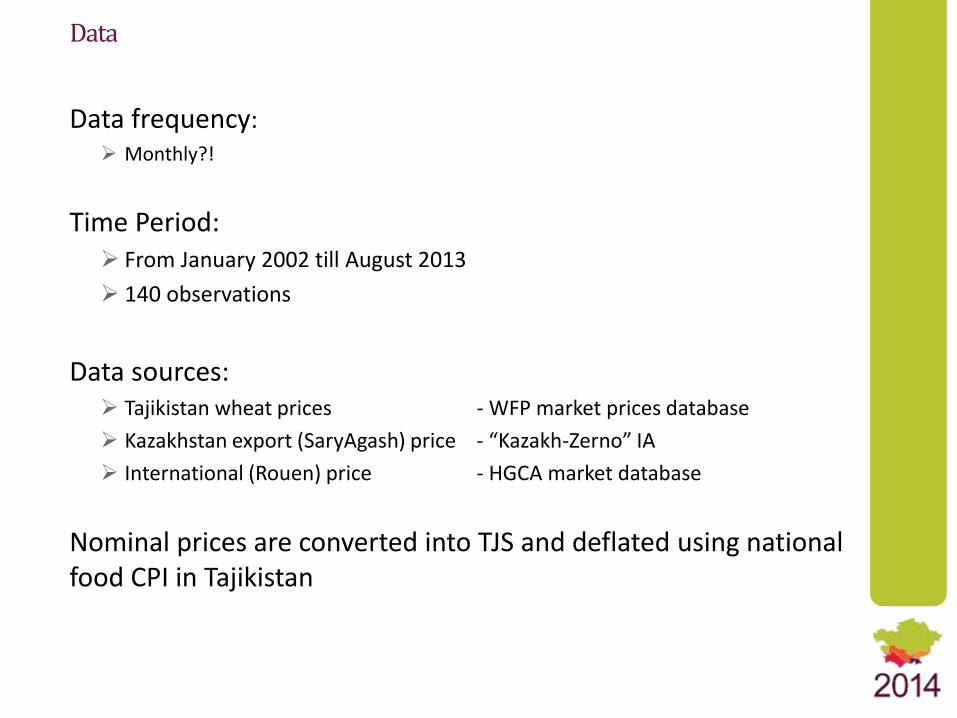
Data frequency: Monthly?!
Time Period: From January 2002 till August 2013
140 observations
Data sources: Tajikistan wheat prices - WFP market prices database
Kazakhstan export (SaryAgash) price - “Kazakh-Zerno” IA
International (Rouen) price - HGCA market database
Nominal prices are converted into TJS and deflated using national food CPI in Tajikistan
Data
Rouen SaryAgash Dushanbe Gharm KhujandKurgan-Tyube
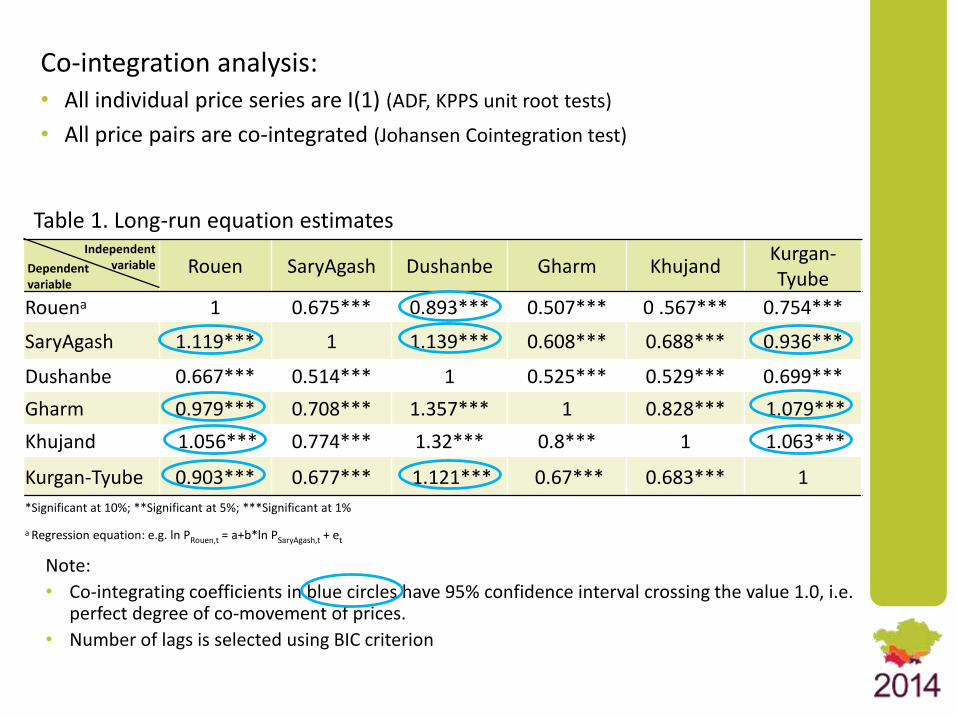
Rouena 1 0.675*** 0.893*** 0.507*** 0 .567*** 0.754***
SaryAgash 1.119*** 1 1.139*** 0.608*** 0.688*** 0.936***
Dushanbe 0.667*** 0.514*** 1 0.525*** 0.529*** 0.699***
Gharm 0.979*** 0.708*** 1.357*** 1 0.828*** 1.079***
Khujand 1.056*** 0.774*** 1.32*** 0.8*** 1 1.063***
Kurgan-Tyube 0.903*** 0.677*** 1.121*** 0.67*** 0.683*** 1
*Significant at 10%; **Significant at 5%; ***Significant at 1%
a Regression equation: e.g. ln PRouen,t = a+b*ln PSaryAgash,t + et
Independent variableDependent
variable
Note:
• Co-integrating coefficients in blue circles have 95% confidence interval crossing the value 1.0, i.e. perfect degree of co-movement of prices.
• Number of lags is selected using BIC criterion
Co-integration analysis:• All individual price series are I(1) (ADF, KPPS unit root tests)
• All price pairs are co-integrated (Johansen Cointegration test)
Table 1. Long-run equation estimates
Co-integration coefficient
Speed of adjustment
Speed of adj. when change in discrepancy is
negative
Speed of adj. when change in discrepancy is
positive
Independent variable: natural logarithm SaryAgash (Kaz. export) wheat pricea
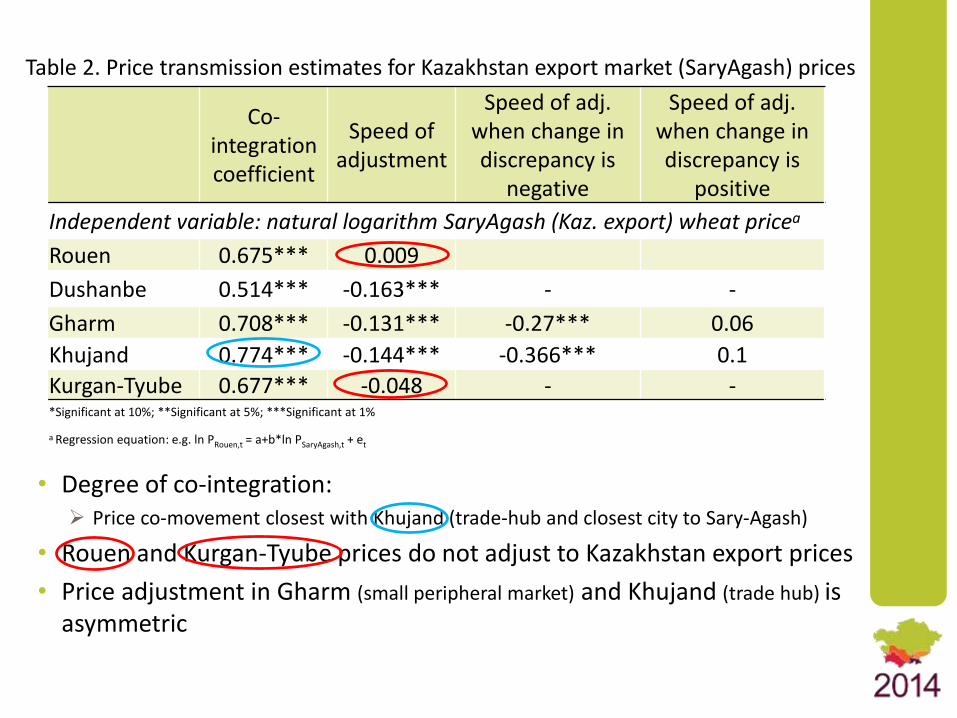
Rouen 0.675*** 0.009
Dushanbe 0.514*** -0.163*** - -
Gharm 0.708*** -0.131*** -0.27*** 0.06
Khujand 0.774*** -0.144*** -0.366*** 0.1
Kurgan-Tyube 0.677*** -0.048 - -*Significant at 10%; **Significant at 5%; ***Significant at 1%
a Regression equation: e.g. ln PRouen,t = a+b*ln PSaryAgash,t + et
• Degree of co-integration: Price co-movement closest with Khujand (trade-hub and closest city to Sary-Agash)
• Rouen and Kurgan-Tyube prices do not adjust to Kazakhstan export prices
• Price adjustment in Gharm (small peripheral market) and Khujand (trade hub) is asymmetric
Table 2. Price transmission estimates for Kazakhstan export market (SaryAgash) prices
Co-integration coefficient
Speed of adjustment
Speed of adj. when change in discrepancy is
negative
Speed of adj. when change in discrepancy is
positive
Dependent variable: natural logarithm Dushanbe wheat priceb
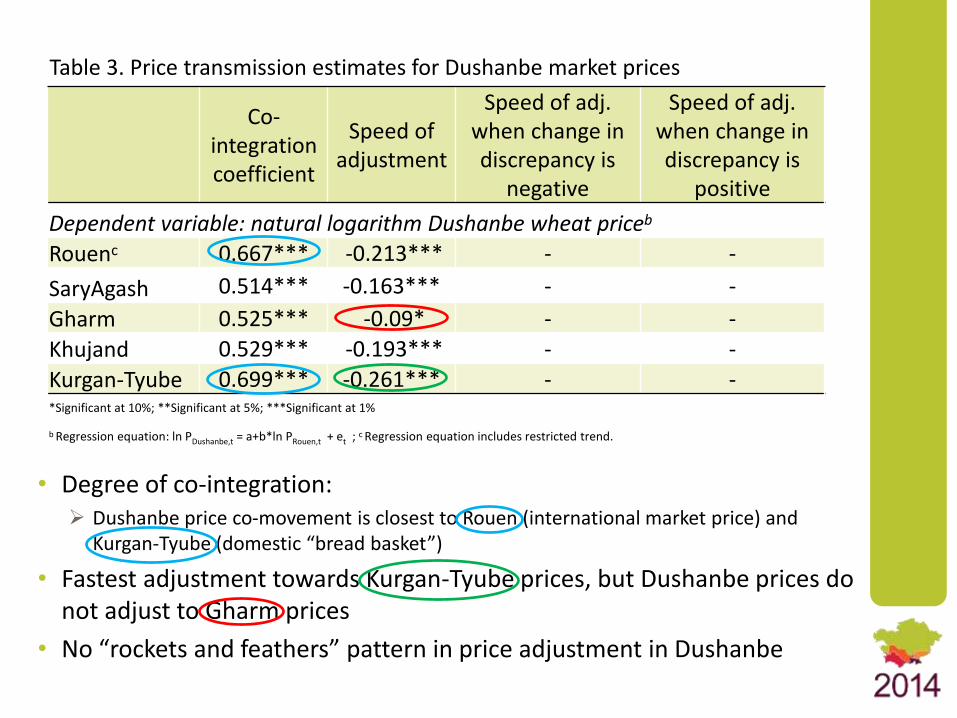
Rouenc 0.667*** -0.213*** - -
SaryAgash 0.514*** -0.163*** - -
Gharm 0.525*** -0.09* - -
Khujand 0.529*** -0.193*** - -
Kurgan-Tyube 0.699*** -0.261*** - -*Significant at 10%; **Significant at 5%; ***Significant at 1%
b Regression equation: ln PDushanbe,t = a+b*ln PRouen,t + et ; c Regression equation includes restricted trend.
• Degree of co-integration: Dushanbe price co-movement is closest to Rouen (international market price) and
Kurgan-Tyube (domestic “bread basket”)
• Fastest adjustment towards Kurgan-Tyube prices, but Dushanbe prices do not adjust to Gharm prices
• No “rockets and feathers” pattern in price adjustment in Dushanbe
Table 3. Price transmission estimates for Dushanbe market prices
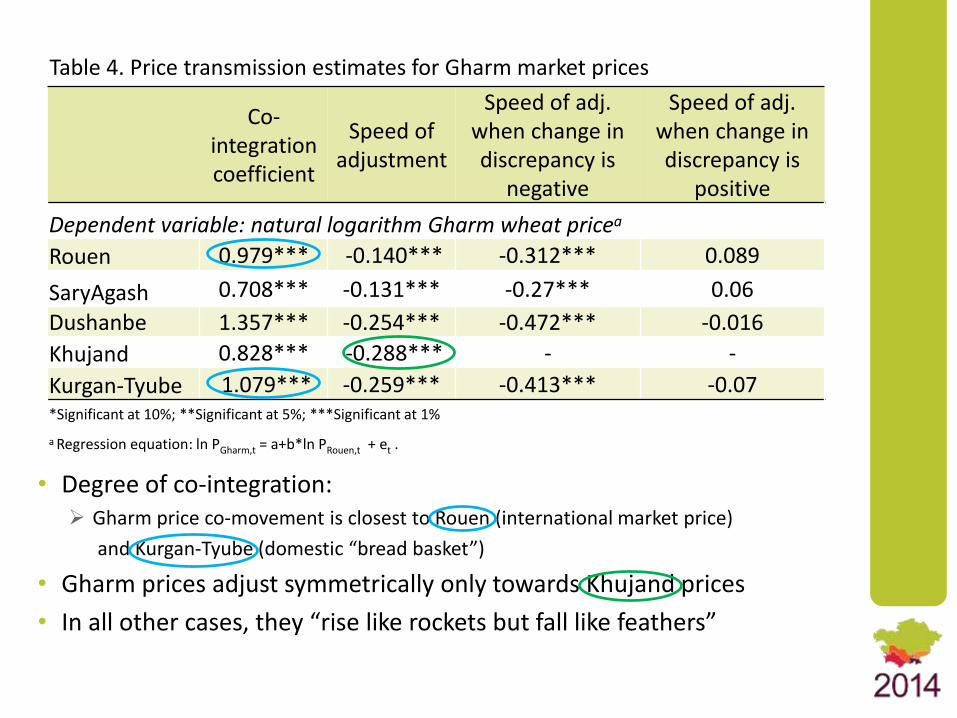
Co-integration coefficient
Speed of adjustment
Speed of adj. when change in discrepancy is
negative
Speed of adj. when change in discrepancy is
positive
Dependent variable: natural logarithm Gharm wheat pricea
Rouen 0.979*** -0.140*** -0.312*** 0.089
SaryAgash 0.708*** -0.131*** -0.27*** 0.06
Dushanbe 1.357*** -0.254*** -0.472*** -0.016
Khujand 0.828*** -0.288*** - -
Kurgan-Tyube 1.079*** -0.259*** -0.413*** -0.07*Significant at 10%; **Significant at 5%; ***Significant at 1%
a Regression equation: ln PGharm,t = a+b*ln PRouen,t + et .
• Degree of co-integration: Gharm price co-movement is closest to Rouen (international market price)
and Kurgan-Tyube (domestic “bread basket”)
• Gharm prices adjust symmetrically only towards Khujand prices
• In all other cases, they “rise like rockets but fall like feathers”
Table 4. Price transmission estimates for Gharm market prices
Wheat prices in all four markets in Tajikistan are co-integrated…:
…with regional export market price in Kazakhstan and international wheat price in Rouen;
…amongst each other.
Kurgan-Tyube (“bread basket”) market price influences prices in other domestic markets at least as much as Kazakhstan export pricedoes.
Asymmetric price adjustment prevails in Gharm wheat market:Could be relevant to many other peripheral markets in Tajikistan
Further investigations and analysis could be useful:• To explore possible reasons such as market power, adjustment costs,
asymmetric flow of market information, etc.
• To understand the effect on welfare particularly in marginalized communities.
Discussions and Conclusion
Thank you!
Photo by M.DeFreese, CIMMYT, 2012.


![preliminary Journal. editorial board Jounull Jaunull … heavy roots like a ball. Grass [Fronds] like feathers. 1 ft high. Black on surface & white inside. Grow up like fingers in](https://img.pdfslide.us/doc/110x75/5ae1b3a97f8b9a097a8c09af/preliminary-journal-editorial-board-jounull-jaunull-heavy-roots-like-a-ball.jpg)