Embed Size (px)
Citation preview
+44 (0)1225 [email protected]
Welcome to clear thinking
Managing cost models, baseline budgets and actual costs to deliver successful projects
Ewan Glen & Dr Paul Wood4 April 2017
+44 (0)1225 820980 www.bmt-hqs.com [email protected] ©BMT Hi-Q Sigma Ltd
Aims of the presentation
The presentation is aimed at providing the audience with a greater appreciation of the links between the initial cost model estimates against which a project business case is derived and approval achieved, and the subsequent baseline budget / actual costs against which it is managed to achieve successful delivery.
The presentation will take the audience on a journey through understanding what the project is expected to cost, and the factors that influence this, to the budget that is set and funds that are committed to deliver within. It will consider how the information developed is used through the life of the project, the challenges that are often encountered and how we might ensure that the final product / service delivered can be consider a success.
It will also consider scenarios where the product or service is associated with more than one project through life and how these can be related back to the original through life cost model
+44 (0)1225 820980 www.bmt-hqs.com [email protected] ©BMT Hi-Q Sigma Ltd
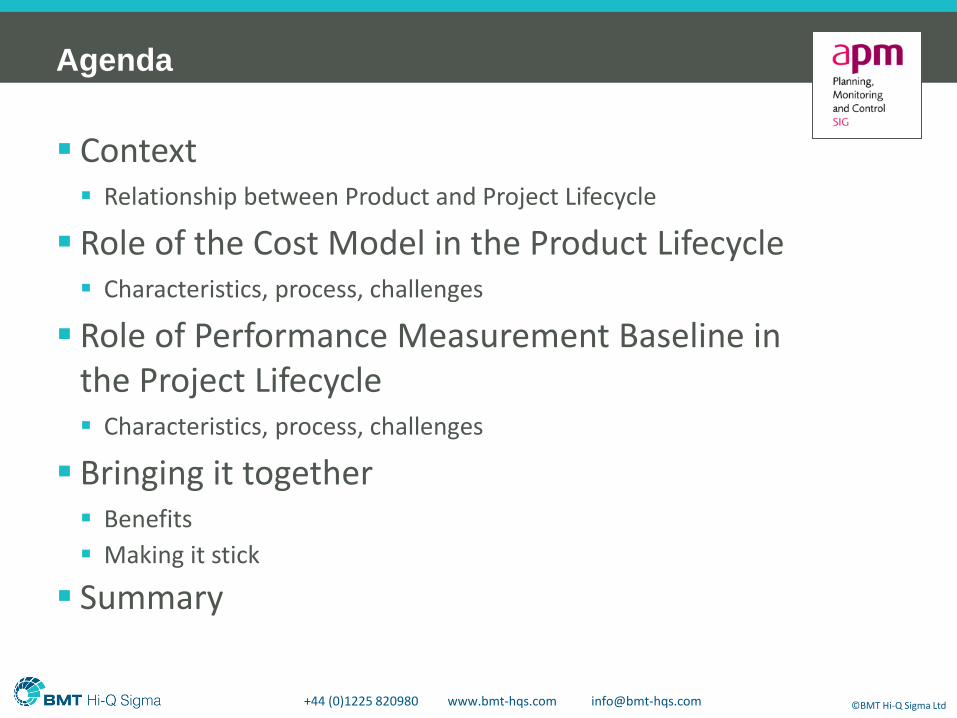
Context Relationship between Product and Project Lifecycle
Role of the Cost Model in the Product Lifecycle Characteristics, process, challenges
Role of Performance Measurement Baseline in the Project Lifecycle Characteristics, process, challenges
Bringing it together Benefits
Making it stick
Summary
Agenda
+44 (0)1225 820980 www.bmt-hqs.com [email protected] ©BMT Hi-Q Sigma Ltd
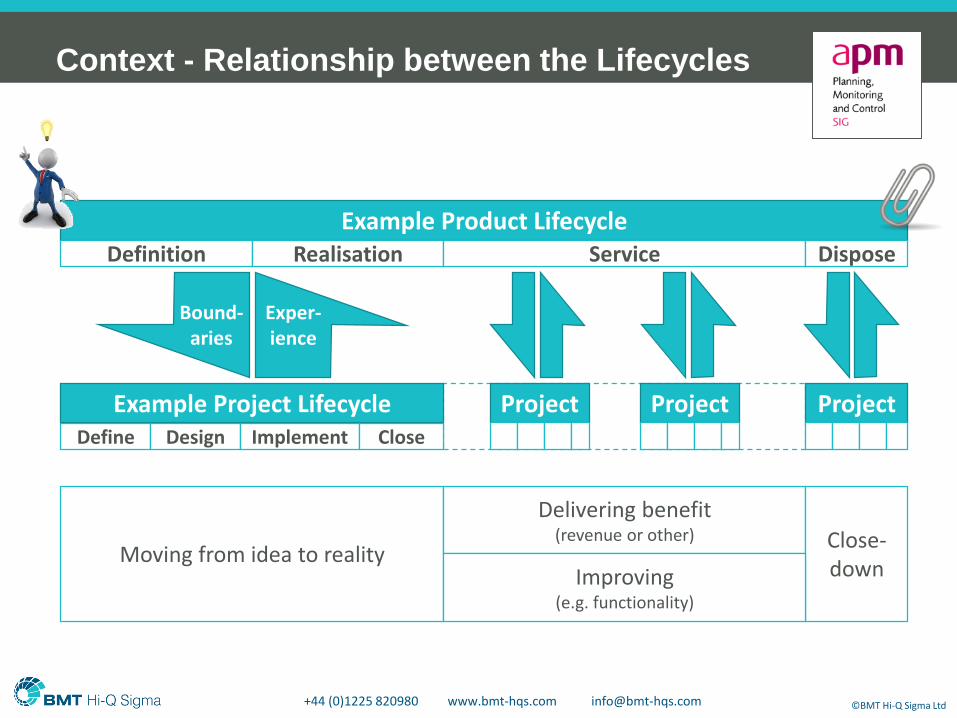
Context - Relationship between the Lifecycles
Example Product LifecycleDefinition Realisation Service Dispose
Example Project LifecycleDefine Design Implement Close
Project Project Project
Moving from idea to reality
Delivering benefit (revenue or other) Close-
down
Bound-aries
Exper-ience
Improving (e.g. functionality)
+44 (0)1225 820980 www.bmt-hqs.com [email protected] ©BMT Hi-Q Sigma Ltd
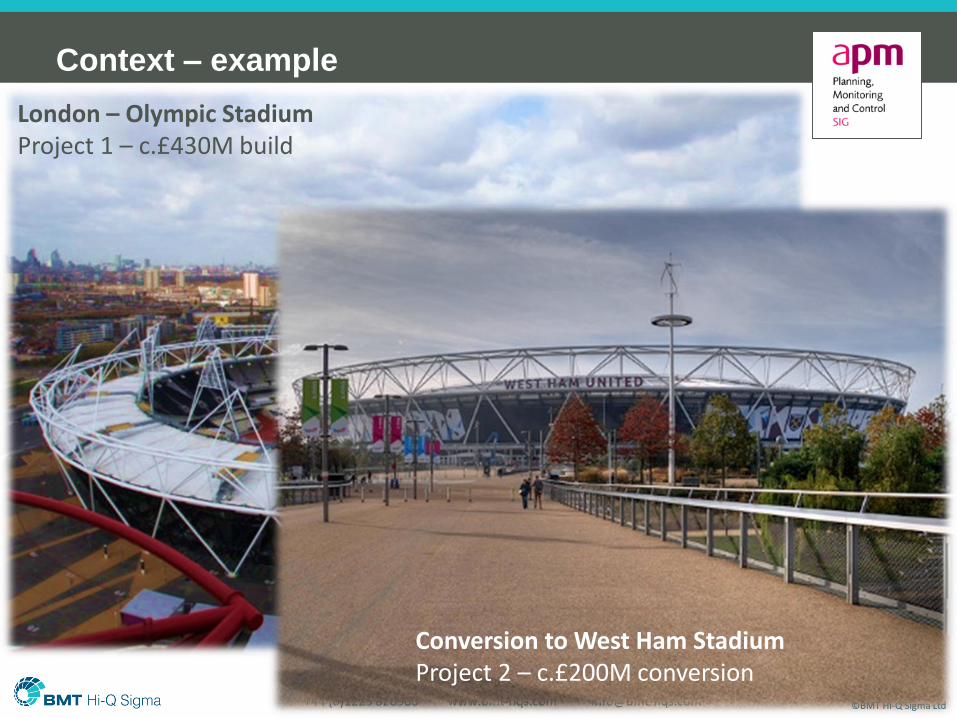
Context – example
London – Olympic StadiumProject 1 – c.£430M build
Conversion to West Ham StadiumProject 2 – c.£200M conversion
Role of the Cost Model
in the Product Lifecycle
• Characteristics
• Process
• Challenges
+44 (0)1225 820980 www.bmt-hqs.com [email protected] ©BMT Hi-Q Sigma Ltd
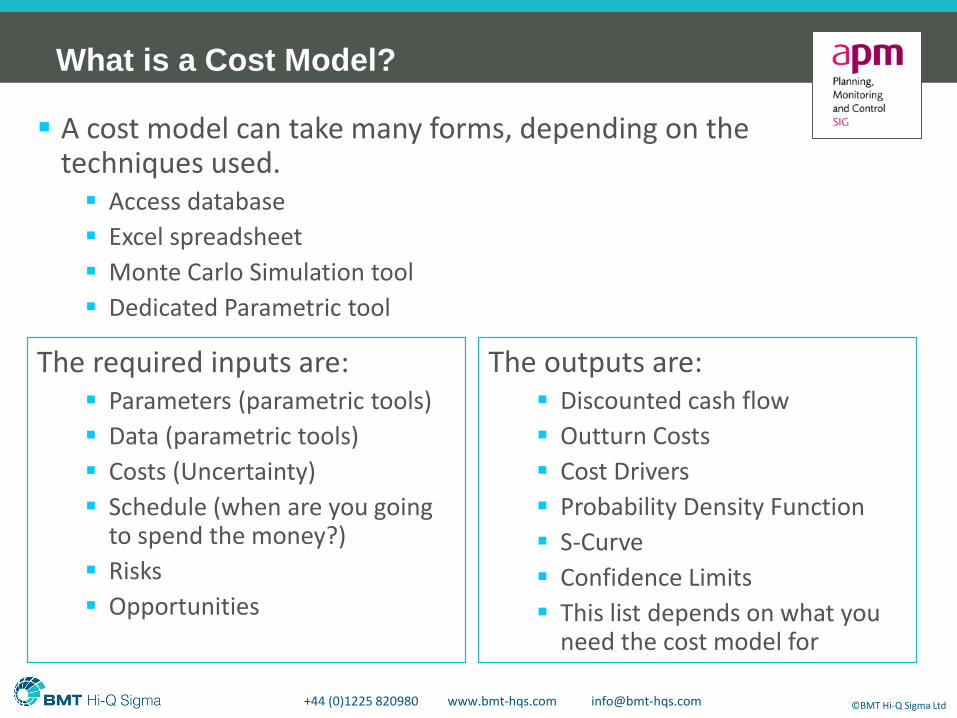
The required inputs are: Parameters (parametric tools)
Data (parametric tools)
Costs (Uncertainty)
Schedule (when are you going to spend the money?)
Risks
Opportunities
The outputs are: Discounted cash flow
Outturn Costs
Cost Drivers
Probability Density Function
S-Curve
Confidence Limits
This list depends on what you need the cost model for
A cost model can take many forms, depending on the techniques used. Access database
Excel spreadsheet
Monte Carlo Simulation tool
Dedicated Parametric tool
What is a Cost Model?
+44 (0)1225 820980 www.bmt-hqs.com [email protected] ©BMT Hi-Q Sigma Ltd
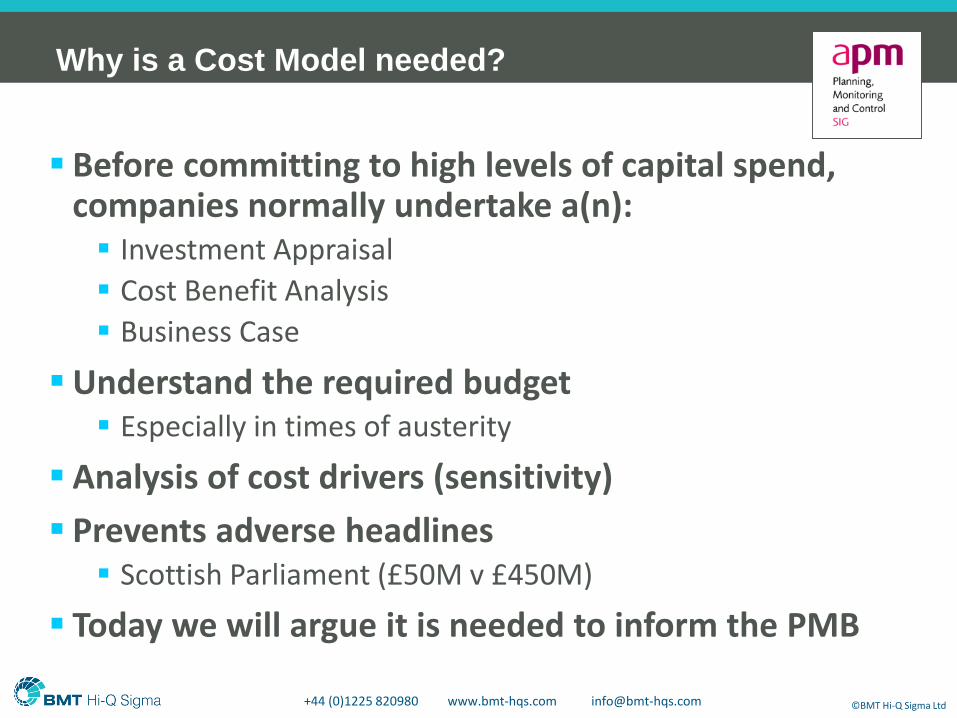
Before committing to high levels of capital spend, companies normally undertake a(n): Investment Appraisal
Cost Benefit Analysis
Business Case
Understand the required budget Especially in times of austerity
Analysis of cost drivers (sensitivity)
Prevents adverse headlines Scottish Parliament (£50M v £450M)
Today we will argue it is needed to inform the PMB
Why is a Cost Model needed?
+44 (0)1225 820980 www.bmt-hqs.com [email protected] ©BMT Hi-Q Sigma Ltd
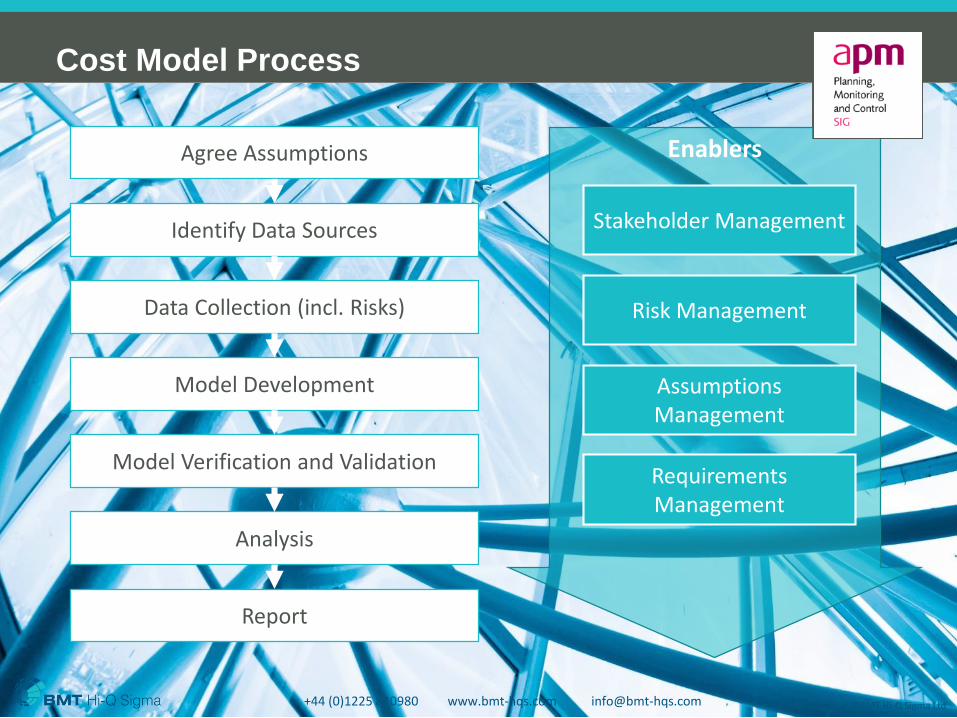
Cost Model Process
+44 (0)1225 820980 www.bmt-hqs.com [email protected] ©BMT Hi-Q Sigma Ltd
Agree Assumptions
Identify Data Sources
Data Collection (incl. Risks)
Model Development
Model Verification and Validation
Report
Analysis
Enablers
Stakeholder Management
Risk Management
Assumptions Management
Requirements Management
+44 (0)1225 820980 www.bmt-hqs.com [email protected] ©BMT Hi-Q Sigma Ltd
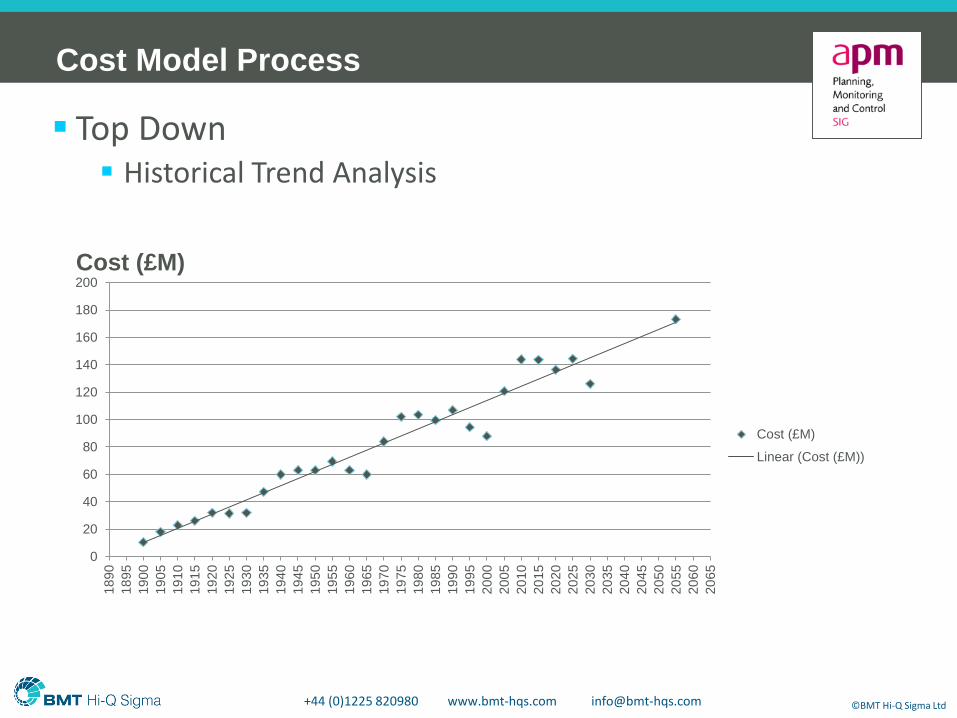
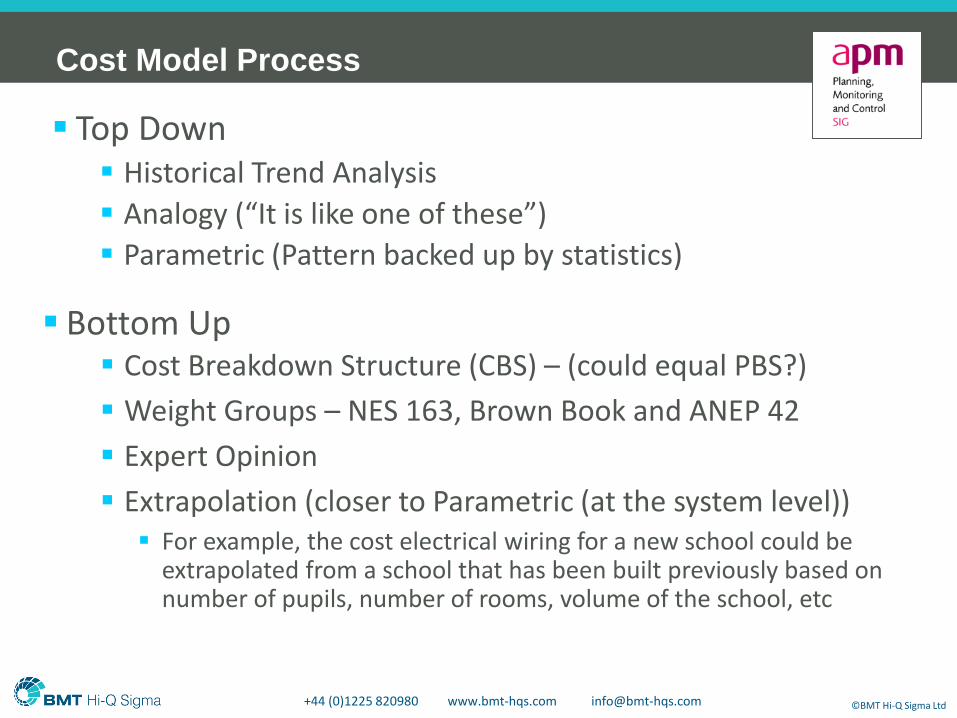
Top Down Historical Trend Analysis
Cost Model Process
0
20
40
60
80
100
120
140
160
180
200
18
90
18
95
19
00
19
05
19
10
19
15
19
20
19
25
19
30
19
35
19
40
19
45
19
50
19
55
19
60
19
65
19
70
19
75
19
80
19
85
19
90
19
95
20
00
20
05
20
10
20
15
20
20
20
25
20
30
20
35
20
40
20
45
20
50
20
55
20
60
20
65
Cost (£M)
Cost (£M)
Linear (Cost (£M))
+44 (0)1225 820980 www.bmt-hqs.com [email protected] ©BMT Hi-Q Sigma Ltd
Top Down Historical Trend Analysis
Analogy (“It is like one of these”)
Parametric (Pattern backed up by statistics)
Bottom Up Cost Breakdown Structure (CBS) – (could equal PBS?)
Weight Groups – NES 163, Brown Book and ANEP 42
Expert Opinion
Extrapolation (closer to Parametric (at the system level)) For example, the cost electrical wiring for a new school could be
extrapolated from a school that has been built previously based on number of pupils, number of rooms, volume of the school, etc
Cost Model Process
+44 (0)1225 820980 www.bmt-hqs.com [email protected] ©BMT Hi-Q Sigma Ltd
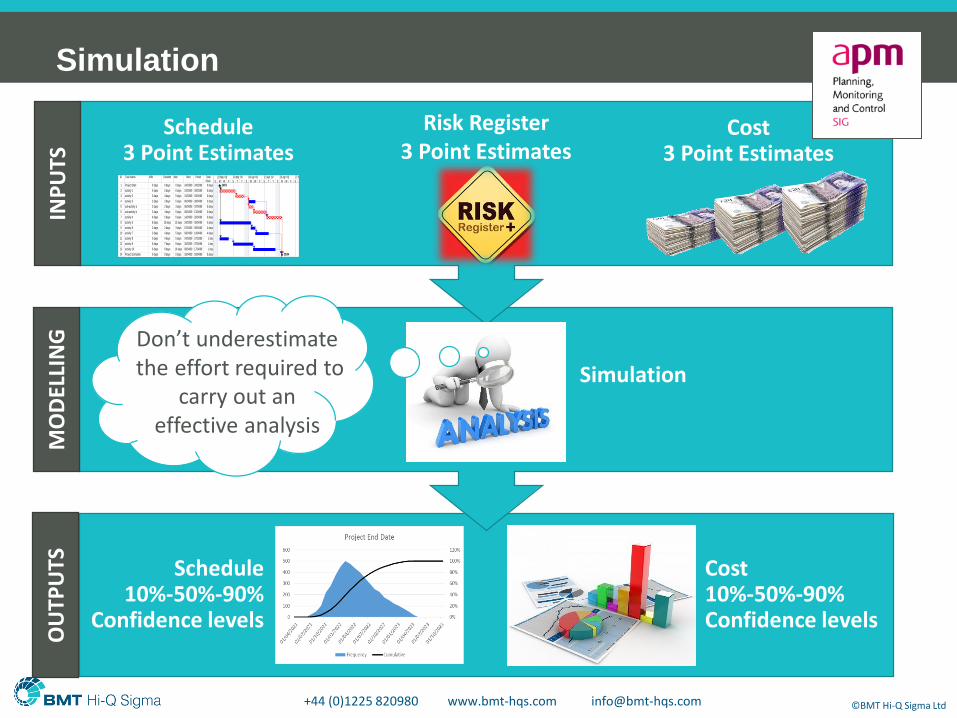
Cost10%-50%-90%Confidence levels
Schedule10%-50%-90%
Confidence levels
Simulation
Schedule3 Point Estimates
Cost3 Point Estimates
Simulation
ID Task Name MIN Duration Max Start Finish TotalSlack
1 Project Start 0 days 0 days 0 days 24/03/09 24/03/09 0 days
2 activity 1 4 days 5 days 6 days 24/03/09 30/03/09 0 days
3 activity 2 3 days 4 days 5 days 31/03/09 03/04/09 0 days
4 activity 3 2 days 3 days 5 days 06/04/09 08/04/09 3 days
5 sub-activity a 2 days 2 days 3 days 06/04/09 07/04/09 0 days
6 sub-activity b 3 days 4 days 6 days 08/04/09 13/04/09 0 days
7 activity 4 4 days 5 days 6 days 14/04/09 20/04/09 0 days
8 activity 5 8 days 10 days 12 days 24/03/09 06/04/09 4 days
9 activity 6 2 days 2 days 3 days 07/04/09 08/04/09 4 days
10 activity 7 3 days 4 days 5 days 09/04/09 14/04/09 4 days
11 activity 8 3 days 4 days 5 days 24/03/09 27/03/09 1 day
12 activity 9 6 days 7 days 8 days 30/03/09 07/04/09 1 day
13 activity 10 6 days 8 days 10 days 08/04/09 17/04/09 1 day
14 Project Complete 0 days 0 days 0 days 20/04/09 20/04/09 0 days
24/03
20/04
S M W F S T T S M W F S T T S M W F S T16 Mar '09 23 Mar '09 30 Mar '09 06 Apr '09 13 Apr '09 20 Apr '09 27 Apr '09
INP
UTS
MO
DEL
LIN
GO
UTP
UTS
Risk Register3 Point Estimates
Don’t underestimate the effort required to
carry out an effective analysis
+44 (0)1225 820980 www.bmt-hqs.com [email protected] ©BMT Hi-Q Sigma Ltd
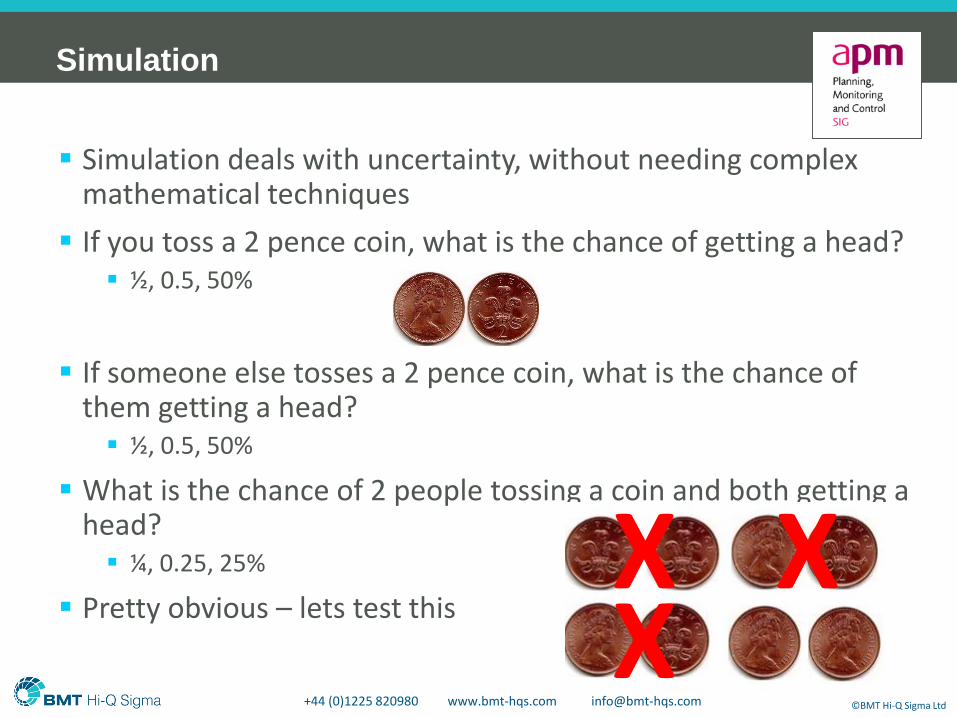
Simulation deals with uncertainty, without needing complex mathematical techniques
If you toss a 2 pence coin, what is the chance of getting a head? ½, 0.5, 50%
If someone else tosses a 2 pence coin, what is the chance of them getting a head? ½, 0.5, 50%
What is the chance of 2 people tossing a coin and both getting a head? ¼, 0.25, 25%
Pretty obvious – lets test this
Simulation
X XX
+44 (0)1225 820980 www.bmt-hqs.com [email protected] ©BMT Hi-Q Sigma Ltd
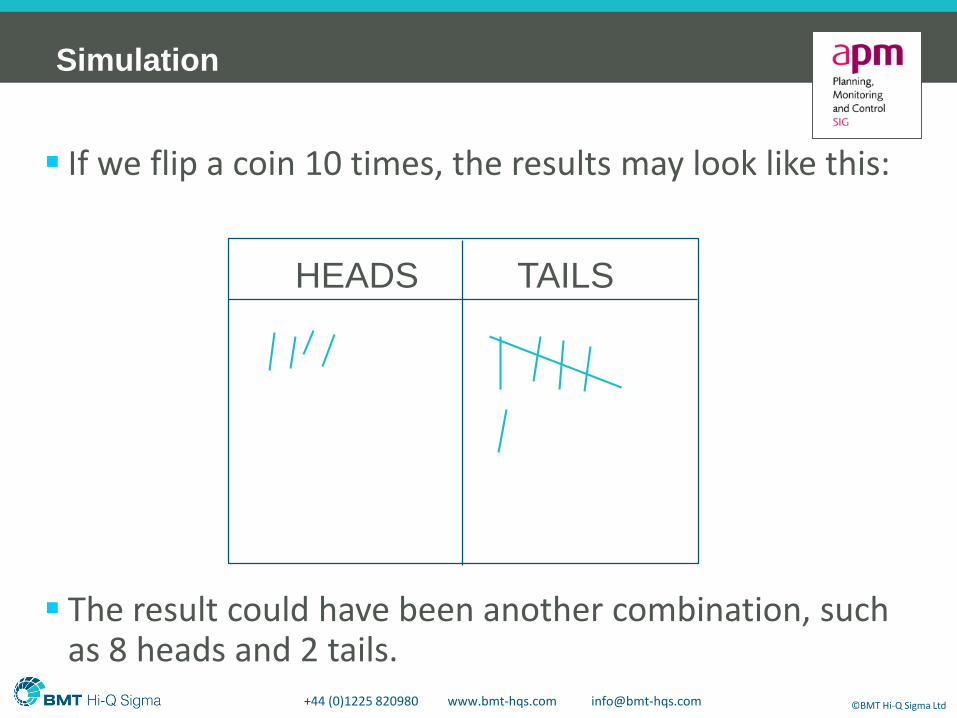
If we flip a coin 10 times, the results may look like this:
TAILSHEADS
Simulation
The result could have been another combination, such as 8 heads and 2 tails.
+44 (0)1225 820980 www.bmt-hqs.com [email protected] ©BMT Hi-Q Sigma Ltd
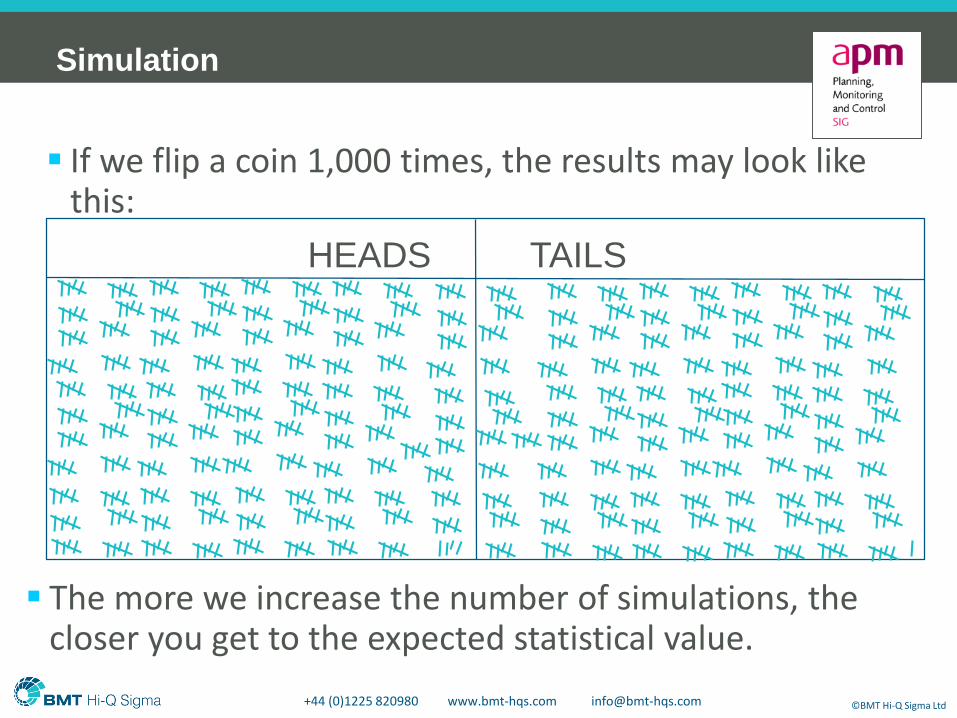
If we flip a coin 1,000 times, the results may look like this:
The more we increase the number of simulations, the closer you get to the expected statistical value.
Simulation
TAILSHEADS
+44 (0)1225 820980 www.bmt-hqs.com [email protected] ©BMT Hi-Q Sigma Ltd
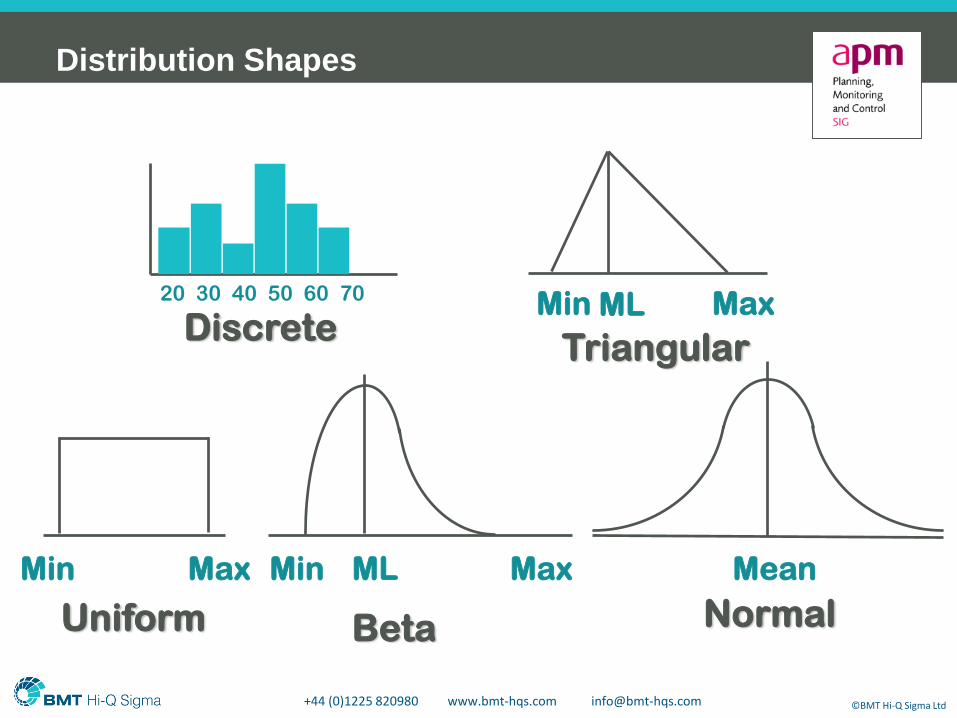
Min Max
Uniform
Min Max
Triangular
ML
Beta
Min MaxML
Discrete20 30 40 50 60 70
Distribution Shapes
Mean
Normal
+44 (0)1225 820980 www.bmt-hqs.com [email protected] ©BMT Hi-Q Sigma Ltd
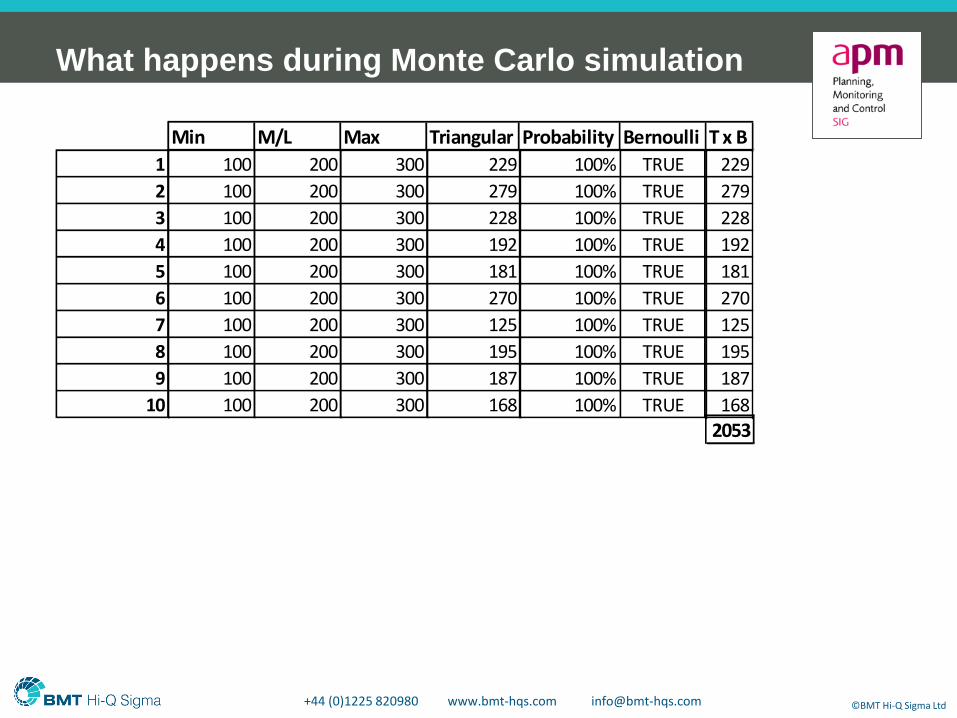
Min M/L Max Triangular Probability Bernoulli T x B
1
2
3
4
5
6
7
8
9
10
200
200
200
200
200
200
200
200
200
200
100
100
100
100
100
100
100
100
100
100
300
300
300
300
300
300
300
300
300
300
229
279
228
192
181
270
125
195
187
168
100% TRUE
100% TRUE
100% TRUE
100% TRUE
100% TRUE
100% TRUE
100% TRUE
100% TRUE
100% TRUE
100% TRUE
229
279
228
192
181
270
125
195
187
168
2053
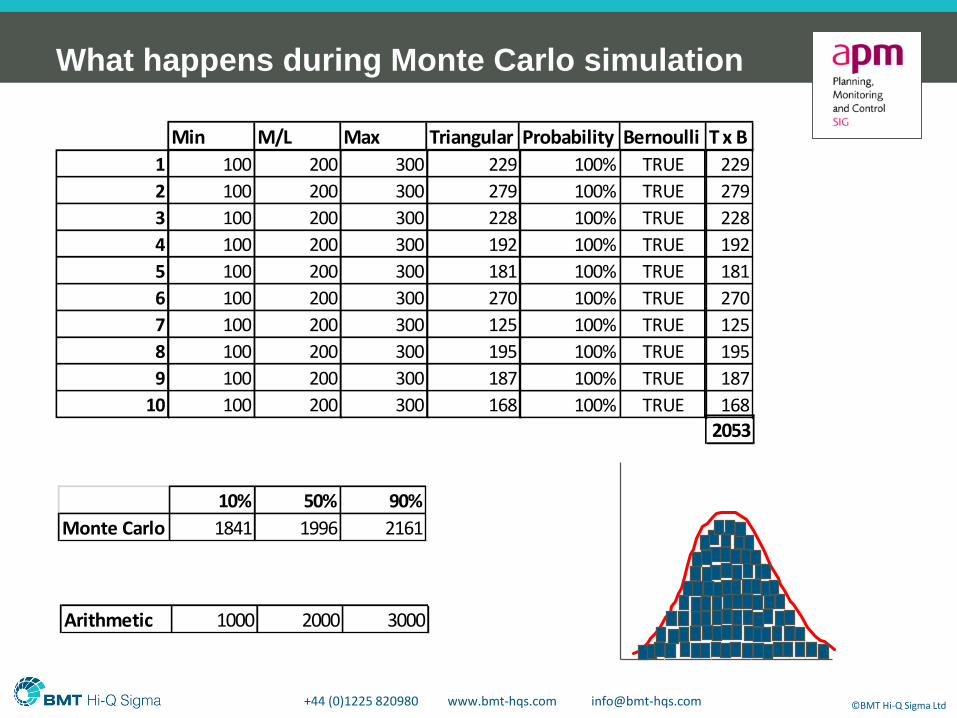
What happens during Monte Carlo simulation
+44 (0)1225 820980 www.bmt-hqs.com [email protected] ©BMT Hi-Q Sigma Ltd
Min M/L Max Triangular Probability Bernoulli T x B
1
2
3
4
5
6
7
8
9
10
200
200
200
200
200
200
200
200
200
200
100
100
100
100
100
100
100
100
100
100
300
300
300
300
300
300
300
300
300
300
229
279
228
192
181
270
125
195
187
168
100% TRUE
100% TRUE
100% TRUE
100% TRUE
100% TRUE
100% TRUE
100% TRUE
100% TRUE
100% TRUE
100% TRUE
229
279
228
192
181
270
125
195
187
168
2053
Arithmetic 1000 2000 3000
10% 50% 90%
Monte Carlo 1841 1996 2161
What happens during Monte Carlo simulation
+44 (0)1225 820980 www.bmt-hqs.com [email protected] ©BMT Hi-Q Sigma Ltd
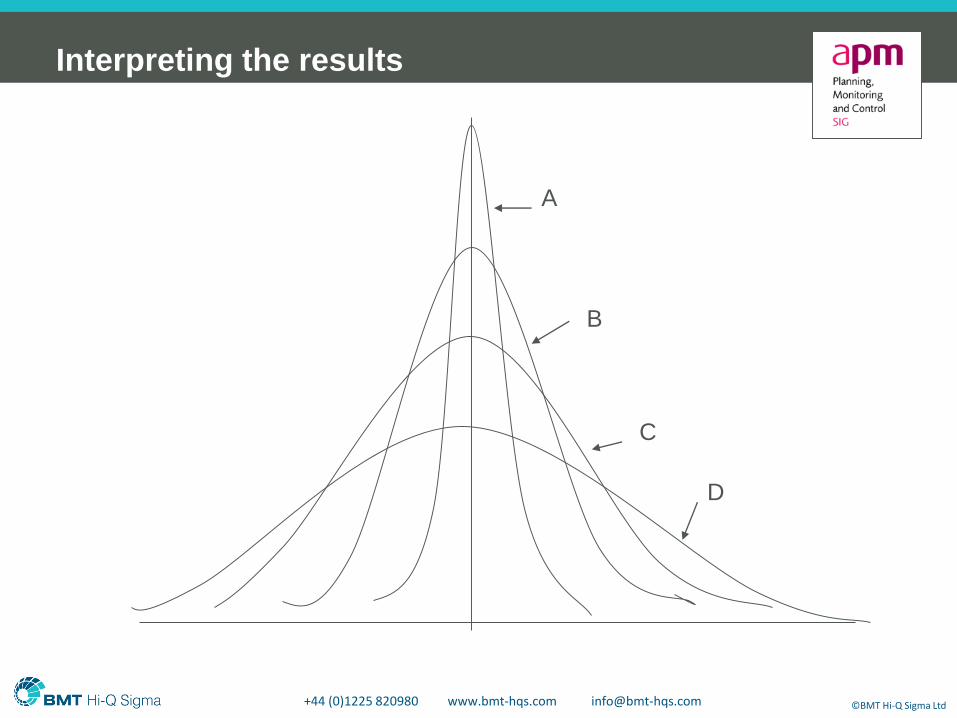
A
B
C
D
Interpreting the results
+44 (0)1225 820980 www.bmt-hqs.com [email protected] ©BMT Hi-Q Sigma Ltd
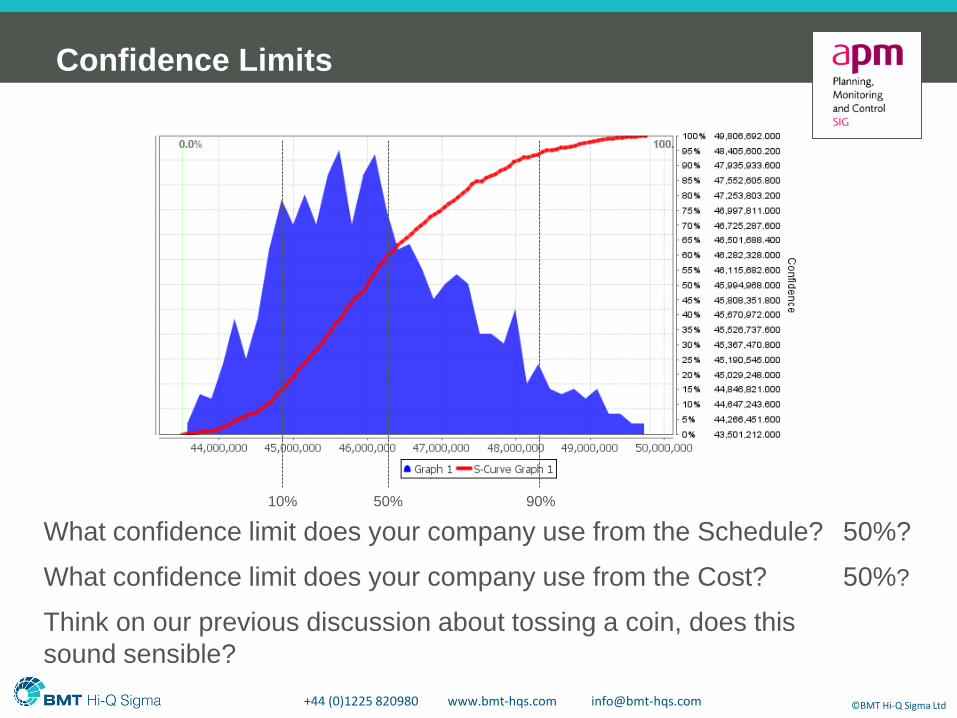
What confidence limit does your company use from the Schedule?
What confidence limit does your company use from the Cost?
50%?
50%?
Think on our previous discussion about tossing a coin, does this
sound sensible?
10% 50% 90%
Confidence Limits
+44 (0)1225 820980 www.bmt-hqs.com [email protected] ©BMT Hi-Q Sigma Ltd
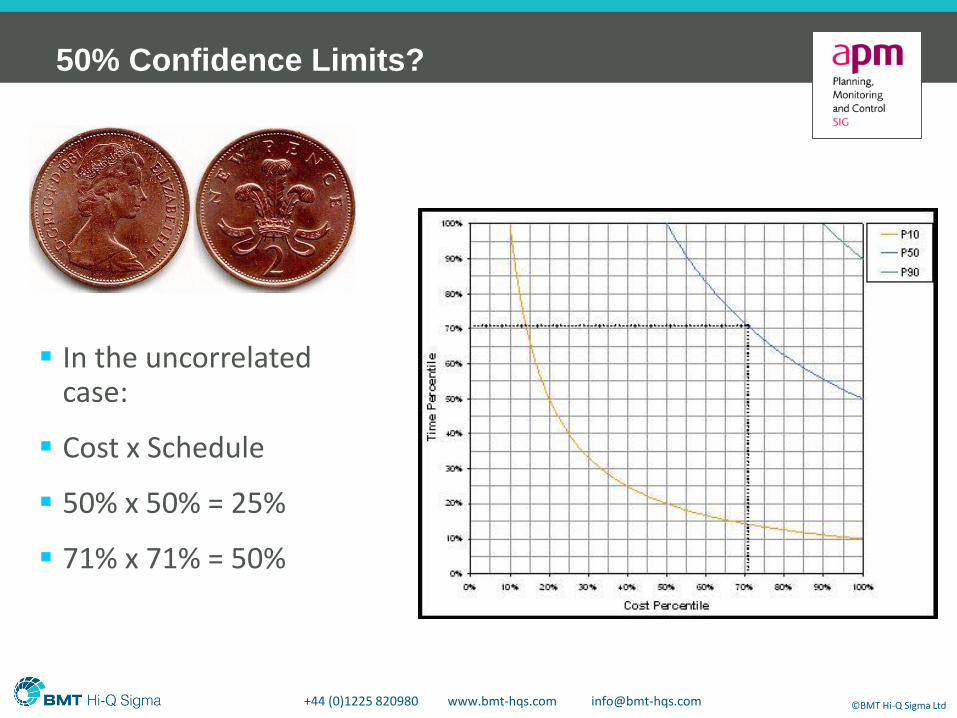
In the uncorrelated case:
Cost x Schedule
50% x 50% = 25%
71% x 71% = 50%
50% Confidence Limits?

+44 (0)1225 820980 www.bmt-hqs.com [email protected] ©BMT Hi-Q Sigma Ltd
In any project there are likely to be tasks that are related to each other. i.e have a measure of correlation
If any two variables are considered to be dependent on each other then they are said to be either positively or negatively correlated.
Positive correlation tends to widen the output distribution.
Negative correlation tends to narrow the output distribution.
Correlation
+44 (0)1225 820980 www.bmt-hqs.com [email protected] ©BMT Hi-Q Sigma Ltd
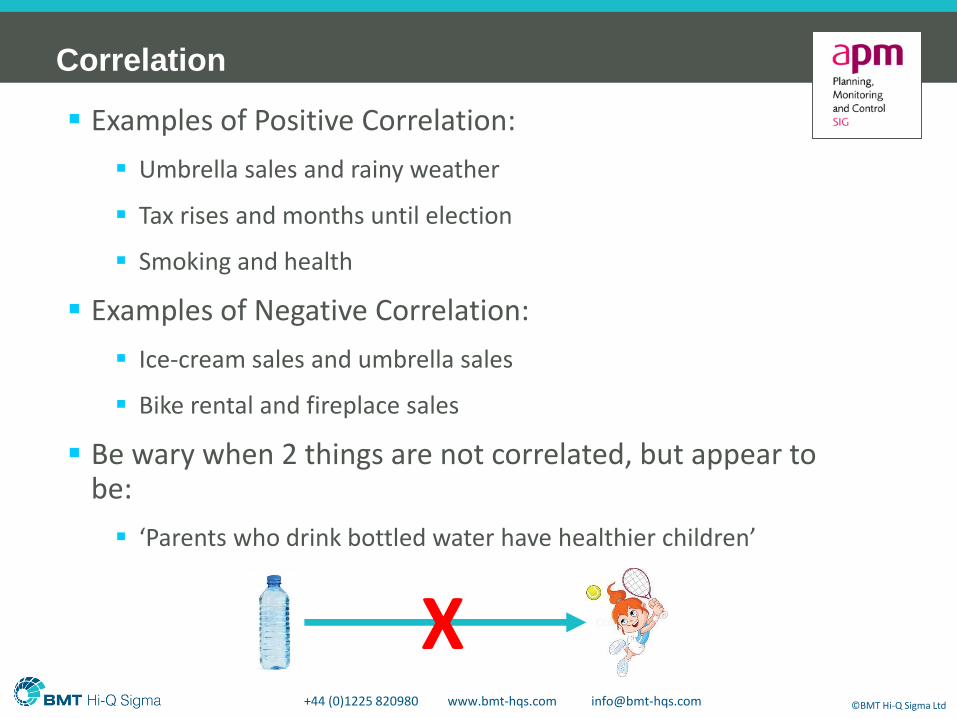
Correlation examples Examples of Positive Correlation:
Umbrella sales and rainy weather
Tax rises and months until election
Smoking and health
Examples of Negative Correlation:
Ice-cream sales and umbrella sales
Bike rental and fireplace sales
Be wary when 2 things are not correlated, but appear to be:
‘Parents who drink bottled water have healthier children’
Correlation
X
+44 (0)1225 820980 www.bmt-hqs.com [email protected] ©BMT Hi-Q Sigma Ltd
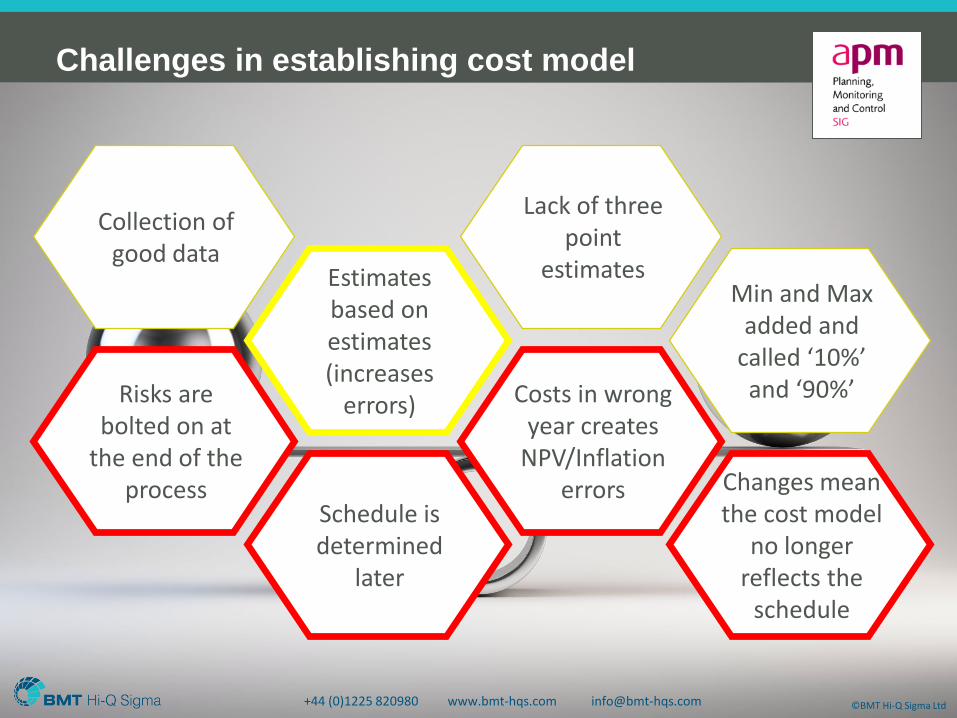
Collection of good data
Risks are bolted on at
the end of the process
Estimates based on estimates (increases
errors)
Schedule is determined
later
Lack of three point
estimates
Costs in wrong year creates
NPV/Inflation errors
Min and Max added and
called ‘10%’ and ‘90%’
Changes mean the cost model
no longer reflects the
schedule
+44 (0)1225 820980 www.bmt-hqs.com [email protected] ©BMT Hi-Q Sigma Ltd
Challenges in establishing cost model
Role of Performance
Measurement Baseline
in the Project Lifecycle
• Characteristics
• Process
• Challenges
• Working against it
+44 (0)1225 820980 www.bmt-hqs.com [email protected] ©BMT Hi-Q Sigma Ltd
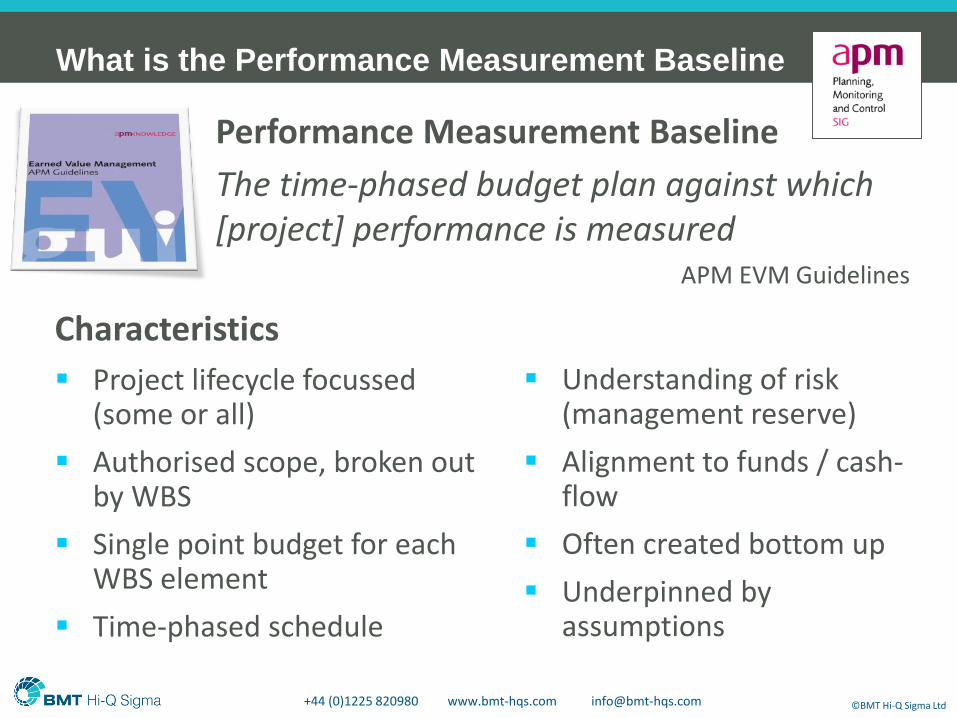
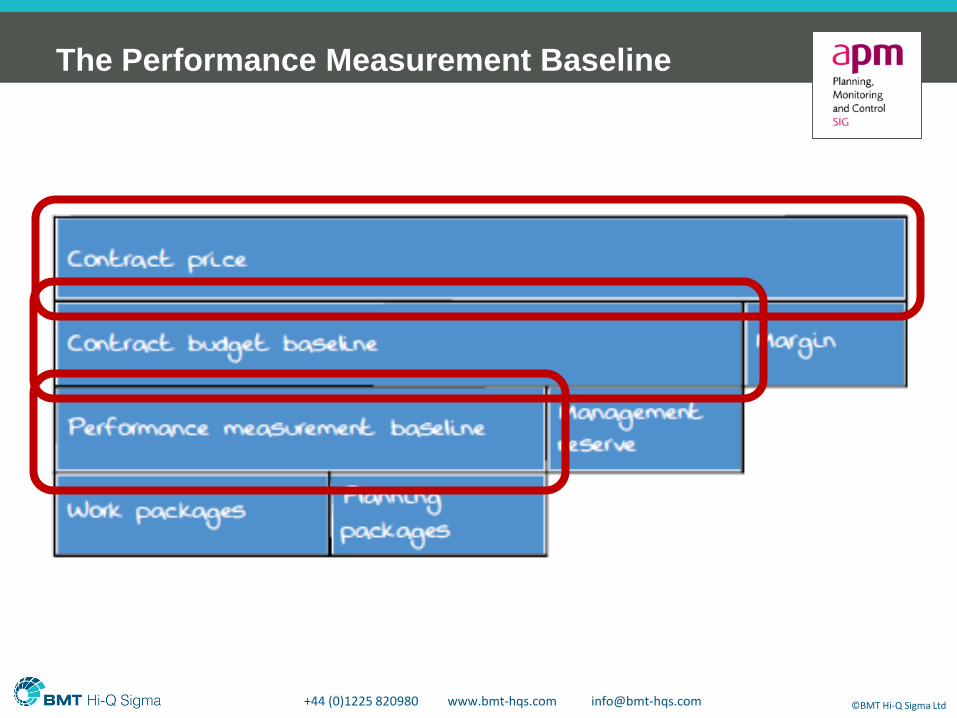
Characteristics
Project lifecycle focussed (some or all)
Authorised scope, broken out by WBS
Single point budget for each WBS element
Time-phased schedule
Performance Measurement Baseline
The time-phased budget plan against which [project] performance is measured
APM EVM Guidelines
What is the Performance Measurement Baseline
Understanding of risk (management reserve)
Alignment to funds / cash-flow
Often created bottom up
Underpinned by assumptions
+44 (0)1225 820980 www.bmt-hqs.com [email protected] ©BMT Hi-Q Sigma Ltd
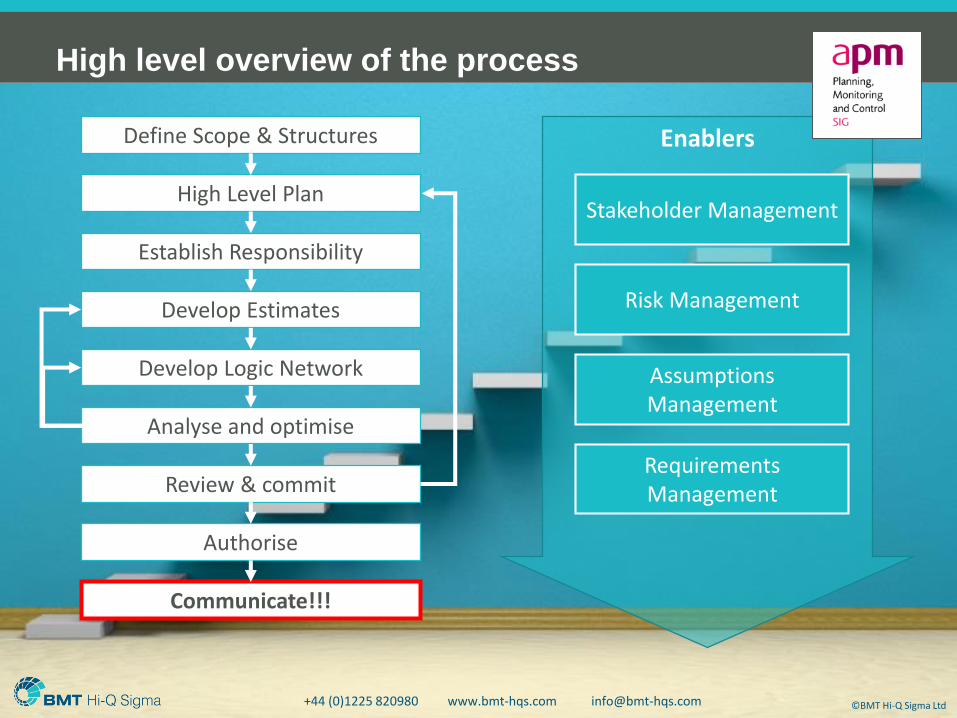
High level overview of the process
Define Scope & Structures
High Level Plan
Establish Responsibility
Develop Estimates
Develop Logic Network
Analyse and optimise
Review & commit
Authorise
Enablers
Communicate!!!
Stakeholder Management
Risk Management
Assumptions Management
Requirements Management
+44 (0)1225 820980 www.bmt-hqs.com [email protected] ©BMT Hi-Q Sigma Ltd
+44 (0)1225 820980 www.bmt-hqs.com [email protected] ©BMT Hi-Q Sigma Ltd
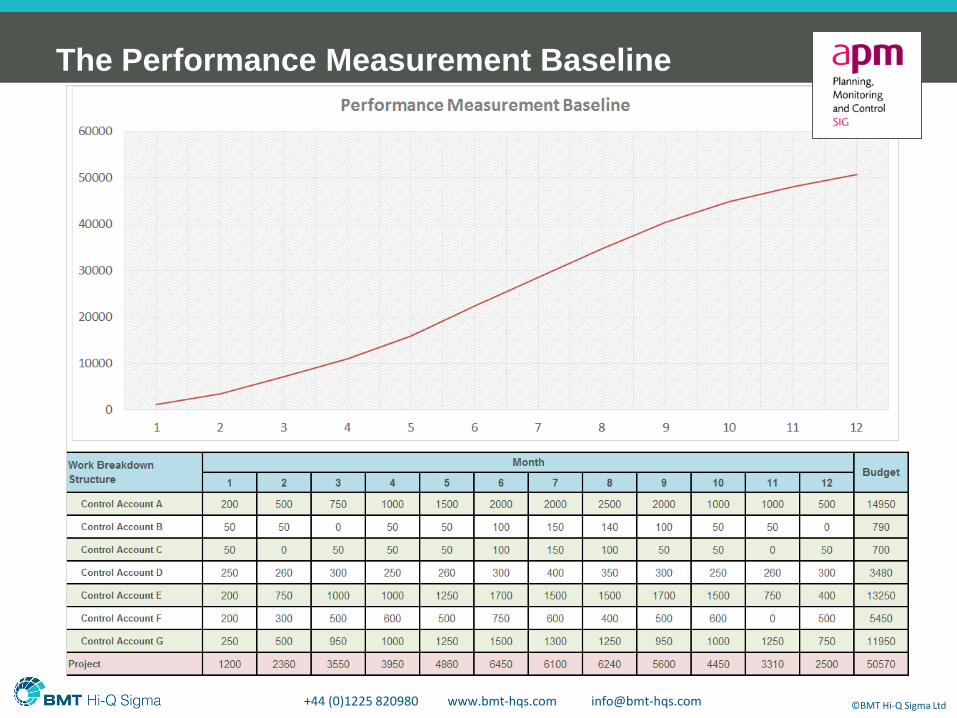
The Performance Measurement Baseline
+44 (0)1225 820980 www.bmt-hqs.com [email protected] ©BMT Hi-Q Sigma Ltd
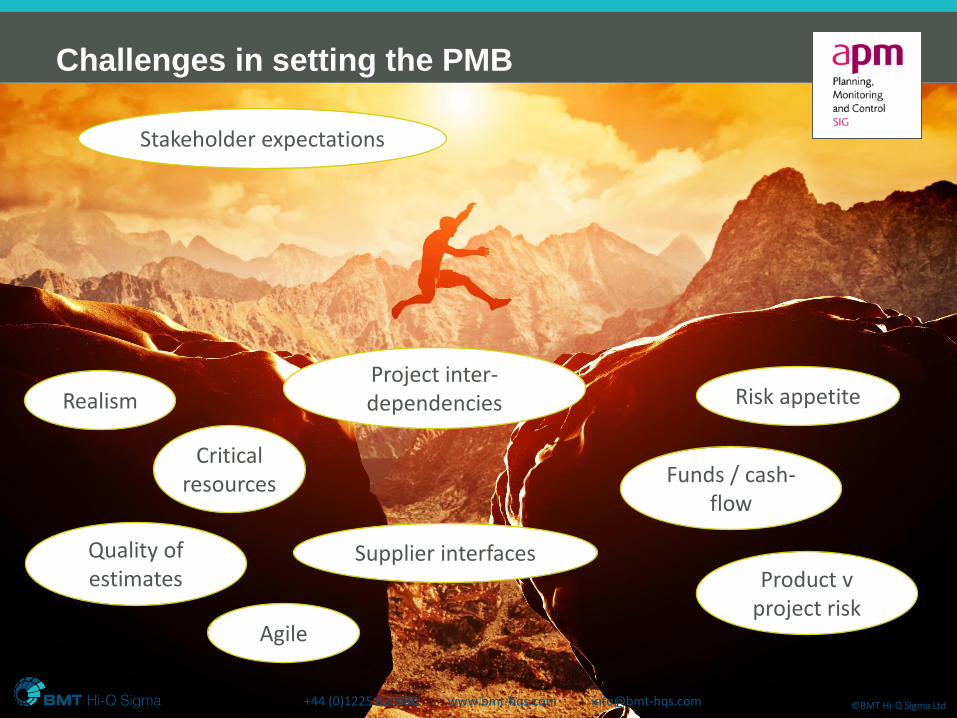
Challenges in setting the PMB
+44 (0)1225 820980 www.bmt-hqs.com [email protected] ©BMT Hi-Q Sigma Ltd
Realism
Critical resources
Stakeholder expectations
Risk appetite
Agile
Funds / cash-flow
Project inter-dependencies
Supplier interfacesProduct v
project risk
Quality of estimates
+44 (0)1225 820980 www.bmt-hqs.com [email protected] ©BMT Hi-Q Sigma Ltd
The Performance Measurement Baseline
+44 (0)1225 820980 www.bmt-hqs.com [email protected] ©BMT Hi-Q Sigma Ltd
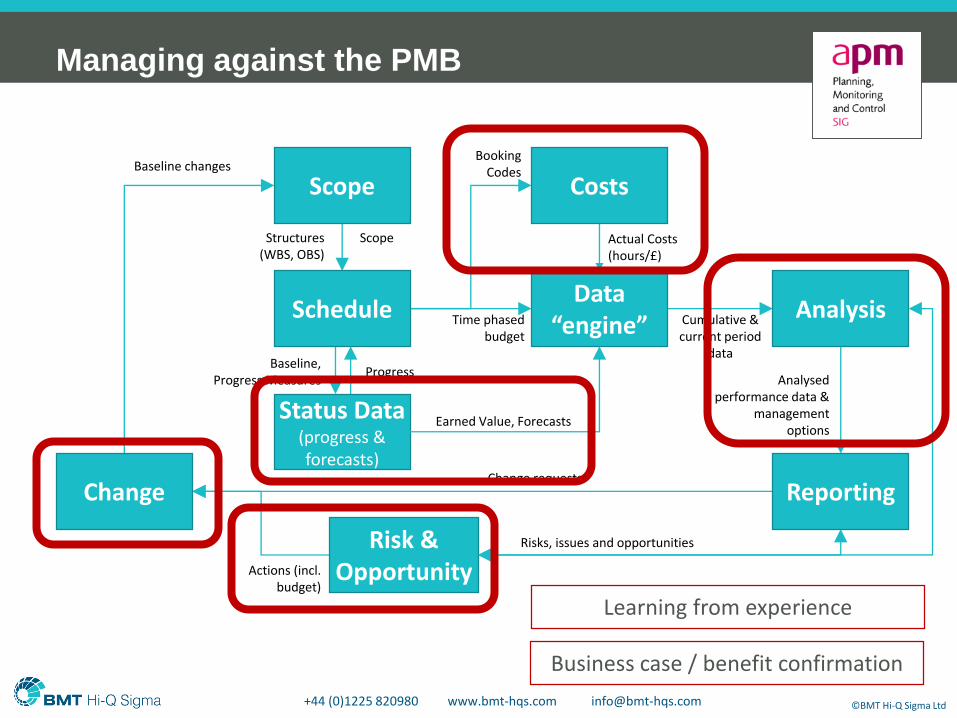
Managing against the PMB
Scope
Schedule
Status Data (progress & forecasts)
Risk & Opportunity
Costs
Data “engine”
Analysis
ReportingChange
Baseline changesBooking
Codes
Structures (WBS, OBS)
Scope
Baseline,Progress Measures
Progress
Time phased budget
Actual Costs (hours/£)
Cumulative & current period
data
Analysed performance data &
management options
Change requests
Risks, issues and opportunities
Actions (incl. budget)
Earned Value, Forecasts
Learning from experience
Business case / benefit confirmation
+44 (0)1225 820980 www.bmt-hqs.com [email protected] ©BMT Hi-Q Sigma Ltd
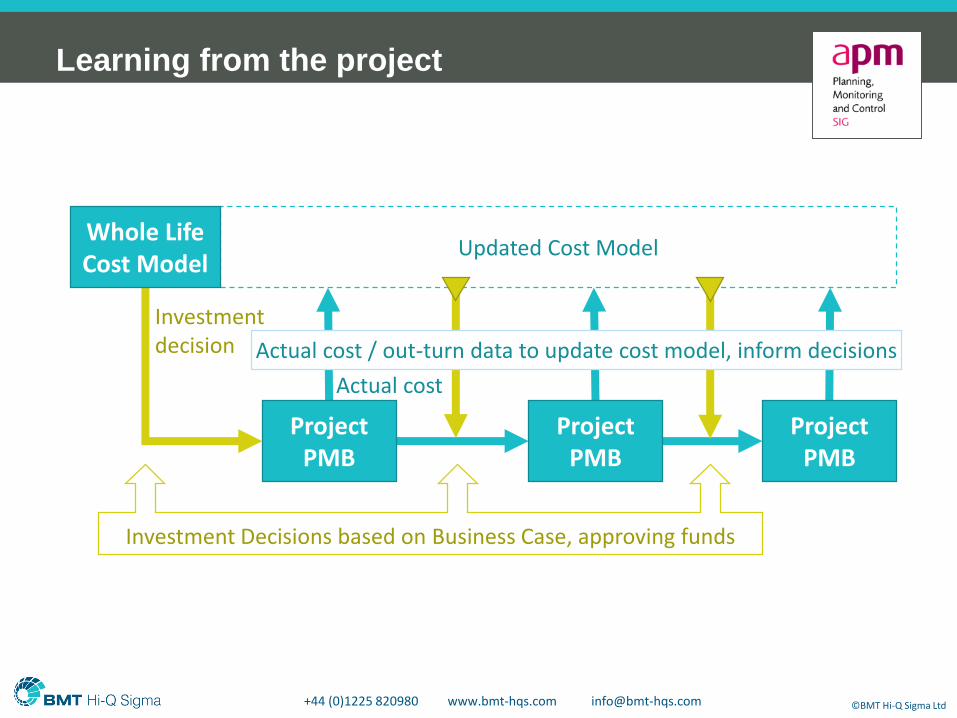
Learning from the project
Updated Cost Model
Investment decision
Project PMB
Whole Life Cost Model
Project PMB
Project PMB
Actual cost / out-turn data to update cost model, inform decisions
Investment Decisions based on Business Case, approving funds
Actual cost

Bringing it together
• Benefits
• Considerations
+44 (0)1225 820980 www.bmt-hqs.com [email protected] ©BMT Hi-Q Sigma Ltd
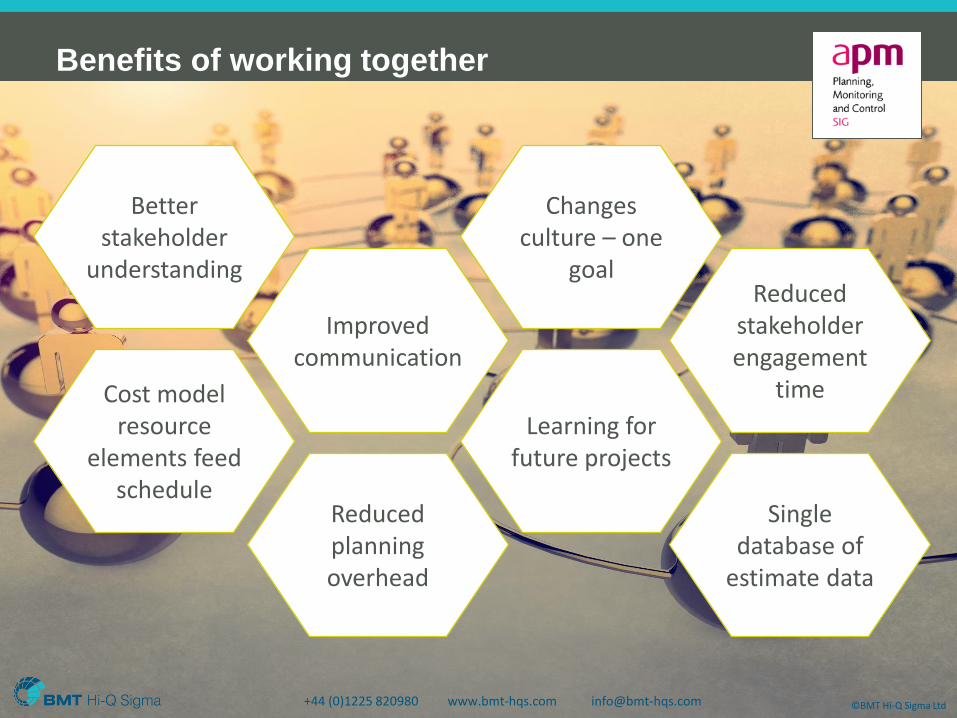
Better stakeholder
understanding
Cost model resource
elements feed schedule
Improved communication
Reduced planning overhead
Changes culture – one
goal
Learning for future projects
Reduced stakeholder engagement
time
Single database of
estimate data
+44 (0)1225 820980 www.bmt-hqs.com [email protected] ©BMT Hi-Q Sigma Ltd
Benefits of working together
+44 (0)1225 820980 www.bmt-hqs.com [email protected] ©BMT Hi-Q Sigma Ltd
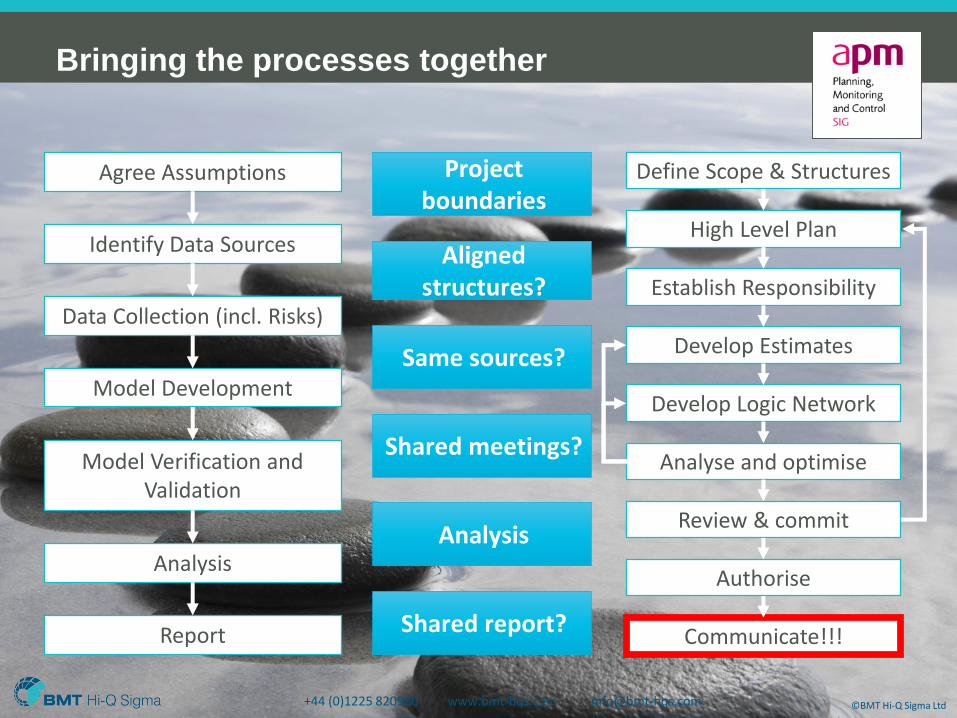
Bringing the processes together
Project boundaries
Same sources?
Shared meetings?
Analysis
Shared report?
Define Scope & Structures
High Level Plan
Establish Responsibility
Develop Estimates
Develop Logic Network
Analyse and optimise
Review & commit
Authorise
Communicate!!!
Agree Assumptions
Identify Data Sources
Data Collection (incl. Risks)
Model Development
Model Verification and Validation
Report
Analysis
Aligned structures?
+44 (0)1225 820980 www.bmt-hqs.com [email protected] ©BMT Hi-Q Sigma Ltd
+44 (0)1225 820980 www.bmt-hqs.com [email protected] ©BMT Hi-Q Sigma Ltd
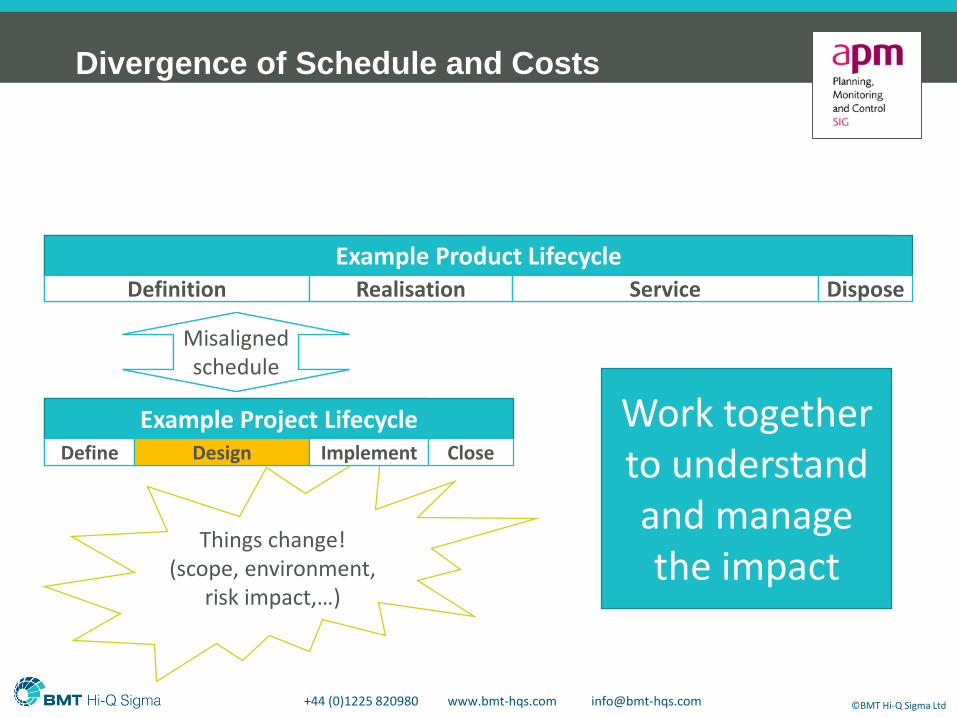
Things change! (scope, environment,
risk impact,…)
Divergence of Schedule and Costs
Example Product LifecycleDefinition Realisation Service Dispose
Example Project LifecycleDefine Design Implement Close
Aligned schedule
Example Project LifecycleDefine Design Implement Close
Misaligned schedule
Work together to understand and manage the impact
Example Product LifecycleDefinition Realisation Service Dispose
+44 (0)1225 820980 www.bmt-hqs.com [email protected] ©BMT Hi-Q Sigma Ltd
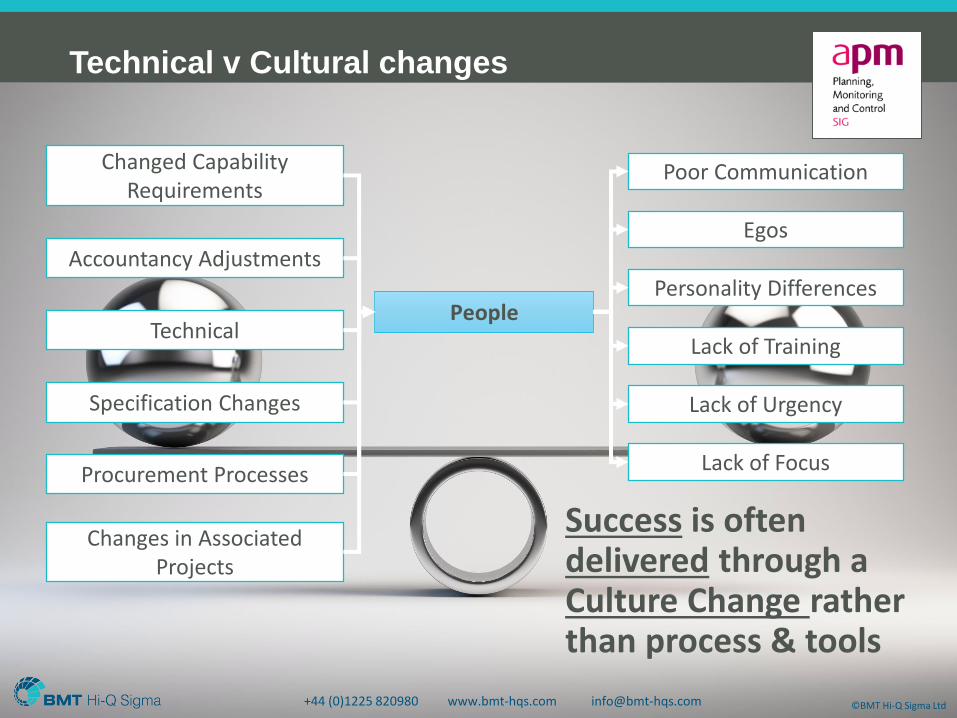
People
Poor Communication
Egos
Personality Differences
Lack of Training
Lack of Urgency
Lack of Focus
Changed Capability Requirements
Accountancy Adjustments
Technical
Specification Changes
Changes in Associated Projects
Procurement Processes
+44 (0)1225 820980 www.bmt-hqs.com [email protected] ©BMT Hi-Q Sigma Ltd
Success is often delivered through a Culture Change rather than process & tools
Technical v Cultural changes
+44 (0)1225 820980 www.bmt-hqs.com [email protected] ©BMT Hi-Q Sigma Ltd
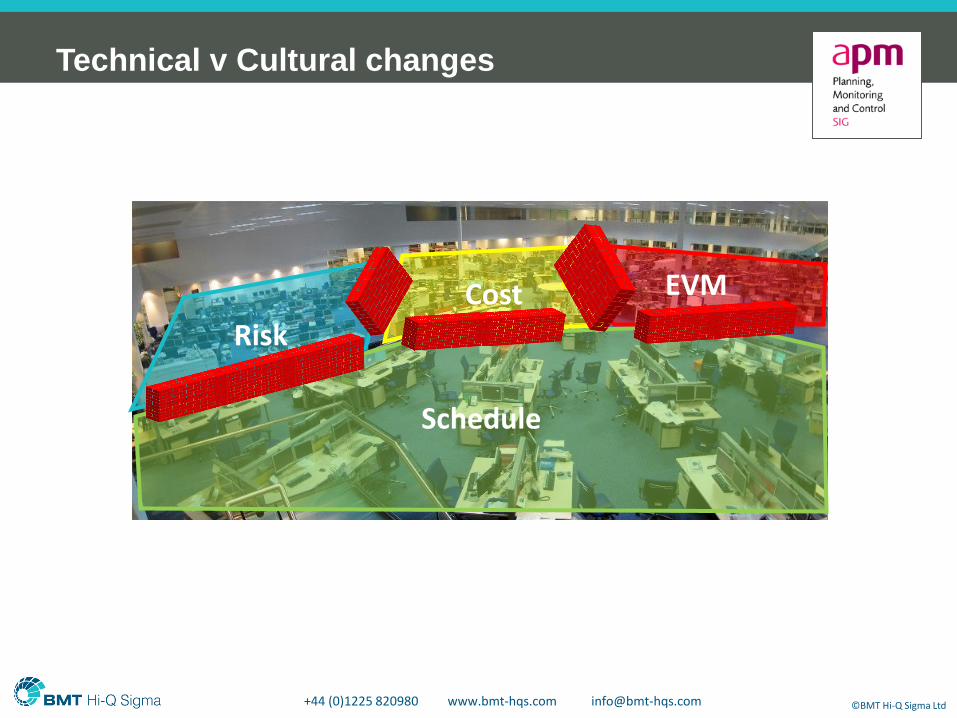
Technical v Cultural changes
Risk
Schedule
EVMCost
+44 (0)1225 820980 www.bmt-hqs.com [email protected] ©BMT Hi-Q Sigma Ltd
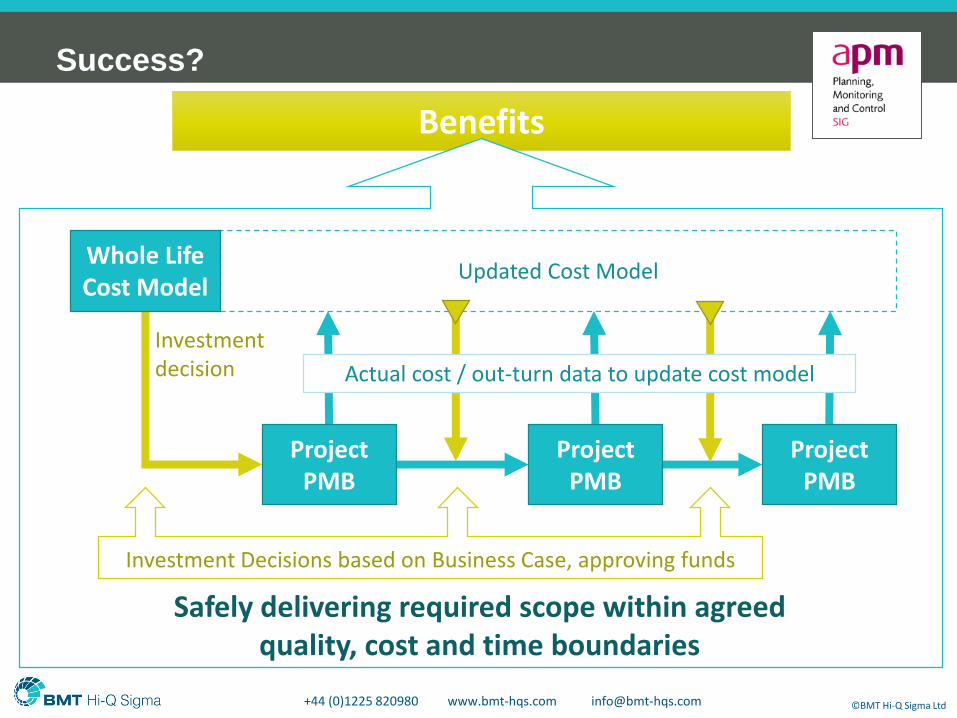
Benefits
Safely delivering required scope within agreed quality, cost and time boundaries
Success?
Updated Cost Model
Investment decision
Project PMB
Whole Life Cost Model
Project PMB
Project PMB
Actual cost / out-turn data to update cost model
Investment Decisions based on Business Case, approving funds
+44 (0)1225 820980 www.bmt-hqs.com [email protected] ©BMT Hi-Q Sigma Ltd
Context Relationship between Product and Project Lifecycle
Role of the Cost Model in the Product Lifecycle Characteristics, process, challenges
Role of Performance Measurement Baseline in the Project Lifecycle Characteristics, process, challenges
Bringing it together Benefits
Making it stick
Summary

Thank you
+44 (0)1225 820980 www.bmt-hqs.com [email protected] ©BMT Hi-Q Sigma Ltd
BMT Hi-Q Sigma LtdBerkeley House, The SquareLower Bristol RoadBath, BA2 3BHUnited Kingdom
www.bmt-hqs.com
Tel: +44 (0) 1225 820980Fax: +44 (0) 1225 820981Mob: +44 (0)
BMT Hi-Q Sigma LtdBerkeley House, The SquareLower Bristol RoadBath, BA2 3BHUnited Kingdom
www.bmt-hqs.com
Tel: +44 (0) 1225 820980Fax: +44 (0) 1225 820981Mob: +44 (0)
Ewan Glen, Capability Manager Dr Paul Wood, Portfolio Manager
[email protected] [email protected]
7747 011703 7786 731166
Questions?