Embed Size (px)
Citation preview


LuAnn, S., J. Walter and D. Antosh. (2007) Dieting behaviors of young women post-college graduation. College Student Journal 41:4.
Make fear and greed work for youWall Street constantly swings between these two emotions. You can either get caught in the frenzy - or profit from it.By Janice Revell, Money Magazine senior writerLast Updated: July 21, 2009: 10:56 AM ET
“Making matters worse, the big stock bet would be far riskier on a year-to-year basis than other strategies. The most common measure of portfolio risk is standard deviation, which tells you how much an investment's short-term returns bounce around its long-term average. Since 1926 stocks have returned average gains of 9.6% a year, with a standard deviation of 21.5 percentage points, according to Ibbotson Associates. That means that about two-thirds of the time, the annual return on stocks landed 21.5 percentage points below or above the average - that is, in any given year, your results would range from a 12% loss to a 31% gain. You'd need either an iron stomach or a steady supply of Zantac to stay the course. And if you happened to be at or near retirement when one of those really bad years hit, you might have to rethink your plans.”
http://money.cnn.com/2009/07/20/pf/funds/fear_greed.moneymag/

Explain how z-scores provide a description of a location in a distribution
Transform an X score into a z-score
Transform z-scores back into X scores, when the mean and standard
deviation are given.
Use z-scores to make comparisons across variables and individuals.
Describe the effects when an entire data set is standardized by
transforming all the scores to z-scores, including the impact on the shape,
mean and standard deviation, and its comparability to other standardized
distributions.
Use z-scores to transform a distribution into a standardized distribution.
Use SPSS to create standardized scores for a distribution.


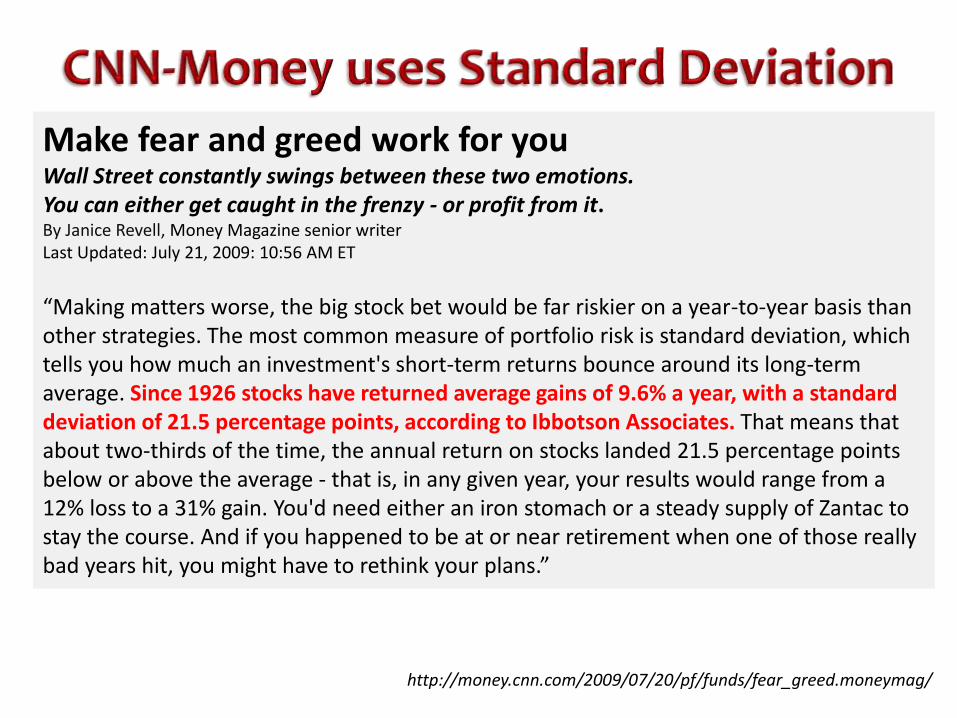
Exact location is described by z-score
• Sign tells whether score is located
above or below the mean
• Number tells distance between score
and mean in standard deviation units

64 67 70 73 7646 58 70 82 94

Learning Check
• A z-score of z = +1.00 indicates a position
in a distribution ____
• Above the mean by 1 pointA
• Above the mean by a distance equal to 1 standard deviationB
• Below the mean by 1 pointC
• Below the mean by a distance equal to 1 standard deviation D
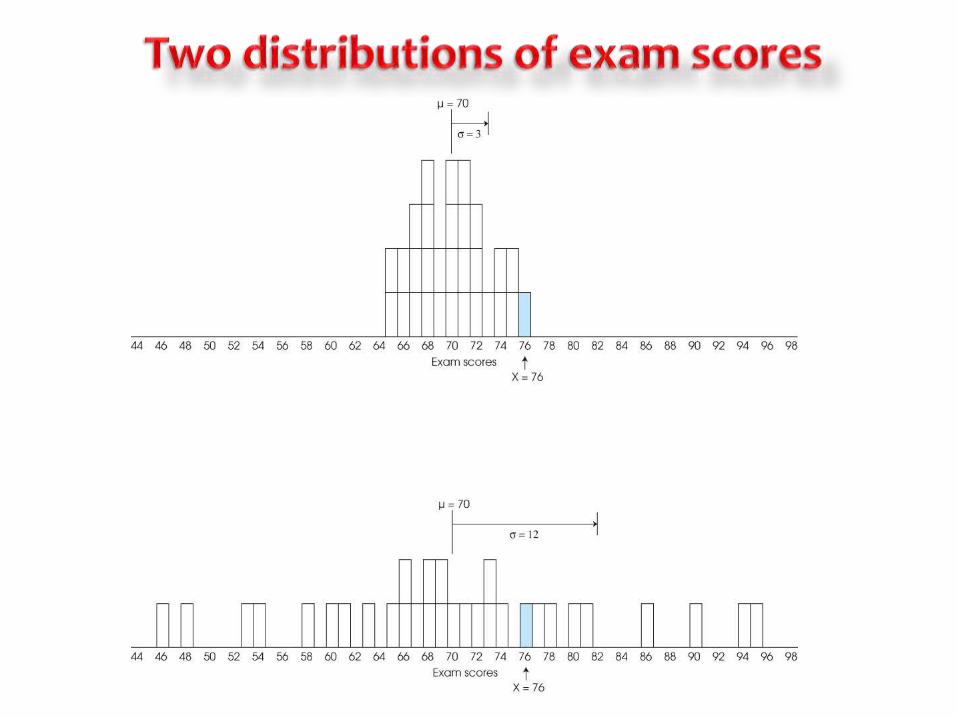
Learning Check - Answer
• A z-score of z = +1.00 indicates a position
in a distribution ____
• Above the mean by 1 pointA
• Above the mean by a distance equal to 1 standard deviationB
• Below the mean by 1 pointC
• Below the mean by a distance equal to 1 standard deviation D

Learning Check
• Decide if each of the following statements
is True or False.
• A negative z-score always indicates a location below the meanT/F
• A score close to the mean has a z-score close to 1.00T/F

Answer
• Sign indicates that score is below the meanTrue
• Scores close to 0 have z-scores close to 0.00
False


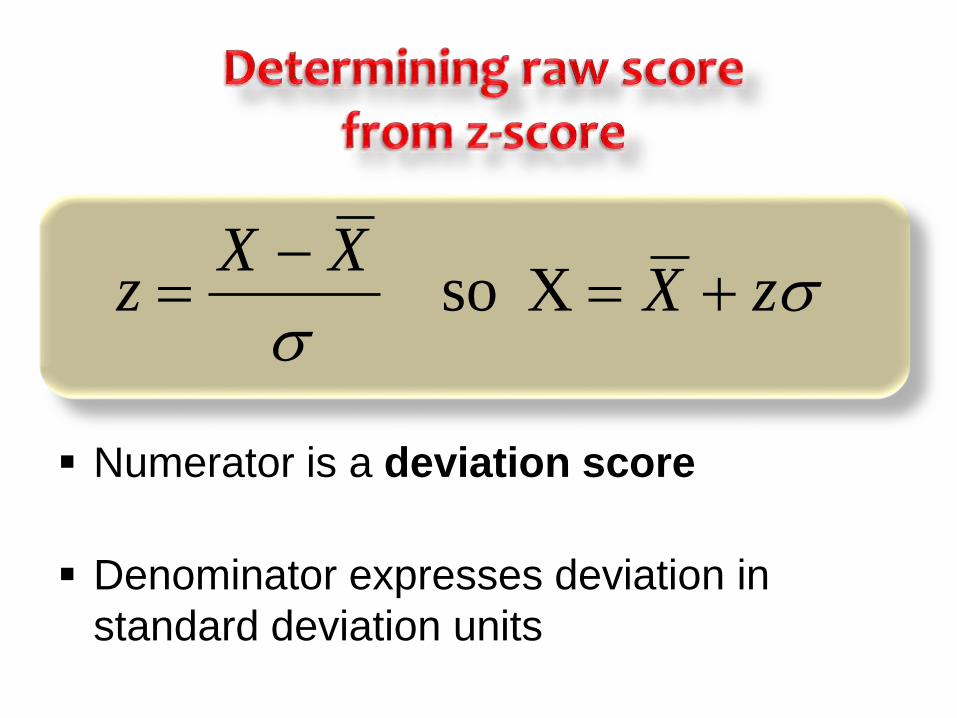
Numerator is a deviation score
Denominator expresses deviation in
standard deviation units
XXz
Numerator is a deviation score
Denominator expresses deviation in
standard deviation units
zXXX
z
X so

Learning Check
• For a population with μ = 50 and σ = 10,
what is the X value corresponding to
z=0.4?
• 50.4A
• 10B
• 54C
• 10.4D

Learning Check - Answer
• For a population with μ = 50 and σ = 10,
what is the X value corresponding to
z=0.4?
• 50.4A
• 10B
• 54C
• 10.4D

Learning Check
• Decide if each of the following statements
is True or False.
• If μ = 40 and X = 50 corresponds to z=+2.00, then σ = 5 pointsT/F
• If σ = 20, a score above the mean by 10 points will have z = 1.00T/F

Answer
• If 2σ = 10 then σ = 5 True
• Why?False

All z-scores are comparable to each other
Scores from different distributions can be
converted to z-scores
The z-scores (standardized scores) allow
the comparison of scores from two
different distributions along

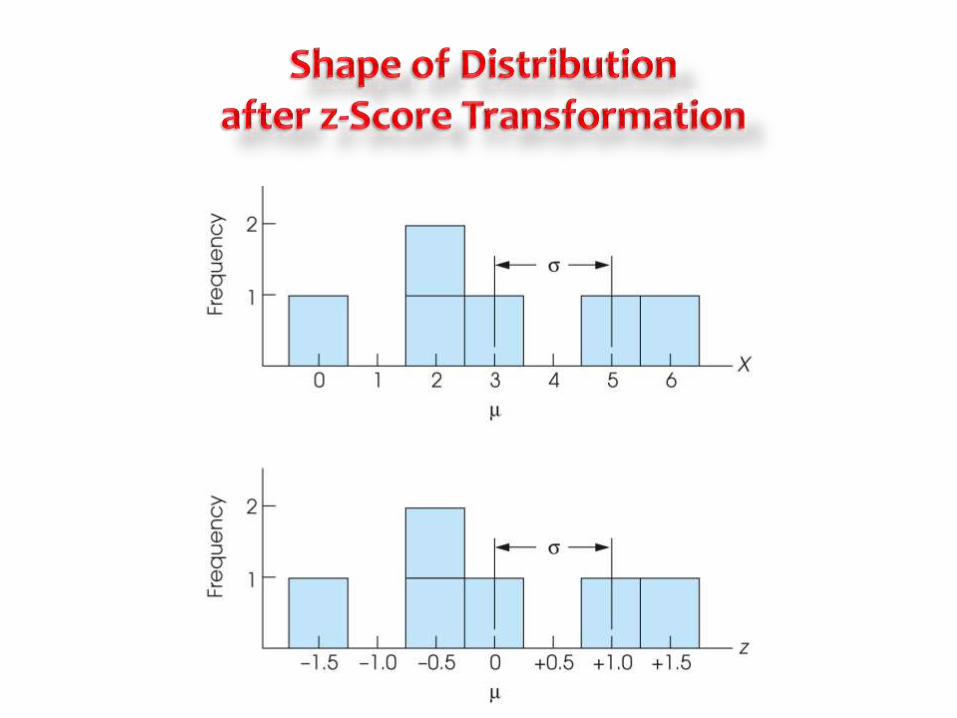
• Every X value can be transformed to a z-score
• Characteristics of z-score transformation– Same shape as original distribution
– Mean of z-score distribution is always 0.
– Standard deviation is always 1.00
• A z-score distribution is called a standardized distribution


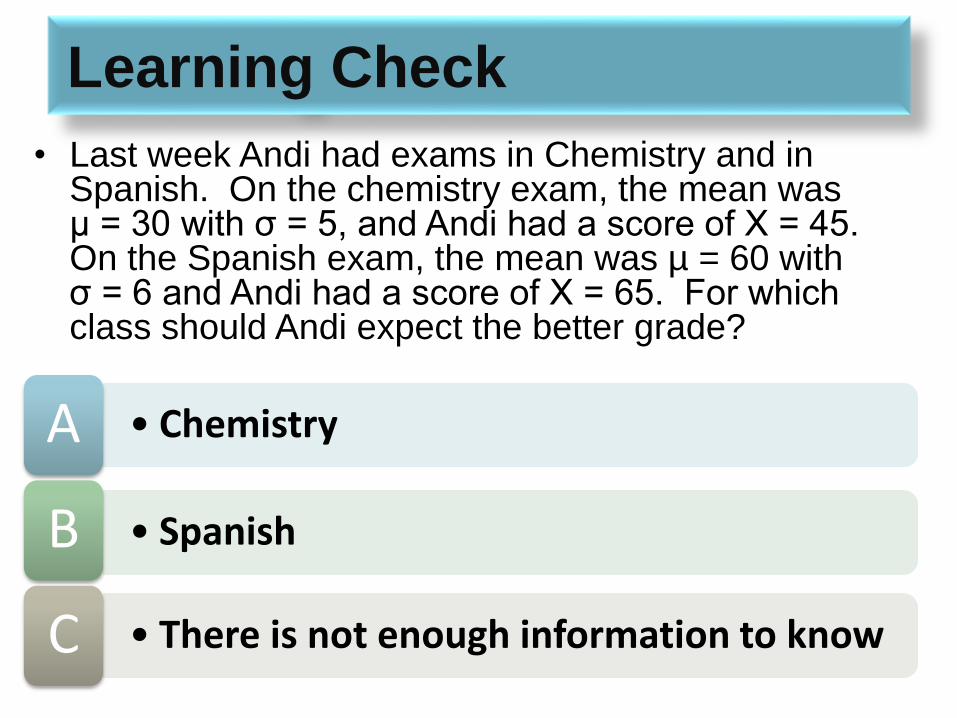
Learning Check
• Last week Andi had exams in Chemistry and in Spanish. On the chemistry exam, the mean was µ = 30 with σ = 5, and Andi had a score of X = 45. On the Spanish exam, the mean was µ = 60 with σ = 6 and Andi had a score of X = 65. For which class should Andi expect the better grade?
• ChemistryA
• SpanishB
• There is not enough information to knowC

Learning Check - Answer
• Last week Andi had exams in Chemistry and in Spanish. On the chemistry exam, the mean was µ = 30 with σ = 5, and Andi had a score of X = 45. On the Spanish exam, the mean was µ = 60 with σ = 6 and Andi had a score of X = 65. For which class should Andi expect the better grade?
• ChemistryA
• SpanishB
• There is not enough information to knowC
Concepts
Equations
Interpretation
All z-scores are comparable to each other
Scores from different distributions can be
converted to z-scores
The z-scores (standardized scores) allow
the comparison of scores from two
different distributions along

Process of standardization is widely used
• SAT has Mean = 500 and σ = 100
• IQ has Mean = 100 and σ = 15 Point
Standardizing a distribution has two steps
• Original raw scores transformed to z-scores
• The z-scores are transformed to new X values
so that the specific μ and σ are attained.

This form of standardized score, withM = 50 and = 10, is known as a T-score.

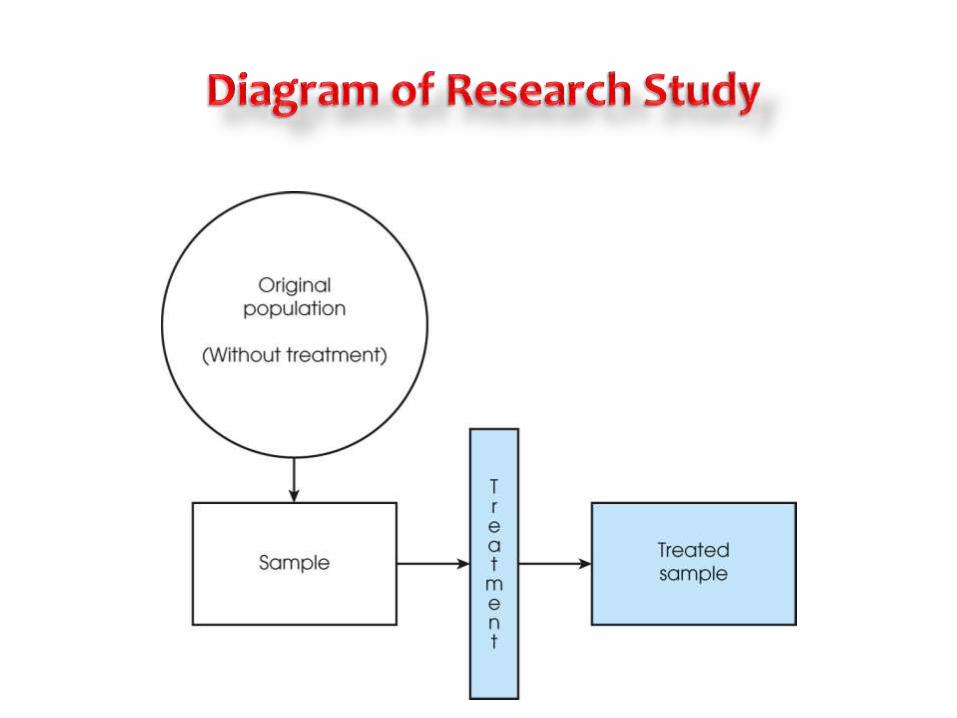
Interpretation of research results depends
on determining if (treated) sample is
noticeably different from the population
One technique for defining noticeably
different uses z-scores.

Learning Check
• Last week Andi had exams in Chemistry and in Spanish. On the chemistry exam, the mean was µ = 30 with σ = 5, and Andi had a score of X = 45. On the Spanish exam, the mean was µ = 60 with σ = 6 and Andi had a score of X = 65. For which class should Andi expect the better grade?
• ChemistryA
• SpanishB
• There is not enough information to knowC

Learning Check - Answer
• Last week Andi had exams in Chemistry and in Spanish. On the chemistry exam, the mean was µ = 30 with σ = 5, and Andi had a score of X = 45. On the Spanish exam, the mean was µ = 60 with σ = 6 and Andi had a score of X = 65. For which class should Andi expect the better grade?
• ChemistryA
• SpanishB
• There is not enough information to knowC
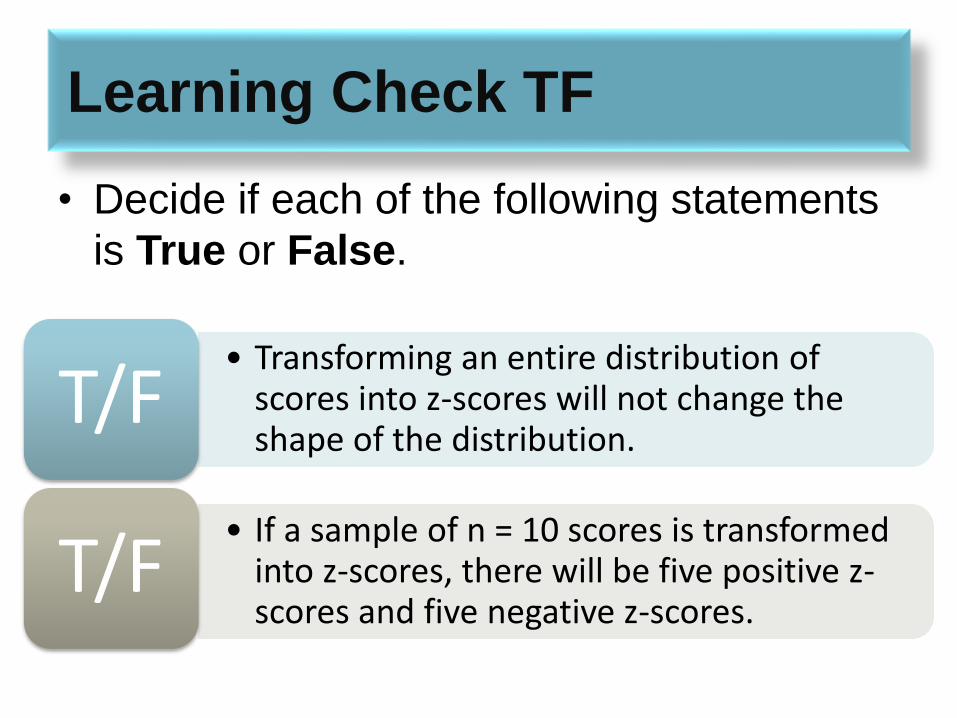
Learning Check TF
• Decide if each of the following statements
is True or False.
• Transforming an entire distribution of scores into z-scores will not change the shape of the distribution.
T/F
• If a sample of n = 10 scores is transformed into z-scores, there will be five positive z-scores and five negative z-scores.
T/F

Concepts
Equations
Interpretation