Embed Size (px)
Citation preview

#LKIN17@sudiptal
Damn… we missed the date, again!SUDIPTA LAHIRI
HEAD OF PRODUCTS, DIGITÉ
1

#LKIN17@sudiptal
Agile/Lean Practitioner and Student
Head of Products @ Digité
ex-Head of Engineering and Professional Services @ Digité
Development of SwiftKanban, SwiftALM products
Organize the LimitedWIP Societies in India
Sudipta Lahiri (Sudi)2.5+ decades in the industry
2

#LKIN17@sudiptal
Let us do a quick poll…
All those who have not missed a project deadline, please sit
All those have not missed the same project deadlines more than once… please sit
All those have not missed the same project deadlines more than twice... please sit
All those have not missed the same project deadlines more than thrice… please sit
3
#LKIN17@sudiptal
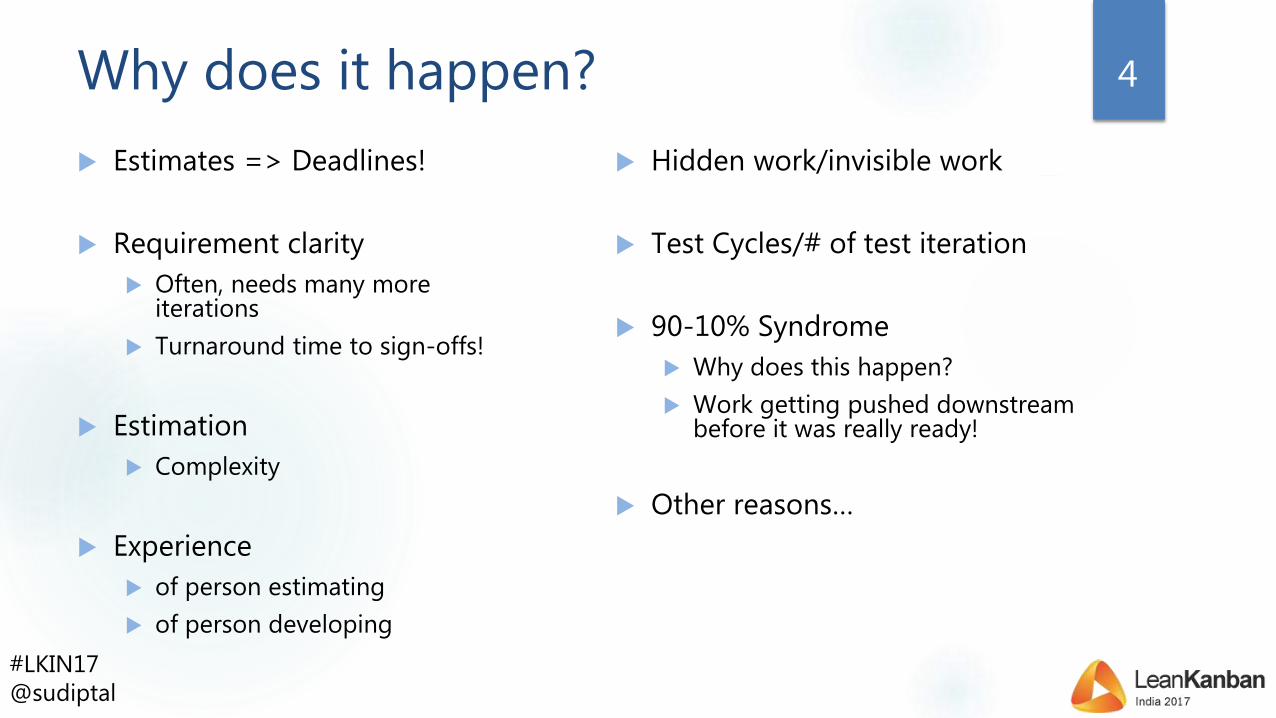
Why does it happen?
Estimates => Deadlines!
Requirement clarity
Often, needs many more iterations
Turnaround time to sign-offs!
Estimation
Complexity
Experience
of person estimating
of person developing
Hidden work/invisible work
Test Cycles/# of test iteration
90-10% Syndrome
Why does this happen?
Work getting pushed downstream before it was really ready!
Other reasons…
4

#LKIN17@sudiptal
What do we estimate?
Customers want to know by when something will get done
We estimate how long its going to take…
… and then we match the two…
… but they don’t match!
5

#LKIN17@sudiptal
What’s our typical reaction to this?
Wish we had planned more!
Wish we had spent more time in estimation!
Wish we had more detailed requirements OR
we had designed in greater detail
Wish we had…
6

#LKIN17@sudiptal
… and that is where the problem starts!
7

#LKIN17@sudiptal
Why?
The time that a work item takes to get completed is only “LITTLE” influenced by its real effort!
SURPRISED…?
You Bet!
For the last 50-60 years, we have spent countless hours in trying to estimate how much effort the work item takes…
It’s a classic waste/non-value add (in lean language)!
8

#LKIN17@sudiptal
Let understand this more…
Any value delivery is a combination of value added steps, mixed with non-value steps in between
9

#LKIN17@sudiptal
Introducing Flow Efficiency
10

#LKIN17@sudiptal
FF
FFF
F F
Defining Customer Lead Time
UAT
E
I
DevReady
DeliveryReady
G
D
5∞
Pull
Ongoing
Development Testing
Done3 3
TestReady
5 ∞
Customer Lead Time
Discarded
J
Poolof
Ideas
Done
∞
Frequency of batch transfers needs to be calculated and
added to kanban system lead time to calculate customer lead
time
Frequency of batch transfers needs to be calculated and
added to kanban system lead time to calculate customer lead
time
The clock still starts ticking when we accept the customers order, not when it is placed!
Slide from LKU Training Deck
11

#LKIN17@sudiptal
TestReady
F
E
I
GD
GYPB
DE MN
P1
AB
Customer Lead Time
Waiting Waiting WaitingWorking
IdeasDev
Ready
5Ongoing
Development Testing
Done
3 35
UATReleaseReady
∞ ∞
Working WaitingWorking
Slide from LKU Training Deck
Flow Efficiency12

#LKIN17@sudiptal
TestReady
Flow Efficiency
F
E
I
GD
GYPB
DE MN
P1
AB
Customer Lead Time
Waiting Waiting WaitingWorking
* Zsolt Fabok, Lean Agile Scotland, Sep 2012, Lean Kanban France, Oct 2012** Hakan Forss, Lean Kanban France, Oct 2013
IdeasDev
Ready
5Ongoing
Development Testing
Done
3 35
UATReleaseReady
∞ ∞
Flow efficiency measures the percentage of total
lead time is spent actually adding value (or knowledge) versus
waiting
Flow efficiency % = Work Time x 100%
Lead Time
Working WaitingWorking
Multitasking means time spent in working columns is often waiting
time
Slide from LKU Training Deck
Flow efficiencies of 1-5% are commonly reported. *, **
> 40% is good!
13

#LKIN17@sudiptal
Even in a Kanban team like SwiftKanban
Our flow efficiency over a 7 year period < 50%
14

#LKIN17@sudiptal
Waiting Waiting WaitingWorking Working WaitingWorking
TestReady
Implications of low Flow Efficiency
F
E
I
GD
GYPB
DE MN
P1
AB
IdeasDev
Ready
5Ongoing
Development Testing
Done
3 35
UATReleaseReady
∞ ∞
Low flow efficiency means that most of lead time is influenced by environmental factors that are unlikely to change soon
Customer Lead Time
In a low flow efficiency environment, Class of service is much more likely to influence lead time than any other
factor
As a result, lead time is not very sensitive to the size or complexity of a single work item, or to
the specific people involved or their
individual capabilities
Slide from LKU Training Deck
15

#LKIN17@sudiptal
This profoundly changes our thinking of the last 5 decades!
The estimate that we made with a lot effort and diligence isn’t a real factor!
Further… how many assumptions to get to the estimate?
Requirement assumptions
Design assumptions
People skill assumptions
No business interruption/dedicated resource assumptions
Contingency assumptions
Management acceptance of that contingency assumptions…
Estimation bias of the person doing the estimation!
In short, there are simply TOO MANY SYSTEM variables in a system that are NOT in our control… yet, we estimate with confidence (with buffers)
16

#LKIN17@sudiptal
The odds were always stacked against you to win this game
If you did manage to deliver on time, has someone ever told you:
You must have buffered your estimates like crazy!”
You got lucky!
… and… you did a good job!
17

#LKIN17@sudiptal
Let’s improve our win(ability)!LET’S PREDICT WITH GREATER CONFIDENCE…
WITH A MATHEMATICAL FOUNDATION
18

#LKIN17@sudiptal
Understanding Distributions 19
Most of us think of distributions as a “Bell Curve”
Extremely common in natural domain
A legacy of our appraisal discussions… ?
In a Normal Bell Curve, also called Gaussian Distribution,
Mean(or Average) = Modal
CLT applies (from Wikipedia):
When independent random variables are added, their properly normalized sum tends toward a normal distribution (a bell curve) even if the original variables themselves are not normally distributed.
#LKIN17@sudiptal
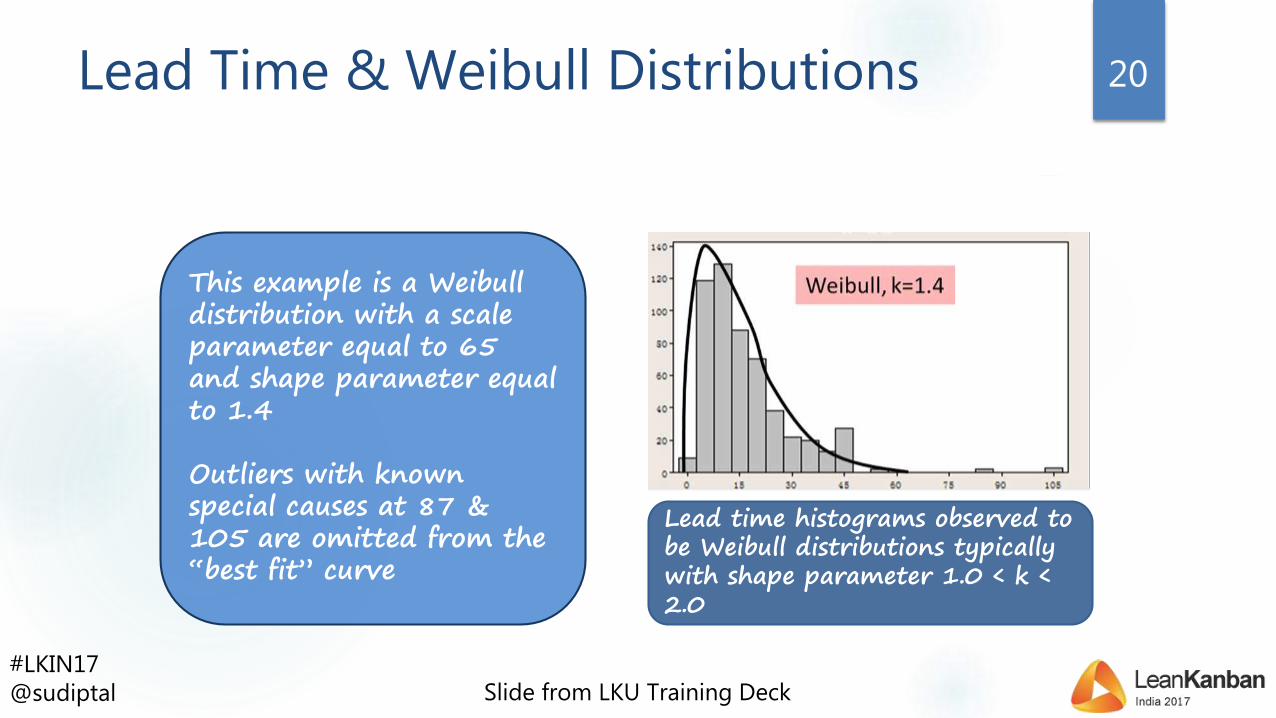
Lead Time & Weibull Distributions
Lead time histograms observed to be Weibull distributions typically with shape parameter 1.0 < k < 2.0
This example is a Weibull distribution with a scale parameter equal to 65 and shape parameter equal to 1.4
Outliers with known special causes at 87 & 105 are omitted from the “best fit” curve
Slide from LKU Training Deck
20

#LKIN17@sudiptal
Lead Time Distribution
0
0.5
1
1.5
2
2.5
3
3.5
1 8 15 22 29 36 43 50 57 64 71 78 85 92 99106
113120
127134
141148
Days
CR
s &
Bug
s
SLA expectation of44 days with 85% on-time
Mean of 31 days
SLA expectation of105 days with 98 % on-time
Lead Time Histogram
Slide from LKU Training Deck
21

#LKIN17@sudiptal
Lead Time Distribution
0
0.5
1
1.5
2
2.5
3
3.5
1 8 15 22 29 36 43 50 57 64 71 78 85 92 99106
113120
127134
141148
Days
CR
s &
Bug
s
SLA expectation of44 days with 85% on-time
Mean of 31 days
SLA expectation of105 days with 98 % on-time
This is multi-modal data!
The work is of two types: Change Requests (new features);
and Production Defects
This is multi-modal data!
The work is of two types: Change Requests (new features);
and Production Defects
Lead Time Histogram
Slide from LKU Training Deck
22

#LKIN17@sudiptal
85% at10 days
Mean5 days
98% at25 days
Pro
duct
ion D
efec
ts
Change
Req
ues
ts85% at60 days
Mean 50 days
98% at150 days
Mode
Median 45 days
Filter by Type/Class to get Single ModalData
Slide from LKU Training Deck
23
#LKIN17@sudiptal
Change
Req
ues
ts
60 days, SLE (customer expectation)
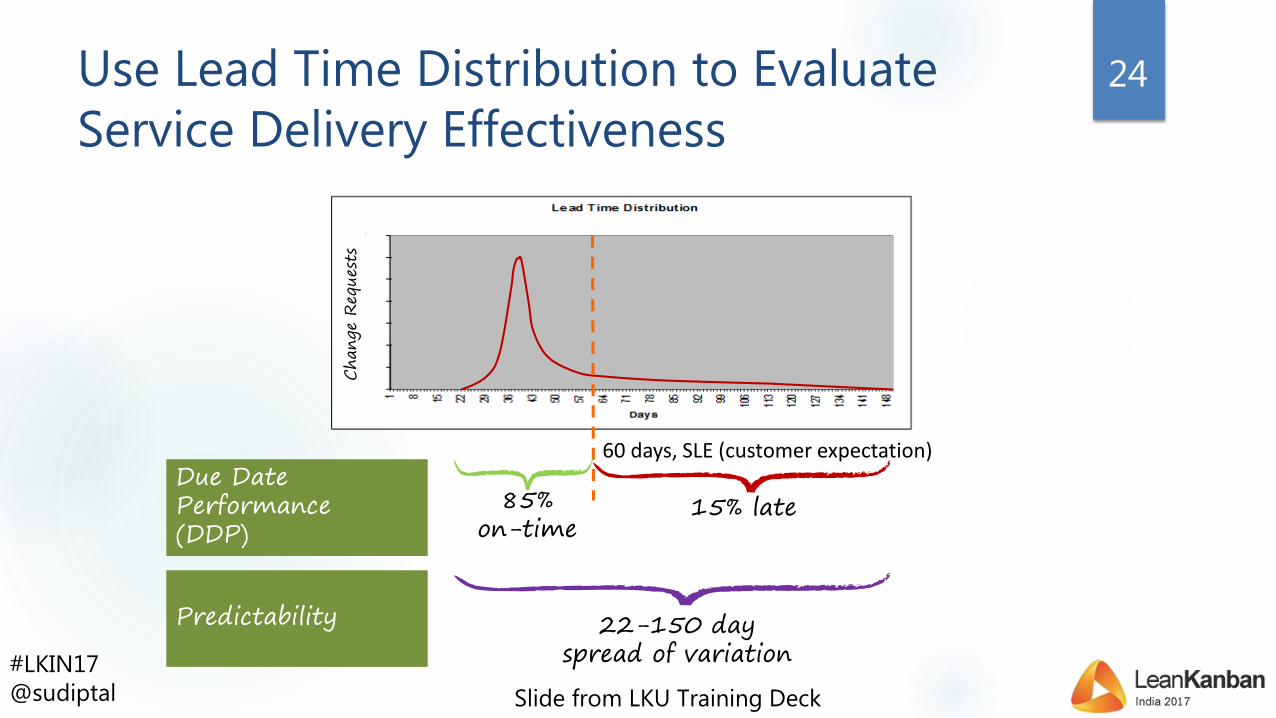
Use Lead Time Distribution to EvaluateService Delivery Effectiveness
22-150 dayspread of variation
85%on-time
15% lateDue DatePerformance(DDP)
Predictability
Slide from LKU Training Deck
24

#LKIN17@sudiptal
Let’s recap
Given the flow efficiency that most systems experience (in low teens or single digits)…
… to somehow think that more planning and more detailed estimation will help us predict better when we can deliver our work item to your customer/end user is “mathematically” flawed!
25

#LKIN17@sudiptal
So… how do stop making wrong commitments?
1. Don’t answer the wrong question…
How long will this get done?
When will this get done?
How much time this will take?
How many resources do you need?
2. The correct question is…
When do you need it?
What is the Cost of Delay?
26

#LKIN17@sudiptal
So… how do make accurate predictions?
We use mathematical basis – Lead Time Histograms
Lead Time Histograms guide us to predict a completion date WITH ASSOCIATED LEVEL OF CONFIDENCE
27

#LKIN17@sudiptal
Let’s improve our hit rate… Step 1
Class of Services
If you are not following Kanban, you might commonly call it as “Priority”
David calls CoS as the “Sonic Screwdriver” for a Kanban System
Use CoS to better meet Due Dates
If a work item gets closer to its Due Date, escalate its CoS to Expedite
The getKanban games gives a good example of how this could work!
28
#LKIN17@sudiptal
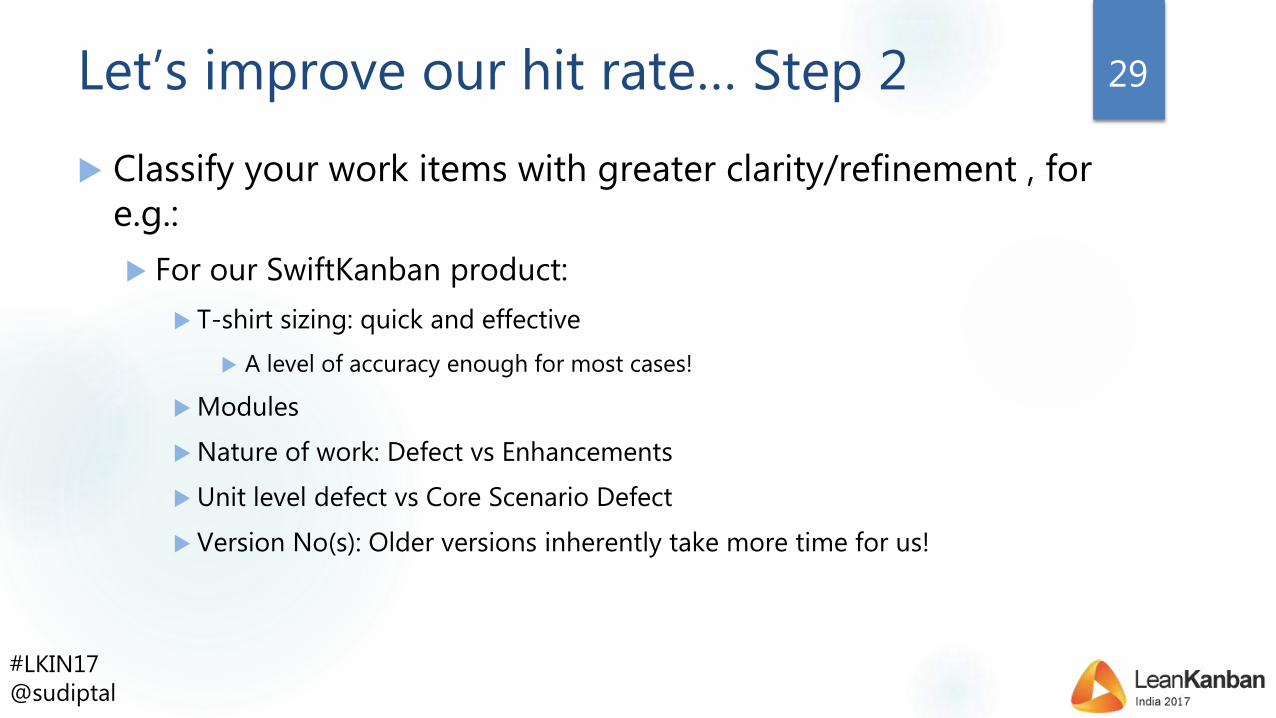
Let’s improve our hit rate… Step 2
Classify your work items with greater clarity/refinement , for e.g.:
For our SwiftKanban product:
T-shirt sizing: quick and effective
A level of accuracy enough for most cases!
Modules
Nature of work: Defect vs Enhancements
Unit level defect vs Core Scenario Defect
Version No(s): Older versions inherently take more time for us!
29
#LKIN17@sudiptal
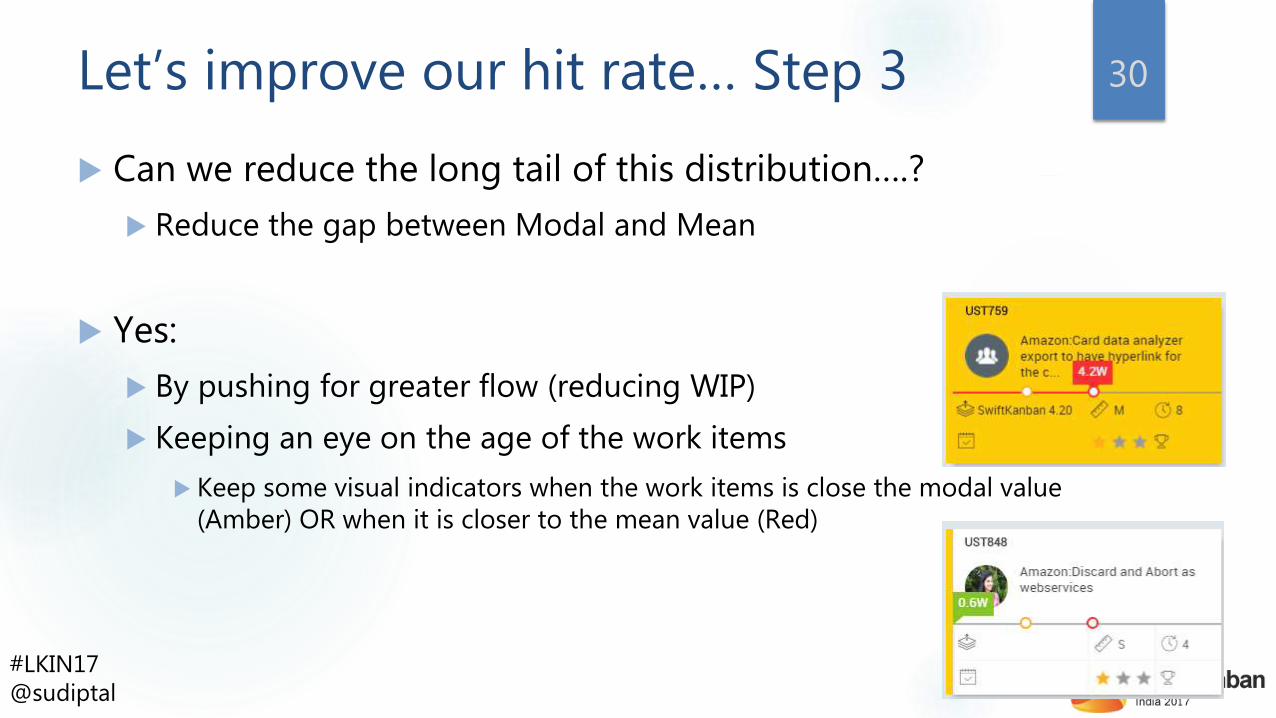
Let’s improve our hit rate… Step 3
Can we reduce the long tail of this distribution….?
Reduce the gap between Modal and Mean
Yes:
By pushing for greater flow (reducing WIP)
Keeping an eye on the age of the work items
Keep some visual indicators when the work items is close the modal value (Amber) OR when it is closer to the mean value (Red)
30
#LKIN17@sudiptal
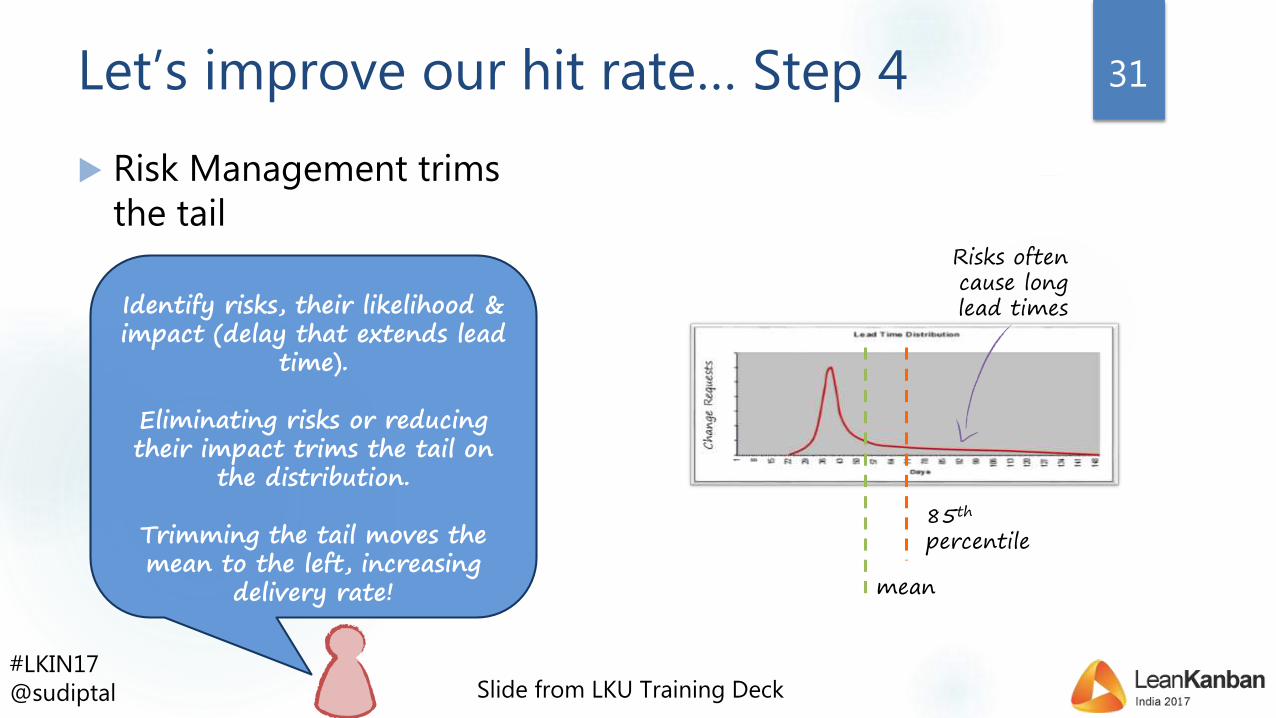
Let’s improve our hit rate… Step 4
Risk Management trims the tail
31
Identify risks, their likelihood & impact (delay that extends lead
time).
Eliminating risks or reducing their impact trims the tail on
the distribution.
Trimming the tail moves the mean to the left, increasing
delivery rate!
Slide from LKU Training Deck
85th
percentile
mean
Risks often cause long lead times
#LKIN17@sudiptal
Let’s improve our hit rate… Step 5
Let start the work at the right time… not too early and not too late!
Not too early… because in the normal environment where Demand > Supply, you, you could work on something else now, knowing that a delay in starting will not risk your Completion Date
Not too late…
32

#LKIN17@sudiptal
Understanding (Finishing) CoD
33

#LKIN17@sudiptal
CoS mapped to Delay Cost Functions
Slide from LKU Training Deck
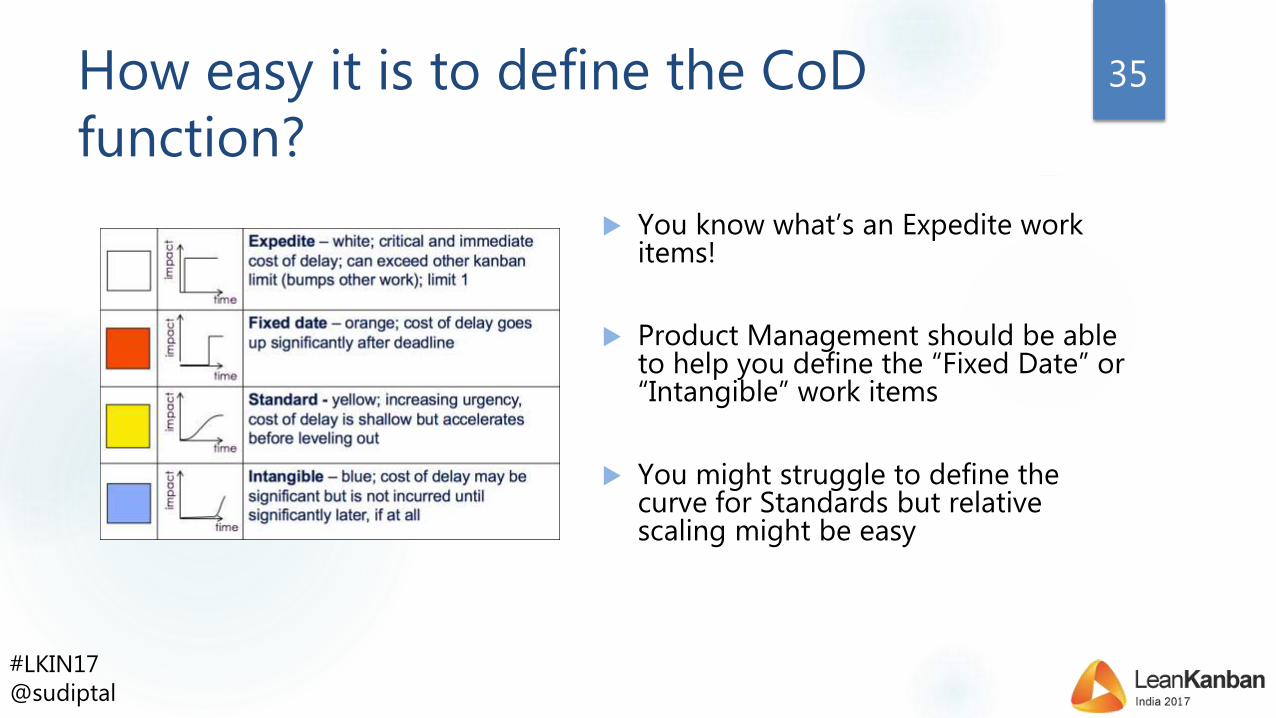
Class of service and its policiesColor Func
Expedite – white; critical and immediate cost of delay;
can exceed other kanban limit (bumps other work);
limit 1
Fixed date – orange; cost of delay goes up
significantly after deadline
Standard - yellow; increasing urgency, cost of delay is
shallow but accelerates before leveling out
Intangible – blue; cost of delay may be significant but
is not incurred until significantly later, if at all
timeim
pact
time
imp
act
time
imp
act
time
imp
act
34
#LKIN17@sudiptal
How easy it is to define the CoDfunction?
You know what’s an Expedite work items!
Product Management should be able to help you define the “Fixed Date” or “Intangible” work items
You might struggle to define the curve for Standards but relative scaling might be easy
35

#LKIN17@sudiptal
(Finishing)
Cost of Delay
Function
Lead Time
Distribution
When to start
your work
(Starting Cost
of Delay)
36

#LKIN17@sudiptal
Fixed Date CoS
From SwiftESP Tool
37

#LKIN17@sudiptal
Standard CoS (Fixed Rate of value gained)
From SwiftESP Tool
38

#LKIN17@sudiptal
Let us recap now…
39

#LKIN17@sudiptal
We explained why detailed estimation or planning is unproductive in low Flow Efficiency systems
End dates predictions aren’t deterministic
They should always be accompanied by a % of confidence
A practical, statistical, fast approach using Lead Time histograms
Lead Time histograms assimilate all system characteristics and eliminates personal bias
Use CoS and work item characteristics to identify histogram that reflects your work item most accurately
Use CoD functions, in combination with Lead Time histograms, to understand when you should start your work
40

#LKIN17@sudiptal
Thank you….
Reach me at:
@sudiptal
sudiptalahiri.wordpress.com
“Absorb what is useful, discard what is useless and add what is
specifically your own”
Bruce Lee