Embed Size (px)
DESCRIPTION
Kogumiku märksõnad on naised ja mehed ning kodu ja tööelu ühitamine. Analüüsitakse naiste ja meeste ajakasutust, töövõimet ning haridust. Vaatluse all on ka vaba aeg ja töövõime taastamine. Artiklikogumikus esitatud omavahel seotud näitajad annavad tervikliku pildi naiste ja meeste käitumismustritest ning positsioonist igapäevaelus.
Citation preview
EESTI STATISTIKA1921–2011
MEHE KODU ON MAAILM, NAISE MAAILM ON KODU?MAN’S HOME IS THE WORLD, WOMAN’S WORLD IS HER HOME?
TALLINN 2011
EESTI STATISTIKASTATISTICS ESTONIA
MEHE KODU ON MAAILM, NAISE MAAILM ON KODU?MAN’S HOME IS THE WORLD, WOMAN’S WORLD IS HER HOME?
Koostanud Statistikaameti rahvastiku- ja sotsiaalstatistika osakond (Marin Tasuja, tel 625 9360).
Compiled by the Population and Social Statistics Department of Statistics Estonia (Marin Tasuja,
tel +372 625 9360)
Toimetanud Kairit Põder
Inglise keelde tõlkinud OÜ Triangular
Inglise keele toimetanud Heli Taaraste
Küljendanud Uku Nurges
Kaane kujundanud Maris Valk Edited by Kairit Põder Translation into English by Triangular Ltd English by Heli Taaraste Layout by Uku Nurges Cover design by Maris Valk Kaanefoto / Cover photograph: Bulls
Kirjastanud Statistikaamet, Endla 15, 15174 Tallinn Trükkinud Ofset OÜ, Paldiski mnt 25, 10612 Tallinn
Oktoober 2011 Published by Statistics Estonia, 15 Endla St., 15174 Tallinn Printed by Ofset Ltd, 25 Paldiski Rd, 10612 Tallinn
October 2011 ISBN 978-9985-74-500-7
Autoriõigus/Copyright: Statistikaamet, 2011
Väljaande andmete kasutamisel või tsiteerimisel palume viidata allikale. When using or quoting the data included in this issue, please indicate the source.
SAATESÕNA PREFACE
MEHE KODU ON MAAILM, NAISE MAAILM ON KODU? MAN’S HOME IS THE WORLD, WOMAN’S WORLD IS HER HOME? 3
SAATEKS
„Demokraatlik elukorraldus mitte üksnes ei tähenda, vaid ka eeldab, et naised ja mehed on kõigis eluvaldkondades võrdõiguslikud. Sooline võrdõiguslikkus tähendab võrdsete õiguste kõrval ka võrdseid kohustusi ja vastutust ning võrdseid võimalusi kõigile, olenemata inimese soost,“ on kirjas Eesti Vabariigi võrdõiguslikkuse seaduse ülevaatesa. Igapäevaelus tõdeme, et ikka on teisiti. Ajakasutuse uuringud on näidanud, et koduseid töid teevad iga päev palju rohkem naised. Eesti naistel, kellest valdav osa käib tööl, on kodutööde tegemisel kanda topeltkoormus, mis olulisel määral vähendab naiste võimalust ennast ühiskonnas teostada. Samas tuleb tõdeda, et naised saavad oma palgatöö eest tunduvalt väiksemat tasu kui mehed ja palgalõhe poolest oleme Euroopas esirinnas.
Nii naised kui ka mehed soovivad olla koos lastega ja end oma erialal teostada. Töö- ja pereelu ühitamise puhul räägitakse peamiselt kolmest probleemsest valdkonnast, mida püütakse ühitada: palgatöö, lastehoid ja kodutööde jagamine. Selleks et tulla toime nii lapsevanema, elukaaslase kui ka töötajana, peaksid vanematevahelised kodused kohustused olema jagatud õiglaselt. Kogumikus analüüsitakse töö- ja pereelu ühitamise aspekte ning lastehoiuteenuste kätte-saadavust ja kasutamist. Eestit on võimalik vaadelda ka võrdluses teiste Euroopa Liidu liikmesriikidega, mis annab hea ülevaate, millises seisus me oleme ja millised on suuremad kitsaskohad eelkõige Eesti ühiskonnas.
Kogumikust saab ülevaate nii naiste ja meeste haridustee väljakujunemisest kui ka tervise-käitumisest. Oluline aspekt on naiste ja meeste vaba aja maht ja kasutamine – kas kodus passiivselt telekat vaadates või aktiivselt kultuuriasutustes käies.
Eri teemakäsitlusega artiklid annavad kokkupõimitult ülevaate naiste ja meeste positsioonist ühiskonnas. Kas saame ka vastuse pealkirjas püstitatud küsimusele, on mehe kodu maailm ja naise maailm kodu?
Head lugemist!
Urve Kask rahvastiku- ja sotsiaalstatistika osakonna juhataja
a Naised & mehed: võrdsed õigused, võrdne vastutus: ülevaade soolise võrdõiguslikkuse seadusest. (2010). Sotsiaalministeerium. Tartu: Atlex.
SAATESÕNA PREFACE
MEHE KODU ON MAAILM, NAISE MAAILM ON KODU? MAN’S HOME IS THE WORLD, WOMAN’S WORLD IS HER HOME? 4
PREFACE
Overview of the Republic of Estonia Gender Equality Acta sets out that democratic organisation of life not only means but also presumes equality between males and females in all areas of life. In addition to the equal rights, gender equality also implies equal obligations and liability as well as equal opportunities for all persons irrespective of their gender. In our daily life we recognise that it is still not so. Time Use Surveys have shown that women deal with household care on a daily basis much more than men. In Estonia, women, a predominant share of who are employed, carry a redoubled burden in household works, which significantly reduces women’s opportunity for self-realization in the society. At the same time, it should be acknowledged that women receive remarkably lower remuneration than men for paid labour and, in Europe we position in the forefront in terms of wage gap.
Women and men both wish to have opportunities to spend time together with their children and achieve as much as possible in their profession. In regard to reconciliation between work and family life, we mainly talk about three problematic spheres – paid labour, childcare and division of household care – which are tried to be combined. In order to cope as a parent, partner in life and as an employee, domestic obligations should be distributed between parents in a fair way. The collection of articles analyses aspects of combining work and family life as well as access to and use of childcare services. Estonia can be observed in comparison with other Member States, which provides a good overview of the conditions we are in and of the major bottlenecks encountered first and foremost in Estonian society.
The publication gives and overview of the shaping of women’s and mens’ road to education as well as of their health behaviour. An important aspect is the amount of leisure time and its use by females and males: whether it is spent by passively watching TV at home or by actively visiting cultural institutions.
Articles on various topics, twisted together, provide an overview of the positions of females and males in the society. Can we also confirm the raised question: man’s home is the world, woman’s world is her home?
Enjoy the reading!
Urve Kask Head of Population and Social Statistics Department
a Naised & mehed: võrdsed õigused, võrdne vastutus: ülevaade soolise võrdõiguslikkuse seadusest. (2010). Sotsiaalministeerium. Tartu: Atlex.
SISUKORD CONTENTS
MEHE KODU ON MAAILM, NAISE MAAILM ON KODU? MAN’S HOME IS THE WORLD, WOMAN’S WORLD IS HER HOME? 5
SISUKORD
Soolised erinevused ajakasutuses M. Tasuja 6
Tervis ja töövõime J. Rahno 36
Töö- ja pereelu ühitamine kui naiste ülesanne? S. Krusell 59
Kultuuriasutustes käimine inimeste aktiivsuse näitajana K. Kommel 83
Hariduselus naised spurdivad, mehed sörgivad? R. Leoma 100
Hariduse peegeldus täiskasvanueas K. Kõrreveski 111
Märkide seletus 128
CONTENTS
Gender differences in time use M. Tasuja 24
Health and capacity for work J. Rahno 50
Reconciling work and family life as a task for women? S. Krusell 74
Visiting of cultural institutions as an indicator of population’s activeness K. Kommel 93
In education, are women sprinters and men joggers? R. Leoma 107
Reflection of education in adulthood K. Kõrreveski 122
Explanation of symbols 128
SOOLISED ERINEVUSED AJAKASUTUSES GENDER DIFFERENCES IN TIME USE
MEHE KODU ON MAAILM, NAISE MAAILM ON KODU? MAN’S HOME IS THE WORLD, WOMAN’S WORLD IS HER HOME? 6
SOOLISED ERINEVUSED AJAKASUTUSES
Marin Tasuja
Sissejuhatus
Aeg on üks olulisemaid igapäevaelu mõjutajaid. Erinevalt muudest inimressurssidest on aeg kõigi vahel võrdselt jagatud. Olenemata sissetulekust, haridusest, perekonnaseisust, soost või vanusest on kõigil ööpäevas aega 24 tundi. Kuigi kõrgem sissetulek ja tehnoloogilised uuendused on muutnud võimalikuks aega osaliselt rahaga asendada (Levinson ja Kumar 1995), ei saa keegi aega juurde osta. Aja lõpliku iseloomu tõttu on inimesed sunnitud valima mitme tegevuse vahel ja tegema kompromisse nii enda isiklikus kui ka leibkonnasiseses ajajaotuses. Mingile tegevusele aja kulutamine tähendab, et sellevõrra jääb vähem aega teiste tegevuste jaoks. Kuigi aega on kõigil ühepalju, on selle kasutamine ja võimalus valida meelepärasemaid tegevusi inimeseti väga erinev. Üks selliseid kompromissi otsimisi on tasustatud töö ja kodutööde jaotumine naiste ja meeste vahel. Naisi on läbi aegade seostatud pigem kodu ja sealsete tegevustega, samal ajal kui meeste pärusmaaks on peetud raha teenimist ja kodust väljapoole jäävat (Wharton 2005). Artiklis uuritakse, kuidas kulutavad Eesti naised ja mehed oma aega ning kuidas on tasustatud töö ja kodutööd naiste ja meeste vahel jagatud.
Ajakasutuse uurimine annab tunnistust selle kohta, kuidas ühiskond on üles ehitatud ja millised suhted valitsevad selle liikmete vahel. See, missugustele tegevustele inimesed aega kulutavad, näitab nende prioriteete ja peegeldab nende igapäevaelu (Glorieux ja Koelet 2002). Ajakasutus iseloomustab nii tööturul osalemist, tarbimiskäitumist, vaba aja veetmist ja peresuhteid kui ka muutusi leibkonna koosseisus, inimeste heaolus ja ühiskonnas valitsevates tõekspidamistes tervikuna. Tasulisele tööle kulutatud aeg mõjutab sissetuleku suurust, mis omakorda määrab võimalike kulutuste suuruse ja struktuuri ning leibkondade majandusliku heaolu. Mida kõrgem on töötasu, seda suurem on tööle kulutatud aja suhteline väärtus. See muudab vaba aja ja kodutööd tasulise tööga võrreldes kallimaks, mis toob kaasa nende tegevuste osatähtsuse vähenemise (Becker 1965). Teisalt saab suurema sissetulekuga inimene lubada endale ka kallimaid vaba aja tegevusi; samuti on võimalik osa kodutöödest teenusena osta (nt palgata lapsehoidja või koduabiline). Peale otsese majandusliku kasu suurendab töötamisele või õppimisele kulutatud aeg inimkapitali, mõjutades seega võimalusi ja sissetulekut ka tulevikus. Mida suurem osa päevast aga kulub töötamisele, seda vähem jääb aega selle töö viljade nautimiseks ja puhkamiseks (Fisher ja Layte 2004). Peale tasustatud tegevuste on inimeste ajakasutust jälgides võimalik kindlaks teha ka enamasti varjule jäävat ja kodus tehtavat tasustamata tööd.
Peale otsese majandusliku kasu oleneb ajakasutusest ka subjektiivne heaolu – inimestele on oluline vaba aeg ja selle kvaliteet, piisav uneaeg, suhtlemine teiste inimestega, aga ka eneseteostus töökohal. Ajakasutus võimaldab luua sotsiaalset kapitali – pere ja sõpradega veedetud aeg ning muud sotsiaalsed suhted on olulised nii isikliku heaolu, leibkondade toimimise, tugisüsteemi tagamise kui ka ühiskonnas kehtivate väärtuste loomise seisukohalt. Vanemate ajakasutus, tööde jaotus perekonnas ja lastega veedetud aeg kujundavad omakorda laste väärtushinnanguid ja mõjutavad nende ajakasutust tulevikus.
Kiirenenud elutempo, valikuvõimaluste suurenemise ja ühiskonnas varem kehtinud normide hägustumise tõttu on ajakasutus muutunud võimalikuks pingete allikaks. Koos tootlikkuse kasvuga on toimunud tõus ka vaba aja intensiivsuses (Linder 1970, viidatud McGinnity ja Russelli 2007 järgi) ja inimesed tunnetavad järjest enam, et neil ei jätku kõige jaoks aega (Bittman 2004). Ühe ajapuuduse põhjusena on Gershuny (2005) välja toonud, et tööpuuduse suurenemise ja muude sotsiaalsete muutuste tõttu on tööga koormatus ja vaba aja vähesus kujunenud ühiskonnas positiivseks ja privilegeeritud seisundiks. Kogunenud pinged ja ajastress võivad aga mõjuda negatiivselt inimeste tervisele ning pere- ja tööelule. Eriti puutuvad ajapuudusega kokku väikeste lastega perekonnad, kes püüavad kulutuste suurenemisega tekkinud vajadust veeta rohkem aega tasulisel tööl kokku sobitada kasvanud hoolduskoormusega (McGinnity ja Russell 2007). Majandusraskused ja ajaline surve mõjutavad otseselt nii vanemate kui ka laste heaolu.
SOOLISED ERINEVUSED AJAKASUTUSES GENDER DIFFERENCES IN TIME USE
MEHE KODU ON MAAILM, NAISE MAAILM ON KODU? MAN’S HOME IS THE WORLD, WOMAN’S WORLD IS HER HOME? 7
Samal ajal leidub inimesi (näiteks pensionärid ja töötud), kellel on liiga palju vaba aega ja kellel ei jätku oma päeva täitmiseks piisavalt mõttekaid tegevusi. Hoolimata vaba aja rohkusest, mis peaks suurendama heaolu, ei pruugi neil oma aja sisustamiseks olla küllalt raha või muid võimalusi.
Ilmselt üks olulisemaid ajakasutust mõjutavaid tegureid on sugu. Naiste ja meeste ajakasutus näitab nende positsiooni ühiskonnas ja seda mõjutavad mitmesugused soostereotüübid. Eriti on stereotüübid juurdunud laste kasvatamisel ja tööjaotusel perekonnas. Meest nähakse endiselt kui peamist perekonna toimetuleku kindlustajat (Vainu jt 2010). Hoolimata võrdõiguslikkusest de jure on naiste ja meeste õigused, kohustused, võimalused ja vastutus tegelikult erinevad ning sooline ebavõrdsus üsna levinud (ibid.). See ilmneb näiteks tööturul, tervises, hariduses ja pääsus otsustavatele kohtadele. Eesti naiste ja meeste palgaerinevus on üks Euroopa suuremaid ja tööturg sooliselt segregeeritud, s.t naised ja mehed töötavad erinevatel ametikohtadel ja tegevusaladel (Randoja 2008). Ebavõrdsus tööelus kandub edasi ka eraellu (Deding ja Lausten 2006), tuues kaasa soolise lõhe kodutöödes ja vabas ajas. Uuringud (Anxo ja Carlin 2004) on näidanud, et kodutöödele kulutatud aja ja naiste palga vahel on negatiivne seos – mida rohkem aega kulutab naine majapidamisele, seda väiksem on ta palk. Naiste suhteliselt madalam töötasu võrreldes meestega soodustab omakorda suuremat spetsialiseerumist kodutöödele. Meeste puhul palk ja kodutöödele kulutatud aeg omavahel seotud ei ole. Mida suurem aga on naise töötasu, seda vähem teeb ta majapidamistöid ja seda rohkem teeb neid töid tema partner (ibid.).
Naiste ja meeste keskmine ööpäevane ajakasutus
Analüüsis on kasutatud Eesti ajakasutuse uuringu (AKU) andmeid aastatest 1999–2000 ja 2009–2010 (edaspidi vastavalt 2000 ja 2010). Vaadeldud on vaid põhitegevustele kulutatud aega ehk neid tegevusi, mida inimesed on pidanud mitme samaaegse toimingu hulgast endale olulisemaks. Sellise lähenemise korral on tegevustele kulutatud koguaeg 24 tundi. Samal ajal võib ainult põhitegevuste jälgimine tegelikku tegevusele kulutatud aega alahinnata. Osa tegevusi võivad teistest rohkem teisejärgulised olla (s.t neid on võimalik teha teiste asjade kõrvalt). Levinuimad kõrvaltegevused on mitmesugused vaba aja veetmise viisid (televiisori vaatamine, raadio ja muusika kuulamine jms), teiste inimestega suhtlemine ja mõningad kodutööd (lastehoid). 2010. aastal kulutasid inimesed muude tegevuste kõrvalt näiteks lastehoiule 11 minutit, televiisori vaatamisele üle poole tunni, raadio ja muusika kuulamisele peaaegu tunni ja teistega suhtlemisele üle tunni päevas. Uuringud (Sayer 2007) on näidanud, et korraga mitme tegevuse ettevõtmine on eriti omane naistele. Naised tegid kõrvaltegevusena näiteks 20 minutit kauem kodutöid kui mehed. Seega võib naiste ja meeste tegelik ajakasutus ning sooline lõhe erineda ainult põhitegevustele kulutatud ajast.
Joonisel nr 1 on näidatud, kui palju aega kulutavad keskmisel päeval Eesti naised ja mehed kaheksale peamisele tegevusele. Andmete tõlgendamisel tuleb meeles pidada, et uuringusse on kaasatud erinevad inimrühmad – eri vanuse (alates kümneaastastest), sotsiaal-majandusliku seisundi, leibkonnatüübi ja haridusega inimesed. Päeva keskmine ajakasutus on arvutatud terve aasta kohta, kaasa on arvatud nii töö- kui ka puhkepäevad. Tegevustele kulutatud aeg hõlmab kõiki uuringus osalenud inimesi, hoolimata sellest, kas nad nendes tegevustes osalesid või mitte. See seletab, miks näiteks keskmine tasulisele tööle kulutatud aeg on tunduvalt lühem, kui võiks eeldada tavalisel tööpäeval tööga hõivatud inimese aja kohta. Keskmine ajakasutuse hinnang on seega kombinatsioon tegevusele kulutatud ajast ja sellega tegelenud inimeste osatähtsusest.
SOOLISED ERINEVUSED AJAKASUTUSES GENDER DIFFERENCES IN TIME USE
MEHE KODU ON MAAILM, NAISE MAAILM ON KODU? MAN’S HOME IS THE WORLD, WOMAN’S WORLD IS HER HOME? 8
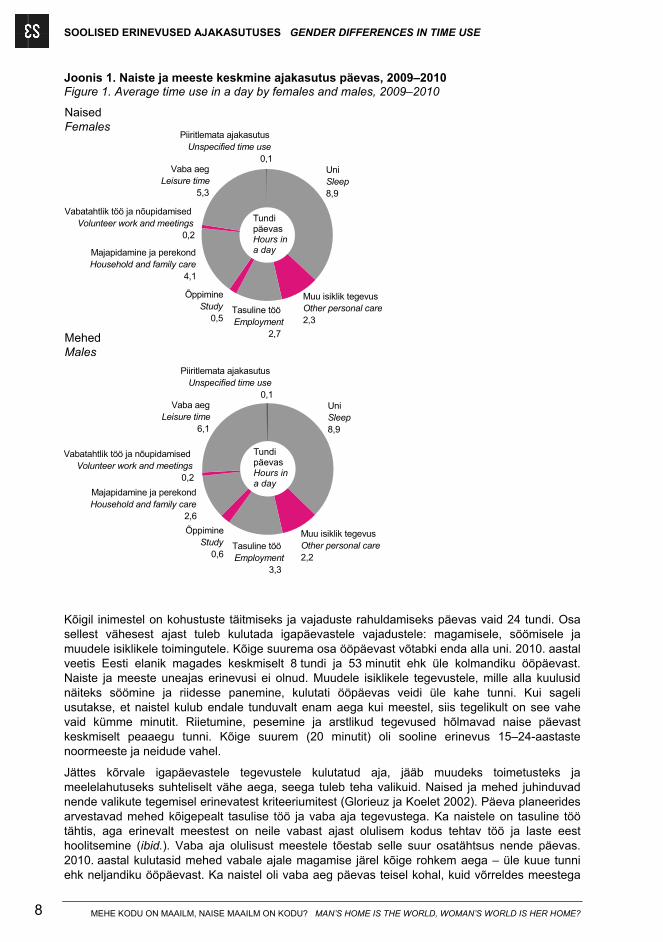
Joonis 1. Naiste ja meeste keskmine ajakasutus päevas, 2009–2010 Figure 1. Average time use in a day by females and males, 2009–2010
Muu isiklik tegevusOther personal care2,2
Tasuline tööEmployment
3,3
Majapidamine ja perekondHousehold and family care
2,6
ÕppimineStudy
0,6
UniSleep8,9
Vaba aegLeisure time
6,1
Vabatahtlik töö ja nõupidamisedVolunteer work and meetings
0,2
Piiritlemata ajakasutusUnspecified time use
0,1
Muu isiklik tegevusOther personal care2,3
Tasuline tööEmployment
2,7
Majapidamine ja perekondHousehold and family care
4,1
ÕppimineStudy
0,5
UniSleep8,9
Vaba aegLeisure time
5,3
Vabatahtlik töö ja nõupidamisedVolunteer work and meetings
0,2
Piiritlemata ajakasutusUnspecified time use
0,1
TundipäevasHours ina day
TundipäevasHours ina day
NaisedFemales
MehedMales
Kõigil inimestel on kohustuste täitmiseks ja vajaduste rahuldamiseks päevas vaid 24 tundi. Osa sellest vähesest ajast tuleb kulutada igapäevastele vajadustele: magamisele, söömisele ja muudele isiklikele toimingutele. Kõige suurema osa ööpäevast võtabki enda alla uni. 2010. aastal veetis Eesti elanik magades keskmiselt 8 tundi ja 53 minutit ehk üle kolmandiku ööpäevast. Naiste ja meeste uneajas erinevusi ei olnud. Muudele isiklikele tegevustele, mille alla kuulusid näiteks söömine ja riidesse panemine, kulutati ööpäevas veidi üle kahe tunni. Kui sageli usutakse, et naistel kulub endale tunduvalt enam aega kui meestel, siis tegelikult on see vahe vaid kümme minutit. Riietumine, pesemine ja arstlikud tegevused hõlmavad naise päevast keskmiselt peaaegu tunni. Kõige suurem (20 minutit) oli sooline erinevus 15–24-aastaste noormeeste ja neidude vahel.
Jättes kõrvale igapäevastele tegevustele kulutatud aja, jääb muudeks toimetusteks ja meelelahutuseks suhteliselt vähe aega, seega tuleb teha valikuid. Naised ja mehed juhinduvad nende valikute tegemisel erinevatest kriteeriumitest (Glorieuz ja Koelet 2002). Päeva planeerides arvestavad mehed kõigepealt tasulise töö ja vaba aja tegevustega. Ka naistele on tasuline töö tähtis, aga erinevalt meestest on neile vabast ajast olulisem kodus tehtav töö ja laste eest hoolitsemine (ibid.). Vaba aja olulisust meestele tõestab selle suur osatähtsus nende päevas. 2010. aastal kulutasid mehed vabale ajale magamise järel kõige rohkem aega – üle kuue tunni ehk neljandiku ööpäevast. Ka naistel oli vaba aeg päevas teisel kohal, kuid võrreldes meestega
SOOLISED ERINEVUSED AJAKASUTUSES GENDER DIFFERENCES IN TIME USE
MEHE KODU ON MAAILM, NAISE MAAILM ON KODU? MAN’S HOME IS THE WORLD, WOMAN’S WORLD IS HER HOME? 9
ei hõlmanud see nii suurt osa (5 h ja 16 min). Kolmandal kohal naiste ajakasutuses olid majapidamistööd ja laste eest hoolitsemine (4 h ja 8 min). Meeste päevas olid kodutööd alles neljandal kohal ja nendele kulutatud aeg naiste omast poolteist tundi lühem. Kodutööd hõlmasid naiste ärkvelolekuajast üle neljandiku (27%) ja nendele kulunud aeg oli meeste omast 60% pikem.
Vaba aja ja tasulise töö kombineerimine erineb kodutööde ja tasulise töö ühitamisest suurel määral. Et vaba aeg ja tasuline töö kuuluvad eri eluvaldkondadesse, täiendavad nad teineteist ja neid on lihtsam omavahel kokku sobitada. Nii nagu tasuline töö on ka kodutööd hõivatud aeg. Ühe tööga seotud väsimus ja stress kandub edasi ka teisele, sest mõlemad on töötamise vormid. Pikk kodutöödele kuluv aeg kipub piirama tasulisele tööle kulutatavat aega ja energiat. (Glorieuz ja Koelet 2002). Eri liiki tööde kombineerimisel tekkivaid raskusi iseloomustab see, et naised kulutavad tasulisele tööle vähem aega. 2010. aastal tegid naised tasulist tööd keskmiselt üle kahe ja poole tunni, mehed üle kolme tunni päevas. Seega kulutab keskmine mees tasulisele tööle üle viiendiku (22%) ärkvelolekuajast, naine aga vaid 18%.
Õppimisele kulub nii naistel kui ka meestel päevas ligi pool tundi, aga mehed veedavad õppides veidi kauem aega kui naised. Et tegemist on kõigi inimeste keskmise ajakasutusega, on õppimisele kulutatud aeg üsna tagasihoidlik. Kõige rohkem aega kulub õppimisele 10–14-aastastel, kes keskmisel päeval (k.a nädalavahetusel) õpivad peaaegu neli tundi. Tüdrukud on õppimises poistest veidi tublimad, vähemalt nad kulutavad selleks rohkem aega. Meeste pikem õppimisaeg vanemas eas on kooskõlas 2007. aastal toimunud täiskasvanute koolituse uuringu tulemustega, mille järgi naisi osaleb täiskasvanuõppes meestest enam, kuid mehed kulutavad koolitustele rohkem aega (Randoja 2009).
Kui liita kokku tasulisele tööle ja kodutöödele kulunud aeg, saab ülevaate kogu naiste ja meeste töökoormusest. Et mehed veedavad naistest rohkem aega tasulist tööd tehes ja naised teevad meestest enam kodutöid, peaksid need tegurid üksteist tasakaalustama ja erinevused kogukoormuses ei tohiks olla kuigi suured (Deding ja Lausten 2006; Glorieuz ja Koelet 2002). Eestis osalevad naised ja mehed tööhõives üsna võrdsel määral, kuid kodutöödes on suur lõhe naiste kahjuks. Kui arvestada töötamise alla nii tasuline kui ka tasustamata töö, kulutavad naised sellele päevas keskmiselt 6 tundi ja 49 minutit, mehed tunni võrra vähem.
Tulemuste tõlgendamise seisukohast on oluline teada, kui suur on eri tegevustes osalemise määr ja kui palju on neid inimesi, kes mõnes tegevuses üldse ei osale. Tasulises töös osaleb kolmandik inimestest: 36% meestest ja 31% naistest. Need näitajad on märksa madalamad kui tööhõive määr, sest peale tööealise rahvastiku olid uuringusse kaasatud 10–14-aastased ja pensioniealised, kelle töötamisaktiivsus on üsna väike. Et suurem osa uurimisalusest rahvastikust olid täisealised, on õppijate osatähtsus üsna väike: hariduse omandamisega on tegelenud vaid kümnendik Eesti elanikest. Kodutöödes või lastehoius osalemine on tasulisest tööst palju rohkem levinud – 87% inimestest on teinud vähemalt mõnda majapidamistööd. Kui tasulist tööd teevad naised ja mehed peaaegu võrdselt, siis majapidamisega tegelevaid naisi on meestest palju rohkem. Peaaegu kõik (93%) naised on teinud kodutöid, viiendik meestest pole nendega aga üldse kokku puutunud. Magamise, muude isiklike tegevuste ja vaba aja veetmisega on tegelenud peaaegu kõik inimesed.
Muutused naiste ja meeste ajakasutuses
Ajakasutus nagu ka tõekspidamised ja sotsiaalsed normid muutuvad üsna aeglaselt, mistõttu ajakasutuse uurimine sobib eelkõige pikaajaliste muutuste kindlakstegemiseks. Inimesed ei muuda oma suhtumist üleöö ja suhtumise muutus ei kajastu kohe tegelikus käitumises. Kuigi arusaamad naiste ja meeste õiglasest tööjaotusest on muutunud palju uuenduslikumaks, pole see kodutööde jaotuses olulist erinevust kaasa toonud – naised teevad endiselt ära suurema osa majapidamistöödest (Sayer, England jt 2004). 2009. aasta soolise võrdõiguslikkuse monitooringu (Vainu jt 2010) kohaselt ei poolda kaks kolmandikku eestimaalastest seisukohta, et koduste tööde tegemise eest peaks vastutama ainult naine. Ometi on sama uuringu andmetel igapäevaste kodutööde tegemine peamiselt naiste õlul. Peale soorollide põhjustab ajakasutuse
SOOLISED ERINEVUSED AJAKASUTUSES GENDER DIFFERENCES IN TIME USE
MEHE KODU ON MAAILM, NAISE MAAILM ON KODU? MAN’S HOME IS THE WORLD, WOMAN’S WORLD IS HER HOME? 10
muutusi tehnika areng. Näiteks on inimeste vaba aja kasutust suuresti muutnud arvuti kasutuselevõtt ja tänu mitmesugustele kodumasinatele on lühenenud kodutöödele kuluv aeg. Ööpäeva 24-tunnise piirangu tõttu on osa ajakasutuse aspekte üsna stabiilsed ja muutused aja jaotuses ei saa olla väga suured. Mõningatele igapäevastele tegevustele kuluv aeg ei saa kaduda ega ka eriti väheneda, seega saab ülejäänud tegevustele kuluv aeg muutuda ainult järelejäänud ajavahemiku ulatuses.
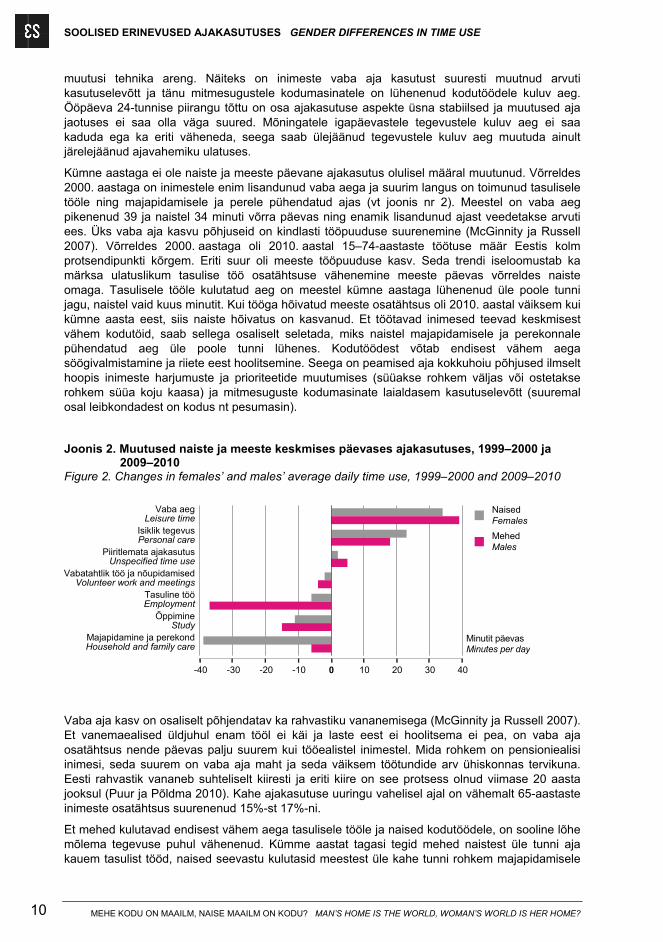
Kümne aastaga ei ole naiste ja meeste päevane ajakasutus olulisel määral muutunud. Võrreldes 2000. aastaga on inimestele enim lisandunud vaba aega ja suurim langus on toimunud tasulisele tööle ning majapidamisele ja perele pühendatud ajas (vt joonis nr 2). Meestel on vaba aeg pikenenud 39 ja naistel 34 minuti võrra päevas ning enamik lisandunud ajast veedetakse arvuti ees. Üks vaba aja kasvu põhjuseid on kindlasti tööpuuduse suurenemine (McGinnity ja Russell 2007). Võrreldes 2000. aastaga oli 2010. aastal 15–74-aastaste töötuse määr Eestis kolm protsendipunkti kõrgem. Eriti suur oli meeste tööpuuduse kasv. Seda trendi iseloomustab ka märksa ulatuslikum tasulise töö osatähtsuse vähenemine meeste päevas võrreldes naiste omaga. Tasulisele tööle kulutatud aeg on meestel kümne aastaga lühenenud üle poole tunni jagu, naistel vaid kuus minutit. Kui tööga hõivatud meeste osatähtsus oli 2010. aastal väiksem kui kümne aasta eest, siis naiste hõivatus on kasvanud. Et töötavad inimesed teevad keskmisest vähem kodutöid, saab sellega osaliselt seletada, miks naistel majapidamisele ja perekonnale pühendatud aeg üle poole tunni lühenes. Kodutöödest võtab endisest vähem aega söögivalmistamine ja riiete eest hoolitsemine. Seega on peamised aja kokkuhoiu põhjused ilmselt hoopis inimeste harjumuste ja prioriteetide muutumises (süüakse rohkem väljas või ostetakse rohkem süüa koju kaasa) ja mitmesuguste kodumasinate laialdasem kasutuselevõtt (suuremal osal leibkondadest on kodus nt pesumasin).
Joonis 2. Muutused naiste ja meeste keskmises päevases ajakasutuses, 1999–2000 ja 2009–2010
Figure 2. Changes in females’ and males’ average daily time use, 1999–2000 and 2009–2010
Majapidamine ja perekondHousehold and family care
ÕppimineStudy
Tasuline tööEmployment
Vabatahtlik töö ja nõupidamisedVolunteer work and meetings
Piiritlemata ajakasutusUnspecified time use
Isiklik tegevusPersonal care
Vaba aegLeisure time
-40 -30 -20 -10 0 10 20 30 40
NaisedFemales
MehedMales
Minutit päevasMinutes per day
Vaba aja kasv on osaliselt põhjendatav ka rahvastiku vananemisega (McGinnity ja Russell 2007). Et vanemaealised üldjuhul enam tööl ei käi ja laste eest ei hoolitsema ei pea, on vaba aja osatähtsus nende päevas palju suurem kui tööealistel inimestel. Mida rohkem on pensioniealisi inimesi, seda suurem on vaba aja maht ja seda väiksem töötundide arv ühiskonnas tervikuna. Eesti rahvastik vananeb suhteliselt kiiresti ja eriti kiire on see protsess olnud viimase 20 aasta jooksul (Puur ja Põldma 2010). Kahe ajakasutuse uuringu vahelisel ajal on vähemalt 65-aastaste inimeste osatähtsus suurenenud 15%-st 17%-ni.
Et mehed kulutavad endisest vähem aega tasulisele tööle ja naised kodutöödele, on sooline lõhe mõlema tegevuse puhul vähenenud. Kümme aastat tagasi tegid mehed naistest üle tunni aja kauem tasulist tööd, naised seevastu kulutasid meestest üle kahe tunni rohkem majapidamisele
SOOLISED ERINEVUSED AJAKASUTUSES GENDER DIFFERENCES IN TIME USE
MEHE KODU ON MAAILM, NAISE MAAILM ON KODU? MAN’S HOME IS THE WORLD, WOMAN’S WORLD IS HER HOME? 11
ja perele. Et aga toimunud muutused eri liiki töödes on olnud peaaegu sama suured, pole nende vahekord ega sooline lõhe kogu tehtud töös eriti muutunud.
Naiste ja meeste ajakasutus Euroopa riikides
See, kuidas naised ja mehed oma aega kulutavad ja kuidas nad omavahel ülesanded jagavad, oleneb paljudest teguritest. Üsna oluline inimeste igapäevaelu mõjutaja on elukohariik (McGinnity ja Russell 2008). Keskmist tööaega mõjutavad näiteks riigis levinud hõivenäitajad, tööaega reguleerivad seadused ja osaajatöö populaarsus. Leibkonnasisene tööjaotus ja võimalus kombineerida tööd pereeluga oleneb riigi sotsiaalpoliitikast, toetuste süsteemist ning pakutavatest teenustest ja võimalustest. Peale selle mõjutavad naiste ja meeste ajakasutust riigis ja kogukonnas kehtivad soorollid ja hoiakud.
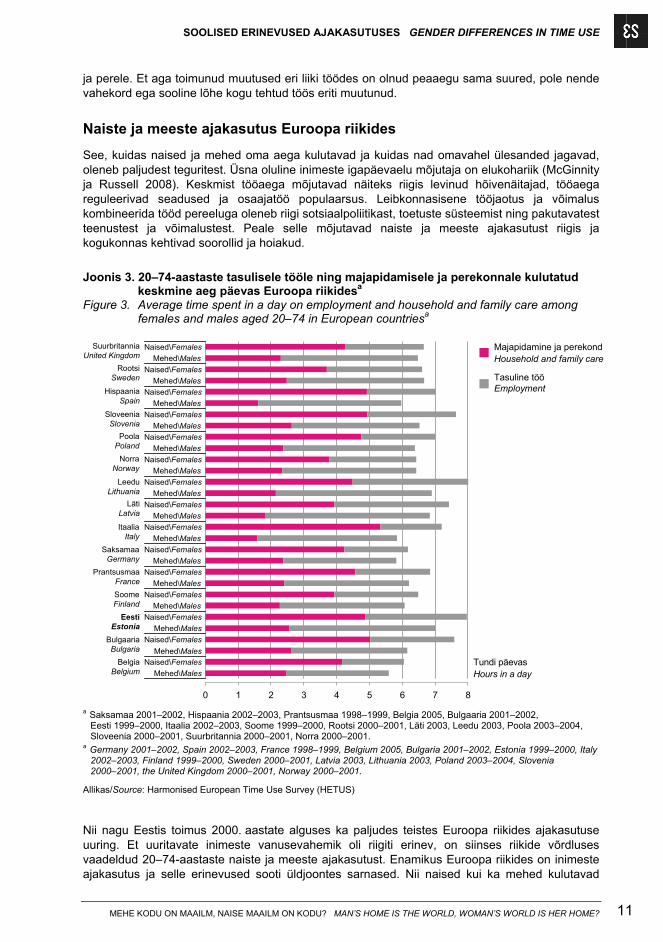
Joonis 3. 20–74-aastaste tasulisele tööle ning majapidamisele ja perekonnale kulutatud
keskmine aeg päevas Euroopa riikidesa
Figure 3. Average time spent in a day on employment and household and family care among females and males aged 20–74 in European countriesa
Mehed\Males
Naised\FemalesMehed\Males
Naised\Females
Mehed\Males
Naised\Females
Mehed\Males
Naised\Females
Mehed\Males
Naised\Females
Mehed\Males
Naised\Females
Mehed\Males
Naised\Females
Mehed\Males
Naised\Females
Mehed\Males
Naised\Females
Mehed\Males
Naised\Females
Mehed\Males
Naised\Females
Mehed\Males
Naised\Females
Mehed\Males
Naised\Females
Mehed\Males
Naised\Females
Mehed\Males
Naised\Females
0 1 2 3 4 5 6 7 8
Majapidamine ja perekondHousehold and family care
Tasuline tööEmployment
Tundi päevasHours in a day
BelgiaBelgium
BulgaariaBulgaria
EestiEstonia
SoomeFinland
PrantsusmaaFrance
SaksamaaGermany
ItaaliaItaly
LätiLatvia
LeeduLithuania
NorraNorway
PoolaPoland
SloveeniaSlovenia
HispaaniaSpain
RootsiSweden
SuurbritanniaUnited Kingdom
a Saksamaa 2001–2002, Hispaania 2002–2003, Prantsusmaa 1998–1999, Belgia 2005, Bulgaaria 2001–2002,
Eesti 1999–2000, Itaalia 2002–2003, Soome 1999–2000, Rootsi 2000–2001, Läti 2003, Leedu 2003, Poola 2003–2004, Sloveenia 2000–2001, Suurbritannia 2000–2001, Norra 2000–2001.
a Germany 2001–2002, Spain 2002–2003, France 1998–1999, Belgium 2005, Bulgaria 2001–2002, Estonia 1999–2000, Italy 2002–2003, Finland 1999–2000, Sweden 2000–2001, Latvia 2003, Lithuania 2003, Poland 2003–2004, Slovenia 2000–2001, the United Kingdom 2000–2001, Norway 2000–2001.
Allikas/Source: Harmonised European Time Use Survey (HETUS)
Nii nagu Eestis toimus 2000. aastate alguses ka paljudes teistes Euroopa riikides ajakasutuse uuring. Et uuritavate inimeste vanusevahemik oli riigiti erinev, on siinses riikide võrdluses vaadeldud 20–74-aastaste naiste ja meeste ajakasutust. Enamikus Euroopa riikides on inimeste ajakasutus ja selle erinevused sooti üldjoontes sarnased. Nii naised kui ka mehed kulutavad
SOOLISED ERINEVUSED AJAKASUTUSES GENDER DIFFERENCES IN TIME USE
MEHE KODU ON MAAILM, NAISE MAAILM ON KODU? MAN’S HOME IS THE WORLD, WOMAN’S WORLD IS HER HOME? 12
peaaegu poole ööpäevast magamisele, söömisele ja muudele isiklikele toimingutele. Kõige pikem uneaeg on Prantsusmaa elanikel. Kõikides riikides peale Eesti, kus naiste ja meeste uneaeg on võrdne, kulutavad naised magamisele meestest veidi rohkem aega. Vaba aega on kõikides riikides meestel naistest rohkem. Kõige suurem on sooline lõhe Sloveenias ja Leedus, kus meestel on vaba aega naistest veidi üle tunni võrra rohkem. Peaaegu ühepalju on vaba aega Norra ja Rootsi naistel ja meestel.
Kõige suuremad erinevused riikide vahel on naiste ja meeste tööjaotuses (vt joonis nr 3). Mehed kulutavad igal pool rohkem aega tasulisele tööle kui kodutöödele. Kahe töö erinevus on kõige suurem Lätis, kus mehed tegelevad tasulise tööga üle kolme tunni kauem kui majapidamisega. Belgia mehed aga teevad kodutöid ja tasulist tööd peaaegu samas mahus (erinevus on 40 minutit). Naiste puhul kehtib vastupidine: kodutöödele kuluv aeg on pikem kui tasulise töö aeg. Kodutööde ja tasulise töö vaheline erinevus on suurim Hispaania naistel (2 h ja 49 min) ja väikseim Läti naistel (27 min). Soolised erinevused näitavad osaliselt naiste ja meeste erinevaid hõivemäärasid ja osalise tööajaga töötamise sagedust eri riikides.
Kõige rohkem pühendavad majapidamisele ja perekonnale aega Itaalia ja Bulgaaria naised, kes veedavad kodutöid tehes üle viie tunni päevas. Peaaegu viis tundi kulub kodutöödele veel Hispaania, Sloveenia ja Eesti naistel. Kõige vähem aega – alla nelja tunni – veedavad majapidamises Rootsi, Norra, Soome ja Läti naised. Meestest on kõige tublimad kodutööde tegijad Sloveenia, Bulgaaria, Eesti ja Rootsi mehed, kellel kulub nendele tegevustele keskmiselt kaks ja pool tundi päevas. Kõige vähem kulutavad kodutöödele aega Itaalia ja Hispaania mehed. Seega on soolised erinevused kodutööde ajas suurimad Itaalias ja Hispaanias ning väikseimad Põhjamaades. Naiste ja meeste ajaline lõhe tasulises töös on suurim Itaalias ja Hispaanias ning väikseim Bulgaarias ja Sloveenias. Tööjaotus on ebavõrdsem traditsionaalsema rollijaotusega riikides.
Mehed kulutavad päevas naistest vähemalt ühe tunni rohkem tasulisele tööle ja naised vähemalt ühe tunni enam majapidamisele ja perele. Kui võtta arvesse mõlemad tööd, on naiste kogutööaeg meeste omaga peaaegu võrdne Rootsis, Norras ja Suurbritannias. Kõige suuremad soolised erinevused kogutöömahus on Bulgaarias ja Itaalias, kus naised töötavad meestest päevas peaaegu poolteist tundi kauem. Eestis kulub 20–74-aastastel naistel töötamiseks tunni võrra rohkem aega kui meestel.
Tööjaotus ja kogutööaeg
Soolisi erinevusi aja jagamisel eri tüüpi tööde vahel on paljudes riikides (Aliaga ja Winqvist 2003; McGinnity ja Russell 2008; Sayer, England jt 2004). Kui mehed pühendavad keskmiselt rohkem aega tasustatud tööle, siis naiste peamine töö on majapidamise korrashoid ja laste eest hoolitsemine. Selline tööjaotus on pärit aegadest, kui toimis mudel, et leivateenija on mees: meeste ülesanne oli käia tööl ja teenida raha, samal ajal kui naised olid enamasti kodus ja vaid vähesed neist osalesid tööhõives (Wharton 2005). Pärast Teist maailmasõda toimunud naiste hulgaline siirdumine tööturule on kaasa toonud naiste tasustatud tööle kulutatud aja pikenemise ja kahe leivateenijaga perekondade osa suurenemise. Ometi pole soorollid ühiskonnast kuhugi kadunud – meeste sisenemine nn naiste valdkonda on jäänud palju tagasihoidlikumaks kui naiste tung tööturule (McGinnity ja Russell 2008). Väidetavalt on see naistele kaasa toonud palju suurema kogutöökoormuse – pärast palgatööd järgneb nn teine (töö)vahetus kodus (Hochschild ja Machung 1989). Soolised erinevused töötatud aja kogupikkuses aga on ebaselged. Lisandunud vahetuse ideed on võimalik tõlgendada sõna-sõnalt ja järeldada, et naised on oma töökoormust kahekordistanud. Selline lähenemine tooks kaasa suured erinevused naiste ja meeste kogutööpikkuses. Levinum on siiski seisukoht, et tasulisele tööle kulutatud aja pikenemise tõttu on naised lühendanud, ehkki mitte samas mahus, majapidamisele ja perele pühendatud aega. See tähendab, et naiste kogutööaeg on meeste omast küll pikem, kuid erinevused on üsna väikesed (McGinnity ja Russell 2008; Bittman ja Wajcman 1999).
Eestis on naiste ja meeste tööjaotus kujunenud veidi teisiti kui lääneriikides. Kuigi naised ja mehed on juba aastaid tööturul osalenud üsna võrdsetel alustel, ei ole see kaasa toonud
SOOLISED ERINEVUSED AJAKASUTUSES GENDER DIFFERENCES IN TIME USE
MEHE KODU ON MAAILM, NAISE MAAILM ON KODU? MAN’S HOME IS THE WORLD, WOMAN’S WORLD IS HER HOME? 13
võrdsust kodutöödele kulutatud ajas (Vainu 2010). Osaliselt peituvad selle põhjused ajaloos. Nõukogude ajal valitses sugude vahel näiline võrdsus ja tööturul olid aktiivsed nii naised kui ka mehed. Võrdsus ei laienenud aga privaatsfääri. Naistelt oodati, et nad vastutaks kogu koduse elu eest ja emarolli nähti kui naiste sotsiaalset kohustust (Einhorn 1993). Naiste töökoormust püüti leevendada, sotsialiseerides osa kodutöödest ja lastehoiust (rajati sööklaid, pesumaju, lasteaedu), kuid see vähendas naiste kodutööde mahtu vaid osaliselt. Naiste tööhõive määr on Eestis endiselt peaaegu võrdne meeste vastava näitajaga (2010. aastal töötas 15–74-aastastest meestest 57% ja sama vanadest naistest 54%), soolised erinevused kodutöödes on aga suured. See tähendab, et eri liiki töödele panustatud ajal on naiste ööpäevas suurem osa kui meeste omas, mille tulemusena jääb naistel järele vähem vaba aega. Meeste kodutöödele kulutatud aega aitab pikendada naiste aktiivsem osalemine tööhõives, tänu millele on perekonnas mitu leivateenijat, mis võimaldab ka meestel rohkem aega perele ja kodule pühendada. Eestis on 39% leibkondadest ühe töötava liikmega, neljandikus leibkondadest on aga vähemalt kaks töötavat liiget. Selliseid leibkondi, kus keegi ei tööta, on 37%, enamik neist pensionärileibkonnad.
Naiste ja meeste ebavõrdset tööjaotust ja nende erinevust kodutöödele pühendatud ajas on põhjendatud mitmeti. Soolise lõhe selgituseks on kirjanduses sageli toodud mitut majanduslikku, aga ka otseselt soost tulenevat põhjust. Beckeri (1991) teooria kohaselt spetsialiseeruvad nii naised kui ka mehed sellele tööle, kus neil on suhteliselt suurem tootlikkus. Seega, kui mees on tootlikum tööturul (teenib rohkem raha kui naine), on leibkonnale kasulikum, kui mees teeb suurema osa tasulisest tööst ja naine suurema osa kodutöödest. Naised spetsialiseeruvad kodutööle eelkõige oma väiksema inimkapitali ja bioloogiliste erinevuste tõttu (neil on meeste ees bioloogiline eelis lastega tegelemiseks). Töödele spetsialiseerumine ei tohiks kaasa tuua erinevust kogutööajas. Beckeri teooriaga sarnane põhjendus toetub partnerite saadaval olevale ajale ja tegemist vajavate kodutööde mahule. Majapidamisega tegeleb see partner, kellel jääb tasulisest tööst rohkem aega järele. Seejuures mõjutavad tasustatud tööl veedetud aeg ning laste arv ja vanus kodutöödele kuluvat aega rohkem naistel kui meestel. (McGinnity ja Russell 2008)
McGinnity ja Russelli (2008) järgi võib ebavõrdne kodutööde jaotus olla tingitud ka leibkonna võimusuhetest. Majapidamise kui vähem ihaldusväärse tööga tegeleb partneritest see, kellel on leibkonnas vähem ressursse (nt madalam haridus, palk või ametikoht). Erinevust tööde jaotuses on võimalik seletada ka ühiskonnas kehtivate soorollidega – tehes erinevaid töid, tegutsevad naised ja mehed oma soole ootuspäraselt. Seega ei pruugi ebavõrdsem tööjaotus tunduda ebaõiglasem, kui see on kooskõlas ühiskonnas tunnustatud tavadega. Soorollid seletavad ka seda, miks töötud või mitteaktiivsed mehed teevad kodutöid vähem kui nende tööl käivad naised. Samal ajal sõltub leibkonnasisene tööjaotus ka selle liikmete suhtumisest kodutöödesse ja nende õiglustundest. Uuenduslikumate vaadetega naised ja mehed jagavad majapidamistööd võrdsemalt. Leibkondades, kus arusaamad õiglasest tööde jaotusest ei kattu, on seetõttu sagedamini pingeid ja tülisid. (McGinnity ja Russell 2008)
Järgnevalt on vaatluse all soolised erinevused kogutöökoormuses ning tööjaotus eri nädalapäevadel ja eri sotsiaal-demograafiliste tunnuste kaupa. Lahknevus naiste ja meeste kogutööajas näitab, et juurdepääs vabale ehk hõivamata ajale erineb sooti. Hõivatud aeg on kombinatsioon tasulisele tööle ja õppimisele ning majapidamisele ja perele pühendatud ajast. Kohustustevaba ehk hõivamata aeg tähendab isiklikele tegevustele, vabatahtlikule tööle ja puhkusele ning meelelahutusele kuluvat aega.
2010. aastal kulus naistel päevas kõigi tööde peale kokku 7 tundi ja 19 minutit, meestel 6 tundi ja 28 minutit. Seega on naiste kogutööaeg Eestis ligi tunni jagu pikem kui meestel, kuid tööd jagunevad sooti erinevalt. Suur osa naiste hõivatud ajast on tasustamata – naistel hõlmab tasulisele tööle ja õppimisele kulunud aeg kogutöömahust vaid 44%. Mehed on seevastu rohkem seotud enamasti kodust väljapoole jäävaga, kulutades seal 60% oma hõivatud ajast.
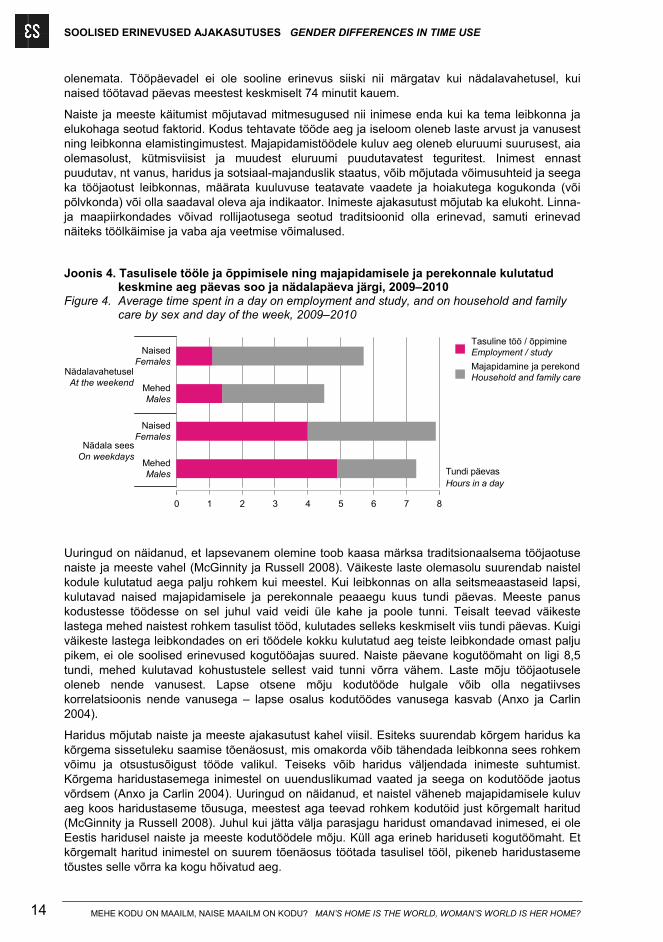
Tööjaotus varieerub töö- ja puhkepäeviti suurel määral (vt joonis nr 4). Kui nädala sees kulub naistel ja meestel üle poole hõivatud ajast tasulisele tööle ja õppimisele, siis nädalavahetusel on suurem osa kohustustest seotud majapidamistöödega. Eriti suur on nädalavahetuseti kodutööde osatähtsus naistel – 81% kogu hõivatud ajast. Kui liita majapidamistöödele ka tasulisel tööl ja koolis veedetud tunnid, selgub, et naiste kogutöömaht on meeste omast suurem nädalapäevast
SOOLISED ERINEVUSED AJAKASUTUSES GENDER DIFFERENCES IN TIME USE
MEHE KODU ON MAAILM, NAISE MAAILM ON KODU? MAN’S HOME IS THE WORLD, WOMAN’S WORLD IS HER HOME? 14
olenemata. Tööpäevadel ei ole sooline erinevus siiski nii märgatav kui nädalavahetusel, kui naised töötavad päevas meestest keskmiselt 74 minutit kauem.
Naiste ja meeste käitumist mõjutavad mitmesugused nii inimese enda kui ka tema leibkonna ja elukohaga seotud faktorid. Kodus tehtavate tööde aeg ja iseloom oleneb laste arvust ja vanusest ning leibkonna elamistingimustest. Majapidamistöödele kuluv aeg oleneb eluruumi suurusest, aia olemasolust, kütmisviisist ja muudest eluruumi puudutavatest teguritest. Inimest ennast puudutav, nt vanus, haridus ja sotsiaal-majanduslik staatus, võib mõjutada võimusuhteid ja seega ka tööjaotust leibkonnas, määrata kuuluvuse teatavate vaadete ja hoiakutega kogukonda (või põlvkonda) või olla saadaval oleva aja indikaator. Inimeste ajakasutust mõjutab ka elukoht. Linna- ja maapiirkondades võivad rollijaotusega seotud traditsioonid olla erinevad, samuti erinevad näiteks töölkäimise ja vaba aja veetmise võimalused.
Joonis 4. Tasulisele tööle ja õppimisele ning majapidamisele ja perekonnale kulutatud keskmine aeg päevas soo ja nädalapäeva järgi, 2009–2010
Figure 4. Average time spent in a day on employment and study, and on household and family care by sex and day of the week, 2009–2010
MehedMales
NaisedFemales
MehedMales
NaisedFemales
Tasuline töö / õppimineEmployment / study
Majapidamine ja perekondHousehold and family care
Tundi päevasHours in a day
NädalavahetuselAt the weekend
Nädala seesOn weekdays
0 1 2 3 4 5 6 7 8
Uuringud on näidanud, et lapsevanem olemine toob kaasa märksa traditsionaalsema tööjaotuse naiste ja meeste vahel (McGinnity ja Russell 2008). Väikeste laste olemasolu suurendab naistel kodule kulutatud aega palju rohkem kui meestel. Kui leibkonnas on alla seitsmeaastaseid lapsi, kulutavad naised majapidamisele ja perekonnale peaaegu kuus tundi päevas. Meeste panus kodustesse töödesse on sel juhul vaid veidi üle kahe ja poole tunni. Teisalt teevad väikeste lastega mehed naistest rohkem tasulist tööd, kulutades selleks keskmiselt viis tundi päevas. Kuigi väikeste lastega leibkondades on eri töödele kokku kulutatud aeg teiste leibkondade omast palju pikem, ei ole soolised erinevused kogutööajas suured. Naiste päevane kogutöömaht on ligi 8,5 tundi, mehed kulutavad kohustustele sellest vaid tunni võrra vähem. Laste mõju tööjaotusele oleneb nende vanusest. Lapse otsene mõju kodutööde hulgale võib olla negatiivses korrelatsioonis nende vanusega – lapse osalus kodutöödes vanusega kasvab (Anxo ja Carlin 2004).
Haridus mõjutab naiste ja meeste ajakasutust kahel viisil. Esiteks suurendab kõrgem haridus ka kõrgema sissetuleku saamise tõenäosust, mis omakorda võib tähendada leibkonna sees rohkem võimu ja otsustusõigust tööde valikul. Teiseks võib haridus väljendada inimeste suhtumist. Kõrgema haridustasemega inimestel on uuenduslikumad vaated ja seega on kodutööde jaotus võrdsem (Anxo ja Carlin 2004). Uuringud on näidanud, et naistel väheneb majapidamisele kuluv aeg koos haridustaseme tõusuga, meestest aga teevad rohkem kodutöid just kõrgemalt haritud (McGinnity ja Russell 2008). Juhul kui jätta välja parasjagu haridust omandavad inimesed, ei ole Eestis haridusel naiste ja meeste kodutöödele mõju. Küll aga erineb hariduseti kogutöömaht. Et kõrgemalt haritud inimestel on suurem tõenäosus töötada tasulisel tööl, pikeneb haridustaseme tõustes selle võrra ka kogu hõivatud aeg.
SOOLISED ERINEVUSED AJAKASUTUSES GENDER DIFFERENCES IN TIME USE
MEHE KODU ON MAAILM, NAISE MAAILM ON KODU? MAN’S HOME IS THE WORLD, WOMAN’S WORLD IS HER HOME? 15
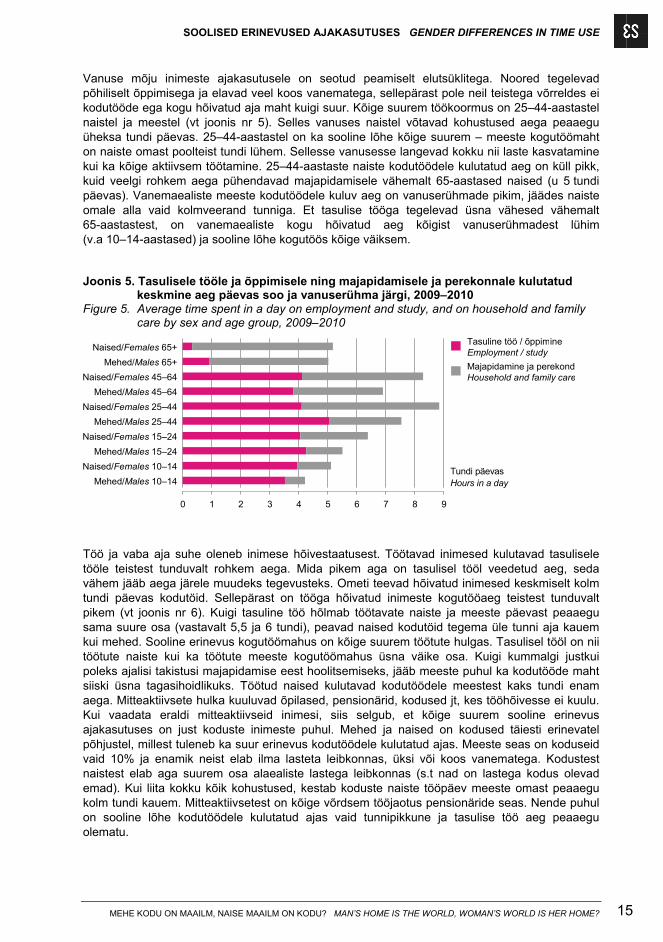
Vanuse mõju inimeste ajakasutusele on seotud peamiselt elutsüklitega. Noored tegelevad põhiliselt õppimisega ja elavad veel koos vanematega, sellepärast pole neil teistega võrreldes ei kodutööde ega kogu hõivatud aja maht kuigi suur. Kõige suurem töökoormus on 25–44-aastastel naistel ja meestel (vt joonis nr 5). Selles vanuses naistel võtavad kohustused aega peaaegu üheksa tundi päevas. 25–44-aastastel on ka sooline lõhe kõige suurem – meeste kogutöömaht on naiste omast poolteist tundi lühem. Sellesse vanusesse langevad kokku nii laste kasvatamine kui ka kõige aktiivsem töötamine. 25–44-aastaste naiste kodutöödele kulutatud aeg on küll pikk, kuid veelgi rohkem aega pühendavad majapidamisele vähemalt 65-aastased naised (u 5 tundi päevas). Vanemaealiste meeste kodutöödele kuluv aeg on vanuserühmade pikim, jäädes naiste omale alla vaid kolmveerand tunniga. Et tasulise tööga tegelevad üsna vähesed vähemalt 65-aastastest, on vanemaealiste kogu hõivatud aeg kõigist vanuserühmadest lühim (v.a 10–14-aastased) ja sooline lõhe kogutöös kõige väiksem.
Joonis 5. Tasulisele tööle ja õppimisele ning majapidamisele ja perekonnale kulutatud keskmine aeg päevas soo ja vanuserühma järgi, 2009–2010
Figure 5. Average time spent in a day on employment and study, and on household and family care by sex and age group, 2009–2010
Mehed/Males 10–14
Naised/Females 10–14
Mehed/Males 15–24
Naised/Females 15–24
Mehed/Males 25–44
Naised/Females 25–44
Mehed/Males 45–64
Naised/Females 45–64
Mehed/Males 65+
Naised/Females 65+
0 1 2 3 4 5 6 7 8 9
Tasuline töö / õppimineEmployment / study
Majapidamine ja perekondHousehold and family care
Tundi päevasHours in a day
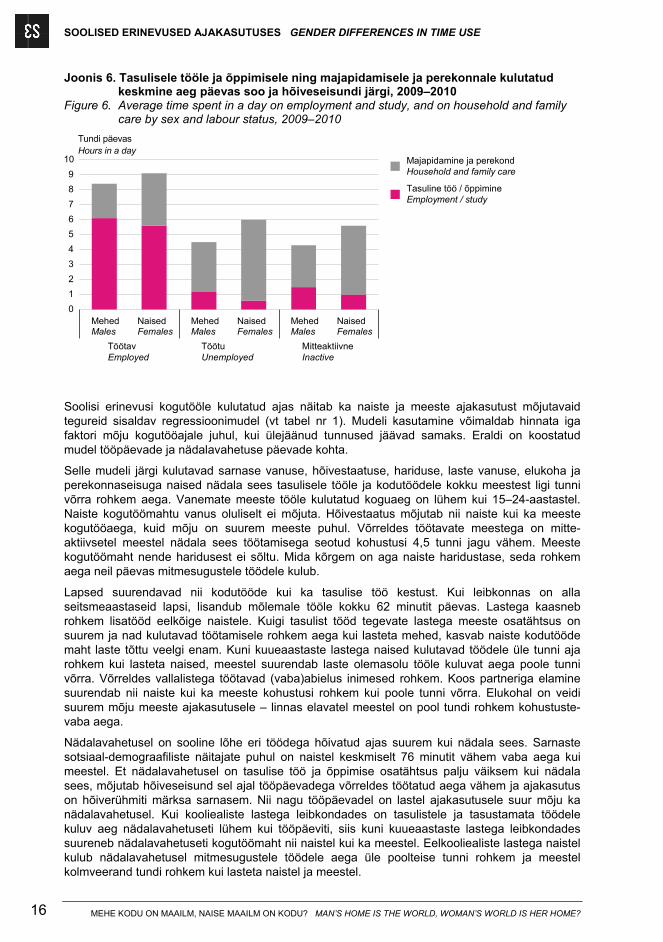
Töö ja vaba aja suhe oleneb inimese hõivestaatusest. Töötavad inimesed kulutavad tasulisele tööle teistest tunduvalt rohkem aega. Mida pikem aga on tasulisel tööl veedetud aeg, seda vähem jääb aega järele muudeks tegevusteks. Ometi teevad hõivatud inimesed keskmiselt kolm tundi päevas kodutöid. Sellepärast on tööga hõivatud inimeste kogutööaeg teistest tunduvalt pikem (vt joonis nr 6). Kuigi tasuline töö hõlmab töötavate naiste ja meeste päevast peaaegu sama suure osa (vastavalt 5,5 ja 6 tundi), peavad naised kodutöid tegema üle tunni aja kauem kui mehed. Sooline erinevus kogutöömahus on kõige suurem töötute hulgas. Tasulisel tööl on nii töötute naiste kui ka töötute meeste kogutöömahus üsna väike osa. Kuigi kummalgi justkui poleks ajalisi takistusi majapidamise eest hoolitsemiseks, jääb meeste puhul ka kodutööde maht siiski üsna tagasihoidlikuks. Töötud naised kulutavad kodutöödele meestest kaks tundi enam aega. Mitteaktiivsete hulka kuuluvad õpilased, pensionärid, kodused jt, kes tööhõivesse ei kuulu. Kui vaadata eraldi mitteaktiivseid inimesi, siis selgub, et kõige suurem sooline erinevus ajakasutuses on just koduste inimeste puhul. Mehed ja naised on kodused täiesti erinevatel põhjustel, millest tuleneb ka suur erinevus kodutöödele kulutatud ajas. Meeste seas on koduseid vaid 10% ja enamik neist elab ilma lasteta leibkonnas, üksi või koos vanematega. Kodustest naistest elab aga suurem osa alaealiste lastega leibkonnas (s.t nad on lastega kodus olevad emad). Kui liita kokku kõik kohustused, kestab koduste naiste tööpäev meeste omast peaaegu kolm tundi kauem. Mitteaktiivsetest on kõige võrdsem tööjaotus pensionäride seas. Nende puhul on sooline lõhe kodutöödele kulutatud ajas vaid tunnipikkune ja tasulise töö aeg peaaegu olematu.
SOOLISED ERINEVUSED AJAKASUTUSES GENDER DIFFERENCES IN TIME USE
MEHE KODU ON MAAILM, NAISE MAAILM ON KODU? MAN’S HOME IS THE WORLD, WOMAN’S WORLD IS HER HOME? 16
Joonis 6. Tasulisele tööle ja õppimisele ning majapidamisele ja perekonnale kulutatud keskmine aeg päevas soo ja hõiveseisundi järgi, 2009–2010
Figure 6. Average time spent in a day on employment and study, and on household and family care by sex and labour status, 2009–2010
MehedMales
NaisedFemales
MehedMales
NaisedFemales
MehedMales
NaisedFemales
0
1
2
3
4
5
6
7
8
9
10
Tasuline töö / õppimineEmployment / study
Majapidamine ja perekondHousehold and family care
Tundi päevasHours in a day
TöötavEmployed
TöötuUnemployed
MitteaktiivneInactive
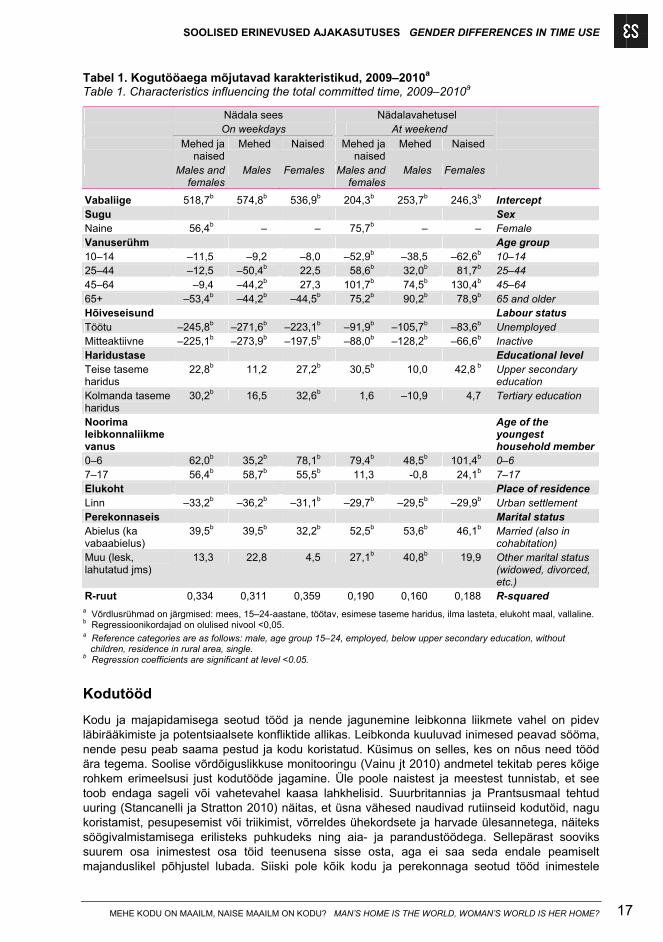
Soolisi erinevusi kogutööle kulutatud ajas näitab ka naiste ja meeste ajakasutust mõjutavaid tegureid sisaldav regressioonimudel (vt tabel nr 1). Mudeli kasutamine võimaldab hinnata iga faktori mõju kogutööajale juhul, kui ülejäänud tunnused jäävad samaks. Eraldi on koostatud mudel tööpäevade ja nädalavahetuse päevade kohta.
Selle mudeli järgi kulutavad sarnase vanuse, hõivestaatuse, hariduse, laste vanuse, elukoha ja perekonnaseisuga naised nädala sees tasulisele tööle ja kodutöödele kokku meestest ligi tunni võrra rohkem aega. Vanemate meeste tööle kulutatud koguaeg on lühem kui 15–24-aastastel. Naiste kogutöömahtu vanus oluliselt ei mõjuta. Hõivestaatus mõjutab nii naiste kui ka meeste kogutööaega, kuid mõju on suurem meeste puhul. Võrreldes töötavate meestega on mitte-aktiivsetel meestel nädala sees töötamisega seotud kohustusi 4,5 tunni jagu vähem. Meeste kogutöömaht nende haridusest ei sõltu. Mida kõrgem on aga naiste haridustase, seda rohkem aega neil päevas mitmesugustele töödele kulub.
Lapsed suurendavad nii kodutööde kui ka tasulise töö kestust. Kui leibkonnas on alla seitsmeaastaseid lapsi, lisandub mõlemale tööle kokku 62 minutit päevas. Lastega kaasneb rohkem lisatööd eelkõige naistele. Kuigi tasulist tööd tegevate lastega meeste osatähtsus on suurem ja nad kulutavad töötamisele rohkem aega kui lasteta mehed, kasvab naiste kodutööde maht laste tõttu veelgi enam. Kuni kuueaastaste lastega naised kulutavad töödele üle tunni aja rohkem kui lasteta naised, meestel suurendab laste olemasolu tööle kuluvat aega poole tunni võrra. Võrreldes vallalistega töötavad (vaba)abielus inimesed rohkem. Koos partneriga elamine suurendab nii naiste kui ka meeste kohustusi rohkem kui poole tunni võrra. Elukohal on veidi suurem mõju meeste ajakasutusele – linnas elavatel meestel on pool tundi rohkem kohustuste-vaba aega.
Nädalavahetusel on sooline lõhe eri töödega hõivatud ajas suurem kui nädala sees. Sarnaste sotsiaal-demograafiliste näitajate puhul on naistel keskmiselt 76 minutit vähem vaba aega kui meestel. Et nädalavahetusel on tasulise töö ja õppimise osatähtsus palju väiksem kui nädala sees, mõjutab hõiveseisund sel ajal tööpäevadega võrreldes töötatud aega vähem ja ajakasutus on hõiverühmiti märksa sarnasem. Nii nagu tööpäevadel on lastel ajakasutusele suur mõju ka nädalavahetusel. Kui kooliealiste lastega leibkondades on tasulistele ja tasustamata töödele kuluv aeg nädalavahetuseti lühem kui tööpäeviti, siis kuni kuueaastaste lastega leibkondades suureneb nädalavahetuseti kogutöömaht nii naistel kui ka meestel. Eelkooliealiste lastega naistel kulub nädalavahetusel mitmesugustele töödele aega üle poolteise tunni rohkem ja meestel kolmveerand tundi rohkem kui lasteta naistel ja meestel.
SOOLISED ERINEVUSED AJAKASUTUSES GENDER DIFFERENCES IN TIME USE
MEHE KODU ON MAAILM, NAISE MAAILM ON KODU? MAN’S HOME IS THE WORLD, WOMAN’S WORLD IS HER HOME? 17
Tabel 1. Kogutööaega mõjutavad karakteristikud, 2009–2010a Table 1. Characteristics influencing the total committed time, 2009–2010a
Nädala sees Nädalavahetusel On weekdays At weekend Mehed ja
naisedMehed Naised Mehed ja
naisedMehed Naised
Males and females
Males Females Males and females
Males Females
Vabaliige 518,7b 574,8b 536,9b 204,3b 253,7b 246,3b Intercept Sugu Sex Naine 56,4b – – 75,7b – – Female Vanuserühm Age group 10–14 –11,5 –9,2 –8,0 –52,9b –38,5 –62,6b 10–14 25–44 –12,5 –50,4b 22,5 58,6b 32,0b 81,7b 25–44 45–64 –9,4 –44,2b 27,3 101,7b 74,5b 130,4b 45–64 65+ –53,4b –44,2b –44,5b 75,2b 90,2b 78,9b 65 and older Hõiveseisund Labour status Töötu –245,8b –271,6b –223,1b –91,9b –105,7b –83,6b Unemployed Mitteaktiivne –225,1b –273,9b –197,5b –88,0b –128,2b –66,6b Inactive Haridustase Educational level Teise taseme haridus
22,8b 11,2 27,2b 30,5b 10,0 42,8 b Upper secondary education
Kolmanda taseme haridus
30,2b 16,5 32,6b 1,6 –10,9 4,7 Tertiary education
Noorima leibkonnaliikme vanus
Age of the youngest household member
0–6 62,0b 35,2b 78,1b 79,4b 48,5b 101,4b 0–6 7–17 56,4b 58,7b 55,5b 11,3 -0,8 24,1b 7–17 Elukoht Place of residence Linn –33,2b –36,2b –31,1b –29,7b –29,5b –29,9b Urban settlement Perekonnaseis Marital status Abielus (ka vabaabielus)
39,5b 39,5b 32,2b 52,5b 53,6b 46,1b Married (also in cohabitation)
Muu (lesk, lahutatud jms)
13,3 22,8 4,5 27,1b 40,8b 19,9 Other marital status (widowed, divorced, etc.)
R-ruut 0,334 0,311 0,359 0,190 0,160 0,188 R-squared a Võrdlusrühmad on järgmised: mees, 15–24-aastane, töötav, esimese taseme haridus, ilma lasteta, elukoht maal, vallaline. b Regressioonikordajad on olulised nivool <0,05. a Reference categories are as follows: male, age group 15–24, employed, below upper secondary education, without
children, residence in rural area, single. b Regression coefficients are significant at level <0.05.
Kodutööd
Kodu ja majapidamisega seotud tööd ja nende jagunemine leibkonna liikmete vahel on pidev läbirääkimiste ja potentsiaalsete konfliktide allikas. Leibkonda kuuluvad inimesed peavad sööma, nende pesu peab saama pestud ja kodu koristatud. Küsimus on selles, kes on nõus need tööd ära tegema. Soolise võrdõiguslikkuse monitooringu (Vainu jt 2010) andmetel tekitab peres kõige rohkem erimeelsusi just kodutööde jagamine. Üle poole naistest ja meestest tunnistab, et see toob endaga sageli või vahetevahel kaasa lahkhelisid. Suurbritannias ja Prantsusmaal tehtud uuring (Stancanelli ja Stratton 2010) näitas, et üsna vähesed naudivad rutiinseid kodutöid, nagu koristamist, pesupesemist või triikimist, võrreldes ühekordsete ja harvade ülesannetega, näiteks söögivalmistamisega erilisteks puhkudeks ning aia- ja parandustöödega. Sellepärast sooviks suurem osa inimestest osa töid teenusena sisse osta, aga ei saa seda endale peamiselt majanduslikel põhjustel lubada. Siiski pole kõik kodu ja perekonnaga seotud tööd inimestele
SOOLISED ERINEVUSED AJAKASUTUSES GENDER DIFFERENCES IN TIME USE
MEHE KODU ON MAAILM, NAISE MAAILM ON KODU? MAN’S HOME IS THE WORLD, WOMAN’S WORLD IS HER HOME? 18
vastumeelsed (nt lastehoid), osa neist hoopis suurendavad heaolu ja nende üks ühele asendamine pakutavate teenustega pole võimalik (ibid.).
Naised kulutavad meestest rohkem aega majapidamisele ja perekonnale, kuid peale ajaliste erinevuste on väga suured erinevused ka majapidamistööde jaotuses naiste ja meeste vahel. Töö iseloomu ja peamise tegija järgi on võimalik eristada naiste- ja meestetöid. Meestetööd on need, mida on traditsiooniliselt teinud mehed, näiteks mitmesugused juhutööd majapidamises. Naistetööd on olnud näiteks söögitegemine, nõudepesemine, koristamine, pesupesemine ja triikimine. Ülejäänud ülesanded, nagu arvete tasumine ja muud asjaajamisega seotud tegevused, on olnud naiste ja meeste vahel võrdselt jagatud ja loetakse seega neutraalseteks töödeks. Naiste ja meeste töid iseloomustab peale soo veel kolm dimensiooni. Esiteks on naiste tehtavad tööd sageli rutiinsed, paindumatud tegevused, mida peab tegema iga päev kindlal ajal ja mida ei saa edasi lükata. Meestetööd on seevastu ülesanded, mida saab planeerida ja teha endale sobival ajal. Teiseks on naistetööd meeste omadega võrreldes sageli vähem loomingulised, meestetöödel aga võib mõnikord olla isegi meelelahutuslik väärtus. Kolmandaks on naistetööd sagedamini tehtavad siseruumides ja meestetööd õues. Tööde liigitamine soo järgi ei tähenda, et naised ei võiks teha meestetöid või vastupidi. Samal ajal on selline tööde sildistamine üks põhjuseid, miks mehed ei taha teha nn naistetöid. Teine probleem seisneb selles, et naistetöid tajutakse sageli koormavana kui meestetöid. Võrreldes tüüpiliste meestetöödega, tehakse naistetöid harva tegevuse nautimise pärast. (Glorieux ja Koelet 2001)
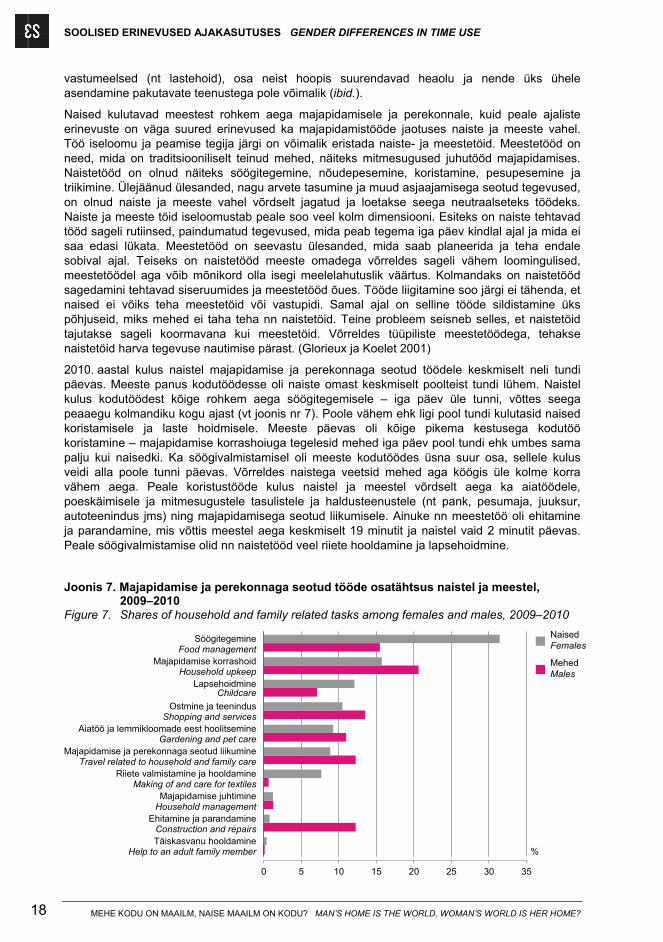
2010. aastal kulus naistel majapidamise ja perekonnaga seotud töödele keskmiselt neli tundi päevas. Meeste panus kodutöödesse oli naiste omast keskmiselt poolteist tundi lühem. Naistel kulus kodutöödest kõige rohkem aega söögitegemisele – iga päev üle tunni, võttes seega peaaegu kolmandiku kogu ajast (vt joonis nr 7). Poole vähem ehk ligi pool tundi kulutasid naised koristamisele ja laste hoidmisele. Meeste päevas oli kõige pikema kestusega kodutöö koristamine – majapidamise korrashoiuga tegelesid mehed iga päev pool tundi ehk umbes sama palju kui naisedki. Ka söögivalmistamisel oli meeste kodutöödes üsna suur osa, sellele kulus veidi alla poole tunni päevas. Võrreldes naistega veetsid mehed aga köögis üle kolme korra vähem aega. Peale koristustööde kulus naistel ja meestel võrdselt aega ka aiatöödele, poeskäimisele ja mitmesugustele tasulistele ja haldusteenustele (nt pank, pesumaja, juuksur, autoteenindus jms) ning majapidamisega seotud liikumisele. Ainuke nn meestetöö oli ehitamine ja parandamine, mis võttis meestel aega keskmiselt 19 minutit ja naistel vaid 2 minutit päevas. Peale söögivalmistamise olid nn naistetööd veel riiete hooldamine ja lapsehoidmine.
Joonis 7. Majapidamise ja perekonnaga seotud tööde osatähtsus naistel ja meestel, 2009–2010
Figure 7. Shares of household and family related tasks among females and males, 2009–2010
Täiskasvanu hooldamineHelp to an adult family member
Ehitamine ja parandamineConstruction and repairs
Majapidamise juhtimineHousehold management
Riiete valmistamine ja hooldamineMaking of and care for textiles
Majapidamise ja perekonnaga seotud liikumineTravel related to household and family care
Aiatöö ja lemmikloomade eest hoolitsemineGardening and pet care
Ostmine ja teenindusShopping and services
LapsehoidmineChildcare
Majapidamise korrashoidHousehold upkeep
SöögitegemineFood management
0 5 10 15 20 25 30 35
%
NaisedFemales
MehedMales
SOOLISED ERINEVUSED AJAKASUTUSES GENDER DIFFERENCES IN TIME USE
MEHE KODU ON MAAILM, NAISE MAAILM ON KODU? MAN’S HOME IS THE WORLD, WOMAN’S WORLD IS HER HOME? 19
Meestel ei kulu teatavatele majapidamistöödele keskmiselt palju vähem aega kui naistel mitte seetõttu, et nad neid tegevusi lühemalt teevad, vaid seepärast, et meeste seas on majapidamis-töödega tegelejate osatähtsus palju väiksem kui naistel. 2010. aastal oli vähemalt ühte kodutööd teinud 93% naistest ja 80% meestest. Kui söögivalmistamisega oli tegelenud enamik naisi (84%), siis meestest vaid pooled (46%). Üsna suur sooline lõhe oli ka koristamises – naistest tegeles sellega 60% ja meestest 36%. Võrreldes meestega tegelesid naised kaks korda sagedamini lastehoiu ja täiskasvanu hooldamisega ja üle kuue korra rohkem riiete eest hoolitsemisega. Meeste seas oli peaaegu kuus korda enam aga ehitajaid ja parandajaid. Ülejäänud kodutöödes osalesid mehed ja naised üsna võrdselt.
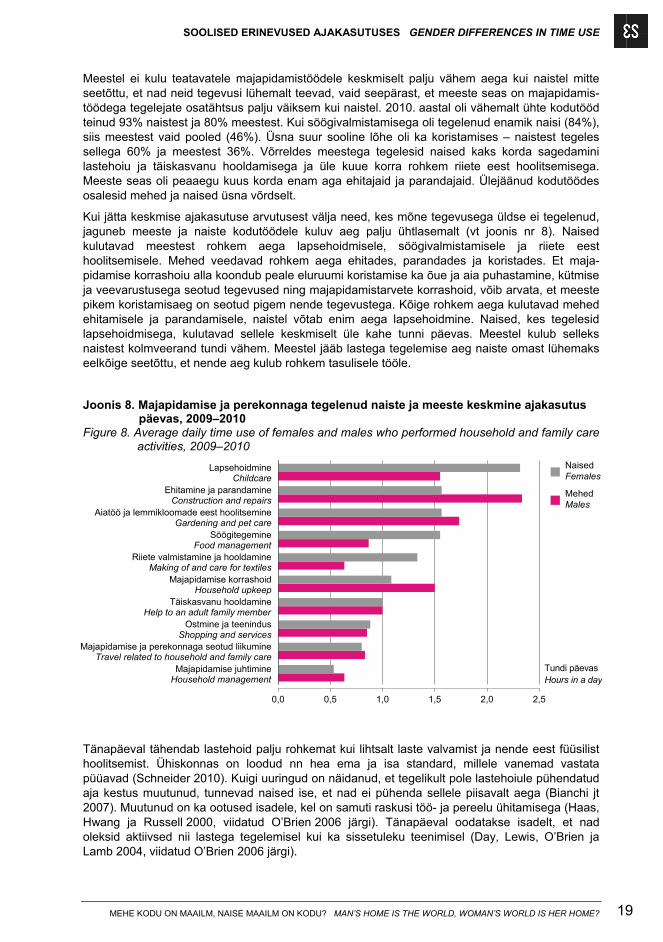
Kui jätta keskmise ajakasutuse arvutusest välja need, kes mõne tegevusega üldse ei tegelenud, jaguneb meeste ja naiste kodutöödele kuluv aeg palju ühtlasemalt (vt joonis nr 8). Naised kulutavad meestest rohkem aega lapsehoidmisele, söögivalmistamisele ja riiete eest hoolitsemisele. Mehed veedavad rohkem aega ehitades, parandades ja koristades. Et maja-pidamise korrashoiu alla koondub peale eluruumi koristamise ka õue ja aia puhastamine, kütmise ja veevarustusega seotud tegevused ning majapidamistarvete korrashoid, võib arvata, et meeste pikem koristamisaeg on seotud pigem nende tegevustega. Kõige rohkem aega kulutavad mehed ehitamisele ja parandamisele, naistel võtab enim aega lapsehoidmine. Naised, kes tegelesid lapsehoidmisega, kulutavad sellele keskmiselt üle kahe tunni päevas. Meestel kulub selleks naistest kolmveerand tundi vähem. Meestel jääb lastega tegelemise aeg naiste omast lühemaks eelkõige seetõttu, et nende aeg kulub rohkem tasulisele tööle.
Joonis 8. Majapidamise ja perekonnaga tegelenud naiste ja meeste keskmine ajakasutus päevas, 2009–2010
Figure 8. Average daily time use of females and males who performed household and family care activities, 2009–2010
Majapidamise juhtimineHousehold management
Majapidamise ja perekonnaga seotud liikumineTravel related to household and family care
Ostmine ja teenindusShopping and services
Täiskasvanu hooldamineHelp to an adult family member
Majapidamise korrashoidHousehold upkeep
Riiete valmistamine ja hooldamineMaking of and care for textiles
SöögitegemineFood management
Aiatöö ja lemmikloomade eest hoolitsemineGardening and pet care
Ehitamine ja parandamineConstruction and repairs
LapsehoidmineChildcare
0,0 0,5 1,0 1,5 2,0 2,5
Tundi päevasHours in a day
NaisedFemales
MehedMales
Tänapäeval tähendab lastehoid palju rohkemat kui lihtsalt laste valvamist ja nende eest füüsilist hoolitsemist. Ühiskonnas on loodud nn hea ema ja isa standard, millele vanemad vastata püüavad (Schneider 2010). Kuigi uuringud on näidanud, et tegelikult pole lastehoiule pühendatud aja kestus muutunud, tunnevad naised ise, et nad ei pühenda sellele piisavalt aega (Bianchi jt 2007). Muutunud on ka ootused isadele, kel on samuti raskusi töö- ja pereelu ühitamisega (Haas, Hwang ja Russell 2000, viidatud O’Brien 2006 järgi). Tänapäeval oodatakse isadelt, et nad oleksid aktiivsed nii lastega tegelemisel kui ka sissetuleku teenimisel (Day, Lewis, O’Brien ja Lamb 2004, viidatud O’Brien 2006 järgi).
SOOLISED ERINEVUSED AJAKASUTUSES GENDER DIFFERENCES IN TIME USE
MEHE KODU ON MAAILM, NAISE MAAILM ON KODU? MAN’S HOME IS THE WORLD, WOMAN’S WORLD IS HER HOME? 20
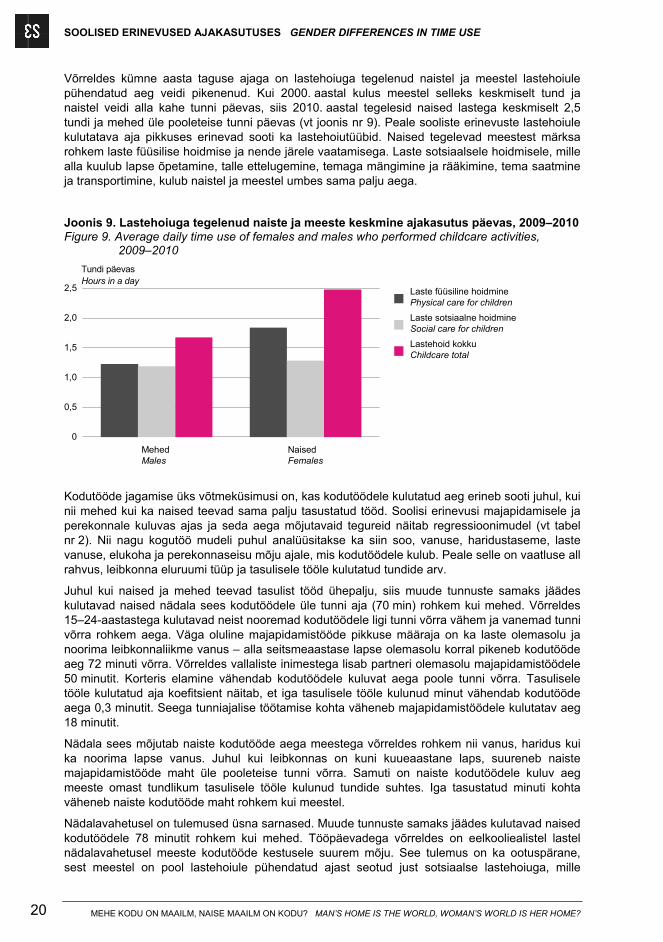
Võrreldes kümne aasta taguse ajaga on lastehoiuga tegelenud naistel ja meestel lastehoiule pühendatud aeg veidi pikenenud. Kui 2000. aastal kulus meestel selleks keskmiselt tund ja naistel veidi alla kahe tunni päevas, siis 2010. aastal tegelesid naised lastega keskmiselt 2,5 tundi ja mehed üle pooleteise tunni päevas (vt joonis nr 9). Peale sooliste erinevuste lastehoiule kulutatava aja pikkuses erinevad sooti ka lastehoiutüübid. Naised tegelevad meestest märksa rohkem laste füüsilise hoidmise ja nende järele vaatamisega. Laste sotsiaalsele hoidmisele, mille alla kuulub lapse õpetamine, talle ettelugemine, temaga mängimine ja rääkimine, tema saatmine ja transportimine, kulub naistel ja meestel umbes sama palju aega.
Joonis 9. Lastehoiuga tegelenud naiste ja meeste keskmine ajakasutus päevas, 2009–2010 Figure 9. Average daily time use of females and males who performed childcare activities,
2009–2010
MehedMales
NaisedFemales
0
0,5
1,0
1,5
2,0
2,5 Laste füüsiline hoidminePhysical care for children
Laste sotsiaalne hoidmineSocial care for children
Lastehoid kokkuChildcare total
Tundi päevasHours in a day
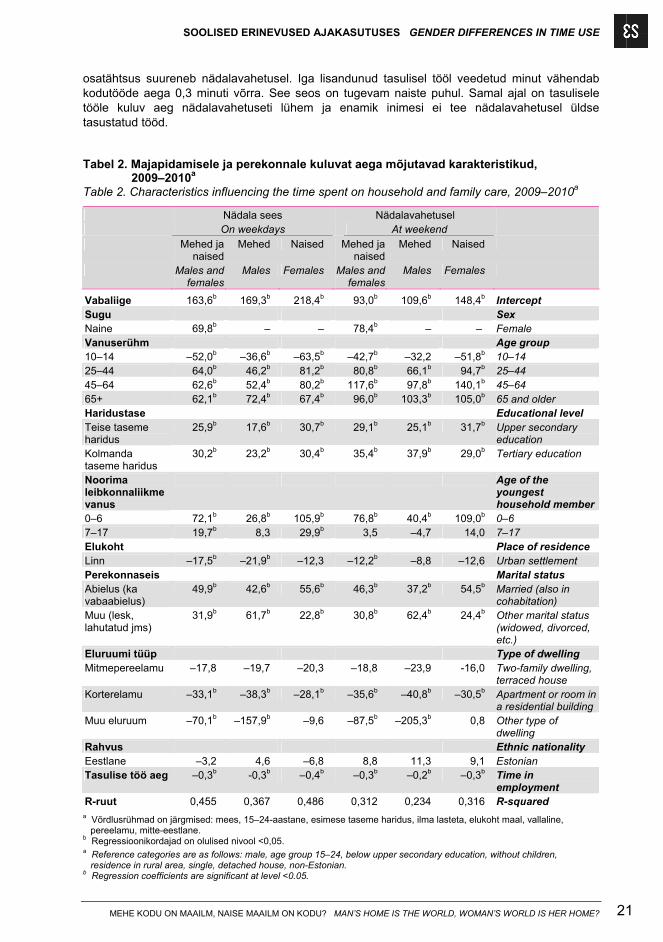
Kodutööde jagamise üks võtmeküsimusi on, kas kodutöödele kulutatud aeg erineb sooti juhul, kui nii mehed kui ka naised teevad sama palju tasustatud tööd. Soolisi erinevusi majapidamisele ja perekonnale kuluvas ajas ja seda aega mõjutavaid tegureid näitab regressioonimudel (vt tabel nr 2). Nii nagu kogutöö mudeli puhul analüüsitakse ka siin soo, vanuse, haridustaseme, laste vanuse, elukoha ja perekonnaseisu mõju ajale, mis kodutöödele kulub. Peale selle on vaatluse all rahvus, leibkonna eluruumi tüüp ja tasulisele tööle kulutatud tundide arv.
Juhul kui naised ja mehed teevad tasulist tööd ühepalju, siis muude tunnuste samaks jäädes kulutavad naised nädala sees kodutöödele üle tunni aja (70 min) rohkem kui mehed. Võrreldes 15–24-aastastega kulutavad neist nooremad kodutöödele ligi tunni võrra vähem ja vanemad tunni võrra rohkem aega. Väga oluline majapidamistööde pikkuse määraja on ka laste olemasolu ja noorima leibkonnaliikme vanus – alla seitsmeaastase lapse olemasolu korral pikeneb kodutööde aeg 72 minuti võrra. Võrreldes vallaliste inimestega lisab partneri olemasolu majapidamistöödele 50 minutit. Korteris elamine vähendab kodutöödele kuluvat aega poole tunni võrra. Tasulisele tööle kulutatud aja koefitsient näitab, et iga tasulisele tööle kulunud minut vähendab kodutööde aega 0,3 minutit. Seega tunniajalise töötamise kohta väheneb majapidamistöödele kulutatav aeg 18 minutit.
Nädala sees mõjutab naiste kodutööde aega meestega võrreldes rohkem nii vanus, haridus kui ka noorima lapse vanus. Juhul kui leibkonnas on kuni kuueaastane laps, suureneb naiste majapidamistööde maht üle pooleteise tunni võrra. Samuti on naiste kodutöödele kuluv aeg meeste omast tundlikum tasulisele tööle kulunud tundide suhtes. Iga tasustatud minuti kohta väheneb naiste kodutööde maht rohkem kui meestel.
Nädalavahetusel on tulemused üsna sarnased. Muude tunnuste samaks jäädes kulutavad naised kodutöödele 78 minutit rohkem kui mehed. Tööpäevadega võrreldes on eelkooliealistel lastel nädalavahetusel meeste kodutööde kestusele suurem mõju. See tulemus on ka ootuspärane, sest meestel on pool lastehoiule pühendatud ajast seotud just sotsiaalse lastehoiuga, mille
SOOLISED ERINEVUSED AJAKASUTUSES GENDER DIFFERENCES IN TIME USE
MEHE KODU ON MAAILM, NAISE MAAILM ON KODU? MAN’S HOME IS THE WORLD, WOMAN’S WORLD IS HER HOME? 21
osatähtsus suureneb nädalavahetusel. Iga lisandunud tasulisel tööl veedetud minut vähendab kodutööde aega 0,3 minuti võrra. See seos on tugevam naiste puhul. Samal ajal on tasulisele tööle kuluv aeg nädalavahetuseti lühem ja enamik inimesi ei tee nädalavahetusel üldse tasustatud tööd.
Tabel 2. Majapidamisele ja perekonnale kuluvat aega mõjutavad karakteristikud, 2009–2010a
Table 2. Characteristics influencing the time spent on household and family care, 2009–2010a
Nädala sees Nädalavahetusel On weekdays At weekend
Mehed ja naised
Mehed Naised Mehed ja naised
Mehed Naised
Males and females
Males Females Males and females
Males Females
Vabaliige 163,6b 169,3b 218,4b 93,0b 109,6b 148,4b Intercept Sugu Sex Naine 69,8b – – 78,4b – – Female Vanuserühm Age group 10–14 –52,0b –36,6b –63,5b –42,7b –32,2 –51,8b 10–14 25–44 64,0b 46,2b 81,2b 80,8b 66,1b 94,7b 25–44 45–64 62,6b 52,4b 80,2b 117,6b 97,8b 140,1b 45–64 65+ 62,1b 72,4b 67,4b 96,0b 103,3b 105,0b 65 and older Haridustase Educational level Teise taseme haridus
25,9b 17,6b 30,7b 29,1b 25,1b 31,7b Upper secondary education
Kolmanda taseme haridus
30,2b 23,2b 30,4b 35,4b 37,9b 29,0b Tertiary education
Noorima leibkonnaliikme vanus
Age of the youngest household member
0–6 72,1b 26,8b 105,9b 76,8b 40,4b 109,0b 0–6 7–17 19,7b 8,3 29,9b 3,5 –4,7 14,0 7–17 Elukoht Place of residence Linn –17,5b –21,9b –12,3 –12,2b –8,8 –12,6 Urban settlement Perekonnaseis Marital status Abielus (ka vabaabielus)
49,9b 42,6b 55,6b 46,3b 37,2b 54,5b Married (also in cohabitation)
Muu (lesk, lahutatud jms)
31,9b 61,7b 22,8b 30,8b 62,4b 24,4b Other marital status (widowed, divorced, etc.)
Eluruumi tüüp Type of dwelling Mitmepereelamu –17,8 –19,7 –20,3 –18,8 –23,9 -16,0 Two-family dwelling,
terraced house Korterelamu –33,1b –38,3b –28,1b –35,6b –40,8b –30,5b Apartment or room in
a residential building Muu eluruum –70,1b –157,9b –9,6 –87,5b –205,3b 0,8 Other type of
dwelling Rahvus Ethnic nationality Eestlane –3,2 4,6 –6,8 8,8 11,3 9,1 Estonian Tasulise töö aeg –0,3b -0,3b –0,4b –0,3b –0,2b –0,3b Time in
employment R-ruut 0,455 0,367 0,486 0,312 0,234 0,316 R-squared
a Võrdlusrühmad on järgmised: mees, 15–24-aastane, esimese taseme haridus, ilma lasteta, elukoht maal, vallaline, pereelamu, mitte-eestlane.
b Regressioonikordajad on olulised nivool <0,05. a Reference categories are as follows: male, age group 15–24, below upper secondary education, without children,
residence in rural area, single, detached house, non-Estonian. b Regression coefficients are significant at level <0.05.
SOOLISED ERINEVUSED AJAKASUTUSES GENDER DIFFERENCES IN TIME USE
MEHE KODU ON MAAILM, NAISE MAAILM ON KODU? MAN’S HOME IS THE WORLD, WOMAN’S WORLD IS HER HOME? 22
Kokkuvõte
Sooti erineb inimeste ajakasutus igas eluetapis. Võrreldes meestega pühendavad naised vähem aega tasulisele tööle ja rohkem majapidamisele ja perekonnale. Et tasustatud tööl ja kodutöödel on endiselt erinev väärtus, on sellel naiste jaoks sotsiaalsed ja majanduslikud tagajärjed. Naised maksavad hinda nii töötasus kui ka vabas ajas, neil kipub olema meestest vähem vaba aega. Kuigi viimase kümne aasta jooksul on sooline lõhe nii tasustatud kui ka tasustamata töö puhul vähenenud, on erinevused kogutöömahus jäänud samaks. Kui arvestada tasulisele tööle ja majapidamisele kulutatud aega, on naiste päevane kogutööaeg sama vanuse, hõivestaatuse, hariduse jm tunnusega meeste omast ligi tunni võrra pikem. Samuti mõjutab ajakasutust hõivestaatus ning laste olemasolu ja vanus. Laste vanusel on eriti suur mõju naiste kogutöömahule, eriti majapidamistöödele ja perekonnale pühendatavale ajale – mida väiksemad on lapsed, seda pikemad on naiste tööpäevad. Naised teevad meestest rohkem kodutöid isegi siis, kui nad kulutavad tasulisele tööle sama palju aega kui vastassugu. Mida rohkem aga teevad inimesed tasulist tööd, seda vähem aega jääb neil kodutöödeks. Tunniajalise töötamise kohta väheneb majapidamistöödele kuluv aeg 18 minutit. Tasulise töö mõju kodutööde kestusele on suurem naistel.
Kodutööde mahtu ja jaotust saab mõjutada eri tööhõivepoliitikatega, näiteks töötundide reguleerimise või lapsehoolduspuhkuse pikkuse ja selle saamise reeglite määramisega. Kui mehed teevad vähem tasulist tööd, on kodutööde jagamine leibkonnas võrdsem (McGinnity ja Russell 2008). Meeste pikk tasulisel tööl veedetud aeg takistab neil lastehoius ja majapidamistöödes osalemist. Selleks et saavutada koduseinte vahel suurem sooline võrdsus, on näiteks tasustatud lapsehooldus- ja isapuhkus ning paindlikumad töövõimalused nn meeste ametites. Riigi pakutavad lastehoiuteenused ei pruugi otseselt mõjutada ebavõrdsust kodutöödes, kuid see pakub naistele rohkem valikuvõimalusi ja lubab kulutada rohkem aega tasulisele tööle. See omakorda vähendab tõenäoliselt naiste kodutööde mahtu. Seega vähendavad strateegiad, mis aitavad kaasa võrdsusele tööelus, ebavõrdsust ka koduses elus. Ebavõrduse vähendamiseks naiste ja meeste ajakasutuses on aga vajalik, et muutuks ka ühiskonna suhtumine soonormidesse ja tasustamata töö väärtustamisse.
Allikad Sources
Aliaga, C., Winqvist, K. (2003). How women and men spend their time. Results from 13 European countries. – Statistics in Focus, theme 3, No 12.
Anxo, D., Carlin, P. (2004). Intra-family time allocation to housework – French evidence. – Electronic International Journal of Time Use Research, Vol 1, No 1, pp. 14–36.
Becker, G. S. (1965). A Theory of the Allocation of Time. – The Economic Journal, Vol 75, No 299 (Sep., 1965), pp. 493–517.
Becker, G. (1991). A treatise on the family. Cambridge, Massachusetts: Harvard University Press.
Bianchi, S. M., Robinson, J. P., Milkie, M. A. (2007). Changing Rhythms of American Family Life. Russell Sage Foundation.
Bittman, M., Wajcman, J. (1999). The rush hour. The quality of leisure time and gender equity. SPRC Discussion Paper No 97.
Bittman, M. (2004). Parenting and employment. What time-use surveys show. – Family time: the social organization of care. / Ed. N. Folbre, M. Bittman. New York: Routledge, pp. 152–170.
Deding, M., Lausten, M. (2006). Choosing between his time and her time? Paid and unpaid work of Danish couples. – Electronic International Journal of Time Use Research, Vol 3, No 1, pp. 28–48.
SOOLISED ERINEVUSED AJAKASUTUSES GENDER DIFFERENCES IN TIME USE
MEHE KODU ON MAAILM, NAISE MAAILM ON KODU? MAN’S HOME IS THE WORLD, WOMAN’S WORLD IS HER HOME? 23
Einhorn, B. (1993). Cinderella Goes to Market: Citizenship, Gender, and Women’s Movements in East Central Europe. London: Verso.
Fisher, K., Layte, R. (2004). Measuring Work-Life Balance Using Time Diary Data. – Electronic International Journal of Time Use Research, Vol 1, No 1, pp. 1–13.
Gershuny, J. (2005). Busyness as the badge of honour for the new superordinate working class. ISER Working Papers Number 2005-9. Institute for Social and Economic Research.
Glorieux, I., Koelet, S. (2001). Female men / male women: gender versus sex in household work. Paper prepared fot the IATUR conference „Time Use 2001: New Regions, New Data, New Methods and New Results”, Oslo, Norway, October 3–5 2001.
Glorieux, I., Koelet, S. (2002). Gendered priorities. Differences between men and women in balancing between paid work, unpaid work and leisure. Paper prepared for the conference “Stress, health & lifestyle: The work-family interface”, University of Waterloo, Waterloo, Ontario, Canada, March 21–23 2002.
Hochschild, A. R., Machung, A. (2003). The second shift. London: Penguin Books.
Levinson, D., Kumar, A. (1995). Activity, Travel, and the Allocation of Time. – Journal of the American Planning Association, Vol 61, No 4, pp. 458–470.
McGinnity, F., Russell, H. (2007). Work Rich, Time Poor? Time-Use of Women and Men in Ireland. – The Economic and Social Review, Vol 38, No 3, pp. 323–354.
McGinnity, F., Russell, H. (2008). Gender Inequalities in Time Use. The Distribution of Caring, Housework and Employment Among Women and Men in Ireland. Dublin: The Economic and Social Research Institute and The Equality Authority.
O’Brien, M. (2006). Well-being of children and labour markets in Europe. Different kinds of risks resulting from various structures and changes in the labour markets. Paper presented at the WELLCHI Network Conference 2, Centre for Globalisation and Governance, University of Hamburg March 31 – April 1, 2006.
Puur, A., Põldma, A. (2010). Rahvastiku vananemine demograafilises vaates. – Sotsiaaltrendid 5. Social Trends 5. Tallinn: Statistikaamet, lk 6–29.
Randoja, M. (2008). Soolised palgaerinevused. – Pilk tööellu. A glimpse into the working life. Tallinn: Statistikaamet, lk 116–133.
Randoja, M. (2009). Soolised erinevused täiskasvanute koolituses. – Täiskasvanute koolitus. Adult Education. Tallinn: Statistikaamet, lk 68–88.
Sayer, L. S., England, P., Bittman, M., Bianchi, S. M. (2004). Is Women’s Work Never Done? Gender Differences in Total Work Time in Australia and the United States. Paper submitted to the Annual Meeting of the Population of America, Boston, Mass, April 2004.
Sayer, L. C. (2007). More Work for Mothers? Trends and Gender Differences in Multitasking. – Time Competition: Disturbed Balances and New Options in Work and Care. / Ed. T. van der Lippe, P. Peters. Cheltenham: Edward Elgar.
Schneider, B. (2010). The Human Face of Workplace Flexibility. Paper prepared for the conference „Focus on Workplace Flexibility ”, November 29–30 2010, Washington, D.C.
Stancanelli, E., G., F., Stratton, L. S. (2010). Her Time, His Time, or the Maid’s Time: An Analysis of the Demand for Domestic Work. IZA Discussion Paper No 5253.
Vainu, V., Järviste, L., Biin, H. (2010). Soolise võrdõiguslikkuse monitooring 2009. Sotsiaalministeeriumi toimetised, nr 1/2010. Tallinn: Sotsiaalministeerium.
Wharton, A. S. (2005). The sociology of gender: an introduction to theory and research. Wiley-Blackwell.
SOOLISED ERINEVUSED AJAKASUTUSES GENDER DIFFERENCES IN TIME USE
MEHE KODU ON MAAILM, NAISE MAAILM ON KODU? MAN’S HOME IS THE WORLD, WOMAN’S WORLD IS HER HOME? 24
GENDER DIFFERENCES IN TIME USE
Marin Tasuja
Introduction
Time is one of the most important factors influencing everyday life. Unlike other human resources, time is allocated equally between everyone. The time available in a day is always limited to 24 hours, despite one’s income, education, marital status, sex or age. Even though higher income and various technological innovations have enabled partial substitution of time by money (Levinson and Kumar 1995), no one is able to buy more time. Due to this finite nature of time, people are forced to choose between different activities and to find compromises in the division of time in their individual and household schedules. Spending time on a specific activity means less time for other activities. Even though the amount of available time is equal for everyone, there can be a great variety between people in terms of how they use it and which activities they prefer. One of such compromises concerns the distribution of employment and household work between women and men. Throughout time, women have been linked predominantly with home and household chores, while men have been regarded as responsible for earning money and dealing with issues outside home (Wharton 2005). This article examines how Estonian women and men spend their time and how employment and household work are distributed between women and men.
A study on time use provides evidence of the structure of society and the relations between its members. The time spent on different activities highlights people’s priorities and is a reflection of their daily life (Glorieux and Koelet 2002). Time use characterises participation in the labour market, consumer behaviour, recreational preferences and family relations, as well as changes in household composition, state of welfare, and socially accepted beliefs in general. The time spent on employment affects the size of income, which in turn determines the extent and structure of possible expenditures and economic welfare of households. The higher the wages, the higher the relative value of the time spent on employment. This increases the value of leisure time and household work in comparison with employment, which leads to a decrease in the proportions of such activities (Becker 1965). At the same time, a person with higher income can afford more expensive leisure activities or buy some of household work as a service (e.g., by hiring a nanny or housekeeper). In addition to direct financial benefits, the time spent on employment or studying increases a person’s human capital, which influences future opportunities and income. The greater the share of time spent on work in a day, the less time there is to enjoy the fruits of this work and to rest (Fisher and Layte 2004). In addition to paid work, monitoring of time use can also help to map any unpaid work at home, which can often go unnoticed.
In addition to direct financial benefits, time use also affects subjective welfare – availability and quality of leisure time, sufficient sleeping hours, communication with others and self-realisation at work are all important for people. Time use enables to create social capital – the time spent with family and friends and other social relations are important for individual welfare, proper functioning of households, providing a support system, and creating social values. The time use of parents, division of work in a family and time spent with children – they all shape the values of children and influence the use of time by them in the future.
Time use has become a potential source of tensions as a result of increased pace of life, wider range of available choices, and growing ambiguity of social norms earlier recognised in the society. Increased productivity has also increased the intensity of leisure time (Linder 1970: cit. via McGinnity and Russell 2007) and people increasingly feel that there is not enough time for everything (Bittman 2004). Gershuny (2005) has provided one possible explanation for the lack of time by stating that, as a result of increased unemployment and other social changes, being busy with work and having limited time for leisure has become a positive and privileged status in the society. However, cumulative tensions and time stress can have a negative impact on a person’s health, family and working life. Lack of time is a particular problem for families with small children,
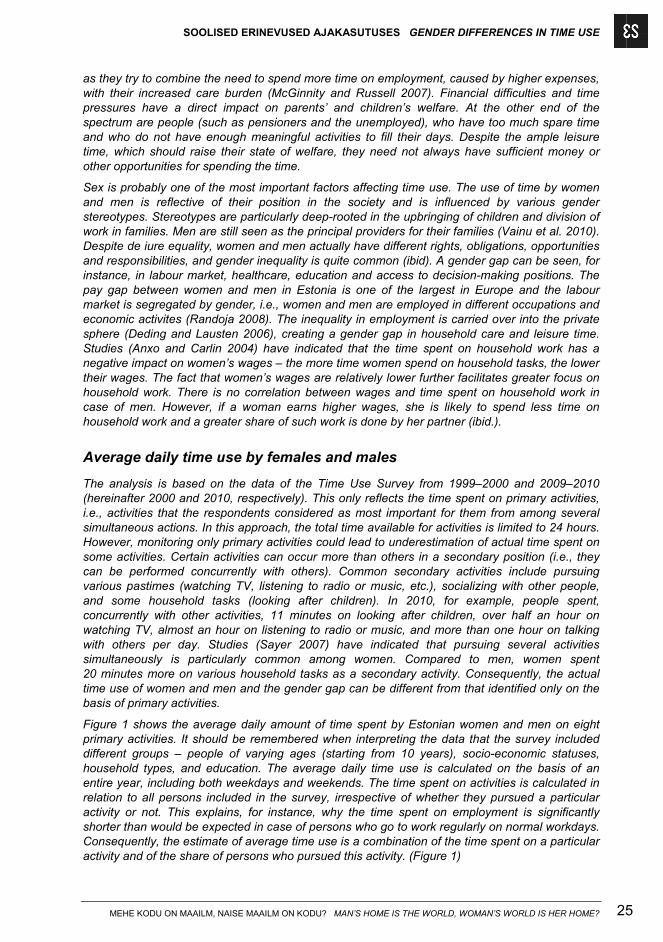
SOOLISED ERINEVUSED AJAKASUTUSES GENDER DIFFERENCES IN TIME USE
MEHE KODU ON MAAILM, NAISE MAAILM ON KODU? MAN’S HOME IS THE WORLD, WOMAN’S WORLD IS HER HOME? 25
as they try to combine the need to spend more time on employment, caused by higher expenses, with their increased care burden (McGinnity and Russell 2007). Financial difficulties and time pressures have a direct impact on parents’ and children’s welfare. At the other end of the spectrum are people (such as pensioners and the unemployed), who have too much spare time and who do not have enough meaningful activities to fill their days. Despite the ample leisure time, which should raise their state of welfare, they need not always have sufficient money or other opportunities for spending the time.
Sex is probably one of the most important factors affecting time use. The use of time by women and men is reflective of their position in the society and is influenced by various gender stereotypes. Stereotypes are particularly deep-rooted in the upbringing of children and division of work in families. Men are still seen as the principal providers for their families (Vainu et al. 2010). Despite de iure equality, women and men actually have different rights, obligations, opportunities and responsibilities, and gender inequality is quite common (ibid). A gender gap can be seen, for instance, in labour market, healthcare, education and access to decision-making positions. The pay gap between women and men in Estonia is one of the largest in Europe and the labour market is segregated by gender, i.e., women and men are employed in different occupations and economic activites (Randoja 2008). The inequality in employment is carried over into the private sphere (Deding and Lausten 2006), creating a gender gap in household care and leisure time. Studies (Anxo and Carlin 2004) have indicated that the time spent on household work has a negative impact on women’s wages – the more time women spend on household tasks, the lower their wages. The fact that women’s wages are relatively lower further facilitates greater focus on household work. There is no correlation between wages and time spent on household work in case of men. However, if a woman earns higher wages, she is likely to spend less time on household work and a greater share of such work is done by her partner (ibid.).
Average daily time use by females and males
The analysis is based on the data of the Time Use Survey from 1999–2000 and 2009–2010 (hereinafter 2000 and 2010, respectively). This only reflects the time spent on primary activities, i.e., activities that the respondents considered as most important for them from among several simultaneous actions. In this approach, the total time available for activities is limited to 24 hours. However, monitoring only primary activities could lead to underestimation of actual time spent on some activities. Certain activities can occur more than others in a secondary position (i.e., they can be performed concurrently with others). Common secondary activities include pursuing various pastimes (watching TV, listening to radio or music, etc.), socializing with other people, and some household tasks (looking after children). In 2010, for example, people spent, concurrently with other activities, 11 minutes on looking after children, over half an hour on watching TV, almost an hour on listening to radio or music, and more than one hour on talking with others per day. Studies (Sayer 2007) have indicated that pursuing several activities simultaneously is particularly common among women. Compared to men, women spent 20 minutes more on various household tasks as a secondary activity. Consequently, the actual time use of women and men and the gender gap can be different from that identified only on the basis of primary activities.
Figure 1 shows the average daily amount of time spent by Estonian women and men on eight primary activities. It should be remembered when interpreting the data that the survey included different groups – people of varying ages (starting from 10 years), socio-economic statuses, household types, and education. The average daily time use is calculated on the basis of an entire year, including both weekdays and weekends. The time spent on activities is calculated in relation to all persons included in the survey, irrespective of whether they pursued a particular activity or not. This explains, for instance, why the time spent on employment is significantly shorter than would be expected in case of persons who go to work regularly on normal workdays. Consequently, the estimate of average time use is a combination of the time spent on a particular activity and of the share of persons who pursued this activity. (Figure 1)
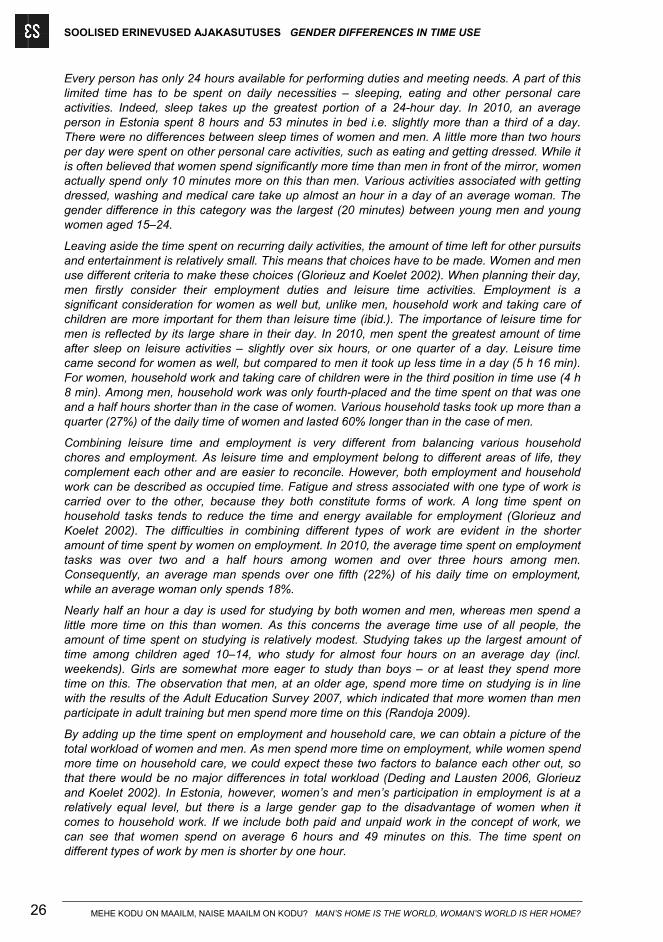
SOOLISED ERINEVUSED AJAKASUTUSES GENDER DIFFERENCES IN TIME USE
MEHE KODU ON MAAILM, NAISE MAAILM ON KODU? MAN’S HOME IS THE WORLD, WOMAN’S WORLD IS HER HOME? 26
Every person has only 24 hours available for performing duties and meeting needs. A part of this limited time has to be spent on daily necessities – sleeping, eating and other personal care activities. Indeed, sleep takes up the greatest portion of a 24-hour day. In 2010, an average person in Estonia spent 8 hours and 53 minutes in bed i.e. slightly more than a third of a day. There were no differences between sleep times of women and men. A little more than two hours per day were spent on other personal care activities, such as eating and getting dressed. While it is often believed that women spend significantly more time than men in front of the mirror, women actually spend only 10 minutes more on this than men. Various activities associated with getting dressed, washing and medical care take up almost an hour in a day of an average woman. The gender difference in this category was the largest (20 minutes) between young men and young women aged 15–24.
Leaving aside the time spent on recurring daily activities, the amount of time left for other pursuits and entertainment is relatively small. This means that choices have to be made. Women and men use different criteria to make these choices (Glorieuz and Koelet 2002). When planning their day, men firstly consider their employment duties and leisure time activities. Employment is a significant consideration for women as well but, unlike men, household work and taking care of children are more important for them than leisure time (ibid.). The importance of leisure time for men is reflected by its large share in their day. In 2010, men spent the greatest amount of time after sleep on leisure activities – slightly over six hours, or one quarter of a day. Leisure time came second for women as well, but compared to men it took up less time in a day (5 h 16 min). For women, household work and taking care of children were in the third position in time use (4 h 8 min). Among men, household work was only fourth-placed and the time spent on that was one and a half hours shorter than in the case of women. Various household tasks took up more than a quarter (27%) of the daily time of women and lasted 60% longer than in the case of men.
Combining leisure time and employment is very different from balancing various household chores and employment. As leisure time and employment belong to different areas of life, they complement each other and are easier to reconcile. However, both employment and household work can be described as occupied time. Fatigue and stress associated with one type of work is carried over to the other, because they both constitute forms of work. A long time spent on household tasks tends to reduce the time and energy available for employment (Glorieuz and Koelet 2002). The difficulties in combining different types of work are evident in the shorter amount of time spent by women on employment. In 2010, the average time spent on employment tasks was over two and a half hours among women and over three hours among men. Consequently, an average man spends over one fifth (22%) of his daily time on employment, while an average woman only spends 18%.
Nearly half an hour a day is used for studying by both women and men, whereas men spend a little more time on this than women. As this concerns the average time use of all people, the amount of time spent on studying is relatively modest. Studying takes up the largest amount of time among children aged 10–14, who study for almost four hours on an average day (incl. weekends). Girls are somewhat more eager to study than boys – or at least they spend more time on this. The observation that men, at an older age, spend more time on studying is in line with the results of the Adult Education Survey 2007, which indicated that more women than men participate in adult training but men spend more time on this (Randoja 2009).
By adding up the time spent on employment and household care, we can obtain a picture of the total workload of women and men. As men spend more time on employment, while women spend more time on household care, we could expect these two factors to balance each other out, so that there would be no major differences in total workload (Deding and Lausten 2006, Glorieuz and Koelet 2002). In Estonia, however, women’s and men’s participation in employment is at a relatively equal level, but there is a large gender gap to the disadvantage of women when it comes to household work. If we include both paid and unpaid work in the concept of work, we can see that women spend on average 6 hours and 49 minutes on this. The time spent on different types of work by men is shorter by one hour.
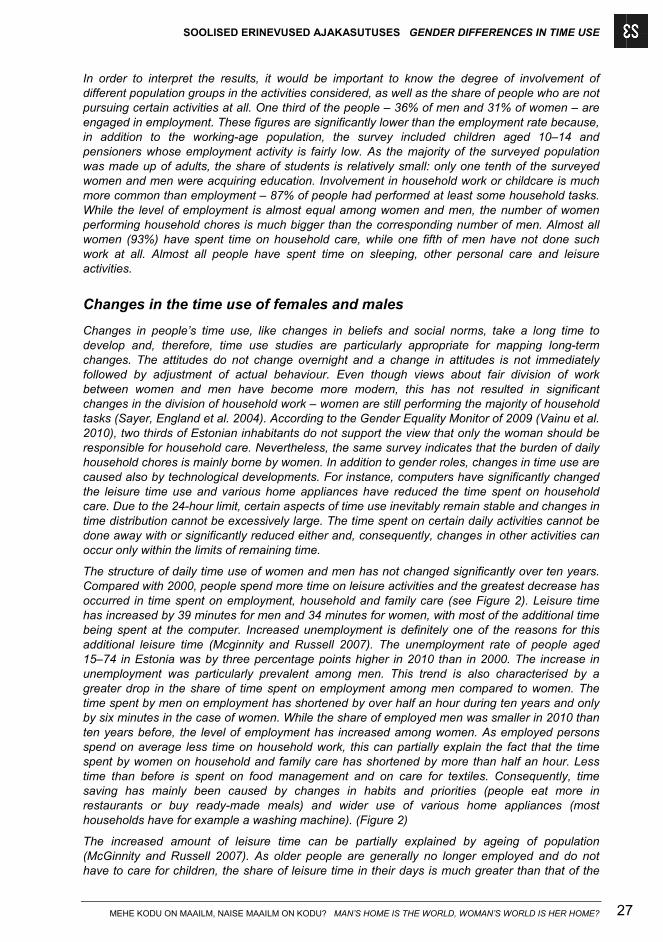
SOOLISED ERINEVUSED AJAKASUTUSES GENDER DIFFERENCES IN TIME USE
MEHE KODU ON MAAILM, NAISE MAAILM ON KODU? MAN’S HOME IS THE WORLD, WOMAN’S WORLD IS HER HOME? 27
In order to interpret the results, it would be important to know the degree of involvement of different population groups in the activities considered, as well as the share of people who are not pursuing certain activities at all. One third of the people – 36% of men and 31% of women – are engaged in employment. These figures are significantly lower than the employment rate because, in addition to the working-age population, the survey included children aged 10–14 and pensioners whose employment activity is fairly low. As the majority of the surveyed population was made up of adults, the share of students is relatively small: only one tenth of the surveyed women and men were acquiring education. Involvement in household work or childcare is much more common than employment – 87% of people had performed at least some household tasks. While the level of employment is almost equal among women and men, the number of women performing household chores is much bigger than the corresponding number of men. Almost all women (93%) have spent time on household care, while one fifth of men have not done such work at all. Almost all people have spent time on sleeping, other personal care and leisure activities.
Changes in the time use of females and males
Changes in people’s time use, like changes in beliefs and social norms, take a long time to develop and, therefore, time use studies are particularly appropriate for mapping long-term changes. The attitudes do not change overnight and a change in attitudes is not immediately followed by adjustment of actual behaviour. Even though views about fair division of work between women and men have become more modern, this has not resulted in significant changes in the division of household work – women are still performing the majority of household tasks (Sayer, England et al. 2004). According to the Gender Equality Monitor of 2009 (Vainu et al. 2010), two thirds of Estonian inhabitants do not support the view that only the woman should be responsible for household care. Nevertheless, the same survey indicates that the burden of daily household chores is mainly borne by women. In addition to gender roles, changes in time use are caused also by technological developments. For instance, computers have significantly changed the leisure time use and various home appliances have reduced the time spent on household care. Due to the 24-hour limit, certain aspects of time use inevitably remain stable and changes in time distribution cannot be excessively large. The time spent on certain daily activities cannot be done away with or significantly reduced either and, consequently, changes in other activities can occur only within the limits of remaining time.
The structure of daily time use of women and men has not changed significantly over ten years. Compared with 2000, people spend more time on leisure activities and the greatest decrease has occurred in time spent on employment, household and family care (see Figure 2). Leisure time has increased by 39 minutes for men and 34 minutes for women, with most of the additional time being spent at the computer. Increased unemployment is definitely one of the reasons for this additional leisure time (Mcginnity and Russell 2007). The unemployment rate of people aged 15–74 in Estonia was by three percentage points higher in 2010 than in 2000. The increase in unemployment was particularly prevalent among men. This trend is also characterised by a greater drop in the share of time spent on employment among men compared to women. The time spent by men on employment has shortened by over half an hour during ten years and only by six minutes in the case of women. While the share of employed men was smaller in 2010 than ten years before, the level of employment has increased among women. As employed persons spend on average less time on household work, this can partially explain the fact that the time spent by women on household and family care has shortened by more than half an hour. Less time than before is spent on food management and on care for textiles. Consequently, time saving has mainly been caused by changes in habits and priorities (people eat more in restaurants or buy ready-made meals) and wider use of various home appliances (most households have for example a washing machine). (Figure 2)
The increased amount of leisure time can be partially explained by ageing of population (McGinnity and Russell 2007). As older people are generally no longer employed and do not have to care for children, the share of leisure time in their days is much greater than that of the
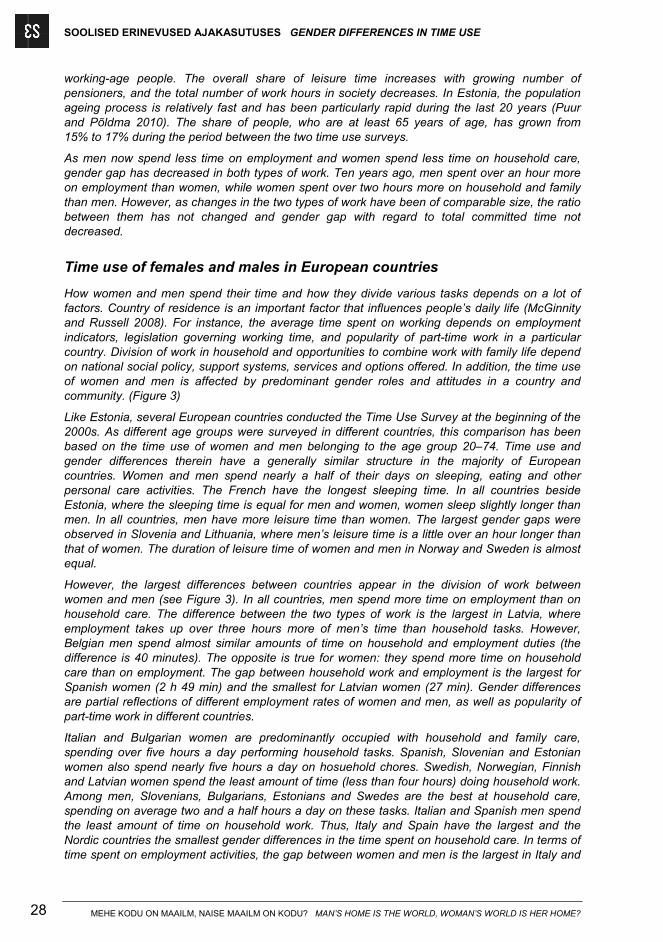
SOOLISED ERINEVUSED AJAKASUTUSES GENDER DIFFERENCES IN TIME USE
MEHE KODU ON MAAILM, NAISE MAAILM ON KODU? MAN’S HOME IS THE WORLD, WOMAN’S WORLD IS HER HOME? 28
working-age people. The overall share of leisure time increases with growing number of pensioners, and the total number of work hours in society decreases. In Estonia, the population ageing process is relatively fast and has been particularly rapid during the last 20 years (Puur and Põldma 2010). The share of people, who are at least 65 years of age, has grown from 15% to 17% during the period between the two time use surveys.
As men now spend less time on employment and women spend less time on household care, gender gap has decreased in both types of work. Ten years ago, men spent over an hour more on employment than women, while women spent over two hours more on household and family than men. However, as changes in the two types of work have been of comparable size, the ratio between them has not changed and gender gap with regard to total committed time not decreased.
Time use of females and males in European countries
How women and men spend their time and how they divide various tasks depends on a lot of factors. Country of residence is an important factor that influences people’s daily life (McGinnity and Russell 2008). For instance, the average time spent on working depends on employment indicators, legislation governing working time, and popularity of part-time work in a particular country. Division of work in household and opportunities to combine work with family life depend on national social policy, support systems, services and options offered. In addition, the time use of women and men is affected by predominant gender roles and attitudes in a country and community. (Figure 3)
Like Estonia, several European countries conducted the Time Use Survey at the beginning of the 2000s. As different age groups were surveyed in different countries, this comparison has been based on the time use of women and men belonging to the age group 20–74. Time use and gender differences therein have a generally similar structure in the majority of European countries. Women and men spend nearly a half of their days on sleeping, eating and other personal care activities. The French have the longest sleeping time. In all countries beside Estonia, where the sleeping time is equal for men and women, women sleep slightly longer than men. In all countries, men have more leisure time than women. The largest gender gaps were observed in Slovenia and Lithuania, where men’s leisure time is a little over an hour longer than that of women. The duration of leisure time of women and men in Norway and Sweden is almost equal.
However, the largest differences between countries appear in the division of work between women and men (see Figure 3). In all countries, men spend more time on employment than on household care. The difference between the two types of work is the largest in Latvia, where employment takes up over three hours more of men’s time than household tasks. However, Belgian men spend almost similar amounts of time on household and employment duties (the difference is 40 minutes). The opposite is true for women: they spend more time on household care than on employment. The gap between household work and employment is the largest for Spanish women (2 h 49 min) and the smallest for Latvian women (27 min). Gender differences are partial reflections of different employment rates of women and men, as well as popularity of part-time work in different countries.
Italian and Bulgarian women are predominantly occupied with household and family care, spending over five hours a day performing household tasks. Spanish, Slovenian and Estonian women also spend nearly five hours a day on hosuehold chores. Swedish, Norwegian, Finnish and Latvian women spend the least amount of time (less than four hours) doing household work. Among men, Slovenians, Bulgarians, Estonians and Swedes are the best at household care, spending on average two and a half hours a day on these tasks. Italian and Spanish men spend the least amount of time on household work. Thus, Italy and Spain have the largest and the Nordic countries the smallest gender differences in the time spent on household care. In terms of time spent on employment activities, the gap between women and men is the largest in Italy and
SOOLISED ERINEVUSED AJAKASUTUSES GENDER DIFFERENCES IN TIME USE
MEHE KODU ON MAAILM, NAISE MAAILM ON KODU? MAN’S HOME IS THE WORLD, WOMAN’S WORLD IS HER HOME? 29
Spain, and the smallest in Bulgaria and Slovenia. There is greater inequality in the division of works in countries with a more traditional role allocation.
Men spend at least one hour more than women on employment, while women spend at least one hour more than men on household and family care. Taking both types of work into account, we can see that in Sweden, Norway and the United Kingdom the total committed time is almost equal for males and females. The largest gender differences in total committed time were observed in Bulgaria and Italy, where women work for nearly one and a half hours a day more than men. In Estonia, the total committed time of women in the age group 20–74 is one hour longer than that of men.
Division of work and total committed time
Gender differences in allocation of time for different types of work can be observed in many countries (Aliaga and Winqvist 2003; McGinnity and Russell 2008, Sayer, England et al. 2004). While men spend on average more time on employment, women are mainly occupied with household and family care. This division of work derives from the past when man as the breadwinner was the predominant model: going to work and earning money was a man’s duty, while women were mainly in charge of home and only a few of them were employed (Wharton 2005). When women entered the labour market en masse after World War II, the duration of time spent by women on employment increased and families with two breadwinners became quite common. Nevertheless, gender roles have not disappeared in the society – men have been significantly less eager in entering traditional ‘female’ areas than women in entering the labour market (McGinnity and Russell 2008). Arguably, this has resulted in a much higher total workload for women – they have a ‘second shift’ at home after paid employment (Hochschild and Machung 1989). However, gender differences in the length of total committed time are unclear. The idea of an additional shift can be interpreted verbally by concluding that women have redoubled their workload. This approach would mean large differences between women and men in the length of total committed time. A more widely accepted view is that due to lengthening of the time spent on employment, women have reduced, but not to an equivalent extent, the time spent by them on household and family care. It means that the total committed time is longer for women than for men, but gender differences are relatively small (McGinnity and Russell 2008; Bittman and Wajcman1999).
In Estonia, the division of work between women and men has developed somewhat differently than in western countries. Even though women and men have been in the labour market on a relatively equal basis for lots of years, this has not led to equality in the time spent on household care (Vainu 2010). In part, this is due to historical reasons. There was ostensible equality between sexes during the Soviet period, with both women and men being active in the labour market. However, this equality did not extend to the private sphere. Women were expected to be in charge of all household matters and being a mother was seen as a social obligation of women (Einhorn 1993). There were attempts to reduce women’s workload by socialising some household and childcare tasks (establishment of diners, laundry centres, nursery schools), but this removed only a part of women’s household duties. Women’s employment rate in Estonia remains almost equal with the corresponding indicator for men (57% of men and 54% of women in the age group 15–74 were employed in 2010), but there are large gender differences with regard to household chores. This means that the time spent on different types of work takes up a larger portion of a day for women than for men, which means that women have less leisure time remaining. However, the time spent on household care by men can be lengthened by increased participation of women in employment; as a result, a family has more than one breadwinner and men are able to dedicate more time to home and family. In Estonia, 39% of households have one employed member and a quarter of households have two ore more employed members. There are 37% of households where no one is employed; these are mostly households of pensioners.
There have been several explanations for unequal division of work between women and men and differences in the time spent on household care. In literature, gender gap is often explained through various economic and also directly gender-related reasons. According to Becker’s theory,
SOOLISED ERINEVUSED AJAKASUTUSES GENDER DIFFERENCES IN TIME USE
MEHE KODU ON MAAILM, NAISE MAAILM ON KODU? MAN’S HOME IS THE WORLD, WOMAN’S WORLD IS HER HOME? 30
women and men specialise in the kinds of work, where their relative productivity is higher. Consequently, if a man is more productive in the labour market (earns more money than his wife), it is more beneficial, from the household’s perspective, for the man to dedicate more time to employment and for the woman to dedicate more time to household work. Women specialise in household care primarily due to their lower human capital and biological differences (they have a biological advantage over men in caring for children). Specialisation in a certain type of work, however, should not lead to a difference in the total committed time. An explanation similar to Becker’s theory focuses on the time available for partners and the volume of household work that needs to be done. Household care is the responsibility of the partner who has more time available after paid work. In this respect, women are more affected than men by the time spent on employment, as well as by the number and age of children (McGinnity and Russell 2008).
According to McGinnity and Russell (2008), unequal division of household tasks can also be related to various power relations in household. Household care, as less desirable type of work, is left to the partner with fewer resources in household (lower education, lower wages or lower occupational position). The difference in division of work can also be explained by predominant gender roles in the society – by engaging in different types of work, women and men express behaviour that complies with social expectations for their sex. Consequently, unequal division of work is not necessarily perceived as unfair if it is in keeping with generally accepted social customs. Gender roles also explain why unemployed or inactive men spend less time on household work than their employed female partners. However, division of work in household also depends on the attitudes of household members towards daily chores, as well as on their sense of fairness. Women and men with more egalitarian views tend to divide household tasks on an equal basis. In households where partners have different views on fair division of work, this can more frequently lead to tensions and disagreements. (McGinnity and Russell 2008)
In the following paragraphs, we examine gender differences in total workload and division of work on different weekdays and across different socio-demographic parameters. The imbalance in the time spent on total work by women and men is a reflection of a gender gap in access to unoccupied time. Occupied time is the sum of time spent on employment, study, household and family care. Unoccupied time comprises time spent on personal care, volunteer work, recreation and entertainment.
In 2010, women spent a total of 7 hours and 19 minutes on all types of work. For men, different work duties took up 6 hours and 28 minutes of their day. Consequently, the total committed time of women in Estonia is almost an hour longer than that of men, but the structure of this time is different depending on sex. A large portion of women’s occupied time is unpaid time – the time spent on employment and study accounts for only 44% of the total volume of women’s work. Men, conversely, are more engaged in work activities outside home, spending 60% of their occupied time in this manner.
The division of work varies greatly between workdays and weekends (see Figure 4). While women and men spend over half of their occupied time during weekdays on employment and studies, the majority of duties during weekends are related to household tasks. The share of household work during weekends is particularly large for women, amounting to 81% of their total occupied time. If hours spent on employment and studies are added to the duration of household care activities, we can see that the total volume of work is always greater for women than for men, irrespective of the day. Gender differences are less noticeable on workdays than at weekends, when women work on average 74 minutes more per day than men.
The behaviour of women and men is affected by various factors associated with the persons themselves, with their households and area of residence. The duration and nature of work at home depends on the number and age of children, as well as living conditions of the household. The time spend on household tasks depends on the size of dwelling, existence of a garden, type of heating and other factors associated with dwelling. Certain individual characteristics – age, education and socio-economic status – can influence power relations and the consequent division of work in a household. They can also determine affiliation with a community (or generation) that holds certain views and beliefs, or serve as an indicator of available time. Time
SOOLISED ERINEVUSED AJAKASUTUSES GENDER DIFFERENCES IN TIME USE
MEHE KODU ON MAAILM, NAISE MAAILM ON KODU? MAN’S HOME IS THE WORLD, WOMAN’S WORLD IS HER HOME? 31
use is further influenced by the area of residence. Division of roles can be linked to different traditions in urban and rural areas. Opportunities available for employment or recreation may differ, too. (Figure 4)
Studies have indicated that parenthood leads to a more traditional division of work between women and men (McGinnity and Russell 2008). Women in families with small children tend to spend significantly more time on household care than men. If a household includes children younger than seven, women in that household spend almost six hours a day on household and family care. The contribution of men to household work in such households is only a little over two and a half hours. However, men with small children spend more time on employment than women, with an average of five hours a day. Even though the time spent on different types of work is much longer in families with small children than in other households, the gender differences are not particularly large in terms of total committed time. Women in these households spend almost 8.5 hours daily on different types of work, while men spend only one hour less. The impact of children on the division of work depends on the age of children. A child’s direct impact on the amount of household work can be in negative correlation with the age of the child – a child’s participation in household duties increases with age (Anxo and Carlin 2004).
Education influences the time use by women and men in two ways. Firstly, higher education increases the likelihood of higher income, which can mean more power and a greater say in decisions about the choice of work in a household. Secondly, education can be linked to a person’s beliefs. People with higher education are likely to have more egalitarian views and prefer more equal division of household tasks (Anxo and Carlin 2004). Studies have indicated that the time spent on household care by women decreases as their level of education increases, while highly educated men are more likely to contribute to household care (McGinnity and Russell 2008). In Estonia, however, if we exclude people who are still studying, education has no influence on the division of household work between women and men. However, education does influence the total volume of work. As people with higher education are more likely to be employed, the time spent on employment activities correspondingly increases at higher levels of education.
The impact of age on people’s time use manifests itself mainly through different life cycles. Young people are mostly engaged in studies and are still living with their parents and, consequently, the duration of time spent by them on household care and their total occupied time are not very large. The biggest workload has been observed in case of women and men aged 25–44 (see Figure 5). In case of women of this age, various types of work duties take up almost nine hours a day. The gender gap is also the largest in the age group 25–44, with the total committed time of men being one and a half hours shorter than that of women. This age coincides with active childcare and the most active engagement in employment. However, while women in the age group 25–44 spend a lot of time on household care, this is exceeded by women of at least 65 years of age (almost five hours a day). Comparison of age groups reveals that older men spend the most time on household duties, with only 45 minutes less than women of the same age. As only a few people of at least 65 years of age are engaged in employment, their total occupied time is the shortest across all age groups (excl. the 10–14-year-olds) and the gender gap in total committed time is also the smallest. (Figure 5)
The ratio between employment and leisure time depends on labour status. Employed persons spend significantly more time than others on paid work. The longer the time spent on employment, the less time remains for other activities. Nevertheless, employed persons spend on average three hours a day on household work. As a result, the total committed time of employed persons is significantly longer compared to others (see Figure 6). Even though paid work takes up almost an equal share of a day of employed women and men (5.5 and 6 hours, respectively), women have to spend an hour more than men on household care. The gender difference in the total committed time is the largest among the unemployed. Employment activities constitute a rather small share of the total committed time of unemployed women and unemployed men. Even though in this situation neither sex is seemingly prevented from taking care of the household, men still tend to spend a rather modest amount of time on household care. Unemployed women
SOOLISED ERINEVUSED AJAKASUTUSES GENDER DIFFERENCES IN TIME USE
MEHE KODU ON MAAILM, NAISE MAAILM ON KODU? MAN’S HOME IS THE WORLD, WOMAN’S WORLD IS HER HOME? 32
spend two hours more on household tasks than unemployed men. The inactive group includes students, pensioners, homemakers, etc., not included in employment. Looking separately at the inactive group, we can see that the largest gender difference appears in the time use of homemakers. Men and women stay at home for completely different reasons, which leads to a large difference in the time they spend on household care. Only 10% of men are homemakers, and most of them live in households without children, alone or with parents. However, the majority of female homemakers live in households with minor children (i.e., they are mothers who stay home with children). After summing up all obligations, we can see that the workday of female homemakers is almost three hours longer than that of men. The most equal division of work in the inactive group can be seen among pensioners. The gender gap in the time they spend on household work is only one hour and the time spent by them on employment is almost non-existent. (Figure 6)
Gender differences in the total committed time are also highlighted by a regression model that includes various factors which affect the time use of women and men (see Table 1). This model enables to assess the impact of each factor on total committed time, assuming that all other parameters remain unchanged. There are separate models for weekdays and weekends.
According to this model, women spend almost an hour more on employment and household work combined than men of similar age, labour status, education, age of children, place of residence and marital status. The total committed time of older men is shorter than in the age group 15–24. However, the total committed time of women is not significantly affected by age. Labour status affects the total committed time of both women and men, but the impact is greater in the case of men. Compared to employed men, inactive men have 4.5 hours less work-related obligations during weekdays. The amount of total committed time of men does not depend on their education. However, in the case of women, higher education means that they spend more time on different types of work activities.
Children usually lengthen the duration of both household work and employment activities. In a household with children under seven years of age, 62 minutes a day are added to both types of work. Children cause more additional work in particular for women. Although the share of employed men with children is larger and they spend more time on employment than men without children, the increase caused by children in the volume of household work for women is even higher. Women with children up to six years of age spend over an hour more on different types of work than women without children. For men, children increase the total committed time by half an hour. Married or cohabiting people work more than single persons. Living with a partner increases the obligations of women and men by more than half an hour. Place of residence has a somewhat greater impact on men’s time use – men living in cities have half an hour more unoccupied time than men in rural areas.
The gender gap in time dedicated to various works is larger at weekends than during weekdays. Women have, on average, 76 minutes less unoccupied time than men with similar socio-demographic parameters. As the importance of employment and studies is significantly smaller at weekends than on weekdays, labour status has less influence on total committed time during weekends than on weekdays and there are greater similarities in time use between groups of different labour status. Like on workdays, children have a great impact on women’s and men’s time use at weekends. The total committed time is shorter at weekends than on workdays in households with school-age children, but the total commited time of both women and men increases in households with children aged 0–6. If a household includes children of pre-school age, women spend over one and a half hours more and men spend three quarters of an hour more time on various work tasks at weekends than women and men without children. (Table 1)
Household care
Different household tasks and dividing them between household members is a constant source of negotiations and potential conflicts. People in a household need to eat, their clothes have to be washed and home needs to be kept clean. The question is, who agrees to perform these chores.
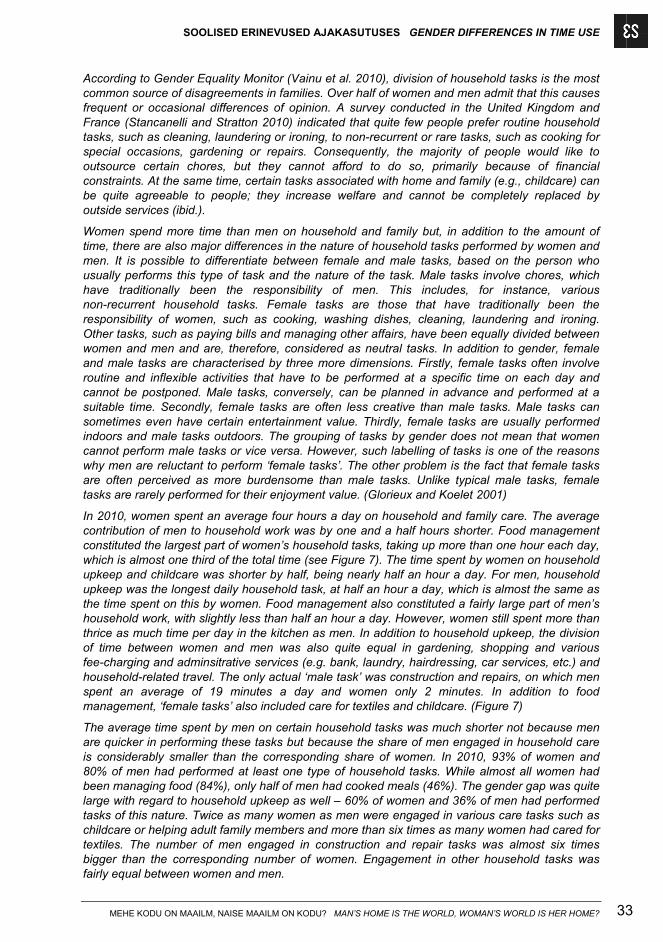
SOOLISED ERINEVUSED AJAKASUTUSES GENDER DIFFERENCES IN TIME USE
MEHE KODU ON MAAILM, NAISE MAAILM ON KODU? MAN’S HOME IS THE WORLD, WOMAN’S WORLD IS HER HOME? 33
According to Gender Equality Monitor (Vainu et al. 2010), division of household tasks is the most common source of disagreements in families. Over half of women and men admit that this causes frequent or occasional differences of opinion. A survey conducted in the United Kingdom and France (Stancanelli and Stratton 2010) indicated that quite few people prefer routine household tasks, such as cleaning, laundering or ironing, to non-recurrent or rare tasks, such as cooking for special occasions, gardening or repairs. Consequently, the majority of people would like to outsource certain chores, but they cannot afford to do so, primarily because of financial constraints. At the same time, certain tasks associated with home and family (e.g., childcare) can be quite agreeable to people; they increase welfare and cannot be completely replaced by outside services (ibid.).
Women spend more time than men on household and family but, in addition to the amount of time, there are also major differences in the nature of household tasks performed by women and men. It is possible to differentiate between female and male tasks, based on the person who usually performs this type of task and the nature of the task. Male tasks involve chores, which have traditionally been the responsibility of men. This includes, for instance, various non-recurrent household tasks. Female tasks are those that have traditionally been the responsibility of women, such as cooking, washing dishes, cleaning, laundering and ironing. Other tasks, such as paying bills and managing other affairs, have been equally divided between women and men and are, therefore, considered as neutral tasks. In addition to gender, female and male tasks are characterised by three more dimensions. Firstly, female tasks often involve routine and inflexible activities that have to be performed at a specific time on each day and cannot be postponed. Male tasks, conversely, can be planned in advance and performed at a suitable time. Secondly, female tasks are often less creative than male tasks. Male tasks can sometimes even have certain entertainment value. Thirdly, female tasks are usually performed indoors and male tasks outdoors. The grouping of tasks by gender does not mean that women cannot perform male tasks or vice versa. However, such labelling of tasks is one of the reasons why men are reluctant to perform ‘female tasks’. The other problem is the fact that female tasks are often perceived as more burdensome than male tasks. Unlike typical male tasks, female tasks are rarely performed for their enjoyment value. (Glorieux and Koelet 2001)
In 2010, women spent an average four hours a day on household and family care. The average contribution of men to household work was by one and a half hours shorter. Food management constituted the largest part of women’s household tasks, taking up more than one hour each day, which is almost one third of the total time (see Figure 7). The time spent by women on household upkeep and childcare was shorter by half, being nearly half an hour a day. For men, household upkeep was the longest daily household task, at half an hour a day, which is almost the same as the time spent on this by women. Food management also constituted a fairly large part of men’s household work, with slightly less than half an hour a day. However, women still spent more than thrice as much time per day in the kitchen as men. In addition to household upkeep, the division of time between women and men was also quite equal in gardening, shopping and various fee-charging and adminsitrative services (e.g. bank, laundry, hairdressing, car services, etc.) and household-related travel. The only actual ‘male task’ was construction and repairs, on which men spent an average of 19 minutes a day and women only 2 minutes. In addition to food management, ‘female tasks’ also included care for textiles and childcare. (Figure 7)
The average time spent by men on certain household tasks was much shorter not because men are quicker in performing these tasks but because the share of men engaged in household care is considerably smaller than the corresponding share of women. In 2010, 93% of women and 80% of men had performed at least one type of household tasks. While almost all women had been managing food (84%), only half of men had cooked meals (46%). The gender gap was quite large with regard to household upkeep as well – 60% of women and 36% of men had performed tasks of this nature. Twice as many women as men were engaged in various care tasks such as childcare or helping adult family members and more than six times as many women had cared for textiles. The number of men engaged in construction and repair tasks was almost six times bigger than the corresponding number of women. Engagement in other household tasks was fairly equal between women and men.
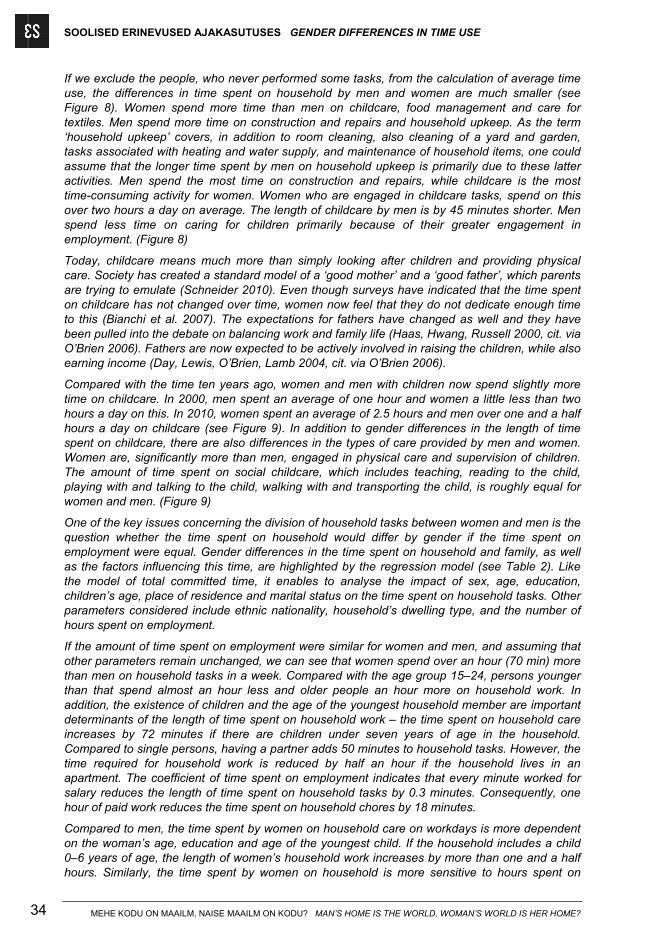
SOOLISED ERINEVUSED AJAKASUTUSES GENDER DIFFERENCES IN TIME USE
MEHE KODU ON MAAILM, NAISE MAAILM ON KODU? MAN’S HOME IS THE WORLD, WOMAN’S WORLD IS HER HOME? 34
If we exclude the people, who never performed some tasks, from the calculation of average time use, the differences in time spent on household by men and women are much smaller (see Figure 8). Women spend more time than men on childcare, food management and care for textiles. Men spend more time on construction and repairs and household upkeep. As the term ‘household upkeep’ covers, in addition to room cleaning, also cleaning of a yard and garden, tasks associated with heating and water supply, and maintenance of household items, one could assume that the longer time spent by men on household upkeep is primarily due to these latter activities. Men spend the most time on construction and repairs, while childcare is the most time-consuming activity for women. Women who are engaged in childcare tasks, spend on this over two hours a day on average. The length of childcare by men is by 45 minutes shorter. Men spend less time on caring for children primarily because of their greater engagement in employment. (Figure 8)
Today, childcare means much more than simply looking after children and providing physical care. Society has created a standard model of a ‘good mother’ and a ‘good father’, which parents are trying to emulate (Schneider 2010). Even though surveys have indicated that the time spent on childcare has not changed over time, women now feel that they do not dedicate enough time to this (Bianchi et al. 2007). The expectations for fathers have changed as well and they have been pulled into the debate on balancing work and family life (Haas, Hwang, Russell 2000, cit. via O’Brien 2006). Fathers are now expected to be actively involved in raising the children, while also earning income (Day, Lewis, O’Brien, Lamb 2004, cit. via O’Brien 2006).
Compared with the time ten years ago, women and men with children now spend slightly more time on childcare. In 2000, men spent an average of one hour and women a little less than two hours a day on this. In 2010, women spent an average of 2.5 hours and men over one and a half hours a day on childcare (see Figure 9). In addition to gender differences in the length of time spent on childcare, there are also differences in the types of care provided by men and women. Women are, significantly more than men, engaged in physical care and supervision of children. The amount of time spent on social childcare, which includes teaching, reading to the child, playing with and talking to the child, walking with and transporting the child, is roughly equal for women and men. (Figure 9)
One of the key issues concerning the division of household tasks between women and men is the question whether the time spent on household would differ by gender if the time spent on employment were equal. Gender differences in the time spent on household and family, as well as the factors influencing this time, are highlighted by the regression model (see Table 2). Like the model of total committed time, it enables to analyse the impact of sex, age, education, children’s age, place of residence and marital status on the time spent on household tasks. Other parameters considered include ethnic nationality, household’s dwelling type, and the number of hours spent on employment.
If the amount of time spent on employment were similar for women and men, and assuming that other parameters remain unchanged, we can see that women spend over an hour (70 min) more than men on household tasks in a week. Compared with the age group 15–24, persons younger than that spend almost an hour less and older people an hour more on household work. In addition, the existence of children and the age of the youngest household member are important determinants of the length of time spent on household work – the time spent on household care increases by 72 minutes if there are children under seven years of age in the household. Compared to single persons, having a partner adds 50 minutes to household tasks. However, the time required for household work is reduced by half an hour if the household lives in an apartment. The coefficient of time spent on employment indicates that every minute worked for salary reduces the length of time spent on household tasks by 0.3 minutes. Consequently, one hour of paid work reduces the time spent on household chores by 18 minutes.
Compared to men, the time spent by women on household care on workdays is more dependent on the woman’s age, education and age of the youngest child. If the household includes a child 0–6 years of age, the length of women’s household work increases by more than one and a half hours. Similarly, the time spent by women on household is more sensitive to hours spent on
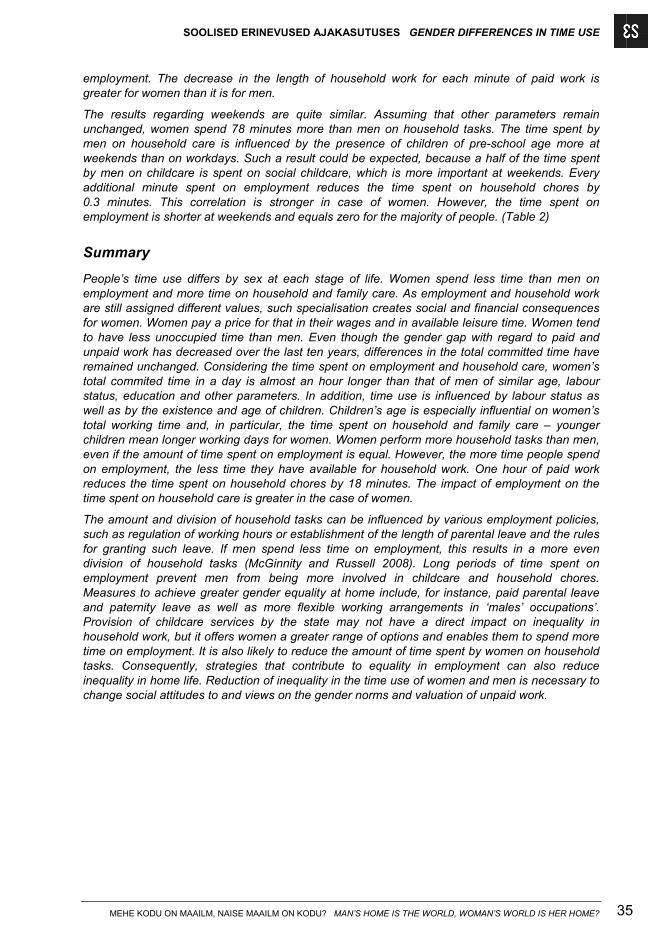
SOOLISED ERINEVUSED AJAKASUTUSES GENDER DIFFERENCES IN TIME USE
MEHE KODU ON MAAILM, NAISE MAAILM ON KODU? MAN’S HOME IS THE WORLD, WOMAN’S WORLD IS HER HOME? 35
employment. The decrease in the length of household work for each minute of paid work is greater for women than it is for men.
The results regarding weekends are quite similar. Assuming that other parameters remain unchanged, women spend 78 minutes more than men on household tasks. The time spent by men on household care is influenced by the presence of children of pre-school age more at weekends than on workdays. Such a result could be expected, because a half of the time spent by men on childcare is spent on social childcare, which is more important at weekends. Every additional minute spent on employment reduces the time spent on household chores by 0.3 minutes. This correlation is stronger in case of women. However, the time spent on employment is shorter at weekends and equals zero for the majority of people. (Table 2)
Summary
People’s time use differs by sex at each stage of life. Women spend less time than men on employment and more time on household and family care. As employment and household work are still assigned different values, such specialisation creates social and financial consequences for women. Women pay a price for that in their wages and in available leisure time. Women tend to have less unoccupied time than men. Even though the gender gap with regard to paid and unpaid work has decreased over the last ten years, differences in the total committed time have remained unchanged. Considering the time spent on employment and household care, women’s total commited time in a day is almost an hour longer than that of men of similar age, labour status, education and other parameters. In addition, time use is influenced by labour status as well as by the existence and age of children. Children’s age is especially influential on women’s total working time and, in particular, the time spent on household and family care – younger children mean longer working days for women. Women perform more household tasks than men, even if the amount of time spent on employment is equal. However, the more time people spend on employment, the less time they have available for household work. One hour of paid work reduces the time spent on household chores by 18 minutes. The impact of employment on the time spent on household care is greater in the case of women.
The amount and division of household tasks can be influenced by various employment policies, such as regulation of working hours or establishment of the length of parental leave and the rules for granting such leave. If men spend less time on employment, this results in a more even division of household tasks (McGinnity and Russell 2008). Long periods of time spent on employment prevent men from being more involved in childcare and household chores. Measures to achieve greater gender equality at home include, for instance, paid parental leave and paternity leave as well as more flexible working arrangements in ‘males’ occupations’. Provision of childcare services by the state may not have a direct impact on inequality in household work, but it offers women a greater range of options and enables them to spend more time on employment. It is also likely to reduce the amount of time spent by women on household tasks. Consequently, strategies that contribute to equality in employment can also reduce inequality in home life. Reduction of inequality in the time use of women and men is necessary to change social attitudes to and views on the gender norms and valuation of unpaid work.
TERVIS JA TÖÖVÕIME HEALTH AND CAPACITY FOR WORK
MEHE KODU ON MAAILM, NAISE MAAILM ON KODU? MAN’S HOME IS THE WORLD, WOMAN’S WORLD IS HER HOME? 36
TERVIS JA TÖÖVÕIME
Jaana Rahno
Sissejuhatus
Mis on üldse tervis? Maailma tervishoiuorganisatsioon (WHO) on 1948. aastal määratlenud tervist füüsilise, vaimse ja sotsiaalse heaoluna, mitte ainult haiguse puudumisena. Teisisõnu, inimese tervislik seisund on väga subjektiivne. Tervis ei ole elamise eesmärk, vaid igapäevase elu vahend (Rahvastiku … 2008). Ainult inimene ise tunneb oma tervist kõige paremini ja saab sellele hinnangu anda. Samal ajal võivad sarnase tervisliku seisundiga inimesed enda tervist hinnata täiesti erinevalt.
Tervis on inimese tähtsaim vara ja rahva tervis on ka rahva edasikestmise eeldus. Tervislikust seisundist oleneb inimese tegutsemisvõime ja tervem rahvas on tootlikum. Tervem tööjõud on ka paindlikum ja suudab paremini kohaneda muutuvate tingimustega, samuti väheneb tööjõu voolavus. Kehv tervis seevastu võib piirata täisväärtusliku elu elamist ja töötamist, samuti vähendab see töövõimeliste inimeste arvu, töötavate inimeste töötundide arvu ja produktiivsust (Rahvastiku … 2008).
Riik on viimastel aastatel pööranud järjest rohkem tähelepanu inimeste tervisekäitumise parandamisele, näiteks tubaka- ja alkoholivastaste reklaamidega. Samuti on palju tähelepanu pööratud vajadusele toituda tervislikult ja harrastada tervisesporti. Õnnetusjuhtumite ärahoidmiseks või võimalike vigastuste vältimiseks on välja antud vastavaid õigusakte (suitsuandurite kohustuslikkus, turvavarustuse kasutamise kohustus autos, kiivri kandmise kohustus kaherattalisega sõites jne). Seega on riigi panus inimeste tervise kaitseks olnud juba üsna suur ja seda kõike on tehtud selleks, et inimesed oleksid tervemad, sest kui rahvas on tervem, vähenevad ka tervishoiukulutused. Siiski saab enda tervise ja heaolu eest hoolitseda ainult inimene ise oma tegevuse ja käitumisega.
Tervist mõjutab inimese tervisekäitumine ehk inimese valikud, tema sotsiaalne keskkond ja sotsiaal-majanduslikud tegurid, kuid olulist rolli mängivad ka geneetilised ja bioloogilised, sealhulgas soolised eeldused (Lai 2010). Meeste ja naiste tervise erinevusi mõjutavad ühelt poolt soost tulenevad bioloogilised erinevused ning teiselt poolt meeste ja naiste erinev tervise-käitumine. Just soost tulenevaid tervise ja tervisekäitumise erinevusi siinses artiklis ongi vaadeldud.
WHO on selle kohta, kuidas sugu on seotud tervisega, öelnud nii: ühiskond kirjutab meestele ja naistele ette erinevaid rolle erinevates sotsiaalsetes keskkondades. Meestel ja naistel on erinevad võimalused ja vahendid ning ka nende otsused terviseteemadel on erinevad, näiteks haigestumise korral abi otsimine. Soorollid määravad ära ka sotsiaalse ja majandusliku käitumise, mis samuti mõjutavad meeste ja naiste terviseriske. (Gender … 2011)
Käesolev artikkel algab demograafilise ülevaatega sellest, kuidas meeste ja naiste osatähtsus rahvastikus vanuseti erineb ning mis on selle põhjus. Sellele järgneb meeste ja naiste suremuse ja surmapõhjuste võrdlus. Üle on vaadatud ka oodatav eluiga ja tervena elada jäänud aastad.
Artikli järgmine osa keskendub juba põhiliselt meeste ja naiste terviseseisundi erinevustele. Kõigepealt on antud põhjalikum ülevaade meeste ja naiste tervisehinnangutest vanuse, perekonnaseisu, hariduse, elukoha, rahvuse ja sissetuleku järgi. Käsitlemist leiab ka see osa rahvastikust, kellel on mõni pikaajaline haigus ja kelle igapäevategevused on terviseprobleemide tõttu piiratud ning kellel on kehtiv puude raskusaste.
Edasi räägib artikkel meeste ja naiste tervisekäitumisest arstiabi kasutamise ja selle kätte-saadavuse aspektist ning ravimite tarvitamise erinevustest. Samuti tuleb tervisekäitumise uurimisel kindlasti võrrelda meeste ja naiste suitsetamisharjumusi ning alkoholitarbimist, mis mõjutavad tervist väga suurel määral. Vaatluse all on ka meeste ja naiste kehamassiindeks, mis tegelikult on tervisekäitumise tulemus.
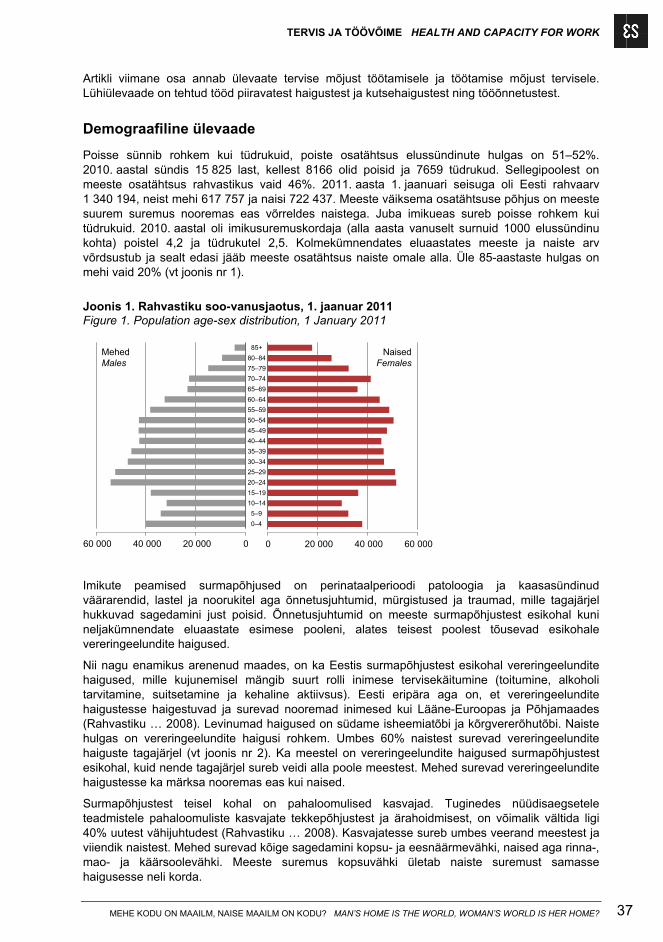
TERVIS JA TÖÖVÕIME HEALTH AND CAPACITY FOR WORK
MEHE KODU ON MAAILM, NAISE MAAILM ON KODU? MAN’S HOME IS THE WORLD, WOMAN’S WORLD IS HER HOME? 37
Artikli viimane osa annab ülevaate tervise mõjust töötamisele ja töötamise mõjust tervisele. Lühiülevaade on tehtud tööd piiravatest haigustest ja kutsehaigustest ning tööõnnetustest.
Demograafiline ülevaade
Poisse sünnib rohkem kui tüdrukuid, poiste osatähtsus elussündinute hulgas on 51–52%. 2010. aastal sündis 15 825 last, kellest 8166 olid poisid ja 7659 tüdrukud. Sellegipoolest on meeste osatähtsus rahvastikus vaid 46%. 2011. aasta 1. jaanuari seisuga oli Eesti rahvaarv 1 340 194, neist mehi 617 757 ja naisi 722 437. Meeste väiksema osatähtsuse põhjus on meeste suurem suremus nooremas eas võrreldes naistega. Juba imikueas sureb poisse rohkem kui tüdrukuid. 2010. aastal oli imikusuremuskordaja (alla aasta vanuselt surnuid 1000 elussündinu kohta) poistel 4,2 ja tüdrukutel 2,5. Kolmekümnendates eluaastates meeste ja naiste arv võrdsustub ja sealt edasi jääb meeste osatähtsus naiste omale alla. Üle 85-aastaste hulgas on mehi vaid 20% (vt joonis nr 1).
Joonis 1. Rahvastiku soo-vanusjaotus, 1. jaanuar 2011 Figure 1. Population age-sex distribution, 1 January 2011
0–4
5–9
10–14
15–19
20–24
25–29
30–34
35–39
40–44
45–49
50–54
55–59
60–64
65–69
70–74
75–79
80–84
85+
60 000 40 000 20 000 0 0 20 000 40 000 60 000
MehedMales
NaisedFemales
Imikute peamised surmapõhjused on perinataalperioodi patoloogia ja kaasasündinud väärarendid, lastel ja noorukitel aga õnnetusjuhtumid, mürgistused ja traumad, mille tagajärjel hukkuvad sagedamini just poisid. Õnnetusjuhtumid on meeste surmapõhjustest esikohal kuni neljakümnendate eluaastate esimese pooleni, alates teisest poolest tõusevad esikohale vereringeelundite haigused.
Nii nagu enamikus arenenud maades, on ka Eestis surmapõhjustest esikohal vereringeelundite haigused, mille kujunemisel mängib suurt rolli inimese tervisekäitumine (toitumine, alkoholi tarvitamine, suitsetamine ja kehaline aktiivsus). Eesti eripära aga on, et vereringeelundite haigustesse haigestuvad ja surevad nooremad inimesed kui Lääne-Euroopas ja Põhjamaades (Rahvastiku … 2008). Levinumad haigused on südame isheemiatõbi ja kõrgvererõhutõbi. Naiste hulgas on vereringeelundite haigusi rohkem. Umbes 60% naistest surevad vereringeelundite haiguste tagajärjel (vt joonis nr 2). Ka meestel on vereringeelundite haigused surmapõhjustest esikohal, kuid nende tagajärjel sureb veidi alla poole meestest. Mehed surevad vereringeelundite haigustesse ka märksa nooremas eas kui naised.
Surmapõhjustest teisel kohal on pahaloomulised kasvajad. Tuginedes nüüdisaegsetele teadmistele pahaloomuliste kasvajate tekkepõhjustest ja ärahoidmisest, on võimalik vältida ligi 40% uutest vähijuhtudest (Rahvastiku … 2008). Kasvajatesse sureb umbes veerand meestest ja viiendik naistest. Mehed surevad kõige sagedamini kopsu- ja eesnäärmevähki, naised aga rinna-, mao- ja käärsoolevähki. Meeste suremus kopsuvähki ületab naiste suremust samasse haigusesse neli korda.
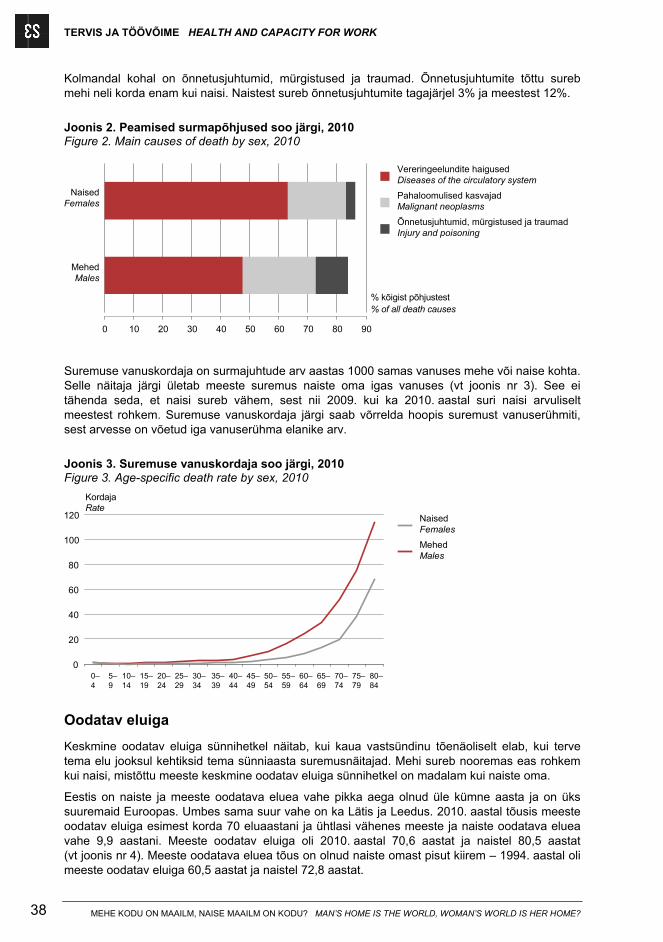
TERVIS JA TÖÖVÕIME HEALTH AND CAPACITY FOR WORK
MEHE KODU ON MAAILM, NAISE MAAILM ON KODU? MAN’S HOME IS THE WORLD, WOMAN’S WORLD IS HER HOME? 38
Kolmandal kohal on õnnetusjuhtumid, mürgistused ja traumad. Õnnetusjuhtumite tõttu sureb mehi neli korda enam kui naisi. Naistest sureb õnnetusjuhtumite tagajärjel 3% ja meestest 12%.
Joonis 2. Peamised surmapõhjused soo järgi, 2010 Figure 2. Main causes of death by sex, 2010
MehedMales
NaisedFemales
0 10 20 30 40 50 60 70 80 90
Vereringeelundite haigusedDiseases of the circulatory system
Pahaloomulised kasvajadMalignant neoplasms
Õnnetusjuhtumid, mürgistused ja traumadInjury and poisoning
% kõigist põhjustest% of all death causes
Suremuse vanuskordaja on surmajuhtude arv aastas 1000 samas vanuses mehe või naise kohta. Selle näitaja järgi ületab meeste suremus naiste oma igas vanuses (vt joonis nr 3). See ei tähenda seda, et naisi sureb vähem, sest nii 2009. kui ka 2010. aastal suri naisi arvuliselt meestest rohkem. Suremuse vanuskordaja järgi saab võrrelda hoopis suremust vanuserühmiti, sest arvesse on võetud iga vanuserühma elanike arv.
Joonis 3. Suremuse vanuskordaja soo järgi, 2010 Figure 3. Age-specific death rate by sex, 2010
KordajaRate
0–4
5–9
10–14
15–19
20–24
25–29
30–34
35–39
40–44
45–49
50–54
55–59
60–64
65–69
70–74
75–79
80–84
0
20
40
60
80
100
120
MehedMales
NaisedFemales
Oodatav eluiga
Keskmine oodatav eluiga sünnihetkel näitab, kui kaua vastsündinu tõenäoliselt elab, kui terve tema elu jooksul kehtiksid tema sünniaasta suremusnäitajad. Mehi sureb nooremas eas rohkem kui naisi, mistõttu meeste keskmine oodatav eluiga sünnihetkel on madalam kui naiste oma.
Eestis on naiste ja meeste oodatava eluea vahe pikka aega olnud üle kümne aasta ja on üks suuremaid Euroopas. Umbes sama suur vahe on ka Lätis ja Leedus. 2010. aastal tõusis meeste oodatav eluiga esimest korda 70 eluaastani ja ühtlasi vähenes meeste ja naiste oodatava eluea vahe 9,9 aastani. Meeste oodatav eluiga oli 2010. aastal 70,6 aastat ja naistel 80,5 aastat (vt joonis nr 4). Meeste oodatava eluea tõus on olnud naiste omast pisut kiirem – 1994. aastal oli meeste oodatav eluiga 60,5 aastat ja naistel 72,8 aastat.
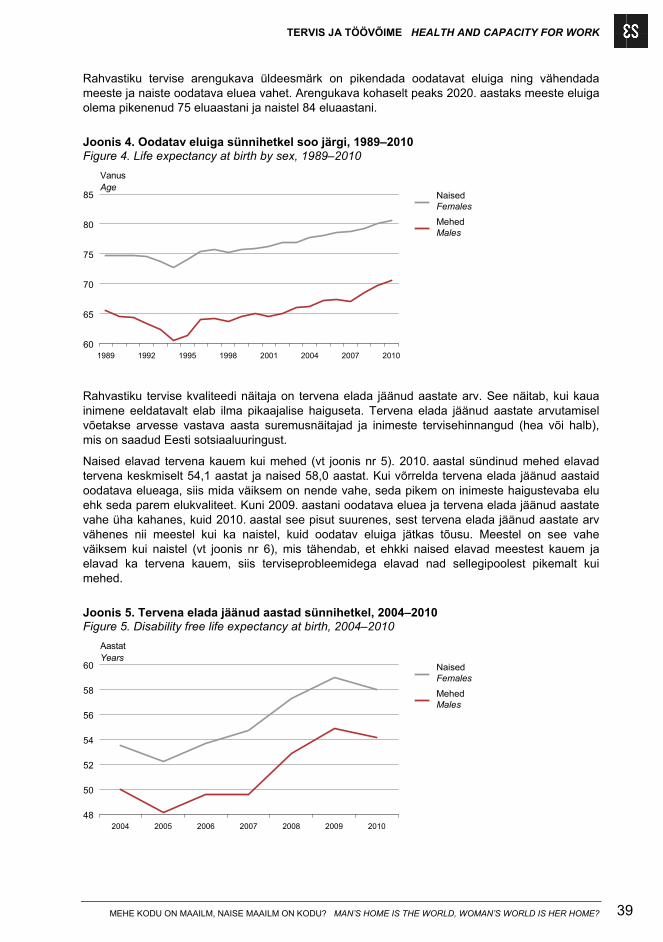
TERVIS JA TÖÖVÕIME HEALTH AND CAPACITY FOR WORK
MEHE KODU ON MAAILM, NAISE MAAILM ON KODU? MAN’S HOME IS THE WORLD, WOMAN’S WORLD IS HER HOME? 39
Rahvastiku tervise arengukava üldeesmärk on pikendada oodatavat eluiga ning vähendada meeste ja naiste oodatava eluea vahet. Arengukava kohaselt peaks 2020. aastaks meeste eluiga olema pikenenud 75 eluaastani ja naistel 84 eluaastani.
Joonis 4. Oodatav eluiga sünnihetkel soo järgi, 1989–2010 Figure 4. Life expectancy at birth by sex, 1989–2010
VanusAge
1989 1992 1995 1998 2001 2004 2007 201060
65
70
75
80
85
MehedMales
NaisedFemales
Rahvastiku tervise kvaliteedi näitaja on tervena elada jäänud aastate arv. See näitab, kui kaua inimene eeldatavalt elab ilma pikaajalise haiguseta. Tervena elada jäänud aastate arvutamisel võetakse arvesse vastava aasta suremusnäitajad ja inimeste tervisehinnangud (hea või halb), mis on saadud Eesti sotsiaaluuringust.
Naised elavad tervena kauem kui mehed (vt joonis nr 5). 2010. aastal sündinud mehed elavad tervena keskmiselt 54,1 aastat ja naised 58,0 aastat. Kui võrrelda tervena elada jäänud aastaid oodatava elueaga, siis mida väiksem on nende vahe, seda pikem on inimeste haigustevaba elu ehk seda parem elukvaliteet. Kuni 2009. aastani oodatava eluea ja tervena elada jäänud aastate vahe üha kahanes, kuid 2010. aastal see pisut suurenes, sest tervena elada jäänud aastate arv vähenes nii meestel kui ka naistel, kuid oodatav eluiga jätkas tõusu. Meestel on see vahe väiksem kui naistel (vt joonis nr 6), mis tähendab, et ehkki naised elavad meestest kauem ja elavad ka tervena kauem, siis terviseprobleemidega elavad nad sellegipoolest pikemalt kui mehed.
Joonis 5. Tervena elada jäänud aastad sünnihetkel, 2004–2010 Figure 5. Disability free life expectancy at birth, 2004–2010
AastatYears
2004 2005 2006 2007 2008 2009 201048
50
52
54
56
58
60
MehedMales
NaisedFemales
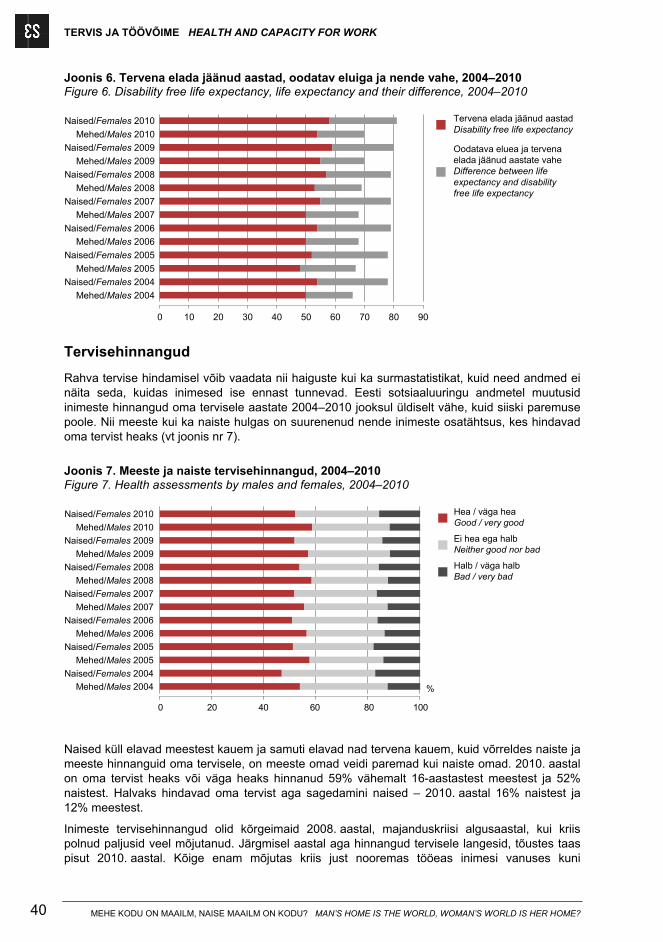
TERVIS JA TÖÖVÕIME HEALTH AND CAPACITY FOR WORK
MEHE KODU ON MAAILM, NAISE MAAILM ON KODU? MAN’S HOME IS THE WORLD, WOMAN’S WORLD IS HER HOME? 40
Joonis 6. Tervena elada jäänud aastad, oodatav eluiga ja nende vahe, 2004–2010 Figure 6. Disability free life expectancy, life expectancy and their difference, 2004–2010
Mehed/Males 2004
Naised/Females 2004
Mehed/Males 2005
Naised/Females 2005
Mehed/Males 2006
Naised/Females 2006
Mehed/Males 2007
Naised/Females 2007
Mehed/Males 2008
Naised/Females 2008
Mehed/Males 2009
Naised/Females 2009
Mehed/Males 2010
Naised/Females 2010
0 10 20 30 40 50 60 70 80 90
Tervena elada jäänud aastadDisability free life expectancy
Oodatava eluea ja tervenaelada jäänud aastate vaheDifference between lifeexpectancy and disabilityfree life expectancy
Tervisehinnangud
Rahva tervise hindamisel võib vaadata nii haiguste kui ka surmastatistikat, kuid need andmed ei näita seda, kuidas inimesed ise ennast tunnevad. Eesti sotsiaaluuringu andmetel muutusid inimeste hinnangud oma tervisele aastate 2004–2010 jooksul üldiselt vähe, kuid siiski paremuse poole. Nii meeste kui ka naiste hulgas on suurenenud nende inimeste osatähtsus, kes hindavad oma tervist heaks (vt joonis nr 7).
Joonis 7. Meeste ja naiste tervisehinnangud, 2004–2010 Figure 7. Health assessments by males and females, 2004–2010
Hea / väga heaGood / very good
Ei hea ega halbNeither good nor bad
Halb / väga halbBad / very bad
%
0 20 40 60 80 100
Mehed/Males 2004
Naised/Females 2004
Mehed/Males 2005
Naised/Females 2005
Mehed/Males 2006
Naised/Females 2006
Mehed/Males 2007
Naised/Females 2007
Mehed/Males 2008
Naised/Females 2008
Mehed/Males 2009
Naised/Females 2009
Mehed/Males 2010
Naised/Females 2010
Naised küll elavad meestest kauem ja samuti elavad nad tervena kauem, kuid võrreldes naiste ja meeste hinnanguid oma tervisele, on meeste omad veidi paremad kui naiste omad. 2010. aastal on oma tervist heaks või väga heaks hinnanud 59% vähemalt 16-aastastest meestest ja 52% naistest. Halvaks hindavad oma tervist aga sagedamini naised – 2010. aastal 16% naistest ja 12% meestest.
Inimeste tervisehinnangud olid kõrgeimaid 2008. aastal, majanduskriisi algusaastal, kui kriis polnud paljusid veel mõjutanud. Järgmisel aastal aga hinnangud tervisele langesid, tõustes taas pisut 2010. aastal. Kõige enam mõjutas kriis just nooremas tööeas inimesi vanuses kuni
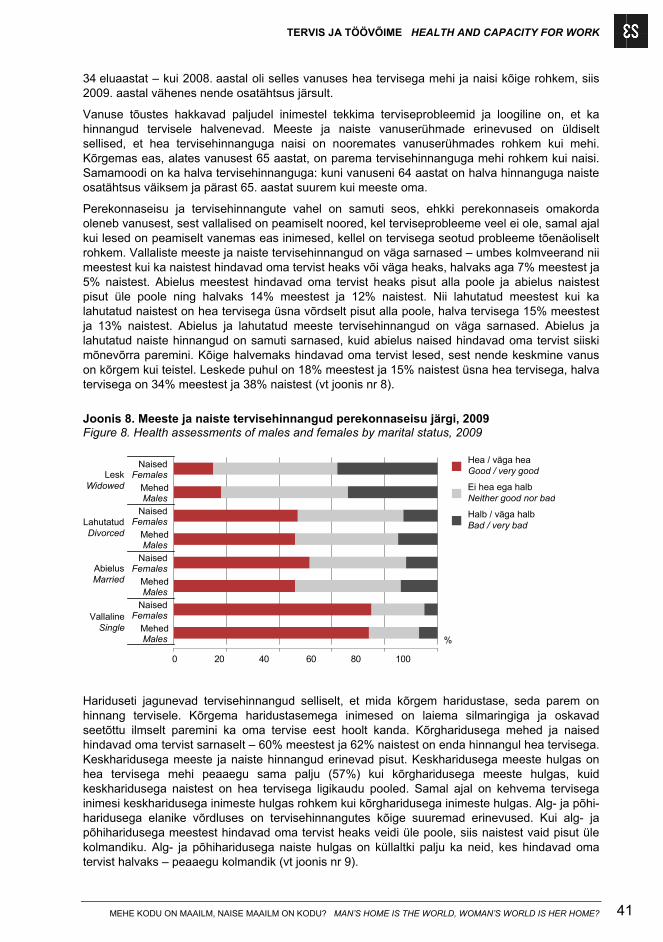
TERVIS JA TÖÖVÕIME HEALTH AND CAPACITY FOR WORK
MEHE KODU ON MAAILM, NAISE MAAILM ON KODU? MAN’S HOME IS THE WORLD, WOMAN’S WORLD IS HER HOME? 41
34 eluaastat – kui 2008. aastal oli selles vanuses hea tervisega mehi ja naisi kõige rohkem, siis 2009. aastal vähenes nende osatähtsus järsult.
Vanuse tõustes hakkavad paljudel inimestel tekkima terviseprobleemid ja loogiline on, et ka hinnangud tervisele halvenevad. Meeste ja naiste vanuserühmade erinevused on üldiselt sellised, et hea tervisehinnanguga naisi on nooremates vanuserühmades rohkem kui mehi. Kõrgemas eas, alates vanusest 65 aastat, on parema tervisehinnanguga mehi rohkem kui naisi. Samamoodi on ka halva tervisehinnanguga: kuni vanuseni 64 aastat on halva hinnanguga naiste osatähtsus väiksem ja pärast 65. aastat suurem kui meeste oma.
Perekonnaseisu ja tervisehinnangute vahel on samuti seos, ehkki perekonnaseis omakorda oleneb vanusest, sest vallalised on peamiselt noored, kel terviseprobleeme veel ei ole, samal ajal kui lesed on peamiselt vanemas eas inimesed, kellel on tervisega seotud probleeme tõenäoliselt rohkem. Vallaliste meeste ja naiste tervisehinnangud on väga sarnased – umbes kolmveerand nii meestest kui ka naistest hindavad oma tervist heaks või väga heaks, halvaks aga 7% meestest ja 5% naistest. Abielus meestest hindavad oma tervist heaks pisut alla poole ja abielus naistest pisut üle poole ning halvaks 14% meestest ja 12% naistest. Nii lahutatud meestest kui ka lahutatud naistest on hea tervisega üsna võrdselt pisut alla poole, halva tervisega 15% meestest ja 13% naistest. Abielus ja lahutatud meeste tervisehinnangud on väga sarnased. Abielus ja lahutatud naiste hinnangud on samuti sarnased, kuid abielus naised hindavad oma tervist siiski mõnevõrra paremini. Kõige halvemaks hindavad oma tervist lesed, sest nende keskmine vanus on kõrgem kui teistel. Leskede puhul on 18% meestest ja 15% naistest üsna hea tervisega, halva tervisega on 34% meestest ja 38% naistest (vt joonis nr 8).
Joonis 8. Meeste ja naiste tervisehinnangud perekonnaseisu järgi, 2009 Figure 8. Health assessments of males and females by marital status, 2009
MehedMales
NaisedFemales
MehedMales
NaisedFemales
MehedMales
NaisedFemales
MehedMales
NaisedFemales
%
0 20 40 60 80 100
Hea / väga heaGood / very good
Ei hea ega halbNeither good nor bad
Halb / väga halbBad / very bad
LeskWidowed
LahutatudDivorced
AbielusMarried
VallalineSingle
Hariduseti jagunevad tervisehinnangud selliselt, et mida kõrgem haridustase, seda parem on hinnang tervisele. Kõrgema haridustasemega inimesed on laiema silmaringiga ja oskavad seetõttu ilmselt paremini ka oma tervise eest hoolt kanda. Kõrgharidusega mehed ja naised hindavad oma tervist sarnaselt – 60% meestest ja 62% naistest on enda hinnangul hea tervisega. Keskharidusega meeste ja naiste hinnangud erinevad pisut. Keskharidusega meeste hulgas on hea tervisega mehi peaaegu sama palju (57%) kui kõrgharidusega meeste hulgas, kuid keskharidusega naistest on hea tervisega ligikaudu pooled. Samal ajal on kehvema tervisega inimesi keskharidusega inimeste hulgas rohkem kui kõrgharidusega inimeste hulgas. Alg- ja põhi-haridusega elanike võrdluses on tervisehinnangutes kõige suuremad erinevused. Kui alg- ja põhiharidusega meestest hindavad oma tervist heaks veidi üle poole, siis naistest vaid pisut üle kolmandiku. Alg- ja põhiharidusega naiste hulgas on küllaltki palju ka neid, kes hindavad oma tervist halvaks – peaaegu kolmandik (vt joonis nr 9).
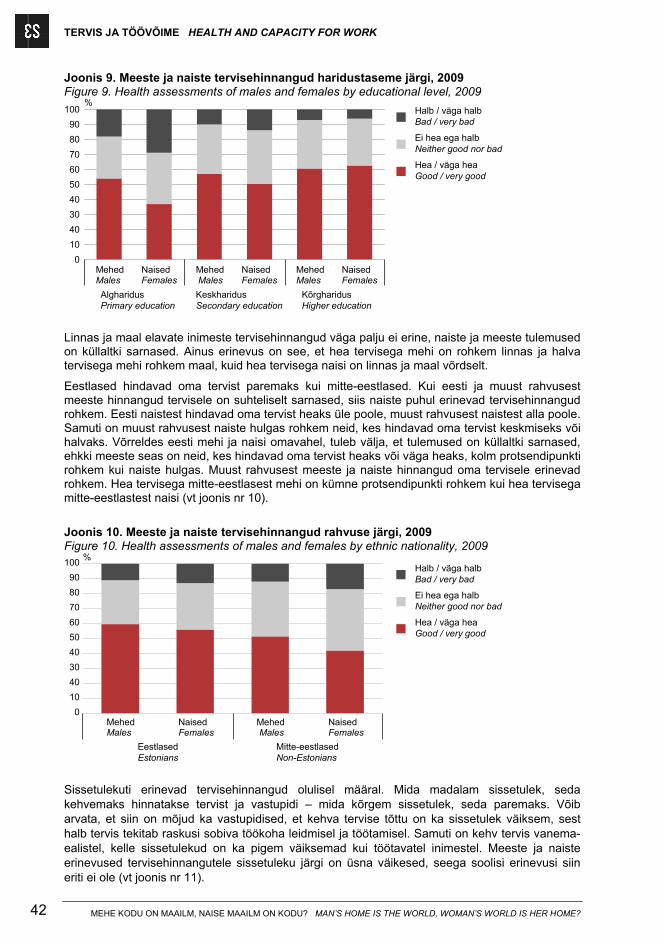
TERVIS JA TÖÖVÕIME HEALTH AND CAPACITY FOR WORK
MEHE KODU ON MAAILM, NAISE MAAILM ON KODU? MAN’S HOME IS THE WORLD, WOMAN’S WORLD IS HER HOME? 42
Joonis 9. Meeste ja naiste tervisehinnangud haridustaseme järgi, 2009 Figure 9. Health assessments of males and females by educational level, 2009
MehedMales
NaisedFemales
MehedMales
NaisedFemales
MehedMales
NaisedFemales
0
10
40
30
40
50
60
70
80
90
100
Hea / väga heaGood / very good
Ei hea ega halbNeither good nor bad
Halb / väga halbBad / very bad
%
AlgharidusPrimary education
KeskharidusSecondary education
KõrgharidusHigher education
Linnas ja maal elavate inimeste tervisehinnangud väga palju ei erine, naiste ja meeste tulemused on küllaltki sarnased. Ainus erinevus on see, et hea tervisega mehi on rohkem linnas ja halva tervisega mehi rohkem maal, kuid hea tervisega naisi on linnas ja maal võrdselt.
Eestlased hindavad oma tervist paremaks kui mitte-eestlased. Kui eesti ja muust rahvusest meeste hinnangud tervisele on suhteliselt sarnased, siis naiste puhul erinevad tervisehinnangud rohkem. Eesti naistest hindavad oma tervist heaks üle poole, muust rahvusest naistest alla poole. Samuti on muust rahvusest naiste hulgas rohkem neid, kes hindavad oma tervist keskmiseks või halvaks. Võrreldes eesti mehi ja naisi omavahel, tuleb välja, et tulemused on küllaltki sarnased, ehkki meeste seas on neid, kes hindavad oma tervist heaks või väga heaks, kolm protsendipunkti rohkem kui naiste hulgas. Muust rahvusest meeste ja naiste hinnangud oma tervisele erinevad rohkem. Hea tervisega mitte-eestlasest mehi on kümne protsendipunkti rohkem kui hea tervisega mitte-eestlastest naisi (vt joonis nr 10).
Joonis 10. Meeste ja naiste tervisehinnangud rahvuse järgi, 2009 Figure 10. Health assessments of males and females by ethnic nationality, 2009
%
MehedMales
NaisedFemales
MehedMales
NaisedFemales
0
10
40
30
40
50
60
70
80
90
100
Hea / väga heaGood / very good
Ei hea ega halbNeither good nor bad
Halb / väga halbBad / very bad
EestlasedEstonians
Mitte-eestlasedNon-Estonians
Sissetulekuti erinevad tervisehinnangud olulisel määral. Mida madalam sissetulek, seda kehvemaks hinnatakse tervist ja vastupidi – mida kõrgem sissetulek, seda paremaks. Võib arvata, et siin on mõjud ka vastupidised, et kehva tervise tõttu on ka sissetulek väiksem, sest halb tervis tekitab raskusi sobiva töökoha leidmisel ja töötamisel. Samuti on kehv tervis vanema-ealistel, kelle sissetulekud on ka pigem väiksemad kui töötavatel inimestel. Meeste ja naiste erinevused tervisehinnangutele sissetuleku järgi on üsna väikesed, seega soolisi erinevusi siin eriti ei ole (vt joonis nr 11).
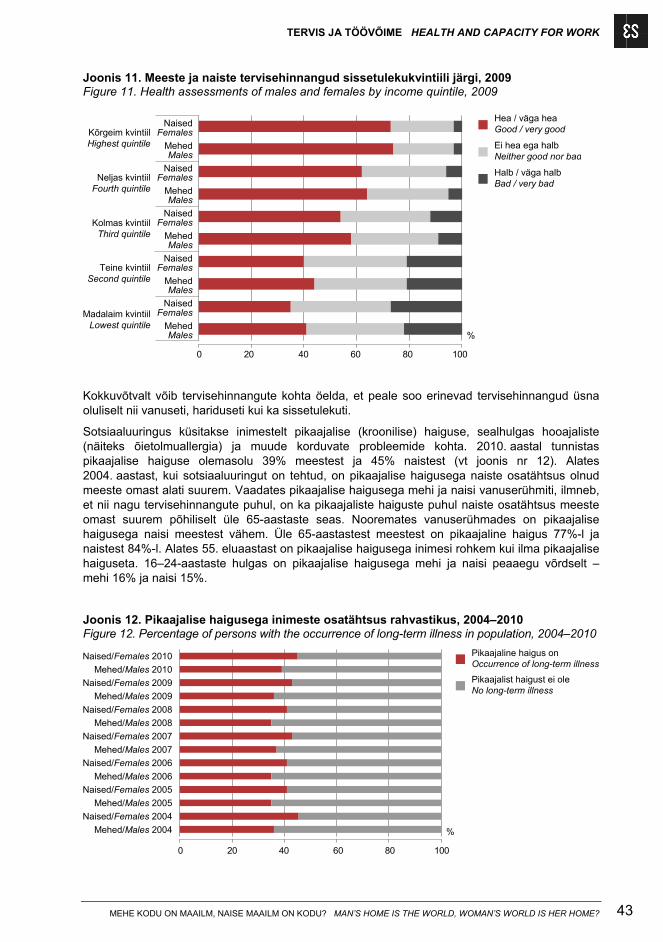
TERVIS JA TÖÖVÕIME HEALTH AND CAPACITY FOR WORK
MEHE KODU ON MAAILM, NAISE MAAILM ON KODU? MAN’S HOME IS THE WORLD, WOMAN’S WORLD IS HER HOME? 43
Joonis 11. Meeste ja naiste tervisehinnangud sissetulekukvintiili järgi, 2009 Figure 11. Health assessments of males and females by income quintile, 2009
MehedMales
NaisedFemales
MehedMales
NaisedFemales
MehedMales
NaisedFemales
MehedMales
NaisedFemales
MehedMales
NaisedFemales
%
0 20 40 60 80 100
Kõrgeim kvintiilHighest quintile
Neljas kvintiilFourth quintile
Kolmas kvintiilThird quintile
Teine kvintiilSecond quintile
Madalaim kvintiilLowest quintile
Hea / väga heaGood / very good
Ei hea ega halbNeither good nor bad
Halb / väga halbBad / very bad
Kokkuvõtvalt võib tervisehinnangute kohta öelda, et peale soo erinevad tervisehinnangud üsna oluliselt nii vanuseti, hariduseti kui ka sissetulekuti.
Sotsiaaluuringus küsitakse inimestelt pikaajalise (kroonilise) haiguse, sealhulgas hooajaliste (näiteks õietolmuallergia) ja muude korduvate probleemide kohta. 2010. aastal tunnistas pikaajalise haiguse olemasolu 39% meestest ja 45% naistest (vt joonis nr 12). Alates 2004. aastast, kui sotsiaaluuringut on tehtud, on pikaajalise haigusega naiste osatähtsus olnud meeste omast alati suurem. Vaadates pikaajalise haigusega mehi ja naisi vanuserühmiti, ilmneb, et nii nagu tervisehinnangute puhul, on ka pikaajaliste haiguste puhul naiste osatähtsus meeste omast suurem põhiliselt üle 65-aastaste seas. Nooremates vanuserühmades on pikaajalise haigusega naisi meestest vähem. Üle 65-aastastest meestest on pikaajaline haigus 77%-l ja naistest 84%-l. Alates 55. eluaastast on pikaajalise haigusega inimesi rohkem kui ilma pikaajalise haiguseta. 16–24-aastaste hulgas on pikaajalise haigusega mehi ja naisi peaaegu võrdselt – mehi 16% ja naisi 15%.
Joonis 12. Pikaajalise haigusega inimeste osatähtsus rahvastikus, 2004–2010 Figure 12. Percentage of persons with the occurrence of long-term illness in population, 2004–2010
Mehed/Males 2004
Naised/Females 2004
Mehed/Males 2005
Naised/Females 2005
Mehed/Males 2006
Naised/Females 2006
Mehed/Males 2007
Naised/Females 2007
Mehed/Males 2008
Naised/Females 2008
Mehed/Males 2009
Naised/Females 2009
Mehed/Males 2010
Naised/Females 2010 Pikaajaline haigus onOccurrence of long-term illness
Pikaajalist haigust ei oleNo long-term illness
%
0 20 40 60 80 100
TERVIS JA TÖÖVÕIME HEALTH AND CAPACITY FOR WORK
MEHE KODU ON MAAILM, NAISE MAAILM ON KODU? MAN’S HOME IS THE WORLD, WOMAN’S WORLD IS HER HOME? 44
Pikaajaline haigus võib, aga ei pruugi takistada inimeste igapäevaelu ja tegemisi. Seetõttu on neid, kelle igapäevategevused on terviseprobleemide tõttu piiratud, vähem kui pikaajalise haigusega inimesi. Vähemalt 16-aastaste hulgas on tervisest tingitud igapäevategevuse piirangutega naisi mõnevõrra rohkem kui mehi. Nii olid 2010. aastal suurel või mõningal määral piiratud 27% meeste ja 33% naiste igapäevategemised. Kõrvutades mehi ja naisi vanuserühmiti, siis kuni 64-aastasteni on meeste ja naiste jaotus sarnane, kuid üle 65-aastaste seas on erinevused suuremad ja seda meeste kasuks, s.t mehi piirab tervis vähem kui naisi. Üle 65-aastastest meestest on tervisest tulenevaid suuremaid või väiksemaid piiranguid 62%-l ja naistest 70%-l.
Kehtiv puude raskusaste ehk ametlik puue on 10%-l rahvastikust (2011. aasta 1. jaanuari seisuga). Puudega inimeste arv on viimastel aastatel tasapisi, kuid pidevalt suurenenud. Selle üks põhjuseid on kindlasti rahvastiku vananemine, ehkki puudega inimeste arv on kasvanud kõikides vanuserühmades. Viimastel aastatel on puudega inimeste arvu kasv olnud osaliselt seotud ka majandusraskustega – puudega inimesed saavad riigilt sotsiaaltoetust, mistõttu üha rohkem puudega inimesi on hakanud end arvele võtma.
Puudega naisi on mõnevõrra rohkem kui puudega mehi. 2011. aasta alguses oli kehtiva puude raskusastmega 11% naistest ja 8% meestest. Kui aga vaadata mehi ja naisi vanuse järgi, siis tuleb välja, et kuni vanuseni 62 aastat on puudega naisi tegelikult vähem kui puudega mehi ja alles alates vanusest 63 aastat ületab puudega naiste osatähtsus kogurahvastikus puudega meeste oma. Selle põhjus on, et suurem osa puudega inimesi ongi selles vanuses – 67% puudega naistest ja 46% puudega meestest on üle 63 aasta vanused.
Tervisekäitumine
Tervisekäitumine on inimese tegevus tervise edendamiseks, kaitsmiseks või säilitamiseks, olenemata inimese terviseseisundist ja sellest, kas see tegevus on lõppkokkuvõttes objektiivselt efektiivne või mitte (Rahvastiku … 2008). Uuringud on näidanud, et mehed ja naised kasutavad pakutavaid tervishoiuteenuseid erinevalt (Wilkins jt 2008). Bioloogiliste erinevuste tõttu on meeste ja naiste terviseprobleemid erilaadsed või avalduvad erinevalt ja seetõttu on ka vajadus tervis-hoiuteenuste järele erinev.
Perearstiabi on kõigile ravikindlustatud inimestele tagatud ilma lisatasuta (Esmatasandi … 2008). 2010. aasta Eesti täiskasvanud rahvastiku tervisekäitumise uuringu järgi (Tekkel ja Veideman 2011) kasutavad naised arstiabi rohkem kui mehed. Perearsti juures oli uuringule eelnenud 12 kuu jooksul käinud kolmveerand naistest ja kaks kolmandikku meestest (vt joonis nr 13). Aasta jooksul käisid mehed perearsti juures keskmiselt 1,9 korda, naised aga 2,4 korda. Samal ajal on nende hulgas, kes arsti juures ei käinud, ka neid, kes perearstiabi vajasid, kuid mingil põhjusel seda ei saanud. Sotsiaaluuringu kohaselt ei saanud 2009. aastal perearstiabi vajanutest abi nii 2% meestest kui ka naistest. Põhjused, miks perearstile ei saadud, aga on meeste ja naiste puhul küllaltki erinevad. Meestel oli peamine põhjus ravikindlustuse puudumine (38%), naiste seas oli sama põhjus 8%-l. Naistel oli levinuim perearstiabist ilmajäämise põhjus liiga pikk ootejärjekord (46%), meestel oli see põhjus teisel kohal (23%). Naistel oli põhjustest teisel kohal aga arstipunkti kaugus ja sinna pääsemise raskused, mida pidas probleemiks 16% naistest ja vaid 7% meestest.
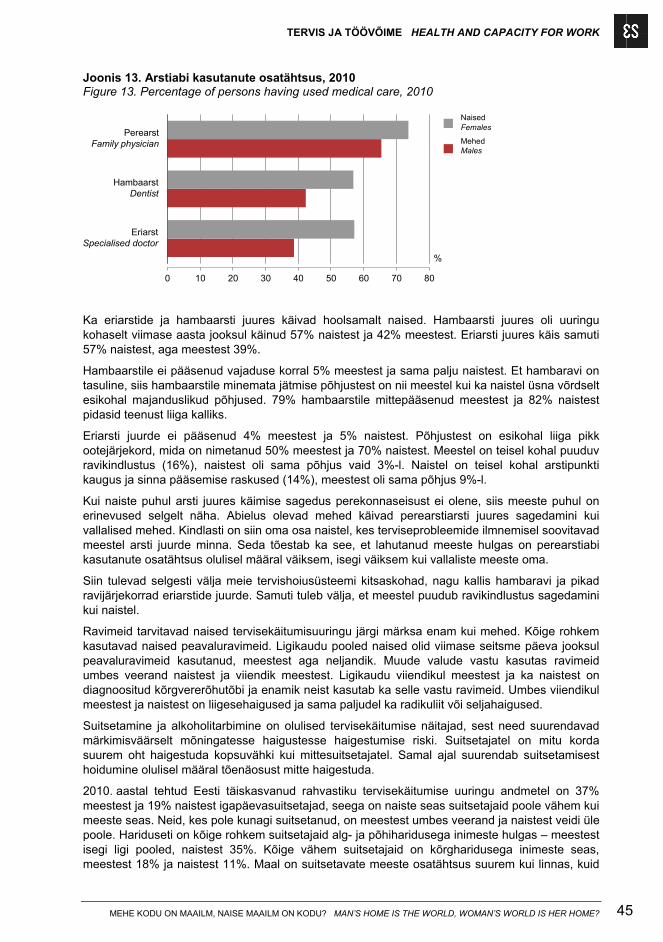
TERVIS JA TÖÖVÕIME HEALTH AND CAPACITY FOR WORK
MEHE KODU ON MAAILM, NAISE MAAILM ON KODU? MAN’S HOME IS THE WORLD, WOMAN’S WORLD IS HER HOME? 45
Joonis 13. Arstiabi kasutanute osatähtsus, 2010 Figure 13. Percentage of persons having used medical care, 2010
EriarstSpecialised doctor
HambaarstDentist
PerearstFamily physician
0 10 20 30 40 50 60 70 80
MehedMales
NaisedFemales
%
Ka eriarstide ja hambaarsti juures käivad hoolsamalt naised. Hambaarsti juures oli uuringu kohaselt viimase aasta jooksul käinud 57% naistest ja 42% meestest. Eriarsti juures käis samuti 57% naistest, aga meestest 39%.
Hambaarstile ei pääsenud vajaduse korral 5% meestest ja sama palju naistest. Et hambaravi on tasuline, siis hambaarstile minemata jätmise põhjustest on nii meestel kui ka naistel üsna võrdselt esikohal majanduslikud põhjused. 79% hambaarstile mittepääsenud meestest ja 82% naistest pidasid teenust liiga kalliks.
Eriarsti juurde ei pääsenud 4% meestest ja 5% naistest. Põhjustest on esikohal liiga pikk ootejärjekord, mida on nimetanud 50% meestest ja 70% naistest. Meestel on teisel kohal puuduv ravikindlustus (16%), naistest oli sama põhjus vaid 3%-l. Naistel on teisel kohal arstipunkti kaugus ja sinna pääsemise raskused (14%), meestest oli sama põhjus 9%-l.
Kui naiste puhul arsti juures käimise sagedus perekonnaseisust ei olene, siis meeste puhul on erinevused selgelt näha. Abielus olevad mehed käivad perearstiarsti juures sagedamini kui vallalised mehed. Kindlasti on siin oma osa naistel, kes terviseprobleemide ilmnemisel soovitavad meestel arsti juurde minna. Seda tõestab ka see, et lahutanud meeste hulgas on perearstiabi kasutanute osatähtsus olulisel määral väiksem, isegi väiksem kui vallaliste meeste oma.
Siin tulevad selgesti välja meie tervishoiusüsteemi kitsaskohad, nagu kallis hambaravi ja pikad ravijärjekorrad eriarstide juurde. Samuti tuleb välja, et meestel puudub ravikindlustus sagedamini kui naistel.
Ravimeid tarvitavad naised tervisekäitumisuuringu järgi märksa enam kui mehed. Kõige rohkem kasutavad naised peavaluravimeid. Ligikaudu pooled naised olid viimase seitsme päeva jooksul peavaluravimeid kasutanud, meestest aga neljandik. Muude valude vastu kasutas ravimeid umbes veerand naistest ja viiendik meestest. Ligikaudu viiendikul meestest ja ka naistest on diagnoositud kõrgvererõhutõbi ja enamik neist kasutab ka selle vastu ravimeid. Umbes viiendikul meestest ja naistest on liigesehaigused ja sama paljudel ka radikuliit või seljahaigused.
Suitsetamine ja alkoholitarbimine on olulised tervisekäitumise näitajad, sest need suurendavad märkimisväärselt mõningatesse haigustesse haigestumise riski. Suitsetajatel on mitu korda suurem oht haigestuda kopsuvähki kui mittesuitsetajatel. Samal ajal suurendab suitsetamisest hoidumine olulisel määral tõenäosust mitte haigestuda.
2010. aastal tehtud Eesti täiskasvanud rahvastiku tervisekäitumise uuringu andmetel on 37% meestest ja 19% naistest igapäevasuitsetajad, seega on naiste seas suitsetajaid poole vähem kui meeste seas. Neid, kes pole kunagi suitsetanud, on meestest umbes veerand ja naistest veidi üle poole. Hariduseti on kõige rohkem suitsetajaid alg- ja põhiharidusega inimeste hulgas – meestest isegi ligi pooled, naistest 35%. Kõige vähem suitsetajaid on kõrgharidusega inimeste seas, meestest 18% ja naistest 11%. Maal on suitsetavate meeste osatähtsus suurem kui linnas, kuid
TERVIS JA TÖÖVÕIME HEALTH AND CAPACITY FOR WORK
MEHE KODU ON MAAILM, NAISE MAAILM ON KODU? MAN’S HOME IS THE WORLD, WOMAN’S WORLD IS HER HOME? 46
naiste puhul on see suurem just linnas (v.a Tallinn). Eesti rahvusest meeste hulgas on mõnevõrra rohkem suitsetajaid kui mitte-eestlaste hulgas, naiste puhul aga on olukord vastupidine. Suitsetajate osatähtsus on suurim töötute, üksi elavate ja madala sissetulekuga meeste ja naiste seas.
Põhjuseid, miks suitsetajaid on rohkem meeste ja madalama haridustasemega inimeste seas, on mitu: teadmiste puudumine suitsetamise tagajärgede kohta, suhtumine ja väärtused, mis mõjutavad inimese suitsetamisharjumusi, ning psühholoogiline stress, mis ajendab suitsetamise alustamist või takistab suitsetamisest loobumist (Kunst jt 2002).
Liigne alkoholitarbimine aga suurendab tõenäosust haigestuda maksatsirroosi, mis võib samuti lõppeda surmaga. Alkoholitarbimine suurendab ka õnnetustesse sattumise tõenäosust. Mehed tarvitavad alkoholi naistest enam. 37% meestest tarvitavad alkoholi mõni kord nädalas, sama sagedusega alkoholi tarbivaid naisi on aga 13% – peaaegu kolm korda vähem kui mehi. Üldse ei tarbi alkoholi 8% meestest ja 13% naistest. Maal elavad mehed tarbivad alkoholi sagedamini kui linnas elavad mehed – 50% maal ja 40% linnas elavatest meestest tarbivad alkoholi mitu korda nädalas. Ka maal elavad naised tarbivad alkoholi linnas elavatest naistest rohkem. Mitu korda nädalas tarbib alkoholi 16% maa- ja 12% linnanaistest.
Sellele, et suitsetamine ja alkoholitarbimine on maal levinum kui linnas, annavad tõestust ka leibkonna eelarve uuringu tulemused, mille kohaselt tubakatoodetele ja alkoholile tehtavad kulutused on maapiirkondades mõnevõrra suuremad kui linnades ja seda nii kulutuste suuruse kui ka osatähtsuse poolest.
Meestest tarvitavad kõige vähem alkoholi keskharidusega ja kõige rohkem keskeriharidusega mehed. Naiste hulgas on alkoholitarbijaid kõige rohkem aga kõrgharidusega naiste seas. Eesti rahvusest mehed ja naised on suuremad alkoholitarbijad kui mitte-eestlased. Alkoholitarbimise suurenemist mõjutab ka sissetulek – alkoholitarvitajaid on rohkem kõrgema sissetulekuga meeste ja naiste hulgas.
Alkoholitarvitamise järel tehakse sageli valesid otsuseid, mis põhjustab riskikäitumist, eriti just meestel, ja see võib lõppeda õnnetusega. Sellise käitumise üks näiteid on mootorsõiduki juhtimine alkoholijoobes. Mehed asuvad pärast alkoholitarbimist autorooli sagedamini kui naised. Tervisekäitumisuuringu järgi oli viimase aasta jooksul korduvalt pärast alkoholitarbimist rooli istunud 3,4% 16–64-aastastest meestest ja 0,3% samas eas naistest. Kõige rohkem on alkoholijoobes autojuhte 25–34-aastaste seas – meestest lausa 7,2%, naistest 0,3%.
Kehamassiindeks, mis näitab pikkuse ja kaalu suhet, on tänapäeval väga oluline tervisekäitumise näitaja, sest ülekaal soodustab haigestumist mitmesse haigusesse, nagu südameveresoon-konnahaigused ja diabeet. Nii nagu paljudes teistes lääneriikides suureneb ka Eestis ülekaaluliste inimeste hulk pidevalt. Samal ajal saavad inimesed ülekaalust hoidudes ise südame-veresoonkonnahaigustesse haigestumist olulisel määral vähendada.
Eesti täiskasvanud rahvastiku terviseuuringu andmetel suureneb vanuse tõustes ülekaaluliste inimeste osatähtsus. Normaalkaalus on kolmveerand 16–24-aastastest meestest (kehamassi-indeks 18,5–24,9), samas vanuses naistest aga mõnevõrra vähem. Vanuse tõustes hakkab normaalkaalus meeste osatähtsus kiiresti vähenema ja vanuses 25–34 on normaalkaalus juba veidi alla poole meestest. Naistest on vanuses 25–34 normaalkaalus kaks kolmandikku. Vanuses 55–64 on normaalkaalus mehi 30%, naisi mõnevõrra vähem – 27%. Ülekaalulisi (kehamassi-indeks 25,0–29,9) mehi on igas vanuserühmas rohkem kui ülekaalulisi naisi. Vanuses 55–64 on ülekaalulisi mehi 45% ja ülekaalulisi naisi 42%. Rasvunud (kehamassiindeks üle 30) on 4% 16–24-aastastest meestest ja 3% samaealistest naistest. Vanusega rasvunute osatähtsus suureneb ja vanuses 55–64 aastat on rasvunud veerand meestest ja kolmandik naistest.
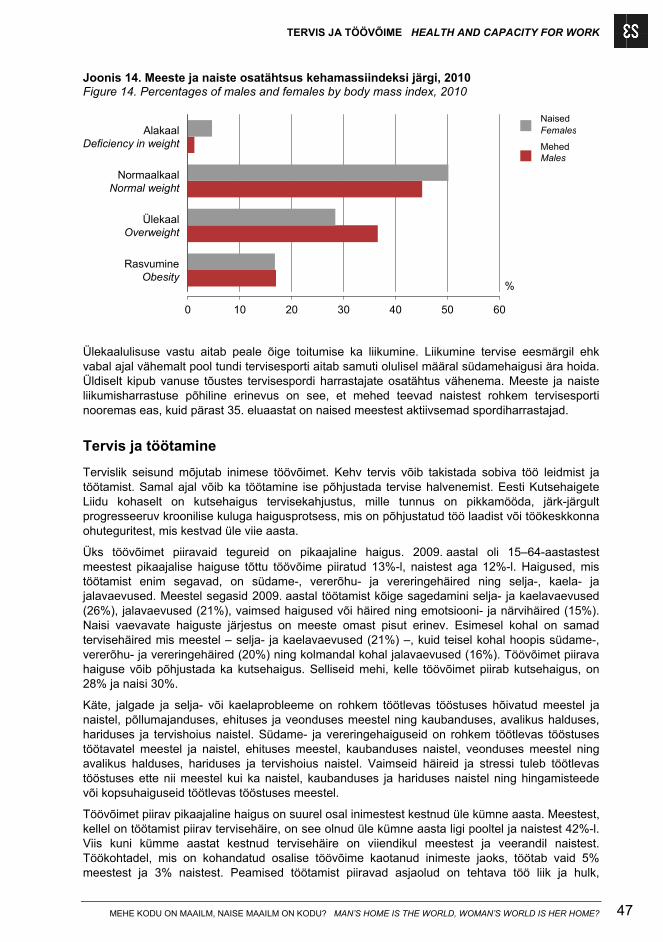
TERVIS JA TÖÖVÕIME HEALTH AND CAPACITY FOR WORK
MEHE KODU ON MAAILM, NAISE MAAILM ON KODU? MAN’S HOME IS THE WORLD, WOMAN’S WORLD IS HER HOME? 47
Joonis 14. Meeste ja naiste osatähtsus kehamassiindeksi järgi, 2010 Figure 14. Percentages of males and females by body mass index, 2010
RasvumineObesity
ÜlekaalOverweight
NormaalkaalNormal weight
AlakaalDeficiency in weight
0 10 20 30 40 50 60
%
MehedMales
NaisedFemales
Ülekaalulisuse vastu aitab peale õige toitumise ka liikumine. Liikumine tervise eesmärgil ehk vabal ajal vähemalt pool tundi tervisesporti aitab samuti olulisel määral südamehaigusi ära hoida. Üldiselt kipub vanuse tõustes tervisespordi harrastajate osatähtus vähenema. Meeste ja naiste liikumisharrastuse põhiline erinevus on see, et mehed teevad naistest rohkem tervisesporti nooremas eas, kuid pärast 35. eluaastat on naised meestest aktiivsemad spordiharrastajad.
Tervis ja töötamine
Tervislik seisund mõjutab inimese töövõimet. Kehv tervis võib takistada sobiva töö leidmist ja töötamist. Samal ajal võib ka töötamine ise põhjustada tervise halvenemist. Eesti Kutsehaigete Liidu kohaselt on kutsehaigus tervisekahjustus, mille tunnus on pikkamööda, järk-järgult progresseeruv kroonilise kuluga haigusprotsess, mis on põhjustatud töö laadist või töökeskkonna ohuteguritest, mis kestvad üle viie aasta.
Üks töövõimet piiravaid tegureid on pikaajaline haigus. 2009. aastal oli 15–64-aastastest meestest pikaajalise haiguse tõttu töövõime piiratud 13%-l, naistest aga 12%-l. Haigused, mis töötamist enim segavad, on südame-, vererõhu- ja vereringehäired ning selja-, kaela- ja jalavaevused. Meestel segasid 2009. aastal töötamist kõige sagedamini selja- ja kaelavaevused (26%), jalavaevused (21%), vaimsed haigused või häired ning emotsiooni- ja närvihäired (15%). Naisi vaevavate haiguste järjestus on meeste omast pisut erinev. Esimesel kohal on samad tervisehäired mis meestel – selja- ja kaelavaevused (21%) –, kuid teisel kohal hoopis südame-, vererõhu- ja vereringehäired (20%) ning kolmandal kohal jalavaevused (16%). Töövõimet piirava haiguse võib põhjustada ka kutsehaigus. Selliseid mehi, kelle töövõimet piirab kutsehaigus, on 28% ja naisi 30%.
Käte, jalgade ja selja- või kaelaprobleeme on rohkem töötlevas tööstuses hõivatud meestel ja naistel, põllumajanduses, ehituses ja veonduses meestel ning kaubanduses, avalikus halduses, hariduses ja tervishoius naistel. Südame- ja vereringehaiguseid on rohkem töötlevas tööstuses töötavatel meestel ja naistel, ehituses meestel, kaubanduses naistel, veonduses meestel ning avalikus halduses, hariduses ja tervishoius naistel. Vaimseid häireid ja stressi tuleb töötlevas tööstuses ette nii meestel kui ka naistel, kaubanduses ja hariduses naistel ning hingamisteede või kopsuhaiguseid töötlevas tööstuses meestel.
Töövõimet piirav pikaajaline haigus on suurel osal inimestest kestnud üle kümne aasta. Meestest, kellel on töötamist piirav tervisehäire, on see olnud üle kümne aasta ligi pooltel ja naistest 42%-l. Viis kuni kümme aastat kestnud tervisehäire on viiendikul meestest ja veerandil naistest. Töökohtadel, mis on kohandatud osalise töövõime kaotanud inimeste jaoks, töötab vaid 5% meestest ja 3% naistest. Peamised töötamist piiravad asjaolud on tehtava töö liik ja hulk,
TERVIS JA TÖÖVÕIME HEALTH AND CAPACITY FOR WORK
MEHE KODU ON MAAILM, NAISE MAAILM ON KODU? MAN’S HOME IS THE WORLD, WOMAN’S WORLD IS HER HOME? 48
mõnevõrra vähem inimesi on piirava asjaoluna nimetanud raskusi töö ja kodu vahelisel liikumisel. Neid kolme töötamist piiravat asjaolu on sagedamini nimetanud mehed.
Tööõnnetus on äkktervisekahjustus või surm, mis tabab inimest tööülesannet täites, tööandja loal tehtaval tööl, tööaja hulka arvataval töövaheajal või muul tööandja huvides tegutsemisel. Tööõnnetuseks ei arvestata õnnetust, mis juhtub teel tööle, see kuulub tavaliste õnnetusjuhtumite hulka.
Tööinspektsiooni andmetel registreeriti 2009. aastal 2939 ja 2010. aastal 3213 tööõnnetust. Tööjõu-uuringu andmetel juhtub vigastustega lõppevaid tööõnnetusi meeste seas umbes kolm korda sagedamini kui naiste seas. 14%-l meestest, kellega viimase aasta jooksul oli tööõnnetusi juhtunud, oli neid olnud kaks ja 8%-l lausa kolm. Tööõnnetused juhtusid peamiselt töötlevas tööstuses, veonduses ja ehituses.
Meeste sagedasem tööõnnetustesse sattumine tuleb sellest, et mehed töötavadki rohkem sellistel ametikohtadel nagu ehitus ja transport, kus risk õnnetustesse sattuda on suhteliselt suurem. Naised töötavad rohkem kontoris ja kaupluses, kus õnnetuste oht on väiksem. Teine oluline põhjus on ka see, et naised töötavad meestest keskmiselt vähem tunde ja seetõttu viibivad tööl vähem aega, mistõttu õnnetustesse sattumise tõenäosus on väiksem (Dupre 2002). Pealegi on naised juba loomult alalhoidlikumad ja võtavad vähem riske kui mehed, sellepärast juhtub naistega ka vähem õnnetusi.
Kokkuvõte
Meeste ja naiste bioloogilised erinevused annavad ka erinevad eeldused tervisele. Ühiskonnas välja kujunenud sotsiaalsed rollid avaldavad mõju meeste ja naiste käitumisele ning sellest tulenevalt ka tervisele. Peale selle mõjutavad tervist mingil määral ka väliskeskkonna tegurid (kliima, elu- ja töökeskkond). Kõikide nende tegurite koosmõjul kujunebki välja iga inimese tervislik seisund.
Ehkki poisse sünnib rohkem kui tüdrukuid, on meeste osatähtsus rahvastikus ometi väiksem kui naiste oma. See tuleb sellest, et mehed surevad naistest sagedamini nooremas eas. Peamine põhjus on meeste suurem suremus õnnetusjuhtumite tagajärjel. Meeste varajasema suremuse tõttu on ka meeste keskmine oodatav eluiga naiste omast umbes kümme aastat lühem. Tervena elavad naised meestest aga neli aastat kauem.
Pikemast elueast hoolimata on naised oma tervise suhtes kriitilisemad. Naised ise hindavad oma tervist mõnevõrra halvemini kui mehed. Kõige paremini hindavad oma tervist kõrgharidusega inimesed. Algharidusega meeste ja naiste tervisehinnangute erinevused on kõige suuremad. Kõige kehvemaks hindavad oma tervist algharidusega naised. Eestlased hindavad oma tervist paremaks kui mitte-eestlased, nii mehed kui ka naised. Kõrgema sissetulekuga inimeste hulka kuulub kõige suurem osa hea tervisega inimestest ja kõige väiksem osa halva tervisega inimestest. Võrreldes tervisehinnanguid sissetulekuti, on hinnangud seda halvemad, mida madalam on sissetulek. Madalama sissetulekuga inimeste puhul suurenevad ka meeste ja naiste tervisehinnangute erinevused – madalaimasse sissetulekukvintiili kuuluvad naised hindavad oma tervist kõige halvemini.
Tervisekäitumise puhul on siinses artiklis vaadeldud ühelt poolt seda, kas ja kui palju inimesed arsti juures käivad ja ravimeid tarbivad. Teiselt poolt aga on vaadeldud inimeste riskikäitumist, nagu suitsetamine, alkoholitarbimine ja ülekaalulisus, mis võivad põhjustada mitmesuguseid kroonilisi haigusi. Artiklist selgub, et naised käivad arsti juures sagedamini kui mehed, samuti tarvitavad nad rohkem ravimeid. Samal ajal on meeste hulgas kaks korda rohkem suitsetajaid ja kolm korda rohkem sagedasi alkoholitarvitajaid. Suitsetamist soodustab sotsiaalne staatus – rohkem suitsetavad madala haridustaseme ja madala sissetulekuga maal elavad inimesed. Alkoholitarbijaid aga on jällegi rohkem kõrgema sissetulekuga inimeste hulgas.
Kehamassiindeksi järgi on normaalkaalus naisi rohkem kui normaalkaalus mehi ja ülekaalus mehi omakorda rohkem kui ülekaalus naisi. Samal ajal on liigses ülekaalus ehk rasvunud mehi ja naisi peaaegu võrdselt.
TERVIS JA TÖÖVÕIME HEALTH AND CAPACITY FOR WORK
MEHE KODU ON MAAILM, NAISE MAAILM ON KODU? MAN’S HOME IS THE WORLD, WOMAN’S WORLD IS HER HOME? 49
Tervislik seisund mõjutab muu hulgas ka töövõimet ja töötamine, vastupidi, mõjutab tervist. Töötamist segavad nii meestel kui ka naistel peamiselt selja- ja kaelavaevused. Tööst põhjustatud haigused ehk kutsehaigused piiravad töövõimet umbes kolmandikul meestest ja naistest.
Tööõnnetusi juhtub kolm korda sagedamini meeste kui naistega, sest tegevusaladel, kus juhtub tööõnnetusi kõige sagedamini, nagu töötlev tööstus, veondus ja ehitus, töötavad peamiselt mehed.
Allikad Sources
Dupre, D. (2002). The health and safety of men and women at work. – Statistics in focus. Theme 3: Population and social conditions. Luxembourg: Office for Official Publications of the European Communities, No 4.
Eesti Kutsehaigete Liit. (2011). [www] http://ekl.nukka.eu/?doc=10000 (26.08.2011).
Esmatasandi tervishoiu arengukava aastateks 2009–2015. (2008). Tallinn: Sotsiaalministeerium.
Gender and Health (Canada). (2011). [www] http://genderandhealth.ca/en/modules/introduction/introduction-genderasadeterminantofhealth-Shayna-01.jsp?r= (26.08.2011).
Kunst, A., Leinsalu, M., Kasmel, A., Habicht, J. (2002). Social inequalities in Estonia: main report. Tallinn: Sotsiaalministeerium.
Lai, T. (2010). Soolised terviseerinevused Eestis. – Teel tasakaalustatud ühiskonda. Naised ja mehed Eestis. Tallinn: Sotsiaalministeerium, lk 77–88.
Rahvastiku tervise arengukava 2009–2020. (2008). Tallinn: Sotsiaalministeerium.
Tekkel, M., Veideman, T. (2011). Eesti täiskasvanud rahvastiku tervisekäitumise uuring, 2010. Tallinn: Tervise Arengu Instituut.
Tööinspektsioon. (2011). [www] http://www.ti.ee (26.08.2011).
Wilkins, D., Dr Payne, S., Dr Granville, G., Dr Branney, P. (2008). The Gender and Access to Health Services Study. Final Report.
TERVIS JA TÖÖVÕIME HEALTH AND CAPACITY FOR WORK
MEHE KODU ON MAAILM, NAISE MAAILM ON KODU? MAN’S HOME IS THE WORLD, WOMAN’S WORLD IS HER HOME? 50
HEALTH AND CAPACITY FOR WORK
Jaana Rahno
Introduction
What exactly is health? According to the definition stated in 1948 by the World Health Organisation (WHO), health is “a status of complete physical, mental and social well-being and not merely the absence of disease or infirmity”. In other words, human health status is a rather subjective matter. Health is not the purpose of life, but means for daily living (Rahvastiku … 2008). Only the people themselves can best know and assess their health. Meanwhile, people with similar health status may provide quite dissimilar assessments of their health.
Health is our most important asset and a crucial factor for the survival of the nation. Personal capacity to act depends on health status, and people with better health are more productive. Healthier labour force is also more flexible and capable of better adaptation to changing conditions, reducing labour turnover. Poor health, however, may affect the quality of life and work and it reduces the number of people capable of work as well as the number of working hours and productivity of employed persons (Rahvastiku … 2008).
During the recent years, the state has paid increasingly more attention to improving people’s health behaviour, such as launching anti-tobacco and anti-alcohol campaigns. Great emphasis has also been placed on the necessity of healthy diet and recreational sports. Relevant legislation has been adopted to avoid accidents or prevent accident-induced injuries (mandatory use of smoke detectors, mandatory use of safety equipment in cars, mandatory use of helmet when driving two-wheel vehicles, etc.). Thus, the state has already contributed quite a lot to the protection of human health. All this has been done to improve the health of our people. Healthier nation means lower costs on health care. However, everyone can take care of their health and well-being only by their own actions and conduct.
Health is affected by human health behaviour, i.e. their choices, social environment and socio-economic factors, but important role is also attributed to genetic and biological, including gender prerequisites (Lai 2010). On the one hand, differences between the health of men and women are affected by gender-specific biological differences and, on the other hand, dissimilar health behaviour on behalf of men and women. This article is written in view of gender-induced differences in health and health behaviour.
WHO states the following about the impact of gender on health: the society prescribes different roles for men and women in dissimilar social environments. Men and women have different means and opportunities and they make different decisions on health-related issues, e.g. seeking help in case of illness. Gender roles also determine social and economic behaviour, which also affect health hazards of males and females (Gender … 2011).
This article begins with a demographic overview of the age-specific changes in the proportions of men and women in population and the reasons thereof. The overview is followed by a comparison of mortality and the causes of death of men and women. This section also touches upon life expectancy and the disability free life expectancy.
The article continues by focusing mostly on differences in the health status of men and women. First, a more in-depth overview is given about the health assessments of men and women by age, marital status, education, place of residence, ethnic nationality and income. Consideration is also given to the proportion of population suffering from some long-term illness and thus having restricted daily activities due to a health problem, as well as people with official disability.
The article continues by observing the health behaviour of men and women from the aspect of use and availability of medical care, and differences in using medicinal products. When examining health behaviour one should definitely compare smoking habits and alcohol consumption by men and women, both of which have significant impact on health. Another factor
TERVIS JA TÖÖVÕIME HEALTH AND CAPACITY FOR WORK
MEHE KODU ON MAAILM, NAISE MAAILM ON KODU? MAN’S HOME IS THE WORLD, WOMAN’S WORLD IS HER HOME? 51
under observation is the body mass index of men and women, which actually reflects the outcome of health behaviour.
The last part of the article reviews the impact of health on the capacity for work and the impact of work on health. A short overview is provided about diseases restricting the capacity for work, occupational diseases and work-related accidents.
Demographic overview
There are more boys than girls born. The proportion of boys among live births is 51–52%. In 2010 the total of 15,825 children were born, 8,166 of them were boys and 7,659 were girls. Nevertheless, the proportion of males in total population is only 46%. As of 1 January 2011 the Estonian population was 1,340,194, including 617,757 males and 722,437 females. Lower proportion of men in the population is due to higher mortality of men at an early age in comparison with women. Already during infancy mortality is higher in case of boys than girls. In 2010 the infant mortality rate (number of infant deaths during the first year of life per 1,000 live births) was 4.2 for boys and 2.5 for girls. The number of men and women evens up in their thirties and from there on the proportion of men is lower than that of women. The proportion of men among the population aged 85 and older is only 20%. (Figure 1)
The main causes of infant death include certain conditions originating in the perinatal period and congenital malformations. In childhood and adolescence the main causes of death include accidents, injury and poisoning, which tend to affect boys to a greater extent. Accidents are men’s primary cause of death until the first half of their forties and are replaced by diseases of the circulatory system starting from the second half of their forties.
Similar to most of the developed countries, the highest burden of disease in Estonia is caused by diseases of the circulatory system, which are greatly affected by personal health behaviour (nutrition, alcohol consumption, smoking and physical activity). However, in comparison to Western Europe and the Nordic countries, Estonia stands out with a relatively early age at which diseases of the circulatory system appear and lead to death (Rahvastiku … 2008). More common diseases include ischaemic heart diseases and hypertensive diseases. Diseases of the circulatory system are more common among women. Approximately 60% of women die because of diseases of the circulatory system (see Figure 2). Diseases of the circulatory system are the top cause of death for men as well, but less than a half of the men die because of these diseases. Men die from diseases of the circulatory system at a significantly earlier age than women.
Malignant neouplasms represent the second leading cause of death. Modern knowledge of the causes and prevention of malignant neoplasms enables to prevent nearly 40% of new cancer cases (Rahvastiku … 2008). Neoplasms are considered the cause of death for about a quarter of men and one fifth of women. The most frequently fatal neoplasms are malignant neoplasm of larynx, trachea, bronchus and lung and malignant neoplasm of prostate for men, and malignant neoplasm of breast, malignant neoplasm of stomach and malignant neoplasm of colon for women. Men’s mortality due to malignant neoplasm of larynx, trachea, bronchus and lung exceeds that of women by four times.
The third main cause of death includes accidents, injury and poisoning. The number of men who die because of an accident exceeds the relevant number of women by fourfold. A total of 3% of women and 12% of men are killed as a result of accidents. (Figure 2)
Age-specific death rate represents the annual number of deaths per 1,000 men or women in the same age group. According to this indicator, the mortality of men exceeds the mortality of women in each age group (see Figure 3). This does not mean as if there are fewer deaths among women. In fact, both in 2009 and in 2010 more women died than men. Age-specific death rate enables to compare mortality by age groups, as it considers the population number in each age group. (Figure 3)
TERVIS JA TÖÖVÕIME HEALTH AND CAPACITY FOR WORK
MEHE KODU ON MAAILM, NAISE MAAILM ON KODU? MAN’S HOME IS THE WORLD, WOMAN’S WORLD IS HER HOME? 52
Life expectancy
Life expectancy at birth indicates the probable duration of an infant’s life if it were subject to the mortality indicators applicable in the year of its birth. More men than women die at an early age and therefore men’s life expectancy at birth is lower than that of women.
In Estonia the difference between men’s and women’s life expectancy has been more than ten years for a long time and is one of the greatest in Europe. The difference is approximately the same also in Latvia and Lithuania. In 2010 the life expectancy of men increased to 70 years for the first time and at the same time the difference between the life expectancy of men and women decreased to 9.9 years. In 2010 the life expectancy was 70.6 years for men and 80.5 years for women (see Figure 4). The life expectancy of men has been increasing a bit more rapidly than that of women – in 1994 life expectancy was 60.5 years for men and 72.8 years for women.
A general objective of the Public Health Development Plan is to increase life expectancy and reduce the difference between men’s and women’s life expectancy. According to the Development Plan, by the year 2020, life expectancy should have increased to 75 years for men and 84 years for women. (Figure 4)
The quality of population’s health is indicated by disability free life expectancy. This indicator reflects life expectancy without any long-term disease. Calculation of disability free life expectancy takes into account the mortality indicators of a respective year and people’s health assessments (good or bad), arising from the Estonian Social Survey.
Women lead disability free life longer than men (see Figure 5). The average number of disability free life years is 54.1 years for men and 58.0 years for women born in 2010. When comparing disability free life expectancy with life expectancy, it appears that the smaller the difference, the longer the life without diseases, i.e. the better the quality of life. Until 2009 the difference between life expectancy and disability free life expectancy had been in constant decline, but in 2010 it slightly increased, as the values of disability free life expectancy dropped for both men and women, while life expectancy continued to increase. This difference is less prominent among men than women (see Figure 6). This means that although women live longer than men and lead a longer disability free life, they still have health problems for a longer time than men.
Health assessments
Assessment of public health may be based on the statistics of morbidity and mortality, but these numbers do not indicate how people assess their own health. According to the Estonian Social Survey, people’s self-assessments of their health status have not generally changed much during 2004–2010, yet they have still improved. Both among men and women there is an increase in the proportion of people with good self-assessment of their health. (Figure 7)
Women do live longer than men and they also have more disability free years of life than men, but when comparing the self-assessments of their health status, men tend to consider their health to be slightly better than women. In 2010 a total of 59% of men and 52% of women at the age of 16 and older assessed their health status either as good or very good. Women assess their health as bad more frequently than men. In 2010 health was considered bad or very bad by 16% of women and 12% of men.
Assessments of health status reached their highest values in 2008, the year of the onset of economic crisis, when it had not affected many people yet. Next year, however, the assessments of health status dropped and increased again a little in 2010. The crisis had the greatest impact first and foremost on the younger working age people, aged 34 years and younger, as in 2008 more men and women were in good health, but in 2009 these proportions dropped rapidly.
As the age advances, many people start having health problems and it is only logical that their assessments of own health status also aggravate. In general, the differences between age groups of men and women reveal that in younger age groups there are more women with good health assessment than men. At an advanced age, starting from the age of 65 and older, more
TERVIS JA TÖÖVÕIME HEALTH AND CAPACITY FOR WORK
MEHE KODU ON MAAILM, NAISE MAAILM ON KODU? MAN’S HOME IS THE WORLD, WOMAN’S WORLD IS HER HOME? 53
men than women assess their health as good. The same applies to poor health assessments – until the age of 64 the proportion of women with poor health is lower than the proportion of men and after the age of 65 the proportion of women with poor health exceeds that of men.
Marital status also affects assessments of health status, although marital status itself is affected by age, because single people are usually young and do not have health problems yet, whereas widowed persons are mostly elderly people who probably experience more health-related problems. Health assessments are very similar in case of single men and women – about three quarters of both single men and women assess their health as good or very good, and 7% of single men and 5% of single women consider their health as bad. Slightly less than a half of married men and a little more than a half of married women assess their health status as good, and 14% of men and 12% of women consider it to be bad. A little less than a half of both divorced men and women have good health, and 15% of men and 13% of women have bad health. Health assessments are very similar in case of married and divorced men. The results are similar also in case of married and divorced women, but married women tend to give somewhat better assessment to their health status. The worst health status was reported by widowed persons, as their average age is higher than that of the other groups. As for widowed persons, 18% of men and 15% of women are in rather good health, 34% of men and 38% of women are in poor health. (Figure 8)
The impact of education on health assessments is revealed by the fact that, the higher the education, the better the assessment of health status. People with higher education have wider outlook and hence can apparently take better care of their health. Men and women with higher education provide similar assessment of health – 60% of men and 62% of women with higher education assess their health as good. Men and women have slightly different assessments in case of secondary education. Good health is reported by men with secondary education almost as much (57%) as by men with higher education, but approximately a half of the women with secondary education are reportedly in good health. At the same time, there are more people with poor health among people with secondary education than among people with higher education. The greatest differences are found when comparing the health assessments of men and women with either primary or basic education. A little more than a half of men with primary or basic education assess their health as good, whereas the same assessment is provided by only a little over one third of women. Rather extensive proportion of women with primary or basic education reported having bad health – almost one third. (Figure 9)
Living in a city or in the country has no significant effect on the assessments of health status. The results are rather similar for men and women. The only difference is that more men in good health live in cities and more men in poor health live in the country, but the proportion of women in good health is equal both in cities and in the country.
Estonians consider their health status to be better than non-Estonians. The assessments of health status are relatively similar in case of Estonian and non-Estonian men, but there is a larger difference in the assessments of health status provided by Estonian and non-Estonian women. More than a half of Estonian women and less than a half of non-Estonian women assess their health status as good. Also, more non-Estonian than Estonian women have assessed their health as average or bad. Comparison of Estonian men and women reveals that the results are quite similar, although the number of men considering their health to be good or very good is by three percentage points higher than that of women. Health assessments by non-Estonian men and women show larger differences. The proportion of non-Estonian men in good health exceeds the proportion of non-Estonian women in good health by ten percentage points. (Figure 10)
Income has also a significant impact on health assessment. The lower the income, the poorer the assessment of health, and vice versa – the higher the income, the better the assessment of health. However, here the effect may work both ways, i.e. income is lower due to poor health, as poor health makes it more difficult to find and keep a suitable job. Poor health is also characteristic of the elderly, who also tend to have lower income than the working population. Health assessment differences between men and women by income are rather small, i.e. no wide sex-specific differences are found here. (Figure 11)
TERVIS JA TÖÖVÕIME HEALTH AND CAPACITY FOR WORK
MEHE KODU ON MAAILM, NAISE MAAILM ON KODU? MAN’S HOME IS THE WORLD, WOMAN’S WORLD IS HER HOME? 54
Hence, we may say that, besides sex, health assessments reveal rather large differences by age, education, and income.
The social survey involves questions about existing long-term (chronic) illnesses, including seasonal (such as pollen allergies) and other recurrent problems. In 2010 a total of 39% of men and 45% of women acknowledged the existence of a long-term illness (see Figure 12). Since 2004 when the social survey was carried out, the proportion of women with a long-term illness has always exceeded that of men. When viewing men and women with a long-term illness by age groups it appears that similarly to health assessments, the proportion of women with a long-term illness is larger than that of men mostly among people over 65. In younger age groups the number of women with a long-term illness is lower than that of men in the same age group. 77% of men and 84% of women aged over 65 have a long-term illness. The number of people with a long-term illness exceeds that of the people without a long-term illness starting from the age of 55.
The proportions of men and women with a long-term illness are virtually equal at the age of 16–24 – 16% of men and 15% of women, respectively. (Figure 12)
A long-term illness may, but does not have to hinder people’s daily routine and activities. Therefore the number of people, whose daily activities are restricted due to health problems, is lower than the number of people with a long-term illness. At the age of 16 and older, there are slightly more women than men whose daily activities are restricted due to health problems. Thus, 27% of men and 33% of women were subject to some extent of restriction in their daily activities in 2010. When comparing the age groups of men and women, aged 64 or younger, the distribution of men and women is similar, but among the people older than 65 the differences between men and women are larger, and namely in favour of men. This means, that health-related restrictions are less common among men than among women. As for men over 65, there were 62% of men and 70% of women with major or minor health-related restrictions.
A total of 10% of the population have applicable degree of disability or, in other words, official disability (as of 1 January 2011). Over the last years, the number of disabled people has slowly but steadily been increasing. While one definite reason for the increase in the number of disabled people is ageing of the population, the number of disabled people has increased across all age groups. In the recent years, the increase in the number of disabled persons has partially been associated with economic difficulties, as disabled people receive social benefit from the state. Therefore, more and more people have started to register their disabled status.
The proportion of disabled women is somewhat higher than the proportion of disabled men. In early 2011 a total of 11% of women and 8% of men had official disability. When viewed by age, it appears that there are actually fewer disabled women than men younger than 62, and the proportion of disabled women exceeds the proportion of disabled men only in the age group of 63 and older. This is due to the fact that the majority of disabled people belong to this age group – 67% of disabled women and 46% of disabled men are at the age of 63 or older.
Health behaviour
Health behaviour comprises the activities of people to improve, protect or maintain health, irrespective of the current health status or whether such behaviour is ultimately objectively efficient or not (Rahvastiku … 2008). Studies have revealed that men and women use health services differently (Wilkins et al). Due to biological differences the health problems of men and women are not identical and are manifested in different way; hence they have a different need for health services.
Family medical care is ensured for all people with health insurance coverage without additional self-contribution (Esmatasandi … 2008). According to the survey Health Behaviour among Estonian Adult Population 2010 (Tekkel and Veideman 2011), medical care is more frequently used by women than men. Three quarters of women and two thirds of men had visited their family physician within the 12 months preceding the survey (see Figure 13). During one year,
TERVIS JA TÖÖVÕIME HEALTH AND CAPACITY FOR WORK
MEHE KODU ON MAAILM, NAISE MAAILM ON KODU? MAN’S HOME IS THE WORLD, WOMAN’S WORLD IS HER HOME? 55
men visited the family physician on average 1.9 times, women 2.4 times. Meanwhile, those not having visited the physician include people who were in need of family medical care, but did not receive it due to various reasons. According to the social survey, 2% of men and the same share of women did not receive necessary family medical care in 2009. Yet the reasons for not visiting the family physician are quite different for men and women. The main reason for men lay in the lack of health insurance (38%), while this reason accounted for only 8% of women. For women the main reason for not having received family medical care was a too long waiting list (46%), men stated this reason as the second most important one (23%). The second top reason for women was a long distance to the medical aid centre and transportation problems to reach the place – this was seen as a problem by 16% of women and only by 7% of men. (Figure 13)
Women also tend to more frequently visit specialised doctors and dentists. During the last year, 57% of women and 42% of men had visited the dentist. The proportion of women having visited a specialised doctor was the same (57%), whereas the proportion of men was smaller – 39%.
5% of men and the same proportion of women did not gain access to the dentist when needed. As dental care is a paid service, the main reason for not visiting the dentist is financial both for men and women. 79% of men and 82% of women who did not gain access to the dentist considered the service too expensive.
4% of men and 5% of women did not gain access to a specialised doctor. The main reason for that is a too long waiting list – 50% of men and 70% of women considered this to be the most important reason. The second reason for men is the lack of health insurance (16%), whereas the same cause was mentioned by only 3% of women. The second reason for women was a long distance to the medical aid centre and transportation problems to reach the place (14%). At the same time, this reason was stated by 9% of men.
In case of women, marital status does not have significant impact on the frequency of visiting a physician, but for men there are clearly visible differences. The frequency of visiting the family physician by married men is higher in comparison with single men. Apparently, wives play a significant role by encouraging their spouse to consult the physician as soon as some health problem becomes evident. This can also be seen from the fact that the proportion of men using family medical care is drastically lower in case of divorced men, reaching even a lower level than that of single men.
These results clearly indicate the bottlenecks of our health care system such as expensive dental care and long waiting lists to access specialised doctors. It also appears that men lack health insurance more frequently than women.
Pursuant to the health behaviour survey, women use medicinal products much more frequently than men. Among women, the most common reason for using medicine is headache. Approximately a half of the women and only a quarter of men had used analgesics against headache within the past seven days. About a quarter of women and one fifth of men used medicinal products to alleviate other types of pain. Approximately one fifth of men and women have been diagnosed with hypertensive diseases and the majority of them use relevant medicinal products. About one fifth of both men and women suffer from arthritis and another one fifth from radiculitis or back problems.
Smoking and alcohol consumption are important health behaviour indicators, as they noticeably increase the risk of developing certain diseases. Smokers are at a much greater risk of developing malignant neoplasm of larynx, trachea, bronchus and lung, and non-smokers are less likely to do so.
According to the survey Health Behaviour among Estonian Adult Population conducted in 2010, there are 37% of men and 19% of women who smoke daily, i.e. there are twice as many smokers among men. About a quarter of men and a little more than a half of women have never smoked. In terms of education, the proportion of smokers is the highest among people with primary or basic education – as much as about a half of men and 35% of women. The smallest number of smokers is found among people with higher education – 18% of men and 11% of women, respectively. As for men, the proportion of smoking men is higher in rural areas than in
TERVIS JA TÖÖVÕIME HEALTH AND CAPACITY FOR WORK
MEHE KODU ON MAAILM, NAISE MAAILM ON KODU? MAN’S HOME IS THE WORLD, WOMAN’S WORLD IS HER HOME? 56
cities, whereas in case of women the proportion of smokers is higher in cities (except Tallinn) and a bit smaller in the country. There are somewhat more smokers among Estonian than non-Estonian men. The situation is the opposite in case of women – there are fewer smokers among Estonians than non-Estonians. The proportion of smokers is higher among men and women, who are unemployed, live alone or have low income.
There are several reasons why there are more smokers among men and persons with lower level of education: lack of knowledge about the consequences of smoking, attitude and values affecting smoking habits, and psychological stress, which leads to starting smoking or hinders giving up smoking (Kunst et al. 2002).
Excessive alcohol consumption increases the probability of developing a chronic liver disease, which may also lead to death. Alcohol consumption also increases the likelihood of getting into accidents. Men consume alcohol more than women. 37% of men consume alcohol a few times a week, whereas the percentage of women consuming alcohol at the same frequency is 13% – this is almost three times less than men. A total of 8% of men and 13% of women reported not consuming alcohol at all. Men living in the country consume alcohol more frequently than men living in the city – 50% of the men living in the country and 40% of men in cities consume alcohol at least a few times a week. Women living in rural areas also consume more alcohol than women in cities. 16% of the women living in rural areas and 12% of women living in cities consume alcohol at least a few times a week.
The fact that smoking and alcohol consumption are more common in the country than in cities is also supported by the results of the Household Budget Survey, according to which the amount of money spent on tobacco products and alcohol is somewhat bigger in rural than in urban areas, both in terms of expenses and proportion.
Alcohol consumption is the lowest in case of men with secondary education and the highest in case of men with vocational secondary education. As for women, alcohol consumption is the highest among women with higher education. Estonian men and women consume more alcohol than non-Estonians. Increase in alcohol consumption also depends on income – there are more people consuming alcohol among men and women with higher income.
After consuming alcohol people often make inadequate decisions, which cause risk behaviour, especially among men. Such behaviour, however, may lead to an accident. One example is driving a motor vehicle while intoxicated. Men are more likely to sit behind the steering wheel after consuming alcohol than women. According to the survey on health behaviour, within the last year, 3.4% of men and 0.3% of women aged 16–64 have repeatedly sat behind the wheel after consuming alcohol. The greatest number of drunk drivers is found at the age of 25–34 – as much as 7.2% of men, whereas the percentage of women in the same age group is merely 0.3%.
Another important health behaviour indicator today is the body mass index, which indicates the height and weight ratio, because being overweight is seen as a predisposition to various diseases such as diseases of the circulatory system and diabetes. Similar to many other Western countries, the number of overweight people constantly increases. At the same time, by preventing themselves from becoming overweight, people can reduce the occurrence of diseases of the circulatory system to a significant extent.
Pursuant to the survey Health Behaviour among Estonian Adult Population, the proportion of overweight people increases as people become older. Three quarters of men aged 16–24 are in normal weight category (body mass index 18.5–24.9); the proportion of women in the same age group is somewhat lower. However, by growing age, the proportion of men in normal weight category begins to drop quickly and by the age of 25–34, less than a half of men are in the normal weight category. At the age of 25–34, two thirds of women are in normal weight category. At the age of 55–64, a total of 30% of men and 27% of women are in normal weight category. There are more overweight (body mass index 25.0–29.9) men than women in each age group. At the age of 55–64 there are 45% of overweight men and 42% of overweight women. Obesity (body mass index over 30) occurs in case of 4% of men aged 16–24 and in case of 3% of women
TERVIS JA TÖÖVÕIME HEALTH AND CAPACITY FOR WORK
MEHE KODU ON MAAILM, NAISE MAAILM ON KODU? MAN’S HOME IS THE WORLD, WOMAN’S WORLD IS HER HOME? 57
in the same age group. The proportion of obese people increases along with the age and at the age of 55–64 a quarter of men and as much as one third of women are obese. (Figure 14)
Besides healthy nutrition, physical activity is another factor to combat overweight. Physical activity, e.g. engagement in recreational sports for health purposes for at least half an hour is also crucial in prevention of cardiovascular diseases. In general, the proportion of people engaged in recreational sports tends to decline as the age increases. The main difference in the physical activity of men and women lies in the fact that men, more than women, engage more in recreational sports at a younger age, but after passing 35 years of age women are the ones who are more actively engaged in sports than men.
Health and work
Health status affects personal capacity for work. Poor health may become an obstacle to finding and keeping a suitable job. On the other hand, working itself may cause the health to deteriorate. According the Estonian Association of Occupational Disease Patients, occupational disease and work-induced disease represent damage to health arising due to work environment hazards or nature of work. A significant feature of an occupational disease is the gradually progressive chronic disease process caused by work environment hazards with permanent duration for more than five years.
One factor restricting the capacity for work is a long-term illness. In 2009 the capacity for work was restricted due to a long-term illness in case of 13% of men and 12% of women aged 15–64. In most cases the capacity for work is restricted by health problems related to heart, blood pressure and circulation; back or neck problems, and feet problems. In 2009 the most common work-restricting diseases for men were back and neck problems (26%), followed by feet problems (21%), mental illnesses or disorders, emotional and nervous disorders (15%). This list was slightly different for women. The most common problem is the same for men and women, i.e. back or neck problems (21%), but the second most common disease is heart, blood pressure and circulatory disorders (20%), followed by feet problems (16%). The condition restricting the capacity for work may also be caused by an occupational disease. There are 28% of men and 30% of women whose capacity for work is restricted by an occupational disease.
Problems with hands, feet, back or neck are more frequently found with men and women working in manufacturing, men engaged in agriculture, construction or transportation; women engaged in trade, public administration, education or health care. Cardiovascular diseases and diseases of the circulatory system are more prevalent among men and women working in manufacturing, men working in construction, women engaged in trade, men working in transportation and women engaged in public administration, education and health care. Mental disorders and stress occur in case of men and women working in manufacturing, women working in trade or education, and respiratory or lung diseases are present in men engaged in manufacturing.
For a majority of people their long-term illness restricting capacity for work has lasted for longer than ten years. Health disorder restricting capacity for work and present for more than ten years has been reported by almost a half of men and 42% of women. One fifth of men and a quarter of women have a health disorder that has been present for five to ten years. Only 5% of men and 3% of women have the work adapted to suit the worker with partial loss of capacity for work. Main restrictions to work include the type and amount of work, and to a somewhat smaller extent the difficulties with commuting from home to work. These three factors restricting work have more frequently been mentioned by men.
An occupational accident is a sudden damage to health or death of an employee which occurs in the performance of a duty assigned by an employer or in other work performed with the employer’s permission, during a break included in the working time, or during other activity in the interests of the employer. Accident which occurred on the way to work is not deemed to be occupational accident; it is classified as usual accident.
According to the Labour Inspectorate, a total of 2,939 occupational accidents were registered in 2009 and 3,213 occupational accidents in 2010. Pursuant to the Labour Force Survey, the number of occupational accidents with men exceeds the relevant number with women by three
TERVIS JA TÖÖVÕIME HEALTH AND CAPACITY FOR WORK
MEHE KODU ON MAAILM, NAISE MAAILM ON KODU? MAN’S HOME IS THE WORLD, WOMAN’S WORLD IS HER HOME? 58
times. A total of 14% of all men subject to an occupational accident had had two occupational accidents and 8% of all men had had as much as three occupational accidents within the last year. Occupational accidents took place mostly in manufacturing, transportation and construction.
The reason why men have occupational accidents more frequently is that they work in more accident-prone areas such as construction and transportation. Meanwhile, women tend to work more in offices and shops, where the risk of accidents is lower. Another important reason is that women work on average for fewer hours than men and hence stay at work for a shorter period of time, which also decreases the probability of accidents (Dupre 2002). In addition, women are more self-preserving by nature and take fewer risks than men, which is why they are less prone to accidents.
Summary
Due to biological differences men and women have different prerequisites for health. The social roles established in the society exert certain impact on the behaviour of men and women and hence on their health. In addition, health is affected to a certain extent by external environmental factors (climate, living and working environment). Individual health status is the result of the concurrence of all these factors.
There are more boys than girls born, yet there are fewer men than women in the entire population. This is due to the fact that men are more likely to die at an earlier age. The main reason for that is higher mortality of men as a result of accidents. Due to death at an earlier age the life expectancy of men is also about ten years shorter than that of women. Women have four more disability free life years in comparison with men.
Despite a longer lifespan, women are more critical towards their health. Women consider their health to be worse than men. The best assessment of the status of health is provided by people with higher education. The greatest differences are found in the health assessments of men and women with primary education. The worst assessment of the status of health is provided by women with primary education. Both Estonian men and women give better assessments to their health than non-Estonians. The largest number of people in good health and the smallest number of people in very bad health are found among people with higher income. Comparison of the assessments of health by income reveals that, the lower the income, the worse the assessment of health status. Lower income also increases differences in the assessment of health among men and women – women belonging to the lowest income quintile give the worst assessment to their health.
In terms of health behaviour this article examines, on the one hand, whether and how much people visit doctors and use medicinal products. On the other hand, it considers risk behaviour such as smoking, alcohol consumption and being overweight which may cause various chronic diseases. The article reveals that women visit doctors more frequently and use more medicinal products than men. Yet there are twice as many smokers and three times more frequent alcohol consumers among men than among women. Social status contributes to smoking – people who smoke tend to have lower level of education, they live in the country and have lower level of income. At the same time, the proportion of people consuming alcohol is higher among people with higher income.
Based on body mass index there are more women than men in the normal weight category, and more overweight men than women. However, the proportion of obese men and women is almost equal.
Among other things, health status also affects the capacity for work and, vice versa – work affects health. The main health problems that restrict capacity for work of both men and women are back and neck problems. Work-induced diseases or occupational diseases represent the factor restricting capacity for work in case of about one third of men and women.
Occupational accidents are three times more likely to happen to men than women. This is due to the fact that the economic activities with the highest rate of occupational accidents, such as manufacturing, transportation and construction, employ mostly men.
TÖÖ- JA PEREELU ÜHITAMINE RECONCILING WORK AND FAMILY LIFE
MEHE KODU ON MAAILM, NAISE MAAILM ON KODU? MAN’S HOME IS THE WORLD, WOMAN’S WORLD IS HER HOME? 59
TÖÖ- JA PEREELU ÜHITAMINE KUI NAISTE ÜLESANNE?
Siim Krusell
Sissejuhatus
Ühiskonna jätkusuutlikkuse alustala on perekond kui sotsiaalne institutsioon, hoolimata tema pidevast muutumisest ajas. Perekonna puhul on üldjuhul normiks ka laste olemasolu ja selle normi muutudes muutub ka perekonna panus ühiskonna jätkusuutlikkuse tagajana küsitavaks. Perekonna enda jätkusuutlikkuse ja toimetuleku kindlustamiseks aga on oluline töötamine. Eesti tööjõu-uuringu järgi on üle poole Eesti elanikest tööga hõivatud ja kulutavad nädalas töötamisele märkimisväärse aja. Nädalas töötatakse keskmiselt ligi 40 tundi (täisajaga töötajad), peale selle kulutatakse arvestatav osa ajast töö ja kodu vahel liikumisele. Tähtis on nii tööl edukas olemine kui ka täisväärtuslik pereelu ning seega on võtmeküsimus, kas töö- ja pereelu ühitamine õnnestub. Euroopa kontekstis on riike, kus töö- ja pereelu ühitamise võimaldamine on oluline eesmärk tööturu- ning sotsiaal- ja perepoliitikas, ja on riike, kus sellele kuigi märkimisväärset tähelepanu ei pöörata. Põhjamaad (Rootsi, Soome ja Taani) on hea näide töö- ja pereelu küllaltki sujuvast ühitamisest. Seda võimaldavad hästi väljaarendatud avalikud teenused, sh lastehoiu-teenused, ja tööturu paindlikkus, mis võimaldavad lapsevanematel pärast tööturult ajutiselt eemalolekut sinna kerge vaevaga tagasi pöörduda, soodustades ka tööaja ja -koha paindlikkust. Anglosaksi (Iirimaa, Suurbritannia) ja ka Lõuna-Euroopa maades (Itaalia, Portugal) aga kulgeb töö- ja pereelu ühitamine üsna suurte raskustega (Kotowska jt 2010).
Seega on töö- ja pereelu ühitamise õnnestumisel oluline roll tööturu paindlikkusel, mis võib tähendada näiteks võimalusi reguleerida oma tööaega (ajapaindlikkus) ja -kohta (koha-paindlikkus). Peale selle eristatakse veel funktsionaalset ja lepingulist paindlikkust. Siinse artikli üks eesmärke on analüüsida töö- ja pereelu ühitamist just aja- ja kohapaindlikkuse seisukohast lähtudes.
Tööturu paindlikkus võib mõjutada ka seda, kas võtta vastu otsus tööturult ajutiselt lahkuda, või seda, kui keeruline on laste kõrvalt tööle tagasi tulla. Tööle tagasitulek või sealt ajutiselt lahkumine ei olene siiski ainult sellest, kas tööturg on paindlik või mitte. Oluline koht on ka seadustel, mis otseselt puudutavad lastega kojujäämist ja samas ka tööelu paindlikku korraldamist ning kasutada olevaid lastehoiuvõimalusi, s.t kas lastehoiuvõimalusi on piisavalt ja kas pered saavad nende kasutamist endale lubada.
Artiklis on seega analüüsitud ka tööturult ajutist lahkumist lapsehoolduspuhkuse tõttu, tööturule tagasipöördumist ja lastehoiuteenuste kasutamist.
Naiste tööhõivet peetakse tänapäeval tavapäraseks nähtuseks ning rõhutatakse naiste ja meeste võrdseid võimalusi. Sellest hoolimata peetakse naise emarolli endiselt tähtsamaks kui tema töörolli (Ghysels 2004). Naiste võrdne koormus meestega palgatööl (ent madalam tasustamine), samal ajal aga suurem koormus koduses majapidamises ja üldine pooldav hoiak traditsiooniliste soorollide suhtes on tekitanud olukorra, kus töö- ja pereelu ühendamine on peamiselt naiste ülesanne (Hansson 1999). Sellele, et töö- ja pereelu ühitamine on pigem naiste ülesanne, viitavad ka joonisel nr 1 olevad andmed meeste ja naiste hõiveseisundi kohta.
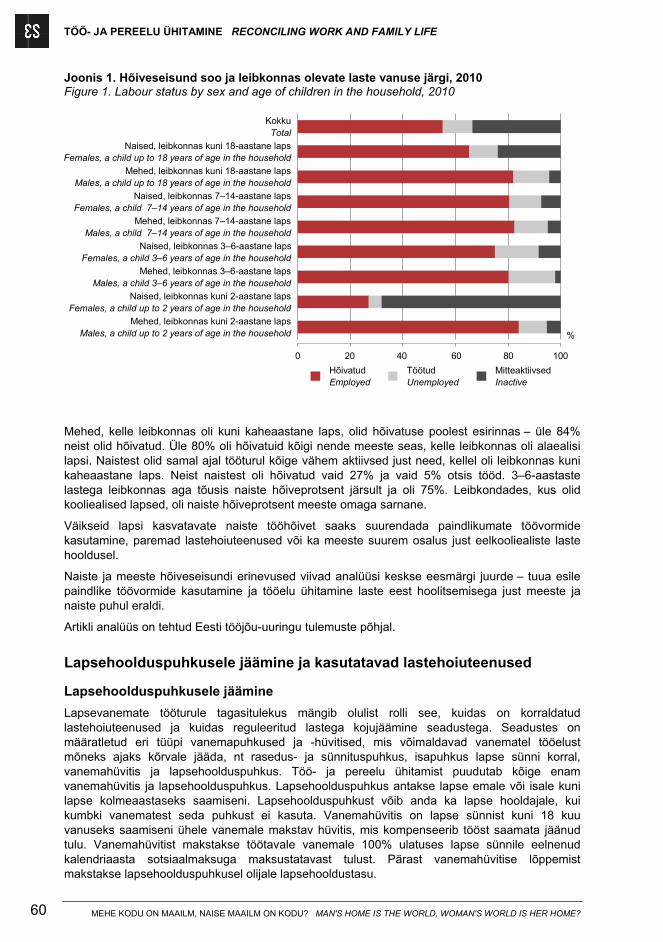
TÖÖ- JA PEREELU ÜHITAMINE RECONCILING WORK AND FAMILY LIFE
MEHE KODU ON MAAILM, NAISE MAAILM ON KODU? MAN'S HOME IS THE WORLD, WOMAN'S WORLD IS HER HOME? 60
Joonis 1. Hõiveseisund soo ja leibkonnas olevate laste vanuse järgi, 2010 Figure 1. Labour status by sex and age of children in the household, 2010
Mehed, leibkonnas kuni 2-aastane lapsMales, a child up to 2 years of age in the household
Naised, leibkonnas kuni 2-aastane lapsFemales, a child up to 2 years of age in the household
Mehed, leibkonnas 3–6-aastane lapsMales, a child 3–6 years of age in the household
Naised, leibkonnas 3–6-aastane lapsFemales, a child 3–6 years of age in the household
Mehed, leibkonnas 7–14-aastane lapsMales, a child 7–14 years of age in the household
Naised, leibkonnas 7–14-aastane lapsFemales, a child 7–14 years of age in the household
Mehed, leibkonnas kuni 18-aastane lapsMales, a child up to 18 years of age in the household
Naised, leibkonnas kuni 18-aastane lapsFemales, a child up to 18 years of age in the household
KokkuTotal
HõivatudEmployed
TöötudUnemployed
MitteaktiivsedInactive
%
0 20 40 60 80 100
Mehed, kelle leibkonnas oli kuni kaheaastane laps, olid hõivatuse poolest esirinnas – üle 84% neist olid hõivatud. Üle 80% oli hõivatuid kõigi nende meeste seas, kelle leibkonnas oli alaealisi lapsi. Naistest olid samal ajal tööturul kõige vähem aktiivsed just need, kellel oli leibkonnas kuni kaheaastane laps. Neist naistest oli hõivatud vaid 27% ja vaid 5% otsis tööd. 3–6-aastaste lastega leibkonnas aga tõusis naiste hõiveprotsent järsult ja oli 75%. Leibkondades, kus olid kooliealised lapsed, oli naiste hõiveprotsent meeste omaga sarnane.
Väikseid lapsi kasvatavate naiste tööhõivet saaks suurendada paindlikumate töövormide kasutamine, paremad lastehoiuteenused või ka meeste suurem osalus just eelkooliealiste laste hooldusel.
Naiste ja meeste hõiveseisundi erinevused viivad analüüsi keskse eesmärgi juurde – tuua esile paindlike töövormide kasutamine ja tööelu ühitamine laste eest hoolitsemisega just meeste ja naiste puhul eraldi.
Artikli analüüs on tehtud Eesti tööjõu-uuringu tulemuste põhjal.
Lapsehoolduspuhkusele jäämine ja kasutatavad lastehoiuteenused
Lapsehoolduspuhkusele jäämine
Lapsevanemate tööturule tagasitulekus mängib olulist rolli see, kuidas on korraldatud lastehoiuteenused ja kuidas reguleeritud lastega kojujäämine seadustega. Seadustes on määratletud eri tüüpi vanemapuhkused ja -hüvitised, mis võimaldavad vanematel tööelust mõneks ajaks kõrvale jääda, nt rasedus- ja sünnituspuhkus, isapuhkus lapse sünni korral, vanemahüvitis ja lapsehoolduspuhkus. Töö- ja pereelu ühitamist puudutab kõige enam vanemahüvitis ja lapsehoolduspuhkus. Lapsehoolduspuhkus antakse lapse emale või isale kuni lapse kolmeaastaseks saamiseni. Lapsehoolduspuhkust võib anda ka lapse hooldajale, kui kumbki vanematest seda puhkust ei kasuta. Vanemahüvitis on lapse sünnist kuni 18 kuu vanuseks saamiseni ühele vanemale makstav hüvitis, mis kompenseerib tööst saamata jäänud tulu. Vanemahüvitist makstakse töötavale vanemale 100% ulatuses lapse sünnile eelnenud kalendriaasta sotsiaalmaksuga maksustatavast tulust. Pärast vanemahüvitise lõppemist makstakse lapsehoolduspuhkusel olijale lapsehooldustasu.
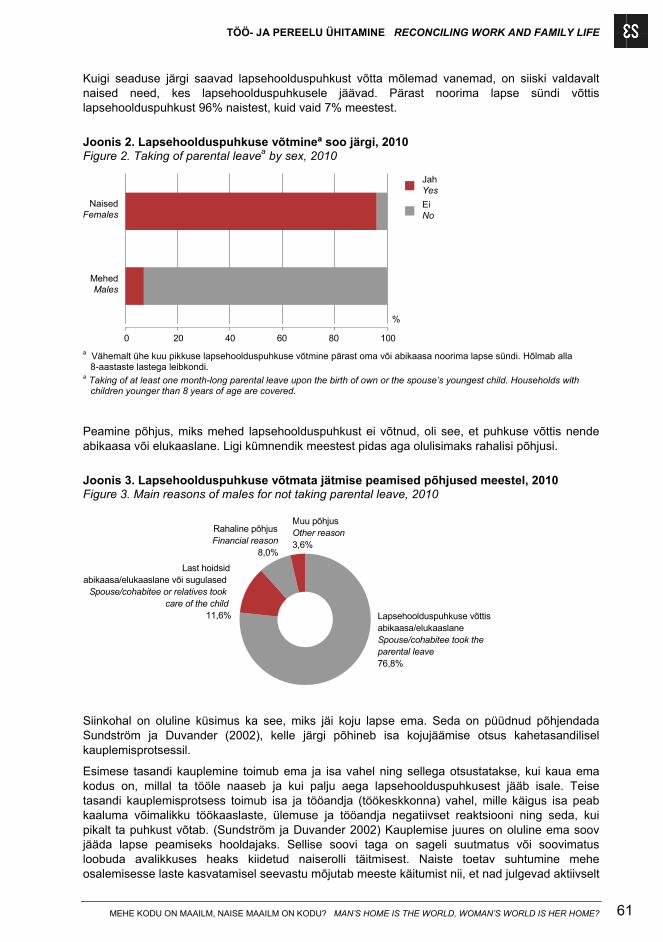
TÖÖ- JA PEREELU ÜHITAMINE RECONCILING WORK AND FAMILY LIFE
MEHE KODU ON MAAILM, NAISE MAAILM ON KODU? MAN’S HOME IS THE WORLD, WOMAN’S WORLD IS HER HOME? 61
Kuigi seaduse järgi saavad lapsehoolduspuhkust võtta mõlemad vanemad, on siiski valdavalt naised need, kes lapsehoolduspuhkusele jäävad. Pärast noorima lapse sündi võttis lapsehoolduspuhkust 96% naistest, kuid vaid 7% meestest.
Joonis 2. Lapsehoolduspuhkuse võtmineª soo järgi, 2010 Figure 2. Taking of parental leavea by sex, 2010
MehedMales
NaisedFemales
JahYes
EiNo
%
0 20 40 60 80 100 a Vähemalt ühe kuu pikkuse lapsehoolduspuhkuse võtmine pärast oma või abikaasa noorima lapse sündi. Hõlmab alla
8-aastaste lastega leibkondi. a Taking of at least one month-long parental leave upon the birth of own or the spouse’s youngest child. Households with
children younger than 8 years of age are covered. Peamine põhjus, miks mehed lapsehoolduspuhkust ei võtnud, oli see, et puhkuse võttis nende abikaasa või elukaaslane. Ligi kümnendik meestest pidas aga olulisimaks rahalisi põhjusi.
Joonis 3. Lapsehoolduspuhkuse võtmata jätmise peamised põhjused meestel, 2010 Figure 3. Main reasons of males for not taking parental leave, 2010
Last hoidsidabikaasa/elukaaslane või sugulased
Spouse/cohabitee or relatives tookcare of the child
11,6%
Muu põhjusOther reason3,6%
Rahaline põhjusFinancial reason
8,0%
Lapsehoolduspuhkuse võttisabikaasa/elukaaslaneSpouse/cohabitee took theparental leave76,8%
Siinkohal on oluline küsimus ka see, miks jäi koju lapse ema. Seda on püüdnud põhjendada Sundström ja Duvander (2002), kelle järgi põhineb isa kojujäämise otsus kahetasandilisel kauplemisprotsessil.
Esimese tasandi kauplemine toimub ema ja isa vahel ning sellega otsustatakse, kui kaua ema kodus on, millal ta tööle naaseb ja kui palju aega lapsehoolduspuhkusest jääb isale. Teise tasandi kauplemisprotsess toimub isa ja tööandja (töökeskkonna) vahel, mille käigus isa peab kaaluma võimalikku töökaaslaste, ülemuse ja tööandja negatiivset reaktsiooni ning seda, kui pikalt ta puhkust võtab. (Sundström ja Duvander 2002) Kauplemise juures on oluline ema soov jääda lapse peamiseks hooldajaks. Sellise soovi taga on sageli suutmatus või soovimatus loobuda avalikkuses heaks kiidetud naiserolli täitmisest. Naiste toetav suhtumine mehe osalemisesse laste kasvatamisel seevastu mõjutab meeste käitumist nii, et nad julgevad aktiivselt
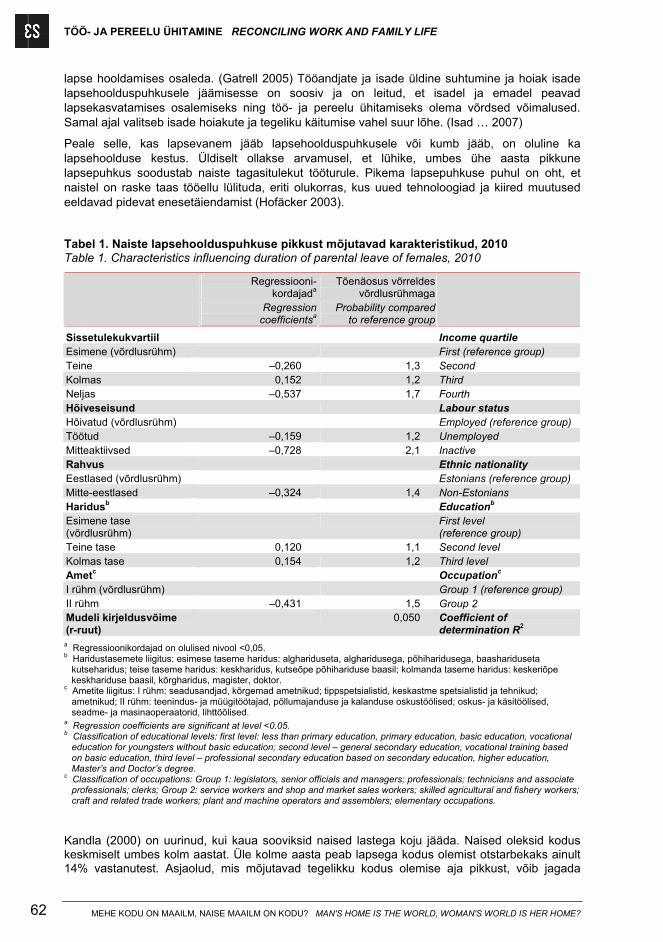
TÖÖ- JA PEREELU ÜHITAMINE RECONCILING WORK AND FAMILY LIFE
MEHE KODU ON MAAILM, NAISE MAAILM ON KODU? MAN'S HOME IS THE WORLD, WOMAN'S WORLD IS HER HOME? 62
lapse hooldamises osaleda. (Gatrell 2005) Tööandjate ja isade üldine suhtumine ja hoiak isade lapsehoolduspuhkusele jäämisesse on soosiv ja on leitud, et isadel ja emadel peavad lapsekasvatamises osalemiseks ning töö- ja pereelu ühitamiseks olema võrdsed võimalused. Samal ajal valitseb isade hoiakute ja tegeliku käitumise vahel suur lõhe. (Isad … 2007)
Peale selle, kas lapsevanem jääb lapsehoolduspuhkusele või kumb jääb, on oluline ka lapsehoolduse kestus. Üldiselt ollakse arvamusel, et lühike, umbes ühe aasta pikkune lapsepuhkus soodustab naiste tagasitulekut tööturule. Pikema lapsepuhkuse puhul on oht, et naistel on raske taas tööellu lülituda, eriti olukorras, kus uued tehnoloogiad ja kiired muutused eeldavad pidevat enesetäiendamist (Hofäcker 2003).
Tabel 1. Naiste lapsehoolduspuhkuse pikkust mõjutavad karakteristikud, 2010 Table 1. Characteristics influencing duration of parental leave of females, 2010
Regressiooni-kordajada
Tõenäosus võrreldes võrdlusrühmaga
Regression coefficientsa
Probability compared to reference group
Sissetulekukvartiil Income quartile Esimene (võrdlusrühm) First (reference group) Teine –0,260 1,3 Second Kolmas 0,152 1,2 Third Neljas –0,537 1,7 Fourth Hõiveseisund Labour status Hõivatud (võrdlusrühm) Employed (reference group) Töötud –0,159 1,2 Unemployed Mitteaktiivsed –0,728 2,1 Inactive Rahvus Ethnic nationality Eestlased (võrdlusrühm) Estonians (reference group) Mitte-eestlased –0,324 1,4 Non-Estonians Haridusb Educationb Esimene tase (võrdlusrühm)
First level (reference group)
Teine tase 0,120 1,1 Second level Kolmas tase 0,154 1,2 Third level Ametc Occupationc I rühm (võrdlusrühm) Group 1 (reference group) II rühm –0,431 1,5 Group 2 Mudeli kirjeldusvõime (r-ruut)
0,050 Coefficient of determination R2
a Regressioonikordajad on olulised nivool <0,05. b Haridustasemete liigitus: esimese taseme haridus: alghariduseta, algharidusega, põhiharidusega, baashariduseta
kutseharidus; teise taseme haridus: keskharidus, kutseõpe põhihariduse baasil; kolmanda taseme haridus: keskeriõpe keskhariduse baasil, kõrgharidus, magister, doktor.
c Ametite liigitus: I rühm: seadusandjad, kõrgemad ametnikud; tippspetsialistid, keskastme spetsialistid ja tehnikud; ametnikud; II rühm: teenindus- ja müügitöötajad, põllumajanduse ja kalanduse oskustöölised; oskus- ja käsitöölised, seadme- ja masinaoperaatorid, lihttöölised.
a Regression coefficients are significant at level <0.05. b Classification of educational levels: first level: less than primary education, primary education, basic education, vocational
education for youngsters without basic education; second level – general secondary education, vocational training based on basic education, third level – professional secondary education based on secondary education, higher education, Master’s and Doctor’s degree.
c Classification of occupations: Group 1: legislators, senior officials and managers; professionals; technicians and associate professionals; clerks; Group 2: service workers and shop and market sales workers; skilled agricultural and fishery workers; craft and related trade workers; plant and machine operators and assemblers; elementary occupations.
Kandla (2000) on uurinud, kui kaua sooviksid naised lastega koju jääda. Naised oleksid kodus keskmiselt umbes kolm aastat. Üle kolme aasta peab lapsega kodus olemist otstarbekaks ainult 14% vastanutest. Asjaolud, mis mõjutavad tegelikku kodus olemise aja pikkust, võib jagada
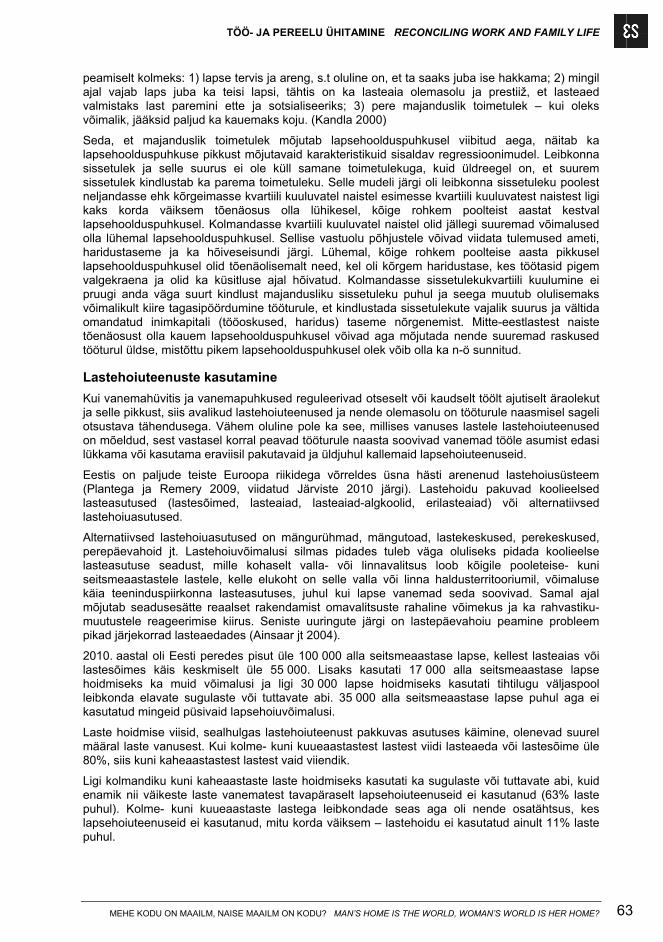
TÖÖ- JA PEREELU ÜHITAMINE RECONCILING WORK AND FAMILY LIFE
MEHE KODU ON MAAILM, NAISE MAAILM ON KODU? MAN’S HOME IS THE WORLD, WOMAN’S WORLD IS HER HOME? 63
peamiselt kolmeks: 1) lapse tervis ja areng, s.t oluline on, et ta saaks juba ise hakkama; 2) mingil ajal vajab laps juba ka teisi lapsi, tähtis on ka lasteaia olemasolu ja prestiiž, et lasteaed valmistaks last paremini ette ja sotsialiseeriks; 3) pere majanduslik toimetulek – kui oleks võimalik, jääksid paljud ka kauemaks koju. (Kandla 2000)
Seda, et majanduslik toimetulek mõjutab lapsehoolduspuhkusel viibitud aega, näitab ka lapsehoolduspuhkuse pikkust mõjutavaid karakteristikuid sisaldav regressioonimudel. Leibkonna sissetulek ja selle suurus ei ole küll samane toimetulekuga, kuid üldreegel on, et suurem sissetulek kindlustab ka parema toimetuleku. Selle mudeli järgi oli leibkonna sissetuleku poolest neljandasse ehk kõrgeimasse kvartiili kuuluvatel naistel esimesse kvartiili kuuluvatest naistest ligi kaks korda väiksem tõenäosus olla lühikesel, kõige rohkem poolteist aastat kestval lapsehoolduspuhkusel. Kolmandasse kvartiili kuuluvatel naistel olid jällegi suuremad võimalused olla lühemal lapsehoolduspuhkusel. Sellise vastuolu põhjustele võivad viidata tulemused ameti, haridustaseme ja ka hõiveseisundi järgi. Lühemal, kõige rohkem poolteise aasta pikkusel lapsehoolduspuhkusel olid tõenäolisemalt need, kel oli kõrgem haridustase, kes töötasid pigem valgekraena ja olid ka küsitluse ajal hõivatud. Kolmandasse sissetulekukvartiili kuulumine ei pruugi anda väga suurt kindlust majandusliku sissetuleku puhul ja seega muutub olulisemaks võimalikult kiire tagasipöördumine tööturule, et kindlustada sissetulekute vajalik suurus ja vältida omandatud inimkapitali (tööoskused, haridus) taseme nõrgenemist. Mitte-eestlastest naiste tõenäosust olla kauem lapsehoolduspuhkusel võivad aga mõjutada nende suuremad raskused tööturul üldse, mistõttu pikem lapsehoolduspuhkusel olek võib olla ka n-ö sunnitud.
Lastehoiuteenuste kasutamine
Kui vanemahüvitis ja vanemapuhkused reguleerivad otseselt või kaudselt töölt ajutiselt äraolekut ja selle pikkust, siis avalikud lastehoiuteenused ja nende olemasolu on tööturule naasmisel sageli otsustava tähendusega. Vähem oluline pole ka see, millises vanuses lastele lastehoiuteenused on mõeldud, sest vastasel korral peavad tööturule naasta soovivad vanemad tööle asumist edasi lükkama või kasutama eraviisil pakutavaid ja üldjuhul kallemaid lapsehoiuteenuseid.
Eestis on paljude teiste Euroopa riikidega võrreldes üsna hästi arenenud lastehoiusüsteem (Plantega ja Remery 2009, viidatud Järviste 2010 järgi). Lastehoidu pakuvad koolieelsed lasteasutused (lastesõimed, lasteaiad, lasteaiad-algkoolid, erilasteaiad) või alternatiivsed lastehoiuasutused.
Alternatiivsed lastehoiuasutused on mängurühmad, mängutoad, lastekeskused, perekeskused, perepäevahoid jt. Lastehoiuvõimalusi silmas pidades tuleb väga oluliseks pidada koolieelse lasteasutuse seadust, mille kohaselt valla- või linnavalitsus loob kõigile pooleteise- kuni seitsmeaastastele lastele, kelle elukoht on selle valla või linna haldusterritooriumil, võimaluse käia teeninduspiirkonna lasteasutuses, juhul kui lapse vanemad seda soovivad. Samal ajal mõjutab seadusesätte reaalset rakendamist omavalitsuste rahaline võimekus ja ka rahvastiku-muutustele reageerimise kiirus. Seniste uuringute järgi on lastepäevahoiu peamine probleem pikad järjekorrad lasteaedades (Ainsaar jt 2004).
2010. aastal oli Eesti peredes pisut üle 100 000 alla seitsmeaastase lapse, kellest lasteaias või lastesõimes käis keskmiselt üle 55 000. Lisaks kasutati 17 000 alla seitsmeaastase lapse hoidmiseks ka muid võimalusi ja ligi 30 000 lapse hoidmiseks kasutati tihtilugu väljaspool leibkonda elavate sugulaste või tuttavate abi. 35 000 alla seitsmeaastase lapse puhul aga ei kasutatud mingeid püsivaid lapsehoiuvõimalusi.
Laste hoidmise viisid, sealhulgas lastehoiuteenust pakkuvas asutuses käimine, olenevad suurel määral laste vanusest. Kui kolme- kuni kuueaastastest lastest viidi lasteaeda või lastesõime üle 80%, siis kuni kaheaastastest lastest vaid viiendik.
Ligi kolmandiku kuni kaheaastaste laste hoidmiseks kasutati ka sugulaste või tuttavate abi, kuid enamik nii väikeste laste vanematest tavapäraselt lapsehoiuteenuseid ei kasutanud (63% laste puhul). Kolme- kuni kuueaastaste lastega leibkondade seas aga oli nende osatähtsus, kes lapsehoiuteenuseid ei kasutanud, mitu korda väiksem – lastehoidu ei kasutatud ainult 11% laste puhul.
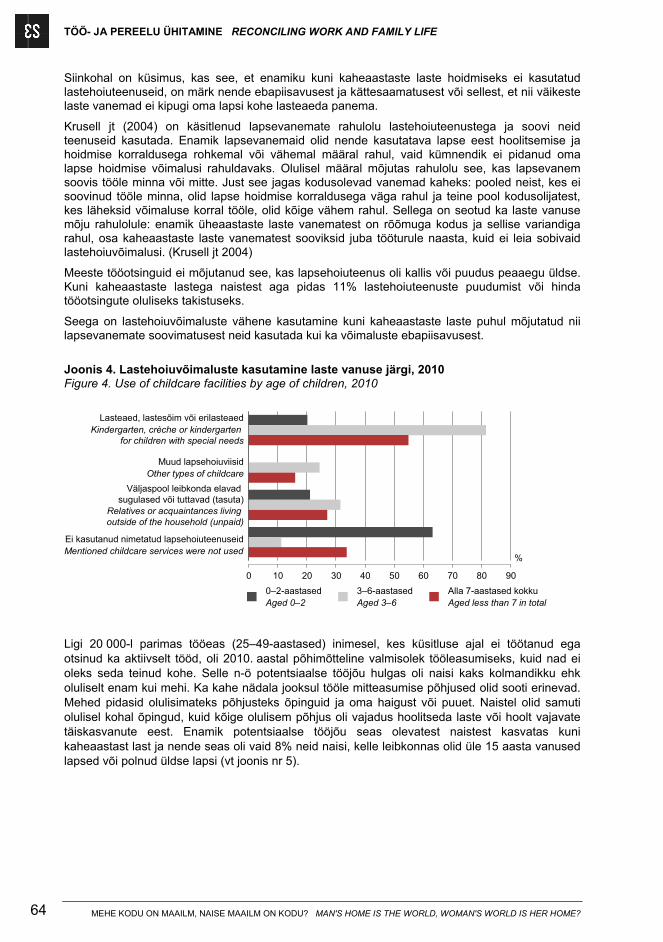
TÖÖ- JA PEREELU ÜHITAMINE RECONCILING WORK AND FAMILY LIFE
MEHE KODU ON MAAILM, NAISE MAAILM ON KODU? MAN'S HOME IS THE WORLD, WOMAN'S WORLD IS HER HOME? 64
Siinkohal on küsimus, kas see, et enamiku kuni kaheaastaste laste hoidmiseks ei kasutatud lastehoiuteenuseid, on märk nende ebapiisavusest ja kättesaamatusest või sellest, et nii väikeste laste vanemad ei kipugi oma lapsi kohe lasteaeda panema.
Krusell jt (2004) on käsitlenud lapsevanemate rahulolu lastehoiuteenustega ja soovi neid teenuseid kasutada. Enamik lapsevanemaid olid nende kasutatava lapse eest hoolitsemise ja hoidmise korraldusega rohkemal või vähemal määral rahul, vaid kümnendik ei pidanud oma lapse hoidmise võimalusi rahuldavaks. Olulisel määral mõjutas rahulolu see, kas lapsevanem soovis tööle minna või mitte. Just see jagas kodusolevad vanemad kaheks: pooled neist, kes ei soovinud tööle minna, olid lapse hoidmise korraldusega väga rahul ja teine pool kodusolijatest, kes läheksid võimaluse korral tööle, olid kõige vähem rahul. Sellega on seotud ka laste vanuse mõju rahulolule: enamik üheaastaste laste vanematest on rõõmuga kodus ja sellise variandiga rahul, osa kaheaastaste laste vanematest sooviksid juba tööturule naasta, kuid ei leia sobivaid lastehoiuvõimalusi. (Krusell jt 2004)
Meeste tööotsinguid ei mõjutanud see, kas lapsehoiuteenus oli kallis või puudus peaaegu üldse. Kuni kaheaastaste lastega naistest aga pidas 11% lastehoiuteenuste puudumist või hinda tööotsingute oluliseks takistuseks.
Seega on lastehoiuvõimaluste vähene kasutamine kuni kaheaastaste laste puhul mõjutatud nii lapsevanemate soovimatusest neid kasutada kui ka võimaluste ebapiisavusest.
Joonis 4. Lastehoiuvõimaluste kasutamine laste vanuse järgi, 2010 Figure 4. Use of childcare facilities by age of children, 2010
Ei kasutanud nimetatud lapsehoiuteenuseidMentioned childcare services were not used
Väljaspool leibkonda elavadsugulased või tuttavad (tasuta)
Relatives or acquaintances livingoutside of the household (unpaid)
Muud lapsehoiuviisidOther types of childcare
Lasteaed, lastesõim või erilasteaedKindergarten, crèche or kindergarten
for children with special needs
0 10 20 30 40 50 60 70 80 90
0–2-aastasedAged 0–2
3–6-aastasedAged 3–6
Alla 7-aastased kokkuAged less than 7 in total
%
Ligi 20 000-l parimas tööeas (25–49-aastased) inimesel, kes küsitluse ajal ei töötanud ega otsinud ka aktiivselt tööd, oli 2010. aastal põhimõtteline valmisolek tööleasumiseks, kuid nad ei oleks seda teinud kohe. Selle n-ö potentsiaalse tööjõu hulgas oli naisi kaks kolmandikku ehk oluliselt enam kui mehi. Ka kahe nädala jooksul tööle mitteasumise põhjused olid sooti erinevad. Mehed pidasid olulisimateks põhjusteks õpinguid ja oma haigust või puuet. Naistel olid samuti olulisel kohal õpingud, kuid kõige olulisem põhjus oli vajadus hoolitseda laste või hoolt vajavate täiskasvanute eest. Enamik potentsiaalse tööjõu seas olevatest naistest kasvatas kuni kaheaastast last ja nende seas oli vaid 8% neid naisi, kelle leibkonnas olid üle 15 aasta vanused lapsed või polnud üldse lapsi (vt joonis nr 5).
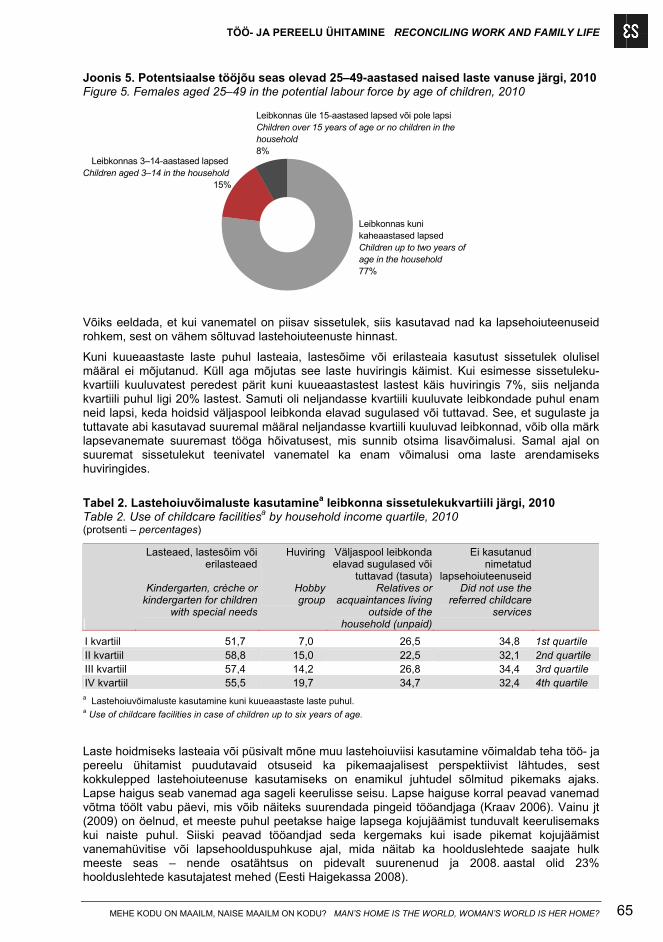
TÖÖ- JA PEREELU ÜHITAMINE RECONCILING WORK AND FAMILY LIFE
MEHE KODU ON MAAILM, NAISE MAAILM ON KODU? MAN’S HOME IS THE WORLD, WOMAN’S WORLD IS HER HOME? 65
Joonis 5. Potentsiaalse tööjõu seas olevad 25–49-aastased naised laste vanuse järgi, 2010 Figure 5. Females aged 25–49 in the potential labour force by age of children, 2010
Leibkonnas üle 15-aastased lapsed või pole lapsiChildren over 15 years of age or no children in thehousehold8%
Leibkonnas 3–14-aastased lapsedChildren aged 3–14 in the household
15%
Leibkonnas kunikaheaastased lapsedChildren up to two years ofage in the household77%
Võiks eeldada, et kui vanematel on piisav sissetulek, siis kasutavad nad ka lapsehoiuteenuseid rohkem, sest on vähem sõltuvad lastehoiuteenuste hinnast.
Kuni kuueaastaste laste puhul lasteaia, lastesõime või erilasteaia kasutust sissetulek olulisel määral ei mõjutanud. Küll aga mõjutas see laste huviringis käimist. Kui esimesse sissetuleku-kvartiili kuuluvatest peredest pärit kuni kuueaastastest lastest käis huviringis 7%, siis neljanda kvartiili puhul ligi 20% lastest. Samuti oli neljandasse kvartiili kuuluvate leibkondade puhul enam neid lapsi, keda hoidsid väljaspool leibkonda elavad sugulased või tuttavad. See, et sugulaste ja tuttavate abi kasutavad suuremal määral neljandasse kvartiili kuuluvad leibkonnad, võib olla märk lapsevanemate suuremast tööga hõivatusest, mis sunnib otsima lisavõimalusi. Samal ajal on suuremat sissetulekut teenivatel vanematel ka enam võimalusi oma laste arendamiseks huviringides.
Tabel 2. Lastehoiuvõimaluste kasutaminea leibkonna sissetulekukvartiili järgi, 2010 Table 2. Use of childcare facilitiesa by household income quartile, 2010 (protsenti – percentages)
Lasteaed, lastesõim või erilasteaed
Kindergarten, crèche or kindergarten for children
with special needs
Huviring
Hobby group
Väljaspool leibkonda elavad sugulased või
tuttavad (tasuta)Relatives or
acquaintances living outside of the
household (unpaid)
Ei kasutanud nimetatud
lapsehoiuteenuseid Did not use the
referred childcare services
I kvartiil 51,7 7,0 26,5 34,8 1st quartile II kvartiil 58,8 15,0 22,5 32,1 2nd quartile III kvartiil 57,4 14,2 26,8 34,4 3rd quartile IV kvartiil 55,5 19,7 34,7 32,4 4th quartile
a Lastehoiuvõimaluste kasutamine kuni kuueaastaste laste puhul. a Use of childcare facilities in case of children up to six years of age.
Laste hoidmiseks lasteaia või püsivalt mõne muu lastehoiuviisi kasutamine võimaldab teha töö- ja pereelu ühitamist puudutavaid otsuseid ka pikemaajalisest perspektiivist lähtudes, sest kokkulepped lastehoiuteenuse kasutamiseks on enamikul juhtudel sõlmitud pikemaks ajaks. Lapse haigus seab vanemad aga sageli keerulisse seisu. Lapse haiguse korral peavad vanemad võtma töölt vabu päevi, mis võib näiteks suurendada pingeid tööandjaga (Kraav 2006). Vainu jt (2009) on öelnud, et meeste puhul peetakse haige lapsega kojujäämist tunduvalt keerulisemaks kui naiste puhul. Siiski peavad tööandjad seda kergemaks kui isade pikemat kojujäämist vanemahüvitise või lapsehoolduspuhkuse ajal, mida näitab ka hoolduslehtede saajate hulk meeste seas – nende osatähtsus on pidevalt suurenenud ja 2008. aastal olid 23% hoolduslehtede kasutajatest mehed (Eesti Haigekassa 2008).
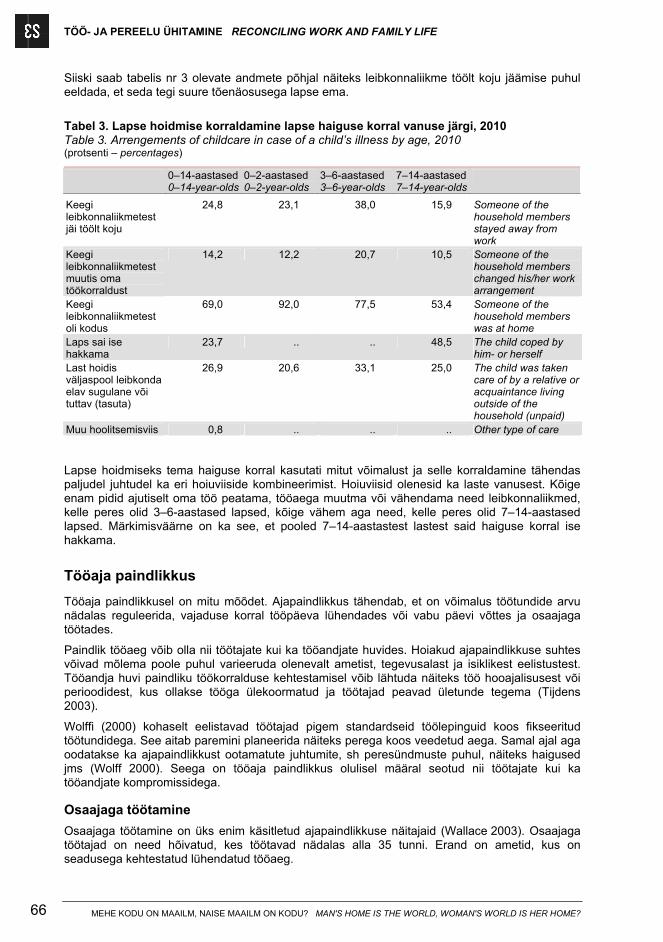
TÖÖ- JA PEREELU ÜHITAMINE RECONCILING WORK AND FAMILY LIFE
MEHE KODU ON MAAILM, NAISE MAAILM ON KODU? MAN'S HOME IS THE WORLD, WOMAN'S WORLD IS HER HOME? 66
Siiski saab tabelis nr 3 olevate andmete põhjal näiteks leibkonnaliikme töölt koju jäämise puhul eeldada, et seda tegi suure tõenäosusega lapse ema.
Tabel 3. Lapse hoidmise korraldamine lapse haiguse korral vanuse järgi, 2010 Table 3. Arrengements of childcare in case of a child’s illness by age, 2010 (protsenti – percentages)
0–14-aastased0–14-year-olds
0–2-aastased 0–2-year-olds
3–6-aastased 3–6-year-olds
7–14-aastased7–14-year-olds
Keegi leibkonnaliikmetest jäi töölt koju
24,8 23,1 38,0 15,9 Someone of the household members stayed away from work
Keegi leibkonnaliikmetest muutis oma töökorraldust
14,2 12,2 20,7 10,5 Someone of the household members changed his/her work arrangement
Keegi leibkonnaliikmetest oli kodus
69,0 92,0 77,5 53,4 Someone of the household members was at home
Laps sai ise hakkama
23,7 .. .. 48,5 The child coped by him- or herself
Last hoidis väljaspool leibkonda elav sugulane või tuttav (tasuta)
26,9 20,6 33,1 25,0 The child was taken care of by a relative or acquaintance living outside of the household (unpaid)
Muu hoolitsemisviis 0,8 .. .. .. Other type of care Lapse hoidmiseks tema haiguse korral kasutati mitut võimalust ja selle korraldamine tähendas paljudel juhtudel ka eri hoiuviiside kombineerimist. Hoiuviisid olenesid ka laste vanusest. Kõige enam pidid ajutiselt oma töö peatama, tööaega muutma või vähendama need leibkonnaliikmed, kelle peres olid 3–6-aastased lapsed, kõige vähem aga need, kelle peres olid 7–14-aastased lapsed. Märkimisväärne on ka see, et pooled 7–14-aastastest lastest said haiguse korral ise hakkama.
Tööaja paindlikkus
Tööaja paindlikkusel on mitu mõõdet. Ajapaindlikkus tähendab, et on võimalus töötundide arvu nädalas reguleerida, vajaduse korral tööpäeva lühendades või vabu päevi võttes ja osaajaga töötades.
Paindlik tööaeg võib olla nii töötajate kui ka tööandjate huvides. Hoiakud ajapaindlikkuse suhtes võivad mõlema poole puhul varieeruda olenevalt ametist, tegevusalast ja isiklikest eelistustest. Tööandja huvi paindliku töökorralduse kehtestamisel võib lähtuda näiteks töö hooajalisusest või perioodidest, kus ollakse tööga ülekoormatud ja töötajad peavad ületunde tegema (Tijdens 2003).
Wolffi (2000) kohaselt eelistavad töötajad pigem standardseid töölepinguid koos fikseeritud töötundidega. See aitab paremini planeerida näiteks perega koos veedetud aega. Samal ajal aga oodatakse ka ajapaindlikkust ootamatute juhtumite, sh peresündmuste puhul, näiteks haigused jms (Wolff 2000). Seega on tööaja paindlikkus olulisel määral seotud nii töötajate kui ka tööandjate kompromissidega.
Osaajaga töötamine
Osaajaga töötamine on üks enim käsitletud ajapaindlikkuse näitajaid (Wallace 2003). Osaajaga töötajad on need hõivatud, kes töötavad nädalas alla 35 tunni. Erand on ametid, kus on seadusega kehtestatud lühendatud tööaeg.
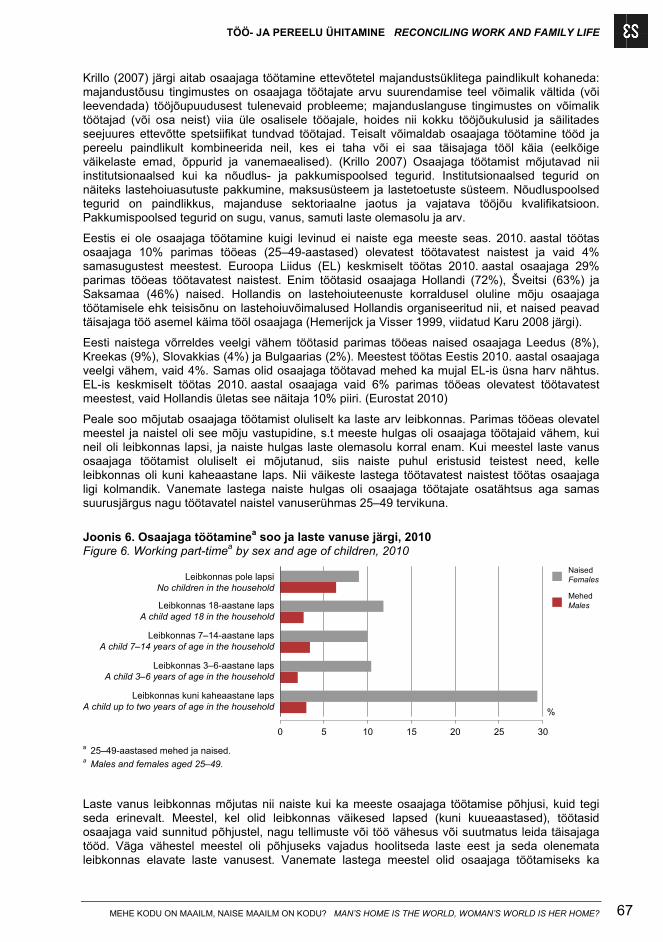
TÖÖ- JA PEREELU ÜHITAMINE RECONCILING WORK AND FAMILY LIFE
MEHE KODU ON MAAILM, NAISE MAAILM ON KODU? MAN’S HOME IS THE WORLD, WOMAN’S WORLD IS HER HOME? 67
Krillo (2007) järgi aitab osaajaga töötamine ettevõtetel majandustsüklitega paindlikult kohaneda: majandustõusu tingimustes on osaajaga töötajate arvu suurendamise teel võimalik vältida (või leevendada) tööjõupuudusest tulenevaid probleeme; majanduslanguse tingimustes on võimalik töötajad (või osa neist) viia üle osalisele tööajale, hoides nii kokku tööjõukulusid ja säilitades seejuures ettevõtte spetsiifikat tundvad töötajad. Teisalt võimaldab osaajaga töötamine tööd ja pereelu paindlikult kombineerida neil, kes ei taha või ei saa täisajaga tööl käia (eelkõige väikelaste emad, õppurid ja vanemaealised). (Krillo 2007) Osaajaga töötamist mõjutavad nii institutsionaalsed kui ka nõudlus- ja pakkumispoolsed tegurid. Institutsionaalsed tegurid on näiteks lastehoiuasutuste pakkumine, maksusüsteem ja lastetoetuste süsteem. Nõudluspoolsed tegurid on paindlikkus, majanduse sektoriaalne jaotus ja vajatava tööjõu kvalifikatsioon. Pakkumispoolsed tegurid on sugu, vanus, samuti laste olemasolu ja arv.
Eestis ei ole osaajaga töötamine kuigi levinud ei naiste ega meeste seas. 2010. aastal töötas osaajaga 10% parimas tööeas (25–49-aastased) olevatest töötavatest naistest ja vaid 4% samasugustest meestest. Euroopa Liidus (EL) keskmiselt töötas 2010. aastal osaajaga 29% parimas tööeas töötavatest naistest. Enim töötasid osaajaga Hollandi (72%), Šveitsi (63%) ja Saksamaa (46%) naised. Hollandis on lastehoiuteenuste korraldusel oluline mõju osaajaga töötamisele ehk teisisõnu on lastehoiuvõimalused Hollandis organiseeritud nii, et naised peavad täisajaga töö asemel käima tööl osaajaga (Hemerijck ja Visser 1999, viidatud Karu 2008 järgi).
Eesti naistega võrreldes veelgi vähem töötasid parimas tööeas naised osaajaga Leedus (8%), Kreekas (9%), Slovakkias (4%) ja Bulgaarias (2%). Meestest töötas Eestis 2010. aastal osaajaga veelgi vähem, vaid 4%. Samas olid osaajaga töötavad mehed ka mujal EL-is üsna harv nähtus. EL-is keskmiselt töötas 2010. aastal osaajaga vaid 6% parimas tööeas olevatest töötavatest meestest, vaid Hollandis ületas see näitaja 10% piiri. (Eurostat 2010)
Peale soo mõjutab osaajaga töötamist oluliselt ka laste arv leibkonnas. Parimas tööeas olevatel meestel ja naistel oli see mõju vastupidine, s.t meeste hulgas oli osaajaga töötajaid vähem, kui neil oli leibkonnas lapsi, ja naiste hulgas laste olemasolu korral enam. Kui meestel laste vanus osaajaga töötamist oluliselt ei mõjutanud, siis naiste puhul eristusid teistest need, kelle leibkonnas oli kuni kaheaastane laps. Nii väikeste lastega töötavatest naistest töötas osaajaga ligi kolmandik. Vanemate lastega naiste hulgas oli osaajaga töötajate osatähtsus aga samas suurusjärgus nagu töötavatel naistel vanuserühmas 25–49 tervikuna.
Joonis 6. Osaajaga töötaminea soo ja laste vanuse järgi, 2010 Figure 6. Working part-timea by sex and age of children, 2010
Leibkonnas kuni kaheaastane lapsA child up to two years of age in the household
Leibkonnas 3–6-aastane lapsA child 3–6 years of age in the household
Leibkonnas 7–14-aastane lapsA child 7–14 years of age in the household
Leibkonnas 18-aastane lapsA child aged 18 in the household
Leibkonnas pole lapsiNo children in the household
0 5 10 15 20 25 30
MehedMales
NaisedFemales
%
a 25–49-aastased mehed ja naised. a Males and females aged 25–49. Laste vanus leibkonnas mõjutas nii naiste kui ka meeste osaajaga töötamise põhjusi, kuid tegi seda erinevalt. Meestel, kel olid leibkonnas väikesed lapsed (kuni kuueaastased), töötasid osaajaga vaid sunnitud põhjustel, nagu tellimuste või töö vähesus või suutmatus leida täisajaga tööd. Väga vähestel meestel oli põhjuseks vajadus hoolitseda laste eest ja seda olenemata leibkonnas elavate laste vanusest. Vanemate lastega meestel olid osaajaga töötamiseks ka
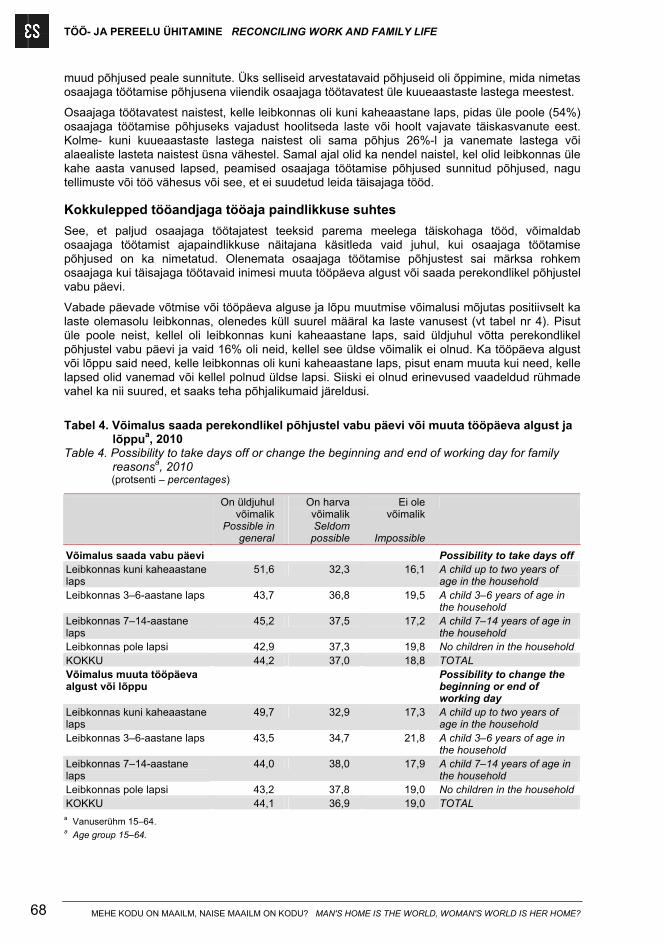
TÖÖ- JA PEREELU ÜHITAMINE RECONCILING WORK AND FAMILY LIFE
MEHE KODU ON MAAILM, NAISE MAAILM ON KODU? MAN'S HOME IS THE WORLD, WOMAN'S WORLD IS HER HOME? 68
muud põhjused peale sunnitute. Üks selliseid arvestatavaid põhjuseid oli õppimine, mida nimetas osaajaga töötamise põhjusena viiendik osaajaga töötavatest üle kuueaastaste lastega meestest.
Osaajaga töötavatest naistest, kelle leibkonnas oli kuni kaheaastane laps, pidas üle poole (54%) osaajaga töötamise põhjuseks vajadust hoolitseda laste või hoolt vajavate täiskasvanute eest. Kolme- kuni kuueaastaste lastega naistest oli sama põhjus 26%-l ja vanemate lastega või alaealiste lasteta naistest üsna vähestel. Samal ajal olid ka nendel naistel, kel olid leibkonnas üle kahe aasta vanused lapsed, peamised osaajaga töötamise põhjused sunnitud põhjused, nagu tellimuste või töö vähesus või see, et ei suudetud leida täisajaga tööd.
Kokkulepped tööandjaga tööaja paindlikkuse suhtes
See, et paljud osaajaga töötajatest teeksid parema meelega täiskohaga tööd, võimaldab osaajaga töötamist ajapaindlikkuse näitajana käsitleda vaid juhul, kui osaajaga töötamise põhjused on ka nimetatud. Olenemata osaajaga töötamise põhjustest sai märksa rohkem osaajaga kui täisajaga töötavaid inimesi muuta tööpäeva algust või saada perekondlikel põhjustel vabu päevi.
Vabade päevade võtmise või tööpäeva alguse ja lõpu muutmise võimalusi mõjutas positiivselt ka laste olemasolu leibkonnas, olenedes küll suurel määral ka laste vanusest (vt tabel nr 4). Pisut üle poole neist, kellel oli leibkonnas kuni kaheaastane laps, said üldjuhul võtta perekondlikel põhjustel vabu päevi ja vaid 16% oli neid, kellel see üldse võimalik ei olnud. Ka tööpäeva algust või lõppu said need, kelle leibkonnas oli kuni kaheaastane laps, pisut enam muuta kui need, kelle lapsed olid vanemad või kellel polnud üldse lapsi. Siiski ei olnud erinevused vaadeldud rühmade vahel ka nii suured, et saaks teha põhjalikumaid järeldusi.
Tabel 4. Võimalus saada perekondlikel põhjustel vabu päevi või muuta tööpäeva algust ja
lõppua, 2010 Table 4. Possibility to take days off or change the beginning and end of working day for family
reasonsa, 2010 (protsenti – percentages)
On üldjuhul võimalik
Possible in general
On harva võimalik Seldom
possible
Ei ole võimalik
Impossible
Võimalus saada vabu päevi Possibility to take days off Leibkonnas kuni kaheaastane laps
51,6 32,3 16,1 A child up to two years of age in the household
Leibkonnas 3–6-aastane laps 43,7 36,8 19,5 A child 3–6 years of age in the household
Leibkonnas 7–14-aastane laps
45,2 37,5 17,2 A child 7–14 years of age in the household
Leibkonnas pole lapsi 42,9 37,3 19,8 No children in the household KOKKU 44,2 37,0 18,8 TOTAL Võimalus muuta tööpäeva algust või lõppu
Possibility to change the beginning or end of working day
Leibkonnas kuni kaheaastane laps
49,7 32,9 17,3 A child up to two years of age in the household
Leibkonnas 3–6-aastane laps 43,5 34,7 21,8 A child 3–6 years of age in the household
Leibkonnas 7–14-aastane laps
44,0 38,0 17,9 A child 7–14 years of age in the household
Leibkonnas pole lapsi 43,2 37,8 19,0 No children in the household KOKKU 44,1 36,9 19,0 TOTAL
a Vanuserühm 15–64. a Age group 15–64.
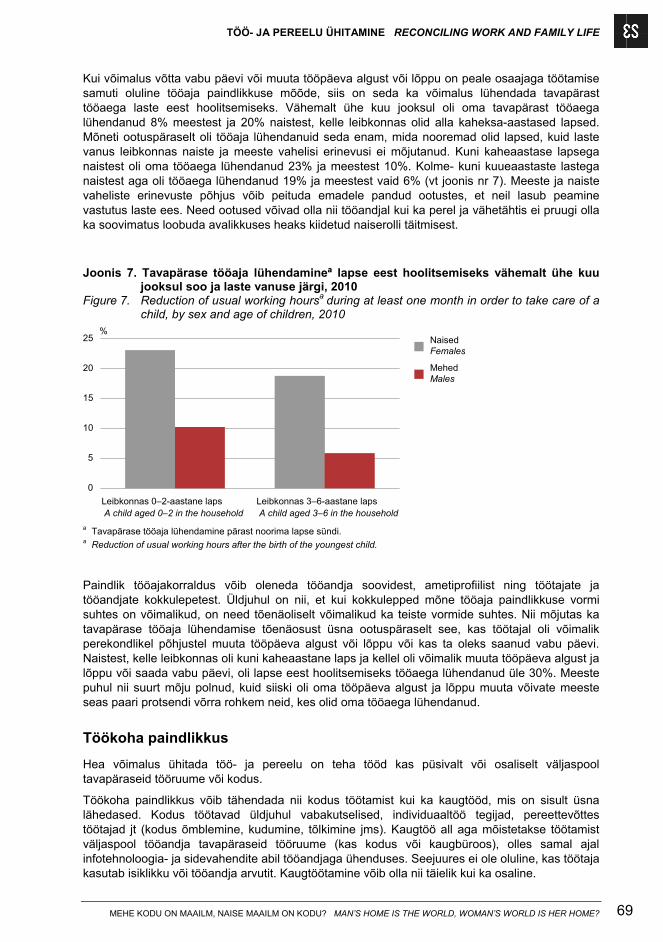
TÖÖ- JA PEREELU ÜHITAMINE RECONCILING WORK AND FAMILY LIFE
MEHE KODU ON MAAILM, NAISE MAAILM ON KODU? MAN’S HOME IS THE WORLD, WOMAN’S WORLD IS HER HOME? 69
Kui võimalus võtta vabu päevi või muuta tööpäeva algust või lõppu on peale osaajaga töötamise samuti oluline tööaja paindlikkuse mõõde, siis on seda ka võimalus lühendada tavapärast tööaega laste eest hoolitsemiseks. Vähemalt ühe kuu jooksul oli oma tavapärast tööaega lühendanud 8% meestest ja 20% naistest, kelle leibkonnas olid alla kaheksa-aastased lapsed. Mõneti ootuspäraselt oli tööaja lühendanuid seda enam, mida nooremad olid lapsed, kuid laste vanus leibkonnas naiste ja meeste vahelisi erinevusi ei mõjutanud. Kuni kaheaastase lapsega naistest oli oma tööaega lühendanud 23% ja meestest 10%. Kolme- kuni kuueaastaste lastega naistest aga oli tööaega lühendanud 19% ja meestest vaid 6% (vt joonis nr 7). Meeste ja naiste vaheliste erinevuste põhjus võib peituda emadele pandud ootustes, et neil lasub peamine vastutus laste ees. Need ootused võivad olla nii tööandjal kui ka perel ja vähetähtis ei pruugi olla ka soovimatus loobuda avalikkuses heaks kiidetud naiserolli täitmisest.
Joonis 7. Tavapärase tööaja lühendamineª lapse eest hoolitsemiseks vähemalt ühe kuu
jooksul soo ja laste vanuse järgi, 2010 Figure 7. Reduction of usual working hoursa during at least one month in order to take care of a
child, by sex and age of children, 2010
Leibkonnas 0–2-aastane lapsA child aged 0–2 in the household
Leibkonnas 3–6-aastane lapsA child aged 3–6 in the household
0
5
10
15
20
25 NaisedFemales
MehedMales
%
a Tavapärase tööaja lühendamine pärast noorima lapse sündi. a Reduction of usual working hours after the birth of the youngest child.
Paindlik tööajakorraldus võib oleneda tööandja soovidest, ametiprofiilist ning töötajate ja tööandjate kokkulepetest. Üldjuhul on nii, et kui kokkulepped mõne tööaja paindlikkuse vormi suhtes on võimalikud, on need tõenäoliselt võimalikud ka teiste vormide suhtes. Nii mõjutas ka tavapärase tööaja lühendamise tõenäosust üsna ootuspäraselt see, kas töötajal oli võimalik perekondlikel põhjustel muuta tööpäeva algust või lõppu või kas ta oleks saanud vabu päevi. Naistest, kelle leibkonnas oli kuni kaheaastane laps ja kellel oli võimalik muuta tööpäeva algust ja lõppu või saada vabu päevi, oli lapse eest hoolitsemiseks tööaega lühendanud üle 30%. Meeste puhul nii suurt mõju polnud, kuid siiski oli oma tööpäeva algust ja lõppu muuta võivate meeste seas paari protsendi võrra rohkem neid, kes olid oma tööaega lühendanud.
Töökoha paindlikkus
Hea võimalus ühitada töö- ja pereelu on teha tööd kas püsivalt või osaliselt väljaspool tavapäraseid tööruume või kodus.
Töökoha paindlikkus võib tähendada nii kodus töötamist kui ka kaugtööd, mis on sisult üsna lähedased. Kodus töötavad üldjuhul vabakutselised, individuaaltöö tegijad, pereettevõttes töötajad jt (kodus õmblemine, kudumine, tõlkimine jms). Kaugtöö all aga mõistetakse töötamist väljaspool tööandja tavapäraseid tööruume (kas kodus või kaugbüroos), olles samal ajal infotehnoloogia- ja sidevahendite abil tööandjaga ühenduses. Seejuures ei ole oluline, kas töötaja kasutab isiklikku või tööandja arvutit. Kaugtöötamine võib olla nii täielik kui ka osaline.
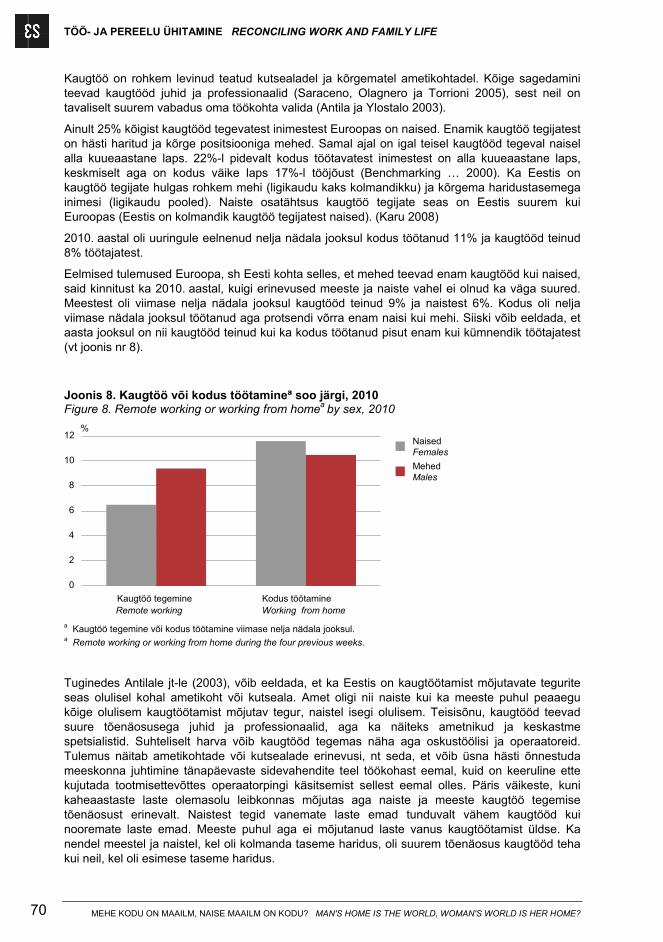
TÖÖ- JA PEREELU ÜHITAMINE RECONCILING WORK AND FAMILY LIFE
MEHE KODU ON MAAILM, NAISE MAAILM ON KODU? MAN'S HOME IS THE WORLD, WOMAN'S WORLD IS HER HOME? 70
Kaugtöö on rohkem levinud teatud kutsealadel ja kõrgematel ametikohtadel. Kõige sagedamini teevad kaugtööd juhid ja professionaalid (Saraceno, Olagnero ja Torrioni 2005), sest neil on tavaliselt suurem vabadus oma töökohta valida (Antila ja Ylostalo 2003).
Ainult 25% kõigist kaugtööd tegevatest inimestest Euroopas on naised. Enamik kaugtöö tegijatest on hästi haritud ja kõrge positsiooniga mehed. Samal ajal on igal teisel kaugtööd tegeval naisel alla kuueaastane laps. 22%-l pidevalt kodus töötavatest inimestest on alla kuueaastane laps, keskmiselt aga on kodus väike laps 17%-l tööjõust (Benchmarking … 2000). Ka Eestis on kaugtöö tegijate hulgas rohkem mehi (ligikaudu kaks kolmandikku) ja kõrgema haridustasemega inimesi (ligikaudu pooled). Naiste osatähtsus kaugtöö tegijate seas on Eestis suurem kui Euroopas (Eestis on kolmandik kaugtöö tegijatest naised). (Karu 2008)
2010. aastal oli uuringule eelnenud nelja nädala jooksul kodus töötanud 11% ja kaugtööd teinud 8% töötajatest.
Eelmised tulemused Euroopa, sh Eesti kohta selles, et mehed teevad enam kaugtööd kui naised, said kinnitust ka 2010. aastal, kuigi erinevused meeste ja naiste vahel ei olnud ka väga suured. Meestest oli viimase nelja nädala jooksul kaugtööd teinud 9% ja naistest 6%. Kodus oli nelja viimase nädala jooksul töötanud aga protsendi võrra enam naisi kui mehi. Siiski võib eeldada, et aasta jooksul on nii kaugtööd teinud kui ka kodus töötanud pisut enam kui kümnendik töötajatest (vt joonis nr 8).
Joonis 8. Kaugtöö või kodus töötamineª soo järgi, 2010 Figure 8. Remote working or working from homea by sex, 2010
Kaugtöö tegemineRemote working
Kodus töötamineWorking from home
0
2
4
6
8
10
12NaisedFemales
MehedMales
%
a Kaugtöö tegemine või kodus töötamine viimase nelja nädala jooksul. a Remote working or working from home during the four previous weeks. Tuginedes Antilale jt-le (2003), võib eeldada, et ka Eestis on kaugtöötamist mõjutavate tegurite seas olulisel kohal ametikoht või kutseala. Amet oligi nii naiste kui ka meeste puhul peaaegu kõige olulisem kaugtöötamist mõjutav tegur, naistel isegi olulisem. Teisisõnu, kaugtööd teevad suure tõenäosusega juhid ja professionaalid, aga ka näiteks ametnikud ja keskastme spetsialistid. Suhteliselt harva võib kaugtööd tegemas näha aga oskustöölisi ja operaatoreid. Tulemus näitab ametikohtade või kutsealade erinevusi, nt seda, et võib üsna hästi õnnestuda meeskonna juhtimine tänapäevaste sidevahendite teel töökohast eemal, kuid on keeruline ette kujutada tootmisettevõttes operaatorpingi käsitsemist sellest eemal olles. Päris väikeste, kuni kaheaastaste laste olemasolu leibkonnas mõjutas aga naiste ja meeste kaugtöö tegemise tõenäosust erinevalt. Naistest tegid vanemate laste emad tunduvalt vähem kaugtööd kui nooremate laste emad. Meeste puhul aga ei mõjutanud laste vanus kaugtöötamist üldse. Ka nendel meestel ja naistel, kel oli kolmanda taseme haridus, oli suurem tõenäosus kaugtööd teha kui neil, kel oli esimese taseme haridus.
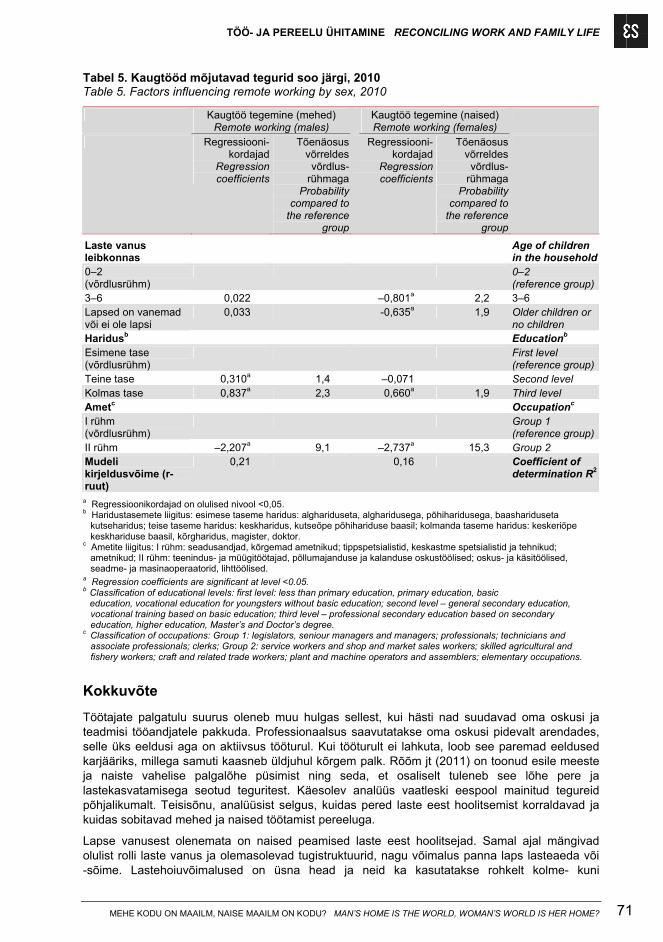
TÖÖ- JA PEREELU ÜHITAMINE RECONCILING WORK AND FAMILY LIFE
MEHE KODU ON MAAILM, NAISE MAAILM ON KODU? MAN’S HOME IS THE WORLD, WOMAN’S WORLD IS HER HOME? 71
Tabel 5. Kaugtööd mõjutavad tegurid soo järgi, 2010 Table 5. Factors influencing remote working by sex, 2010
Kaugtöö tegemine (mehed) Remote working (males)
Kaugtöö tegemine (naised) Remote working (females)
Regressiooni-kordajad
Regression coefficients
Tõenäosus võrreldes
võrdlus-rühmaga
Probability compared to
the reference group
Regressiooni-kordajad
Regression coefficients
Tõenäosus võrreldes
võrdlus-rühmaga
Probability compared to
the reference group
Laste vanus leibkonnas
Age of children in the household
0–2 (võrdlusrühm)
0–2 (reference group)
3–6 0,022 –0,801a 2,2 3–6 Lapsed on vanemad või ei ole lapsi
0,033 -0,635a 1,9 Older children or no children
Haridusb Educationb Esimene tase (võrdlusrühm)
First level (reference group)
Teine tase 0,310a 1,4 –0,071 Second level Kolmas tase 0,837a 2,3 0,660a 1,9 Third level Ametc Occupationc I rühm (võrdlusrühm)
Group 1 (reference group)
II rühm –2,207a 9,1 –2,737a 15,3 Group 2 Mudeli kirjeldusvõime (r-ruut)
0,21 0,16 Coefficient of determination R2
a Regressioonikordajad on olulised nivool <0,05. b Haridustasemete liigitus: esimese taseme haridus: alghariduseta, algharidusega, põhiharidusega, baashariduseta
kutseharidus; teise taseme haridus: keskharidus, kutseõpe põhihariduse baasil; kolmanda taseme haridus: keskeriõpe keskhariduse baasil, kõrgharidus, magister, doktor.
c Ametite liigitus: I rühm: seadusandjad, kõrgemad ametnikud; tippspetsialistid, keskastme spetsialistid ja tehnikud; ametnikud; II rühm: teenindus- ja müügitöötajad, põllumajanduse ja kalanduse oskustöölised; oskus- ja käsitöölised, seadme- ja masinaoperaatorid, lihttöölised.
a Regression coefficients are significant at level <0.05. b Classification of educational levels: first level: less than primary education, primary education, basic
education, vocational education for youngsters without basic education; second level – general secondary education, vocational training based on basic education; third level – professional secondary education based on secondary education, higher education, Master’s and Doctor’s degree.
c Classification of occupations: Group 1: legislators, seniour managers and managers; professionals; technicians and associate professionals; clerks; Group 2: service workers and shop and market sales workers; skilled agricultural and fishery workers; craft and related trade workers; plant and machine operators and assemblers; elementary occupations.
Kokkuvõte
Töötajate palgatulu suurus oleneb muu hulgas sellest, kui hästi nad suudavad oma oskusi ja teadmisi tööandjatele pakkuda. Professionaalsus saavutatakse oma oskusi pidevalt arendades, selle üks eeldusi aga on aktiivsus tööturul. Kui tööturult ei lahkuta, loob see paremad eeldused karjääriks, millega samuti kaasneb üldjuhul kõrgem palk. Rõõm jt (2011) on toonud esile meeste ja naiste vahelise palgalõhe püsimist ning seda, et osaliselt tuleneb see lõhe pere ja lastekasvatamisega seotud teguritest. Käesolev analüüs vaatleski eespool mainitud tegureid põhjalikumalt. Teisisõnu, analüüsist selgus, kuidas pered laste eest hoolitsemist korraldavad ja kuidas sobitavad mehed ja naised töötamist pereeluga.
Lapse vanusest olenemata on naised peamised laste eest hoolitsejad. Samal ajal mängivad olulist rolli laste vanus ja olemasolevad tugistruktuurid, nagu võimalus panna laps lasteaeda või -sõime. Lastehoiuvõimalused on üsna head ja neid ka kasutatakse rohkelt kolme- kuni
TÖÖ- JA PEREELU ÜHITAMINE RECONCILING WORK AND FAMILY LIFE
MEHE KODU ON MAAILM, NAISE MAAILM ON KODU? MAN'S HOME IS THE WORLD, WOMAN'S WORLD IS HER HOME? 72
kuueaastaste laste puhul. Nooremate laste hoiuks sobivate võimaluste puudus aga on sageli takistus tööturule tagasipöördumisel. Et lapsehoolduspuhkusele jäävate meeste osa on väga väike, pole vale käsitleda vaid naiste tööturule tagasipöördumist ja sellega seotud probleeme.
Enamik naisi ei koge siiski selliseid probleeme, mis takistaks neil tööle tagasi pöörduda, mida näitab ka see, et üle 70% naistest, kelle leibkonnas on kolme- kuni kuueaastased lapsed, olid 2010. aastal tööturul hõivatud.
Tööle asumine aga tähendab suurenevaid vajadusi töö- ja pereelu ühitamiseks ning sellest lähtuvalt paindlikuks töökorralduseks. Üks peamisi paindliku tööaja korralduse vorme on osaajaga töö, mida Eestis kuigi palju ei kasutata. Siiski on naiste seas osaajaga töötajaid oluliselt enam kui meeste seas ja kõige suurem on erinevus siis, kui leibkonnas on kuni kaheaastased lapsed. Väga vähestel meestel on osaajaga töötamise põhjuseks vajadus hoolitseda laste eest ja seda olenemata leibkonnas elavate laste vanusest. Osaajaga töötavatest naistest, kelle leibkonnas oli kuni kaheaastane laps, nimetas aga üle poole (54%) osaajaga töötamise põhjusena vajadust hoolitseda laste või hoolt vajavate täiskasvanute eest.
Naised on meestega võrreldes ka märksa enam lühendanud vajaduse korral tööpäevi ja võtnud vabu päevi laste eest hoolitsemiseks. Vaid kaugtöö võimalusi on mehed kasutanud naistest pisut rohkem.
Paindliku tööaja võimaldamine võib olla kompensatsioon madalama palga maksmisele ja et eelkõige oodatakse laste eest hoolitsemist naistelt, siis on selle kompensatsioonimehhanismi rakendamise mõju naistele ka suurem. Et seda mõju tasakaalustada, peaksid mehed enda peale võtma senisest enam kohustusi laste eest hoolitsemisel. Samal ajal ei pruugi meeste suurem panustamine laste eest hoolitsemisse oleneda vaid meeste enda soovist, vaid ka tööandjate suhtumisest ja naiste traditsioonilisest rollikäitumisest.
Allikad Sources
Ainsaar, M., Soo, K., Aidarov, A. (2004). Omavalitsuste toetus lastega peredele 2002–2003. Tartu: Rahvastikuministri büroo.
Antila, J., Ylostalo, P. (2003). Working Life Barometer in the Baltic Countries 2002. Labour Policy Studies, No 247. Helsingi: Ministry of Labour.
Benchmarking Progress on New Ways of Working and New Forms of Business Across Europe. ECaTT Final report. (2000). [www] www.ecatt.com/freport/ECaTT-Final-Report.pdf (12.08.2011).
De Wolff, A. (2000). Breaking the Myth of Flexible Work: Contingent Work in Toronto. A Study Conducted by the Contingent Workers Project. Toronto: Toronto Organizing for Fair Employment, Toronto.
Eesti Haigekassa majandusaasta aruanne 2008. [www] http://www.haigekassa.ee/uploads/userfiles/Majandusaasta%20aruanne%202008_allkirjadega.pdf (11.02.2010).
Eurostati andmebaas. [e-andmebaas] [www] http://epp.eurostat.ec.europa.eu/portal/page/portal/eurostat/home/ (03.08.2011).
Gatrell, C. (2005). Hard Labour: The Sociology of Parenthood. Maidenhead: Open University Press.
Ghysels, J. (2005). Some Reflections on equal opportunities and the reconciliation of work and family life.
Hansson, L. (1999). Töö ja perekonnaelu ühendamisega seonduvatest probleemidest. Ettekanne 1999. aasta laste ja perepoliitika valitsuskomisjoni töökoosolekul. [www] http://www.riik.ee/pere/hansson.html (08.08.2011).
TÖÖ- JA PEREELU ÜHITAMINE RECONCILING WORK AND FAMILY LIFE
MEHE KODU ON MAAILM, NAISE MAAILM ON KODU? MAN’S HOME IS THE WORLD, WOMAN’S WORLD IS HER HOME? 73
Hemerijck A., Visser J. (1999). A Dutch Miracle: Job Growth, Welfare Reform and Corporatism in the Netherlands. Amsterdam: Amsterdam University Press.
Hofäcker, D. (2003). Towards a Dual Earner Model? European Family Policies in Comparison. – Working Paper No 49. European Sociological Association Conference, Murcia, Spain.
Isad ja lapsehoolduspuhkus Eestis. (2007). Sotsiaalministeeriumi toimetised, nr 9/2007. Tallinn: Sotsiaalministeerium.
Järviste, L. (2010). Sooline võrdõiguslikkus ja ebavõrdsus: hoiakud ja olukord Eestis 2009. aastal. Sotsiaalministeeriumi toimetised, nr 3/2010. Tallinn: Sotsiaalministeerium.
Kandla, K., Ainsaar, M., Oras, K. (2000). Mida ootab noor pere riigi perepoliitikalt? – Laste ja perepoliitika Eestis ja Euroopas. / Toim M. Ainsaar, M. Tartu: Rahvastikuministri büroo, lk 134–152.
Karu, M. (2008). Paindlikud töövormid töö- ja pereelu ühitamisel. – Töö ja pere. Paindlik töökorraldus ja lastevanemate tööhõive. / Toim B. Vaher, K. Seeder. Tallinn: Eesti Tööandjate Keskliit, lk 5–13.
Kotowska, I., Matysiak, A. (2010). Work–family arrangements. – Family Life and Work. Second European Quality of Life Survey. Luxembourg: Office for Official Publications of the European Communities, pp. 33–54.
Kraavi, I. (2006). Lapse areng koolieelses eas ja lapsehoiu erinevad vormid. Tartu: Perekasvatuse Instituut.
Krillo, K. (2007). Osaajaga töötamine Eesti näitel. Dissertatsiooni autoreferaat magister artium’i kraadi taotlemiseks majandusteaduses. Tartu Ülikool.
Plantega, J., Remery, C. (2009). The provision of childcare services. A comparative review of 30 European countries. Luxembourg: Euroopa Komisjon.
Rõõm, T., Anspal, S. (2011). Sooline palgalõhe Eestis. Artiklite kogumik. Sotsiaalministeeriumi toimetised, nr 2/2011. Tallinn: Sotsiaalministeerium.
Saraceno, C., Olagnero, M., Torrioni, P. (2005). First European Quality of Life Survey: Families, Work and Social Networks. Luxembourg: Office for Official Publication of the European Communities.
Sundström, M., Duvander, A. Z. (2002). Gender division of childcare and the sharing of parental leave among new parents in Sweden. – European Sociological Review, Vol 18, No 4, pp. 433–447.
Tijdens, K. (2003). Employees’ and Employers’ Preferences for Working Time Reduction and Working Time Differentiation. A Study of the 36-Hour Working Week in the Dutch Banking Sector. – Acta Sociologica, Vol 46, No 1, pp. 69–82.
Unt, M., Krusell, S. (2004). Lastehoid Eesti peredes. Tallinn: Rahvastikuministri büroo.
Vainu, V., Järviste, L,. Biin, H. (2009). Soolise võrdõiguslikkuse monitooring 2009. Uuringuraport. Sotsiaalministeeriumi toimetised, nr 1/2010. Tallinn: Sotsiaalministeerium.
Wallace, C. (2003). Work Flexibility in Eight European Countries: A cross-national comparison. Sociological Series 60. Vienna: Institute for Advanced Studies.
TÖÖ- JA PEREELU ÜHITAMINE RECONCILING WORK AND FAMILY LIFE
MEHE KODU ON MAAILM, NAISE MAAILM ON KODU? MAN'S HOME IS THE WORLD, WOMAN'S WORLD IS HER HOME? 74
RECONCILING WORK AND FAMILY LIFE AS A TASK FOR WOMEN?
Siim Krusell
Introduction
Family as a social institution, although constantly changing in time, is a pillar of the sustainability of society. Having children is generally a norm in a family. As this norm changes, the role of the family as a guarantee of sustainability of the society becomes questionable. Working has an important role in guaranteeing sustainability and subsistence of families. According to the Estonian Labour Force Survey, more than a half of Estonian inhabitants are employed and spend considerable time in a week on working. People work on average 40 hours a week (full-time employees). In addition, a significant amount of time is spent on moving between home and work. It is equally important to be successful at work and have a fulfilling family life, thus the reconciliation of work and family life is a key issue. In the European context there are countries which view facilitating work and family life reconciliation as an important goal in the labour market and social and family policy and there are countries where little attention is paid to this issue. The Nordic countries (Sweden, Finland and Denmark) are good examples of the countries where combining work and family life is quite smooth. This is facilitated by well-developed public services, including childcare facilities, and flexibility of the labour market which all enable easy return of the parents who have been temporarily absent from it, also contributing to the time flexibility and work location flexibility. At the same time, combining work and family life is related to great difficulties in Anglo-Saxon (Ireland, the United Kingdom) as well as Southern European countries (Italy, Portugal) (Kotowska et al. 2010).
Thus, an important role in reconciling work and family life is played by labour market flexibility which means, for example, opportunities to regulate one’s working hours (time flexibility) and the place of working (work location flexibility). Additionally, functional and contract flexibility are defined. One of the objectives of the present article is to analyse reconciliation of work and family life from the perspective of time and location flexibility.
Labour market flexibility may also initiate a decision whether to temporarily leave the labour market or determine how difficult it is to return to the labour market with children at home. Return to the labour market or a temporary leave from it is, however, affected not only by its flexibility. The existing legislation which directly concerns staying at home with children and organisation of flexible working life as well as the possibility to use available childcare facilities, i.e whether there are enough childcare facilities and whether families can afford using them, also has an important role.
Thus, the article also analyses taking of a temporary parental leave from the labour market, return to the labour market and also the use of childcare facilities.
Today, employment of women is considered a norm and equal opportunities for men and women are being stressed. However, a woman’s role as a mother is still considered more important than that as an employee (Ghysels 2004). Women’s work load which is equal to that of men in paid employment (however the wages are lower) and bigger when household work is considered as well as the general favourable attitude towards traditional roles in a family have created a situation where combining work and family life is mainly a problem for women (Hansson 1999). The fact that reconciliation of work and family life is mainly a task for women is supported by the data on employment of males and females described in Figure 1. (Figure 1)
The highest share of employed men was among those whose households included children up to two years or younger – over 84% of them were employed. Employment rate was more than 80% among all men whose households included minor children. Among women, the least active in the labour market were those whose households included children aged two years or younger. Only 27% of those women were employed and only 5% were looking for work. If a household
TÖÖ- JA PEREELU ÜHITAMINE RECONCILING WORK AND FAMILY LIFE
MEHE KODU ON MAAILM, NAISE MAAILM ON KODU? MAN’S HOME IS THE WORLD, WOMAN’S WORLD IS HER HOME? 75
included children aged 3–6, the percentage of employment among women abruptly increased and was 75%. Employment rate for women was similar to that of men in households that included children of school age.
Employment rate among women raising small children can be increased by a higher use of flexible forms of work, better childcare services or a higher participation of men specifically in care of pre-school children.
Differences in labour status between women and men direct to the central objective of the analysis which is to highlight both the use of flexible forms of work and combining work with taking care of children separately for men and women.
The analysis outlined in this article is based on the results of the Estonian Labour Force Survey.
Taking parental leave and available childcare services
Taking parental leave
With regard to the return of parents to the labour market, an important role is played by organisation of childcare services and the way staying at home with children is regulated by legislation. Legislation defines different types of parental leave which enable parents to stay away from work for a certain period of time, for example, pregnancy and maternity leave, paternity leave, parental benefit and parental leave. Reconciliation of work and family life is most closely related to parental benefit and parental leave. A mother or a father is granted parental leave for the period until the child reaches three years of age. Parental leave may also be granted to the caregiver of a child if neither the mother nor the father wishes to take the parental leave. Parental benefit is a benefit paid to one of the parents during a period from the birth of a child until the child reaches 18 months and it compensates for the loss of profit from work. Parental benefit is paid to an employed parent in the amount of 100% of the income which is subject to social tax calculated for the calendar year prior to the date on which the child was born. After the end of the period of parental benefit, childcare allowance is paid to the person on parental leave.
Although any of the parents can take parental leave by the law, it is mainly the women who take parental leave. 96% of women and only 7% of men decided to take parental leave after the birth of their youngest child. (Figure 2)
The main reason for men not to take parental leave was that the leave was taken by their wife or cohabitee. But nearly one tenth of the men considered financial reasons the most important ones. (Figure 3)
Why the child’s mother stays at home is an important question. Sundström and Duvander (2002) tried to explain this and according to them, the decision made in favour of men staying at home is based on a two-level bargaining process.
The first level of bargaining takes place between the mother and the father, during which it is decided how long the mother would stay at home and when she would return to work and how much time of the parental leave is left for the father. The second level of bargaining takes place between the father and his employer (working environment), during which the father should consider the possible negative reaction from his colleagues, superior and employer, and the length of the parental leave (Sundström and Duvander 2002). With bargaining, a mother’s wish to continue being the main caregiver for her child is an important factor. This wish is often based on an inability or unwillingness to give up the publicly approved woman’s role in a family. However, females’ supporting attitude to male’s participation in raising children affects men’s behaviour so that they would dare to actively participate in caring for children (Gatrell 2005). The overall attitude of employers and fathers is favourable towards fathers taking parental leave, and it has been found that fathers and mothers should have equal opportunities for participating in raising children and reconciling work and family life. However, there is a large gap between the attitudes of fathers and their actual behaviour (Isad … 2007).
TÖÖ- JA PEREELU ÜHITAMINE RECONCILING WORK AND FAMILY LIFE
MEHE KODU ON MAAILM, NAISE MAAILM ON KODU? MAN'S HOME IS THE WORLD, WOMAN'S WORLD IS HER HOME? 76
In addition to the question regarding which of the parents would take parental leave, the length of the leave is also of relevance. A general opinion is that a short i.e. one-year-long parental leave facilitates women’s re-entrance to the labour market. With a longer parental leave, there is a possibility that women have difficulties in re-entering working life, especially in a situation where new technologies and rapid changes demand constant professional development (Hofäcker 2003). (Table 1)
Kandla (2000) has studied the length of the period during which females would like to stay at home with their children. Women would like to be at home on average for three years. Staying at home with children for more than three years is considered necessary by only 14% of the respondents. The circumstances that influence the length of the period of the actual stay at home can be divided into three main groups: 1) health and development of the child, the child should manage by him- or herself, 2) at a certain time the child needs other children, it depends on whether there is a kindergarten available and on its reputation, as the kindergarten would better prepare the child for socialisation, and 3) economic coping of the family – if possible, many respondents would stay at home for longer (Kandla 2000).
The fact that economic coping influences the length of parental leave is revealed by a regression model containing different characteristics which affect the length of parental leave. Household income and its amount is not one-to-one similar to coping but, as a general rule, a higher income would ensure better economic coping. According to the model, women included in the fourth quartile on the basis of household income were twice unlikely to take a parental leave of at most one and a half years than women in the first quartile. Women who belonged to the third quartile were more likely to take a shorter parental leave. The reasons for this contradiction may be related to the occupation, educational level and labour status. A shorter i.e. up to one and a half year-long parental leave was more likely in case of persons who had a higher educational level and were white-collar workers and also employed at the time of the survey. Belonging to the third income quartile might not ensure certainty about financial income and, therefore, as imminent as possible return to the labour market becomes more important in order to guarantee the necessary level of income and avoid a fall in the level of acquired human capital (professional skills, education). The likelihood of non-Estonian women to take a longer parental leave may be affected by the difficulties they experience in the labour market in general, due to which a longer leave may also be of forced nature.
Use of childcare services
While parental benefit and parental leave regulate directly or indirectly the temporary absence from work and the length of absence, public childcare services and the availability of these services are decisive in the return to the labour market. The age of children for which these services are meant is just as important, since this might make the parents who wish to return to the labour market postpone their return or use private childcare services which, as a rule, are more expensive.
The childcare system in Estonia is comparatively well-developed in comparison with respective systems of other European countries (Plantega and Remery 2009, reference according to Järviste 2010). Childcare services are provided by pre-school childcare institutions (crèches, kindergartens, nursery-primary schools, kindergartens for children with special needs) or alternative childcare institutions.
Alternative childcare institutions include play groups, playing rooms, children’s centres, family centres, childcare activities, etc. The provisions of Pre-school Child Care Institutions Act should be considered of high importance what concerns childcare services. Proceeding from the act, a rural municipality or city government provides all children from one and a half to seven years of age whose residence is in the administrative territory of the given rural municipality or city and whose parents so wish with the opportunity to attend a childcare institution in the catchment area. However, implementation of the act is often affected by the financial situation of local governments as well as the response time to population changes. The studies carried out so far
TÖÖ- JA PEREELU ÜHITAMINE RECONCILING WORK AND FAMILY LIFE
MEHE KODU ON MAAILM, NAISE MAAILM ON KODU? MAN’S HOME IS THE WORLD, WOMAN’S WORLD IS HER HOME? 77
have pointed out long wait lists of kindergartens as the main problem of childcare activities (Ainsaar et al. 2004).
In 2010, the number of children under seven years of age in Estonian families was slightly higher than 100,000; on average, more than 55,000 of them attended a kindergarten or a crèche. In case of 17,000 children under seven years of age – other childcare services were used, and with nearly 30,000 children – help of relatives or acquaintances living outside of the household was frequently used. For 35,000 children up to seven years of age no persistent childcare services were used.
The types of childcare services used and attending of institutions providing childcare services largely depend on the age of children. A kindergarten or a crèche was attended by over 80% of children aged three to six and by only one fifth of children up to two years of age.
Help of relatives or acquaintances was also used in case of nearly one third of children aged up to two years of age, but most of the parents of the children of this age group (63% of children) did not use traditional childcare services. The percentage of households with 3–6 year-old children who did not use childcare services was several times smaller – childcare services were not used only in case of 11% of children.
The question remains, whether the fact that for most of the children 0–2 years of age childcare services were not used is due to insufficiency and unavailability of such services or the unwillingness of parents to take their children to a kindergarten.
Krusell et al. (2004) have analysed the satisfaction of parents with childcare services and their wish to use childcare services. Most of the parents were more or less satisfied with the used childcare services and the organisation of these services: only one tenth did not consider the available childcare services satisfactory. The level of satisfaction was significantly affected by whether the parent wanted to start working again or not. This factor divided the parents who were staying at home into two: a half of those who did not want to go to work were very satisfied with the organisation of childcare services and the other half of the parents staying at home, those who would have gone to work if possible, were the least satisfied. The age of children also affected the level of satisfaction: most of the parents of 1-year-old children are happy to be at home and pleased with the situation while some of the parents of 2-year-old children would like to return to the labour market but cannot find suitable childcare facilities. (Krusell et al. 2004)
In case of men, the high price or absence of childcare services had no effect on whether they were looking for work or not. At the same time, 11% of women with children up to two years of age considered the absence or price of childcare services an important hindrance that made them not look for work.
Thus, the low use of childcare services with children aged 0–2 years is due to both unwillingness of the parents to use them and the insufficiency of such services offered. (Figure 4)
Nearly 20,000 persons in the prime working age (25–49) who were currently unemployed and were not actively seeking work, reported willingness to work, although they would not have commenced working immediately. Two thirds of this so-called potential labour force was comprised of women i.e. their number was considerably bigger than that of men. The reasons for not to commencing work within two weeks differed by gender. For men, the most important reasons were studies and own illness or disability. For women, the main respective reasons also included studies, but the most important reason was taking care of children or adults requiring care. Most of the women belonging to the group of potential labour force raised a child up to two years of age and only 8% of these women had children aged over 15 or did not have children in their households. (Figure 5)
One might assume that if parents have sufficient income, more childcare services are used as they would be less dependent on the price of such services.
In case of children up to six years of age, the use of kindergarten, crèche or a kindergarten for children with special needs was not significantly affected by income. However, a significant effect of income was seen on the use of hobby groups. While 7% of the children up to six years of age
TÖÖ- JA PEREELU ÜHITAMINE RECONCILING WORK AND FAMILY LIFE
MEHE KODU ON MAAILM, NAISE MAAILM ON KODU? MAN'S HOME IS THE WORLD, WOMAN'S WORLD IS HER HOME? 78
from families belonging to the first quartile attended a hobby group, the respective percentage for the fourth quartile was nearly 20%. In case of households belonging to the fourth quartile, more children were taken care of by relatives or acquaintances living outside of the household. A higher use of the help of relatives and acquaintances by households belonging to the fourth quartile may indicate that these parents may be more occupied with work which makes them look for additional childcare facilities. At the same time, parents with higher income have more opportunities for developing their children in hobby groups. (Table 2)
Use of services provided by kindergartens or other childcare facilities enables to make decisions regarding reconciliation of work and family life from a longer perspective as the agreements for the use of the services of childcare facilities are mostly made for a longer term. Illness of children often places parents in a complicated situation. Parents need to take days off from work when their child is ill which may intensify relations with the employer (Kraav 2006). Vainu et al. (2009) have pointed out that staying at home with a sick child is much more complicated for men than for women. However, employers consider such absence easier to arrange than a longer leave a man might take during the period when parental benefit is paid or during parental leave. This is also supported by the figures on the proportion of men among the recipients of certificates for care leave which has steadily grown and reached 23% in 2008 (Eesti Haigekassa 2008).
The data displayed in Table 3 still allow us to assume that the household member who stayed at home with a sick child was most likely the mother. (Table 3)
Different options for childcare were used during illnesses and organising childcare often entailed combining several kinds of childcare. The used ways of childcare depended on the age of child, too. Household members with children aged 3–6 were those who most often had to take temporary leave from work, change or reduce their working hours. Household members who were the least affected were those with children 7–14 years of age. It is noteworthy that a half of the children aged 7–14 were able to take care of themselves during an illness.
Working time flexibility
Working time flexibility has several dimensions. Time flexibility includes opportunities to regulate working hours a week, shorten a working day or take days off if required and working part-time.
Time flexibility can serve the interests of both employees and employers. With both parties, the attitudes related to time flexibility may differ depending on the occupation, field of activity and personal preferences. The interest of employers in flexible organisation of work may, for example, arise from the seasonality of the work or periods when the workload is excessive and the employer requires the employees to make extra hours (Tijdens 2003).
Wolff (2000) has stated that employees would rather prefer standard employment contracts with fixed working hours. This helps better plan the time spent with their family. At the same time, working time flexibility is expected in cases of unexpected events, incl. family-related events, such as illnesses, etc. (Wolff 2000). Consequently, working time flexibility is largely related to compromises made by both employees and employers.
Working part-time
Working part-time is one of the most analysed indicators of time flexibility (Wallace 2003). Part-time employees are defined as the employed who work less than 35 hours per week. Exceptions include occupations where the law prescribes short-time working.
According to Krillo (2007), working part-time helps companies flexibly adapt to economic cycles: in the conditions of economic growth, increasing of the number of employees who work part-time enables to avoid (or mitigate) problems arising from labour shortage; in the conditions of economic recession, it is possible to reduce working hours for all (or some of the) employees and thus implement part-time work to save labour costs while retaining employees who know the specifics of the company. On the other hand, part-time work enables flexible reconciliation of work and family life for those individuals who do not want to or cannot participate in the labour
TÖÖ- JA PEREELU ÜHITAMINE RECONCILING WORK AND FAMILY LIFE
MEHE KODU ON MAAILM, NAISE MAAILM ON KODU? MAN’S HOME IS THE WORLD, WOMAN’S WORLD IS HER HOME? 79
market full-time (in particular, mothers of small children, students and the elderly). (Krillo 2007). Part-time work is influenced by both institutional and supply/demand related factors. Institutional factors include, for example, offers by childcare facilities, the tax system and the child benefit system. Factors of the demand side include flexibility, sectorial division of the economy, and qualification of required labour force. Factors of supply side include gender and age as well as children and their number.
In Estonia part-time work is not widely practiced either among women or men. In 2010, 10% of women in the prime working age (25–49) and only 4% of men in the prime working age worked part-time. In 2010, in the European Union (EU) on average 29% women in the prime working age worked part-time. Part-time work was most used by working women in the Netherlands (72%), Switzerland (63%) and Germany (46%). In case of the Netherlands, the impact of the organisation of childcare services on part-time work has been pointed out i.e. in the Netherlands the provision of childcare services has been organised in a way that has made women work part-time instead of full-time (Hemerijck and Visser 1999, reference according to Karu 2008).
Compared to Estonian women, the number of women in the prime working age and working part-time was even smaller in Lithuania (8%), Greece (9%), Slovakia (4%) and Bulgaria (2%). In 2010, the percentage of men working part-time in Estonia was even lower – only 4%. However, men working part-time were rare also elsewhere in the EU. In 2010, in the EU on average only 6% of men in the prime working age worked part-time, only in the Netherlands the percentage was above 10% (Eurostat 2010).
Besides gender, the number of children in a household also affects working part-time. The effect was reverse in case of men and women in their prime working age i.e. the number of men working part-time was lower and that of women was higher when there were children in the household. While the share of men who were working part-time was not essentially influenced by the age of children, women with children aged up to two years clearly stood out. Nearly one third of working women with so small children worked part-time. The share of women with older children and working part-time was similar to that of working women aged 25–49 in total. (Figure 6)
The age of children in a household affected the reasons for working part-time in case of both women and men, however, differently. Men who had small children in the household (up to six years of age) worked part-time for inevitable reasons such as shortage of orders or work or inability to find full-time work. A need to take care of children was almost never reported as the reason for working part-time, irrespective of the age of children in household. However, men with older children reported also reasons other than the inevitable ones for working part-time. One of the substantial reasons was studying which was reported as the reason for working part-time by one fifth of the men who had children older than six years of age and who worked part-time.
The need to take care of children or adults requiring care was reported as the reason for working part-time by more than a half (54%) of the women working part-time who had children up to two years of age in their household. Among women with children aged three to six, the same reason was reported by 26% and among those with older children or without minor children the figure was low. At the same time, forced reasons for working part-time, such as shortage of orders or work or inability to find full-time work were also reported by women with children older than two years of age.
Agreements with employers to enable time flexibility
Due to the fact that many of those working part-time would rather work full-time, the use of part-time work as a time flexibility indicator is allowed only if the reasons for working part-time are specified. Irrespective of the reasons for working part-time, considerably more persons working part-time than persons working full-time could change the beginning of their workday or take days off for family reasons.
Opportunity to take days off or change the beginning or end of working days was positively influenced by having children in the household, but this highly depended also on the age of
TÖÖ- JA PEREELU ÜHITAMINE RECONCILING WORK AND FAMILY LIFE
MEHE KODU ON MAAILM, NAISE MAAILM ON KODU? MAN'S HOME IS THE WORLD, WOMAN'S WORLD IS HER HOME? 80
children (see Table 4). Slightly more than a half of those with children up to two years of age in the household could have days off for family reasons and only 16% of them could never do this. Changing the beginning or end of working days was slightly more possible for those who had children up to two years of age in the household compared to those who did not have children or had older children. Still, the differences between the groups were not significant enough to draw any comprehensive conclusions. (Table 4)
Besides the opportunity to have days off or change the beginning or end of working days and working part-time, the opportunity to reduce usual working hours in order to take care of children is also an important dimension of time flexibility. 8% of males and 20% of females with children aged up to eight years had reduced their usual working hours during at least one month. As one might expect, the number of persons who had reduced their working hours was higher among those with younger children but the differences between men and women were not affected by the age of children in the household. 23% of women and 10% of men with children up to two years of age had reduced their working hours. As to households with children aged 3–6, 19% of women and only 6% of men had reduced their working hours (see Figure 7). The differences between men and women may arise from the expectations put on mothers to take the main responsibility for children. The expectations may be from both the side of the employer and the family itself and unwillingness to give up the publicly approved woman’s role should not be underestimated here. (Figure 7)
Flexible working time organisation may depend on the wishes of employer, occupational profile and agreements between employees and the employer. Generally, if one form of flexible working time can be agreed upon, agreements concerning other forms can be reached, too. For example, the probability of reducing usual working hours was, as could be expected, influenced by whether it was possible for an employee to change the beginning and end of working day for family reasons or to take days off. More than 30% of women with a child aged up to two years of age in the household and who had the opportunity to change the beginning and end of working day or take days off had reduced their working hours. The effect was not so significant in case of men, however, the share of men who had reduced their working hours was higher by a couple of percentages among those who could change the beginning and end of their working day.
Work location flexibility
A good opportunity for reconciling work and family life is working, either permanently or in part, beyond the office or at home.
Work location flexibility may mean both working at home and remote working which basically are very similar. Home working is usually preferred by freelancers, individual workers, employees of a family undertaking, etc. (sewing, knitting, translating at home, etc.). Remote working means working beyond the traditional office of an employer (at home or in a “workhub”) being connected with the employer via contemporary means of information technology and telecommunication. Thereby, It is not important whether the employee uses his or her own or the employer´s computer. Remote working can be complete or partial.
Remote working is more widely used with certain occupations and at higher positions. Managers and professionals are the ones who most often engage in remote working (Saraceno, Olagnero and Torrioni 2005) as they usually have more possibilities to choose their place of work (Antila and Ylostalo, 2003).
It has been stated that only 25% of all remote workers in Europe are women. Most of remote workers are well educated men holding high positions. At the same time, every other woman engaged in remote working has a child below six years of age. 22% of all people working permanently from home have children under six years of age, while on average 17% of the total labour force have a minor child at home (Benchmarking … 2000). Men (nearly two thirds) and people with a higher educational level (almost a half) form the majority of remote workers also in Estonia. The share of women among remote workers in Estonia is higher than in Europe (in Estonia, a third of remote workers are women) (Karu 2008).
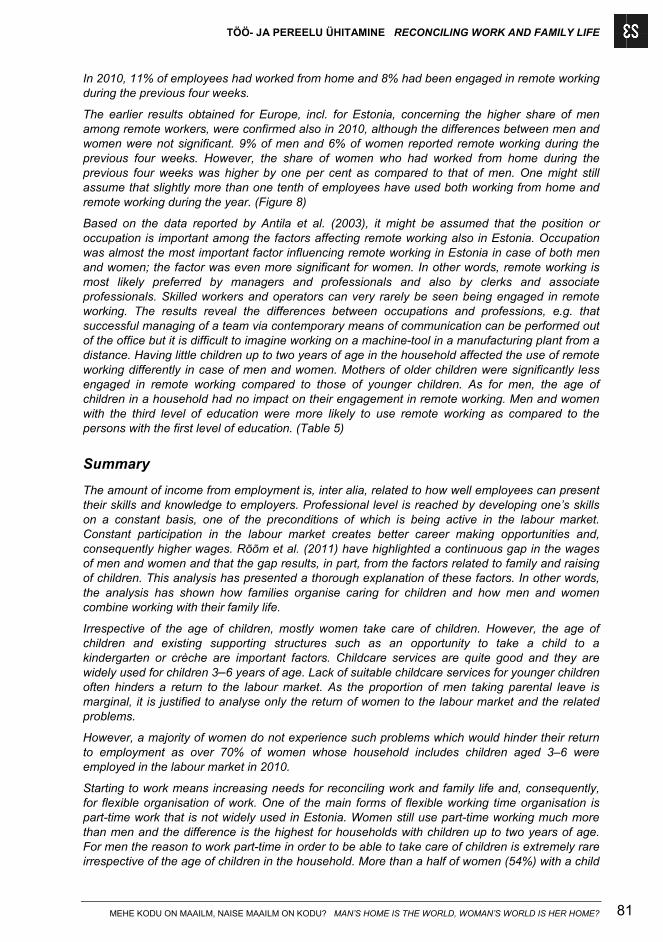
TÖÖ- JA PEREELU ÜHITAMINE RECONCILING WORK AND FAMILY LIFE
MEHE KODU ON MAAILM, NAISE MAAILM ON KODU? MAN’S HOME IS THE WORLD, WOMAN’S WORLD IS HER HOME? 81
In 2010, 11% of employees had worked from home and 8% had been engaged in remote working during the previous four weeks.
The earlier results obtained for Europe, incl. for Estonia, concerning the higher share of men among remote workers, were confirmed also in 2010, although the differences between men and women were not significant. 9% of men and 6% of women reported remote working during the previous four weeks. However, the share of women who had worked from home during the previous four weeks was higher by one per cent as compared to that of men. One might still assume that slightly more than one tenth of employees have used both working from home and remote working during the year. (Figure 8)
Based on the data reported by Antila et al. (2003), it might be assumed that the position or occupation is important among the factors affecting remote working also in Estonia. Occupation was almost the most important factor influencing remote working in Estonia in case of both men and women; the factor was even more significant for women. In other words, remote working is most likely preferred by managers and professionals and also by clerks and associate professionals. Skilled workers and operators can very rarely be seen being engaged in remote working. The results reveal the differences between occupations and professions, e.g. that successful managing of a team via contemporary means of communication can be performed out of the office but it is difficult to imagine working on a machine-tool in a manufacturing plant from a distance. Having little children up to two years of age in the household affected the use of remote working differently in case of men and women. Mothers of older children were significantly less engaged in remote working compared to those of younger children. As for men, the age of children in a household had no impact on their engagement in remote working. Men and women with the third level of education were more likely to use remote working as compared to the persons with the first level of education. (Table 5)
Summary
The amount of income from employment is, inter alia, related to how well employees can present their skills and knowledge to employers. Professional level is reached by developing one’s skills on a constant basis, one of the preconditions of which is being active in the labour market. Constant participation in the labour market creates better career making opportunities and, consequently higher wages. Rõõm et al. (2011) have highlighted a continuous gap in the wages of men and women and that the gap results, in part, from the factors related to family and raising of children. This analysis has presented a thorough explanation of these factors. In other words, the analysis has shown how families organise caring for children and how men and women combine working with their family life.
Irrespective of the age of children, mostly women take care of children. However, the age of children and existing supporting structures such as an opportunity to take a child to a kindergarten or crèche are important factors. Childcare services are quite good and they are widely used for children 3–6 years of age. Lack of suitable childcare services for younger children often hinders a return to the labour market. As the proportion of men taking parental leave is marginal, it is justified to analyse only the return of women to the labour market and the related problems.
However, a majority of women do not experience such problems which would hinder their return to employment as over 70% of women whose household includes children aged 3–6 were employed in the labour market in 2010.
Starting to work means increasing needs for reconciling work and family life and, consequently, for flexible organisation of work. One of the main forms of flexible working time organisation is part-time work that is not widely used in Estonia. Women still use part-time working much more than men and the difference is the highest for households with children up to two years of age. For men the reason to work part-time in order to be able to take care of children is extremely rare irrespective of the age of children in the household. More than a half of women (54%) with a child
TÖÖ- JA PEREELU ÜHITAMINE RECONCILING WORK AND FAMILY LIFE
MEHE KODU ON MAAILM, NAISE MAAILM ON KODU? MAN'S HOME IS THE WORLD, WOMAN'S WORLD IS HER HOME? 82
up to two years of age in the household and working part-time reported the need to take care of children or adults requiring care as the reason for part-time work.
Women have shortened working hours and taken days off to take care of children remarkably more often than men. Only remote working has been used by men a little more often than by women.
Flexible working time may compensate for lower wages and as women primarily are expected to take care of children, the effect of the application of this compensation mechanism is also higher for women. In order to balance the effect between men and women, men should assume more responsibilities for taking care of children than before. However, a higher contribution of men to taking care of children need not necessarily depend on the wish of the men alone but is also related to the attitude of employers and traditional role behaviour of women.
KULTUURIASUTUSTES KÄIMINE VISITING OF CULTURAL INSTITUTIONS
MEHE KODU ON MAAILM, NAISE MAAILM ON KODU? MAN’S HOME IS THE WORLD, WOMAN’S WORLD IS HER HOME? 83
KULTUURIASUTUSTES KÄIMINE INIMESTE AKTIIVSUSE NÄITAJANA
Kutt Kommel
Sissejuhatus
Siinse artikli eesmärk on analüüsida, kas kultuuriasutustes käivate ja mittekäivate inimeste ajakasutuse tavad erinevad. Eeldades, et kultuuritarbimine ei tähenda lihtsalt meeldivat vaba aja veetmist, mis vähendab depressiooni, parandab tervist ja tõstab õnnetunnet nii meestel kui ka naistel (Cuypers, Krokstad jt 2011), vaid ka rikastab inimest uue informatsiooni ja mõtteainega (mis on osa inimeste teadmistest ja arusaamadest, väärtushinnangutest ja maitse-eelistustest, aga ka eesmärkide kujunemisest läbi elu), võiks arvata, et see peaks avaldama mõju ka tema igapäevategemistele. Lähtudes sellest, et kultuuritarbimine tõstab inimese vaimset aktiivsust (Park 2011), võiks eeldada, et see avaldab mõju ka muudele tegemistele inimese igapäevaelus. Et seda kontrollida, olgu siinkohal välja pakutud hüpotees, et kultuuri tarbivad inimesed on üldiselt aktiivsemad kui need, kellel kultuuritarbimise harjumus puudub.
Aktiivsus võib väljenduda mitmesugustes tegevustes, näiteks aktiivses raamatute lugemises või aktiivses kaastöös vabatahtlikuna mõne organisatsiooni juures. Siinses artiklis on selleks aktiivsuse näitajaks valitud töö ja tööga seotud tegevustele kulunud päevane keskmine tundide arv, millel on kaudselt ka majanduslik mõõde. Tehtud töö hulk tähendab töö tegijatele üldjuhul seda, et nad saavad selle eest tasu, ja tööandjale seda, et peale töötajatele tehtud kulutuste peaks töö ka ettevõttele kasu tooma või aitama sellel muid eesmärke saavutada. Riigi tasandil tähendab see ühest küljest kodanikku, kellel on riigis hea elada, ja teisest küljest võiks suurem töö hulk anda kaudselt panuse näiteks riigi konkurentsivõime suurenemisse. Üksikisiku tasandil võiks päevas tööle pühendatud keskmise tundide arvu kaudselt ja lihtsustatult siduda ka näiteks inimese produktiivsusega, s.t mida rohkem tehakse tööd, seda rohkem on tulemust. Organisatsiooni produktiivsuse mõõtmiseks on sellest kindlasti vähe, sest seda mõõdetakse veel paljude muude teguritega. Siinne analüüs ei keskendu ainult tööturul aktiivsete inimeste harjumustele, vaid kõigile vähemalt kümneaastastele Eesti elanikele. Et töötavatel inimestel on töötundide arv suurem kui ametlikult mittetöötavatel inimestel, siis nende rühmade omavaheline võrdlemine inimeste aktiivsust silmas pidades ei annaks mingit olulist lisateavet ja oleks võib-olla ka eksitav. Seepärast keskendubki analüüs kultuuriasutustes käivate ja mittekäivate inimeste võrdlusele eri sotsiaalsetes rühmades.
Statistikaamet tegi 2010. aastal ajakasutusuuringu, millest on võimalik saada andmeid inimeste päevase ajakasutuse kohta. Ajakasutuse päevikuuringust on peale muu informatsiooni võimalik leida andmeid ka selle kohta, kui palju inimesed keskmiselt päevas tööd teevad. Siinses analüüsis on töötegemisele pühendatud keskmist aega vaadatud kui inimeste aktiivsuse näitajat.
Ajakasutusuuringus osalejad said täita päevikut ühe nädala jooksul, märkides sellesse kõik oma tegevused kümne minuti kaupa. Peale selle täitsid 7000 ajakasutusuuringus osalejat isiku-ankeedi, milles muu hulgas küsiti ka inimeste kultuuritarbimise ja kultuuritegevustes osalemise harjumuste kohta. Päevikusse said inimesed muude tegevuste kõrval märkida ka selle aja, mis nad kulutasid tööle ja tööga seotud tegevustele. Seda näitajat ei tohi segi ajada tööjõu-uuringus küsitava tööajaga, mida tahetakse teada üksnes neilt, kes on küsitlusele eelnenud nädalal töötanud vähemalt tunni, ja mida märgitakse ankeeti samuti tundides. Olgugi et tööaeg on kahtlemata suurem töötavatel inimestel, puudutab see vähemal määral ka teisi inimrühmi, kes on kas ametlikult töötud või mitteaktiivsed. Kuigi töötavate ja mittetöötvate inimeste aktiivsust ei ole mõttekas töötundide arvu mõõtes võrrelda, võib seda teha sellest hoolimata mõnede teiste omavahel võrreldavate sotsiaalsete rühmade puhul, eeldades, et selle aja, mis inimesed päevikusse töötegemise ja sellega seotud tegevuste alla märkisid, nad seda ka tegelikult tegid. Töö iseloom ja intensiivsus võivad inimesiti olla väga erinevad (mis jällegi teeb täpse aktiivsuse võrdlemise statistiliselt raskeks), ent aeg, mis nad töötegemisele kulutavad, on sealjuures neutraalne ja kõikehõlmav mõõde, mis näitab inimese keskendumist üht liiki tegevusele teatava
KULTUURIASUTUSTES KÄIMINE VISITING OF CULTURAL INSTITUTIONS
MEHE KODU ON MAAILM, NAISE MAAILM ON KODU? MAN’S HOME IS THE WORLD, WOMAN’S WORLD IS HER HOME? 84
aja jooksul. Palju töötamist tähendab ühtlasi seda, et inimesel on olemas nii füüsiline kui ka vaimne valmisolek ja motivatsioon (kas endast lähtuv või välistest teguritest tingitud). Vähem töötamist tähendab ka väiksemat valmisolekut ja motivatsiooni või nende puudumist. Rohket töötamist võib protestantliku maailmavaate kontekstis pidada omaette väärtuseks, aga sellel on olemas ka kindel majanduslik mõõde, kui töökulu mõõtühikuna kasutatakse selleks kuluvaid tunde. Tänapäeval on tööaeg enamasti ka seadusega reguleeritud. Eestis on näiteks töölepingu seaduses sätestatud tööaeg 40 tundi ja Prantsusmaal 35 tundi nädalas.
Inimeste aja analüüsimiseks on nende igapäevased tegevused jagatud viide peamisesse rühma. Peale tööle ja õpingutele kulunud aja vaadeldakse eraldi aktiivset, re-aktiivset ja passiivset vaba aja veetmist. Tööle kulunud aja alla on arvatud peale põhitöö ka talutööd, tööaeg teisel töökohal ja muu tööga seotud aeg. Tööaja sisse ei ole arvatud tööga seotud liikumine, mis tähendab näiteks tööleminekuks kulunud aega. Ajakasutusuuringu puhul (erinevalt tööjõu-uuringust) on tööaja sisse arvatud töö otsimisele kulunud aeg, mis on asjakohane, sest selle kaugem eemärk on nii nagu töö puhulgi raha teenida. Üldises plaanis on tööotsimisele kuluv aeg suhteliselt lühike, aga see on oluline näitaja töötavate ja mittetöötavate inimeste aktiivsuse võrdlemisel. Õpingute alla kuulub kõikvõimalik õppimistegevus, kuid mitte õppimisega seotud liikumine. Aktiivse vaba aja veetmise alla on arvatud hobide, kultuuritegevuste ja spordiga tegelemine ning mitmesugused osalustegevused, nagu vabatahtlik tegevus väljaspool kodu, osalemine koosolekutel, religioossetel sündmustel, aga ka külaskäigud ja muu sotsiaalne aktiivsus väljaspool kodu. Aktiivse vaba aja veetmise alla on üldjoontes koondatud need tegevused, mida inimesed teevad omal soovil enda vabast ajast ja millel on ka kindel intentsionaalne iseloom, s.t need on tegevused, millel on ka rohkem või vähem teadvustatud eesmärk või mis on seotud millegi poole pürgimisega. Re-aktiivse vaba aja tegevuste all on seevastu tegevused, mida inimesed teevad kas isiklikest või pere ja majapidamise vajadustest lähtuvalt, näiteks tegevused, mis puudutavad enda või mõne teise pereliikme eest hoolitsemist, majapidamise korrashoidu, ka eri tegevustega seotud liikumisi ja muid tegevusi, mida ollakse kas sunnitud tegema või mis puudutavad eraelukohustusi. Mitteaktiivse ehk passiivse vaba aja veetmise alla kuuluvad peale magamise ka muud tegevused, mis ei nõua erilist pingutust või kavatsust, nagu söömine ning suhtlemine perekonnaga ja telefonitsi, nii arvuti- kui ka muud mängud ja muud määratlemata vaba aja tegevused. Siia aga kuuluvad ka need tegevused, mis mõnes muus kontekstis võiks panna kas kultuuriliste või infotehnoloogiaga seotud tegevuste all, näiteks kodune arvutikasutamine ja telerivaatamine. Passiivset vaba aja veetmist aga ei peaks siinkohal vaatlema negatiivses tähenduses, s.t kui sisutult veedetud aega. Teatav arv unetunde ööpäevas on inimesele asendamatu ja ka pealtnäha jõude veedetud aeg võib olla vajalik enda kogumiseks, et saaks muul ajal aktiivselt vajalikke toiminguid teha. Negatiivsena saaks passiivset vaba aja veetmist vaadelda juhul, kui aktiivset ajaveetmist ei kaasneks sellega üldse. Selle analüüsi käigus on peamise näitajana vaadeldud kultuurisündmustel ja -asutustes käivate ja mittekäivate inimeste tööle kulunud aega. Õppimise ja vaba aja tegevuste analüüsile oleks vaja pühendada eraldi artikkel. Et kogumik keskendub meeste ja naiste harjumuste erinevustele, on selles artiklis esitatud näitajad sooti.
Meeste ja naiste ööpäevane ajajaotus
Vähemalt kümneaastaste meeste ja naiste ööpäevastes põhitegevustes on palju ühist, aga ka mõningad erinevused. Kui meestel on veidi rohkem mitteaktiivset vaba aja veetmist ja töötegevustele kuluvat aega, siis naistel jällegi aktiivset vaba aja veetmist ja re-aktiivseid tegevusi.
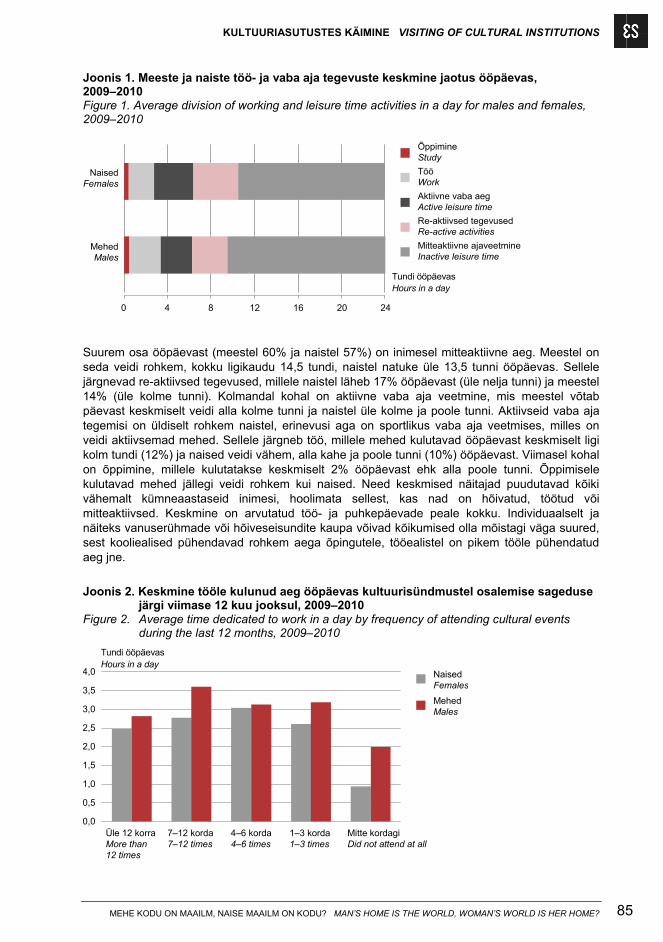
KULTUURIASUTUSTES KÄIMINE VISITING OF CULTURAL INSTITUTIONS
MEHE KODU ON MAAILM, NAISE MAAILM ON KODU? MAN’S HOME IS THE WORLD, WOMAN’S WORLD IS HER HOME? 85
Joonis 1. Meeste ja naiste töö- ja vaba aja tegevuste keskmine jaotus ööpäevas, 2009–2010 Figure 1. Average division of working and leisure time activities in a day for males and females, 2009–2010
0 4 8 12 16 20 24
MehedMales
NaisedFemales
ÕppimineStudy
TööWork
Aktiivne vaba aegActive leisure time
Re-aktiivsed tegevusedRe-active activities
Mitteaktiivne ajaveetmineInactive leisure time
Tundi ööpäevasHours in a day
Suurem osa ööpäevast (meestel 60% ja naistel 57%) on inimesel mitteaktiivne aeg. Meestel on seda veidi rohkem, kokku ligikaudu 14,5 tundi, naistel natuke üle 13,5 tunni ööpäevas. Sellele järgnevad re-aktiivsed tegevused, millele naistel läheb 17% ööpäevast (üle nelja tunni) ja meestel 14% (üle kolme tunni). Kolmandal kohal on aktiivne vaba aja veetmine, mis meestel võtab päevast keskmiselt veidi alla kolme tunni ja naistel üle kolme ja poole tunni. Aktiivseid vaba aja tegemisi on üldiselt rohkem naistel, erinevusi aga on sportlikus vaba aja veetmises, milles on veidi aktiivsemad mehed. Sellele järgneb töö, millele mehed kulutavad ööpäevast keskmiselt ligi kolm tundi (12%) ja naised veidi vähem, alla kahe ja poole tunni (10%) ööpäevast. Viimasel kohal on õppimine, millele kulutatakse keskmiselt 2% ööpäevast ehk alla poole tunni. Õppimisele kulutavad mehed jällegi veidi rohkem kui naised. Need keskmised näitajad puudutavad kõiki vähemalt kümneaastaseid inimesi, hoolimata sellest, kas nad on hõivatud, töötud või mitteaktiivsed. Keskmine on arvutatud töö- ja puhkepäevade peale kokku. Individuaalselt ja näiteks vanuserühmade või hõiveseisundite kaupa võivad kõikumised olla mõistagi väga suured, sest kooliealised pühendavad rohkem aega õpingutele, tööealistel on pikem tööle pühendatud aeg jne.
Joonis 2. Keskmine tööle kulunud aeg ööpäevas kultuurisündmustel osalemise sageduse
järgi viimase 12 kuu jooksul, 2009–2010 Figure 2. Average time dedicated to work in a day by frequency of attending cultural events
during the last 12 months, 2009–2010
0,0
0,5
1,0
1,5
2,0
2,5
3,0
3,5
4,0 NaisedFemales
MehedMales
Tundi ööpäevasHours in a day
Üle 12 korraMore than12 times
7–12 korda7–12 times
4–6 korda4–6 times
1–3 korda1–3 times
Mitte kordagiDid not attend at all
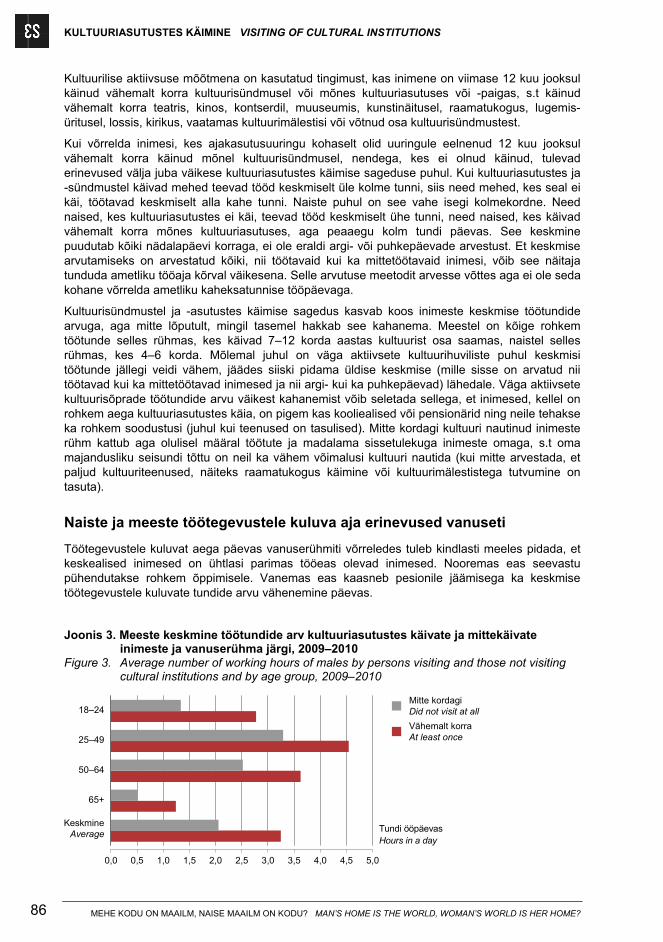
KULTUURIASUTUSTES KÄIMINE VISITING OF CULTURAL INSTITUTIONS
MEHE KODU ON MAAILM, NAISE MAAILM ON KODU? MAN’S HOME IS THE WORLD, WOMAN’S WORLD IS HER HOME? 86
Kultuurilise aktiivsuse mõõtmena on kasutatud tingimust, kas inimene on viimase 12 kuu jooksul käinud vähemalt korra kultuurisündmusel või mõnes kultuuriasutuses või -paigas, s.t käinud vähemalt korra teatris, kinos, kontserdil, muuseumis, kunstinäitusel, raamatukogus, lugemis-üritusel, lossis, kirikus, vaatamas kultuurimälestisi või võtnud osa kultuurisündmustest.
Kui võrrelda inimesi, kes ajakasutusuuringu kohaselt olid uuringule eelnenud 12 kuu jooksul vähemalt korra käinud mõnel kultuurisündmusel, nendega, kes ei olnud käinud, tulevad erinevused välja juba väikese kultuuriasutustes käimise sageduse puhul. Kui kultuuriasutustes ja -sündmustel käivad mehed teevad tööd keskmiselt üle kolme tunni, siis need mehed, kes seal ei käi, töötavad keskmiselt alla kahe tunni. Naiste puhul on see vahe isegi kolmekordne. Need naised, kes kultuuriasutustes ei käi, teevad tööd keskmiselt ühe tunni, need naised, kes käivad vähemalt korra mõnes kultuuriasutuses, aga peaaegu kolm tundi päevas. See keskmine puudutab kõiki nädalapäevi korraga, ei ole eraldi argi- või puhkepäevade arvestust. Et keskmise arvutamiseks on arvestatud kõiki, nii töötavaid kui ka mittetöötavaid inimesi, võib see näitaja tunduda ametliku tööaja kõrval väikesena. Selle arvutuse meetodit arvesse võttes aga ei ole seda kohane võrrelda ametliku kaheksatunnise tööpäevaga.
Kultuurisündmustel ja -asutustes käimise sagedus kasvab koos inimeste keskmise töötundide arvuga, aga mitte lõputult, mingil tasemel hakkab see kahanema. Meestel on kõige rohkem töötunde selles rühmas, kes käivad 7–12 korda aastas kultuurist osa saamas, naistel selles rühmas, kes 4–6 korda. Mõlemal juhul on väga aktiivsete kultuurihuviliste puhul keskmisi töötunde jällegi veidi vähem, jäädes siiski pidama üldise keskmise (mille sisse on arvatud nii töötavad kui ka mittetöötavad inimesed ja nii argi- kui ka puhkepäevad) lähedale. Väga aktiivsete kultuurisõprade töötundide arvu väikest kahanemist võib seletada sellega, et inimesed, kellel on rohkem aega kultuuriasutustes käia, on pigem kas kooliealised või pensionärid ning neile tehakse ka rohkem soodustusi (juhul kui teenused on tasulised). Mitte kordagi kultuuri nautinud inimeste rühm kattub aga olulisel määral töötute ja madalama sissetulekuga inimeste omaga, s.t oma majandusliku seisundi tõttu on neil ka vähem võimalusi kultuuri nautida (kui mitte arvestada, et paljud kultuuriteenused, näiteks raamatukogus käimine või kultuurimälestistega tutvumine on tasuta).
Naiste ja meeste töötegevustele kuluva aja erinevused vanuseti
Töötegevustele kuluvat aega päevas vanuserühmiti võrreledes tuleb kindlasti meeles pidada, et keskealised inimesed on ühtlasi parimas tööeas olevad inimesed. Nooremas eas seevastu pühendutakse rohkem õppimisele. Vanemas eas kaasneb pesionile jäämisega ka keskmise töötegevustele kuluvate tundide arvu vähenemine päevas.
Joonis 3. Meeste keskmine töötundide arv kultuuriasutustes käivate ja mittekäivate inimeste ja vanuserühma järgi, 2009–2010
Figure 3. Average number of working hours of males by persons visiting and those not visiting cultural institutions and by age group, 2009–2010
KeskmineAverage
65+
50–64
25–49
18–24
0,0 0,5 1,0 1,5 2,0 2,5 3,0 3,5 4,0 4,5 5,0
Vähemalt korraAt least once
Mitte kordagiDid not visit at all
Tundi ööpäevasHours in a day
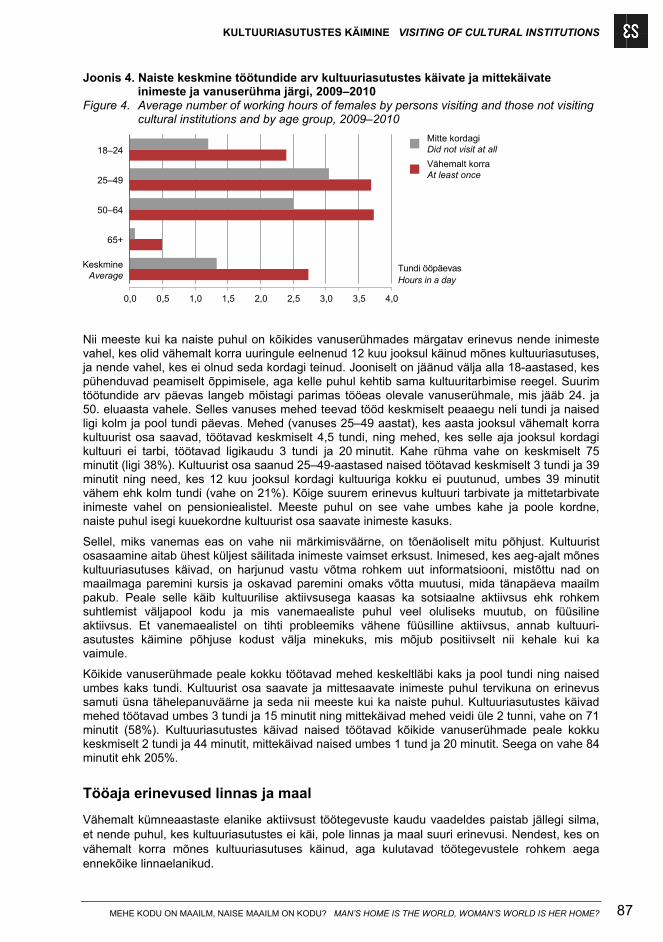
KULTUURIASUTUSTES KÄIMINE VISITING OF CULTURAL INSTITUTIONS
MEHE KODU ON MAAILM, NAISE MAAILM ON KODU? MAN’S HOME IS THE WORLD, WOMAN’S WORLD IS HER HOME? 87
Joonis 4. Naiste keskmine töötundide arv kultuuriasutustes käivate ja mittekäivate inimeste ja vanuserühma järgi, 2009–2010
Figure 4. Average number of working hours of females by persons visiting and those not visiting cultural institutions and by age group, 2009–2010
KeskmineAverage
65+
50–64
25–49
18–24
0,0 0,5 1,0 1,5 2,0 2,5 3,0 3,5 4,0
Tundi ööpäevasHours in a day
Vähemalt korraAt least once
Mitte kordagiDid not visit at all
Nii meeste kui ka naiste puhul on kõikides vanuserühmades märgatav erinevus nende inimeste vahel, kes olid vähemalt korra uuringule eelnenud 12 kuu jooksul käinud mõnes kultuuriasutuses, ja nende vahel, kes ei olnud seda kordagi teinud. Jooniselt on jäänud välja alla 18-aastased, kes pühenduvad peamiselt õppimisele, aga kelle puhul kehtib sama kultuuritarbimise reegel. Suurim töötundide arv päevas langeb mõistagi parimas tööeas olevale vanuserühmale, mis jääb 24. ja 50. eluaasta vahele. Selles vanuses mehed teevad tööd keskmiselt peaaegu neli tundi ja naised ligi kolm ja pool tundi päevas. Mehed (vanuses 25–49 aastat), kes aasta jooksul vähemalt korra kultuurist osa saavad, töötavad keskmiselt 4,5 tundi, ning mehed, kes selle aja jooksul kordagi kultuuri ei tarbi, töötavad ligikaudu 3 tundi ja 20 minutit. Kahe rühma vahe on keskmiselt 75 minutit (ligi 38%). Kultuurist osa saanud 25–49-aastased naised töötavad keskmiselt 3 tundi ja 39 minutit ning need, kes 12 kuu jooksul kordagi kultuuriga kokku ei puutunud, umbes 39 minutit vähem ehk kolm tundi (vahe on 21%). Kõige suurem erinevus kultuuri tarbivate ja mittetarbivate inimeste vahel on pensioniealistel. Meeste puhul on see vahe umbes kahe ja poole kordne, naiste puhul isegi kuuekordne kultuurist osa saavate inimeste kasuks.
Sellel, miks vanemas eas on vahe nii märkimisväärne, on tõenäoliselt mitu põhjust. Kultuurist osasaamine aitab ühest küljest säilitada inimeste vaimset erksust. Inimesed, kes aeg-ajalt mõnes kultuuriasutuses käivad, on harjunud vastu võtma rohkem uut informatsiooni, mistõttu nad on maailmaga paremini kursis ja oskavad paremini omaks võtta muutusi, mida tänapäeva maailm pakub. Peale selle käib kultuurilise aktiivsusega kaasas ka sotsiaalne aktiivsus ehk rohkem suhtlemist väljapool kodu ja mis vanemaealiste puhul veel oluliseks muutub, on füüsiline aktiivsus. Et vanemaealistel on tihti probleemiks vähene füüsilline aktiivsus, annab kultuuri-asutustes käimine põhjuse kodust välja minekuks, mis mõjub positiivselt nii kehale kui ka vaimule.
Kõikide vanuserühmade peale kokku töötavad mehed keskeltläbi kaks ja pool tundi ning naised umbes kaks tundi. Kultuurist osa saavate ja mittesaavate inimeste puhul tervikuna on erinevus samuti üsna tähelepanuväärne ja seda nii meeste kui ka naiste puhul. Kultuuriasutustes käivad mehed töötavad umbes 3 tundi ja 15 minutit ning mittekäivad mehed veidi üle 2 tunni, vahe on 71 minutit (58%). Kultuuriasutustes käivad naised töötavad kõikide vanuserühmade peale kokku keskmiselt 2 tundi ja 44 minutit, mittekäivad naised umbes 1 tund ja 20 minutit. Seega on vahe 84 minutit ehk 205%.
Tööaja erinevused linnas ja maal
Vähemalt kümneaastaste elanike aktiivsust töötegevuste kaudu vaadeldes paistab jällegi silma, et nende puhul, kes kultuuriasutustes ei käi, pole linnas ja maal suuri erinevusi. Nendest, kes on vähemalt korra mõnes kultuuriasutuses käinud, aga kulutavad töötegevustele rohkem aega ennekõike linnaelanikud.
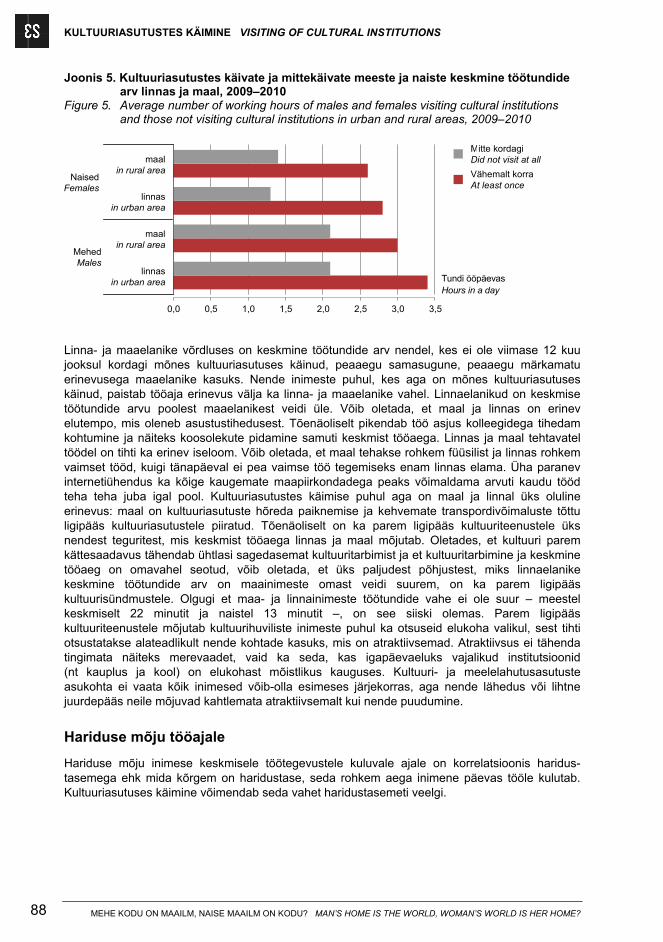
KULTUURIASUTUSTES KÄIMINE VISITING OF CULTURAL INSTITUTIONS
MEHE KODU ON MAAILM, NAISE MAAILM ON KODU? MAN’S HOME IS THE WORLD, WOMAN’S WORLD IS HER HOME? 88
Joonis 5. Kultuuriasutustes käivate ja mittekäivate meeste ja naiste keskmine töötundide arv linnas ja maal, 2009–2010
Figure 5. Average number of working hours of males and females visiting cultural institutions and those not visiting cultural institutions in urban and rural areas, 2009–2010
linnasin urban area
maalin rural area
linnasin urban area
maalin rural area
0,0 0,5 1,0 1,5 2,0 2,5 3,0 3,5
Tundi ööpäevasHours in a day
Vähemalt korraAt least once
Mitte kordagiDid not visit at all
NaisedFemales
MehedMales
Linna- ja maaelanike võrdluses on keskmine töötundide arv nendel, kes ei ole viimase 12 kuu jooksul kordagi mõnes kultuuriasutuses käinud, peaaegu samasugune, peaaegu märkamatu erinevusega maaelanike kasuks. Nende inimeste puhul, kes aga on mõnes kultuuriasutuses käinud, paistab tööaja erinevus välja ka linna- ja maaelanike vahel. Linnaelanikud on keskmise töötundide arvu poolest maaelanikest veidi üle. Võib oletada, et maal ja linnas on erinev elutempo, mis oleneb asustustihedusest. Tõenäoliselt pikendab töö asjus kolleegidega tihedam kohtumine ja näiteks koosolekute pidamine samuti keskmist tööaega. Linnas ja maal tehtavatel töödel on tihti ka erinev iseloom. Võib oletada, et maal tehakse rohkem füüsilist ja linnas rohkem vaimset tööd, kuigi tänapäeval ei pea vaimse töö tegemiseks enam linnas elama. Üha paranev internetiühendus ka kõige kaugemate maapiirkondadega peaks võimaldama arvuti kaudu tööd teha teha juba igal pool. Kultuuriasutustes käimise puhul aga on maal ja linnal üks oluline erinevus: maal on kultuuriasutuste hõreda paiknemise ja kehvemate transpordivõimaluste tõttu ligipääs kultuuriasutustele piiratud. Tõenäoliselt on ka parem ligipääs kultuuriteenustele üks nendest teguritest, mis keskmist tööaega linnas ja maal mõjutab. Oletades, et kultuuri parem kättesaadavus tähendab ühtlasi sagedasemat kultuuritarbimist ja et kultuuritarbimine ja keskmine tööaeg on omavahel seotud, võib oletada, et üks paljudest põhjustest, miks linnaelanike keskmine töötundide arv on maainimeste omast veidi suurem, on ka parem ligipääs kultuurisündmustele. Olgugi et maa- ja linnainimeste töötundide vahe ei ole suur – meestel keskmiselt 22 minutit ja naistel 13 minutit –, on see siiski olemas. Parem ligipääs kultuuriteenustele mõjutab kultuurihuviliste inimeste puhul ka otsuseid elukoha valikul, sest tihti otsustatakse alateadlikult nende kohtade kasuks, mis on atraktiivsemad. Atraktiivsus ei tähenda tingimata näiteks merevaadet, vaid ka seda, kas igapäevaeluks vajalikud institutsioonid (nt kauplus ja kool) on elukohast mõistlikus kauguses. Kultuuri- ja meelelahutusasutuste asukohta ei vaata kõik inimesed võib-olla esimeses järjekorras, aga nende lähedus või lihtne juurdepääs neile mõjuvad kahtlemata atraktiivsemalt kui nende puudumine.
Hariduse mõju tööajale
Hariduse mõju inimese keskmisele töötegevustele kuluvale ajale on korrelatsioonis haridus-tasemega ehk mida kõrgem on haridustase, seda rohkem aega inimene päevas tööle kulutab. Kultuuriasutuses käimine võimendab seda vahet haridustasemeti veelgi.
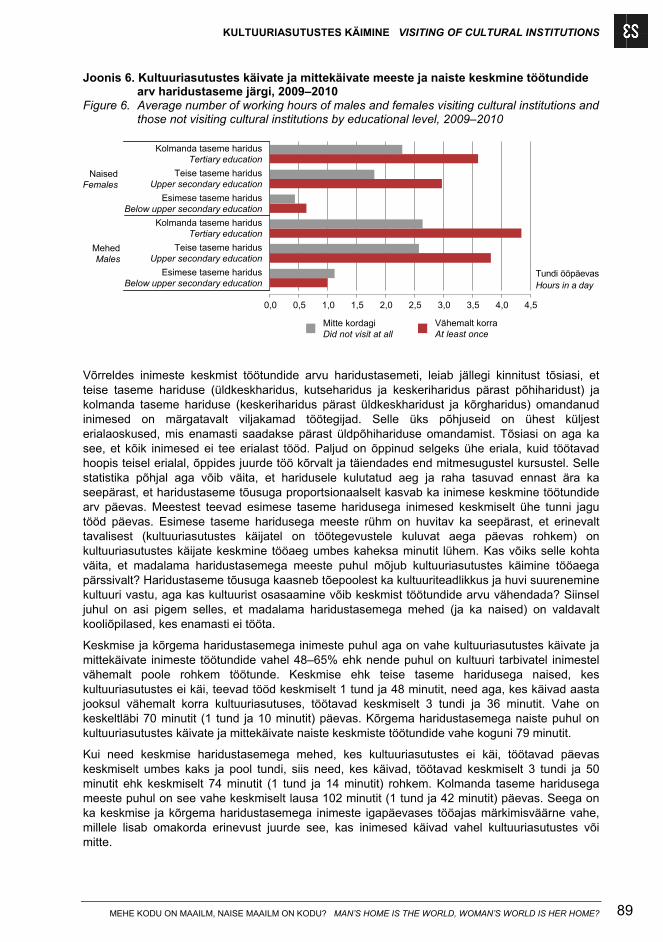
KULTUURIASUTUSTES KÄIMINE VISITING OF CULTURAL INSTITUTIONS
MEHE KODU ON MAAILM, NAISE MAAILM ON KODU? MAN’S HOME IS THE WORLD, WOMAN’S WORLD IS HER HOME? 89
Joonis 6. Kultuuriasutustes käivate ja mittekäivate meeste ja naiste keskmine töötundide arv haridustaseme järgi, 2009–2010
Figure 6. Average number of working hours of males and females visiting cultural institutions and those not visiting cultural institutions by educational level, 2009–2010
Esimese taseme haridusBelow upper secondary education
Teise taseme haridusUpper secondary education
Kolmanda taseme haridusTertiary education
Esimese taseme haridusBelow upper secondary education
Teise taseme haridusUpper secondary education
Kolmanda taseme haridusTertiary education
0,0 0,5 1,0 1,5 2,0 2,5 3,0 3,5 4,0 4,5
Tundi ööpäevasHours in a day
Vähemalt korraAt least once
Mitte kordagiDid not visit at all
NaisedFemales
MehedMales
Võrreldes inimeste keskmist töötundide arvu haridustasemeti, leiab jällegi kinnitust tõsiasi, et teise taseme hariduse (üldkeskharidus, kutseharidus ja keskeriharidus pärast põhiharidust) ja kolmanda taseme hariduse (keskeriharidus pärast üldkeskharidust ja kõrgharidus) omandanud inimesed on märgatavalt viljakamad töötegijad. Selle üks põhjuseid on ühest küljest erialaoskused, mis enamasti saadakse pärast üldpõhihariduse omandamist. Tõsiasi on aga ka see, et kõik inimesed ei tee erialast tööd. Paljud on õppinud selgeks ühe eriala, kuid töötavad hoopis teisel erialal, õppides juurde töö kõrvalt ja täiendades end mitmesugustel kursustel. Selle statistika põhjal aga võib väita, et haridusele kulutatud aeg ja raha tasuvad ennast ära ka seepärast, et haridustaseme tõusuga proportsionaalselt kasvab ka inimese keskmine töötundide arv päevas. Meestest teevad esimese taseme haridusega inimesed keskmiselt ühe tunni jagu tööd päevas. Esimese taseme haridusega meeste rühm on huvitav ka seepärast, et erinevalt tavalisest (kultuuriasutustes käijatel on töötegevustele kuluvat aega päevas rohkem) on kultuuriasutustes käijate keskmine tööaeg umbes kaheksa minutit lühem. Kas võiks selle kohta väita, et madalama haridustasemega meeste puhul mõjub kultuuriasutustes käimine tööaega pärssivalt? Haridustaseme tõusuga kaasneb tõepoolest ka kultuuriteadlikkus ja huvi suurenemine kultuuri vastu, aga kas kultuurist osasaamine võib keskmist töötundide arvu vähendada? Siinsel juhul on asi pigem selles, et madalama haridustasemega mehed (ja ka naised) on valdavalt kooliõpilased, kes enamasti ei tööta.
Keskmise ja kõrgema haridustasemega inimeste puhul aga on vahe kultuuriasutustes käivate ja mittekäivate inimeste töötundide vahel 48–65% ehk nende puhul on kultuuri tarbivatel inimestel vähemalt poole rohkem töötunde. Keskmise ehk teise taseme haridusega naised, kes kultuuriasutustes ei käi, teevad tööd keskmiselt 1 tund ja 48 minutit, need aga, kes käivad aasta jooksul vähemalt korra kultuuriasutuses, töötavad keskmiselt 3 tundi ja 36 minutit. Vahe on keskeltläbi 70 minutit (1 tund ja 10 minutit) päevas. Kõrgema haridustasemega naiste puhul on kultuuriasutustes käivate ja mittekäivate naiste keskmiste töötundide vahe koguni 79 minutit.
Kui need keskmise haridustasemega mehed, kes kultuuriasutustes ei käi, töötavad päevas keskmiselt umbes kaks ja pool tundi, siis need, kes käivad, töötavad keskmiselt 3 tundi ja 50 minutit ehk keskmiselt 74 minutit (1 tund ja 14 minutit) rohkem. Kolmanda taseme haridusega meeste puhul on see vahe keskmiselt lausa 102 minutit (1 tund ja 42 minutit) päevas. Seega on ka keskmise ja kõrgema haridustasemega inimeste igapäevases tööajas märkimisväärne vahe, millele lisab omakorda erinevust juurde see, kas inimesed käivad vahel kultuuriasutustes või mitte.
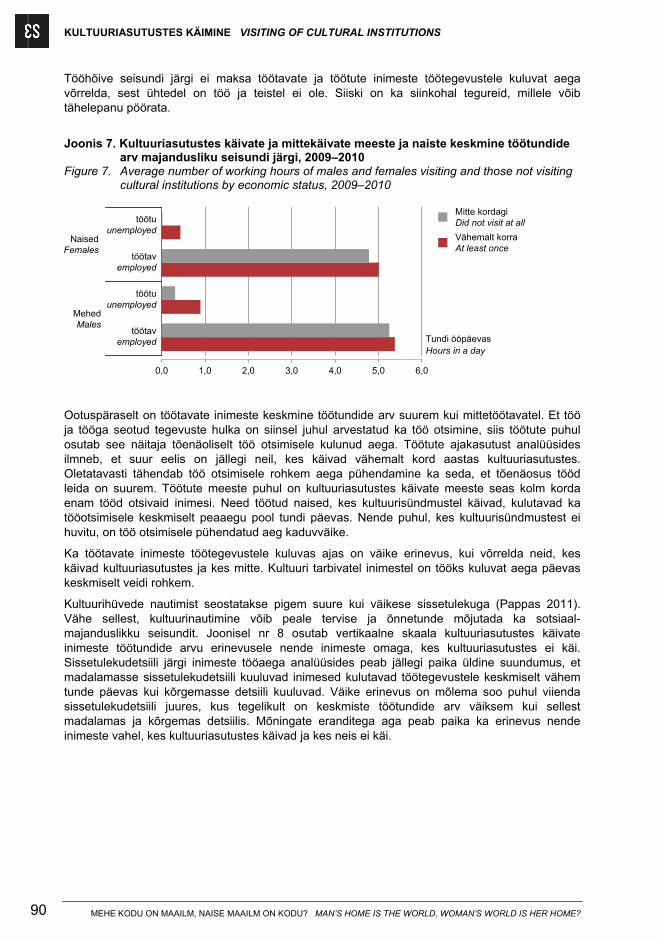
KULTUURIASUTUSTES KÄIMINE VISITING OF CULTURAL INSTITUTIONS
MEHE KODU ON MAAILM, NAISE MAAILM ON KODU? MAN’S HOME IS THE WORLD, WOMAN’S WORLD IS HER HOME? 90
Tööhõive seisundi järgi ei maksa töötavate ja töötute inimeste töötegevustele kuluvat aega võrrelda, sest ühtedel on töö ja teistel ei ole. Siiski on ka siinkohal tegureid, millele võib tähelepanu pöörata.
Joonis 7. Kultuuriasutustes käivate ja mittekäivate meeste ja naiste keskmine töötundide
arv majandusliku seisundi järgi, 2009–2010 Figure 7. Average number of working hours of males and females visiting and those not visiting
cultural institutions by economic status, 2009–2010
töötavemployed
töötuunemployed
töötavemployed
töötuunemployed
0,0 1,0 2,0 3,0 4,0 5,0 6,0
Tundi ööpäevasHours in a day
NaisedFemales
MehedMales
Vähemalt korraAt least once
Mitte kordagiDid not visit at all
Ootuspäraselt on töötavate inimeste keskmine töötundide arv suurem kui mittetöötavatel. Et töö ja tööga seotud tegevuste hulka on siinsel juhul arvestatud ka töö otsimine, siis töötute puhul osutab see näitaja tõenäoliselt töö otsimisele kulunud aega. Töötute ajakasutust analüüsides ilmneb, et suur eelis on jällegi neil, kes käivad vähemalt kord aastas kultuuriasutustes. Oletatavasti tähendab töö otsimisele rohkem aega pühendamine ka seda, et tõenäosus tööd leida on suurem. Töötute meeste puhul on kultuuriasutustes käivate meeste seas kolm korda enam tööd otsivaid inimesi. Need töötud naised, kes kultuurisündmustel käivad, kulutavad ka tööotsimisele keskmiselt peaaegu pool tundi päevas. Nende puhul, kes kultuurisündmustest ei huvitu, on töö otsimisele pühendatud aeg kaduvväike.
Ka töötavate inimeste töötegevustele kuluvas ajas on väike erinevus, kui võrrelda neid, kes käivad kultuuriasutustes ja kes mitte. Kultuuri tarbivatel inimestel on tööks kuluvat aega päevas keskmiselt veidi rohkem.
Kultuurihüvede nautimist seostatakse pigem suure kui väikese sissetulekuga (Pappas 2011). Vähe sellest, kultuurinautimine võib peale tervise ja õnnetunde mõjutada ka sotsiaal-majanduslikku seisundit. Joonisel nr 8 osutab vertikaalne skaala kultuuriasutustes käivate inimeste töötundide arvu erinevusele nende inimeste omaga, kes kultuuriasutustes ei käi. Sissetulekudetsiili järgi inimeste tööaega analüüsides peab jällegi paika üldine suundumus, et madalamasse sissetulekudetsiili kuuluvad inimesed kulutavad töötegevustele keskmiselt vähem tunde päevas kui kõrgemasse detsiili kuuluvad. Väike erinevus on mõlema soo puhul viienda sissetulekudetsiili juures, kus tegelikult on keskmiste töötundide arv väiksem kui sellest madalamas ja kõrgemas detsiilis. Mõningate eranditega aga peab paika ka erinevus nende inimeste vahel, kes kultuuriasutustes käivad ja kes neis ei käi.
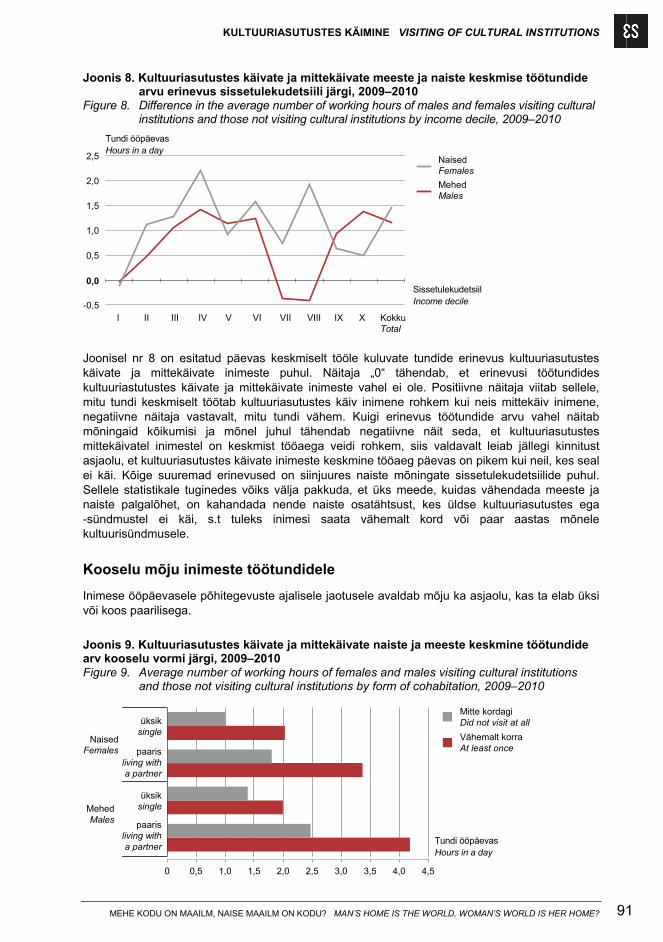
KULTUURIASUTUSTES KÄIMINE VISITING OF CULTURAL INSTITUTIONS
MEHE KODU ON MAAILM, NAISE MAAILM ON KODU? MAN’S HOME IS THE WORLD, WOMAN’S WORLD IS HER HOME? 91
Joonis 8. Kultuuriasutustes käivate ja mittekäivate meeste ja naiste keskmise töötundide arvu erinevus sissetulekudetsiili järgi, 2009–2010
Figure 8. Difference in the average number of working hours of males and females visiting cultural institutions and those not visiting cultural institutions by income decile, 2009–2010
Tundi ööpäevasHours in a day
I II III IV V VI VII VIII IX X KokkuTotal
-0,5
0,0
0,5
1,0
1,5
2,0
2,5
MehedMales
NaisedFemales
SissetulekudetsiilIncome decile
Joonisel nr 8 on esitatud päevas keskmiselt tööle kuluvate tundide erinevus kultuuriasutustes käivate ja mittekäivate inimeste puhul. Näitaja „0“ tähendab, et erinevusi töötundides kultuuriastutustes käivate ja mittekäivate inimeste vahel ei ole. Positiivne näitaja viitab sellele, mitu tundi keskmiselt töötab kultuuriasutustes käiv inimene rohkem kui neis mittekäiv inimene, negatiivne näitaja vastavalt, mitu tundi vähem. Kuigi erinevus töötundide arvu vahel näitab mõningaid kõikumisi ja mõnel juhul tähendab negatiivne näit seda, et kultuuriasutustes mittekäivatel inimestel on keskmist tööaega veidi rohkem, siis valdavalt leiab jällegi kinnitust asjaolu, et kultuuriasutustes käivate inimeste keskmine tööaeg päevas on pikem kui neil, kes seal ei käi. Kõige suuremad erinevused on siinjuures naiste mõningate sissetulekudetsiilide puhul. Sellele statistikale tuginedes võiks välja pakkuda, et üks meede, kuidas vähendada meeste ja naiste palgalõhet, on kahandada nende naiste osatähtsust, kes üldse kultuuriasutustes ega -sündmustel ei käi, s.t tuleks inimesi saata vähemalt kord või paar aastas mõnele kultuurisündmusele.
Kooselu mõju inimeste töötundidele
Inimese ööpäevasele põhitegevuste ajalisele jaotusele avaldab mõju ka asjaolu, kas ta elab üksi või koos paarilisega.
Joonis 9. Kultuuriasutustes käivate ja mittekäivate naiste ja meeste keskmine töötundide arv kooselu vormi järgi, 2009–2010 Figure 9. Average number of working hours of females and males visiting cultural institutions
and those not visiting cultural institutions by form of cohabitation, 2009–2010
paarisliving witha partner
üksiksingle
paarisliving witha partner
üksiksingle
0 0,5 1,0 1,5 2,0 2,5 3,0 3,5 4,0 4,5
Tundi ööpäevasHours in a day
NaisedFemales
MehedMales
Vähemalt korraAt least once
Mitte kordagiDid not visit at all
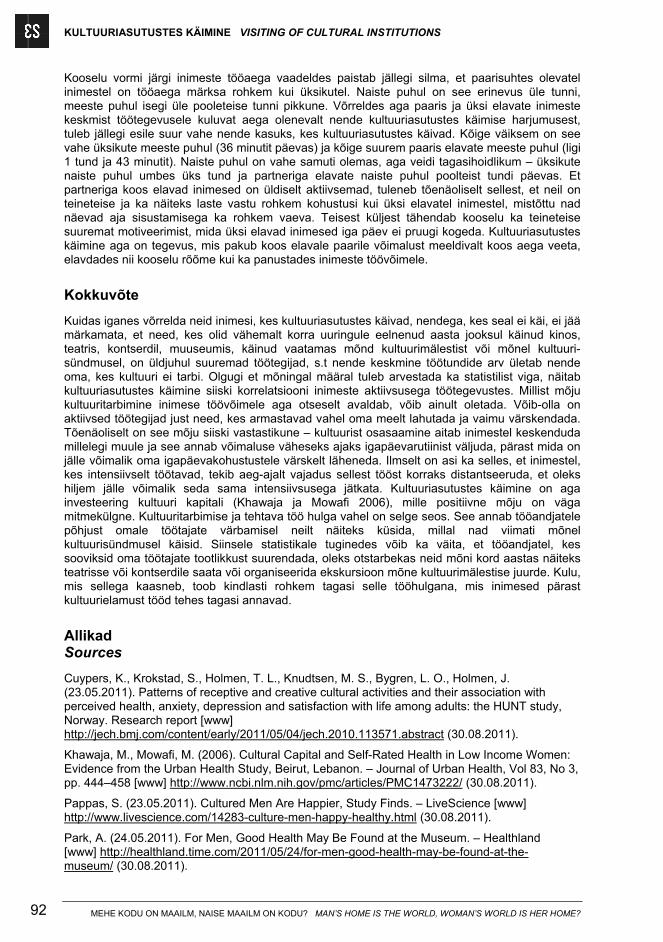
KULTUURIASUTUSTES KÄIMINE VISITING OF CULTURAL INSTITUTIONS
MEHE KODU ON MAAILM, NAISE MAAILM ON KODU? MAN’S HOME IS THE WORLD, WOMAN’S WORLD IS HER HOME? 92
Kooselu vormi järgi inimeste tööaega vaadeldes paistab jällegi silma, et paarisuhtes olevatel inimestel on tööaega märksa rohkem kui üksikutel. Naiste puhul on see erinevus üle tunni, meeste puhul isegi üle pooleteise tunni pikkune. Võrreldes aga paaris ja üksi elavate inimeste keskmist töötegevusele kuluvat aega olenevalt nende kultuuriasutustes käimise harjumusest, tuleb jällegi esile suur vahe nende kasuks, kes kultuuriasutustes käivad. Kõige väiksem on see vahe üksikute meeste puhul (36 minutit päevas) ja kõige suurem paaris elavate meeste puhul (ligi 1 tund ja 43 minutit). Naiste puhul on vahe samuti olemas, aga veidi tagasihoidlikum – üksikute naiste puhul umbes üks tund ja partneriga elavate naiste puhul poolteist tundi päevas. Et partneriga koos elavad inimesed on üldiselt aktiivsemad, tuleneb tõenäoliselt sellest, et neil on teineteise ja ka näiteks laste vastu rohkem kohustusi kui üksi elavatel inimestel, mistõttu nad näevad aja sisustamisega ka rohkem vaeva. Teisest küljest tähendab kooselu ka teineteise suuremat motiveerimist, mida üksi elavad inimesed iga päev ei pruugi kogeda. Kultuuriasutustes käimine aga on tegevus, mis pakub koos elavale paarile võimalust meeldivalt koos aega veeta, elavdades nii kooselu rõõme kui ka panustades inimeste töövõimele.
Kokkuvõte
Kuidas iganes võrrelda neid inimesi, kes kultuuriasutustes käivad, nendega, kes seal ei käi, ei jää märkamata, et need, kes olid vähemalt korra uuringule eelnenud aasta jooksul käinud kinos, teatris, kontserdil, muuseumis, käinud vaatamas mõnd kultuurimälestist või mõnel kultuuri-sündmusel, on üldjuhul suuremad töötegijad, s.t nende keskmine töötundide arv ületab nende oma, kes kultuuri ei tarbi. Olgugi et mõningal määral tuleb arvestada ka statistilist viga, näitab kultuuriasutustes käimine siiski korrelatsiooni inimeste aktiivsusega töötegevustes. Millist mõju kultuuritarbimine inimese töövõimele aga otseselt avaldab, võib ainult oletada. Võib-olla on aktiivsed töötegijad just need, kes armastavad vahel oma meelt lahutada ja vaimu värskendada. Tõenäoliselt on see mõju siiski vastastikune – kultuurist osasaamine aitab inimestel keskenduda millelegi muule ja see annab võimaluse väheseks ajaks igapäevarutiinist väljuda, pärast mida on jälle võimalik oma igapäevakohustustele värskelt läheneda. Ilmselt on asi ka selles, et inimestel, kes intensiivselt töötavad, tekib aeg-ajalt vajadus sellest tööst korraks distantseeruda, et oleks hiljem jälle võimalik seda sama intensiivsusega jätkata. Kultuuriasutustes käimine on aga investeering kultuuri kapitali (Khawaja ja Mowafi 2006), mille positiivne mõju on väga mitmekülgne. Kultuuritarbimise ja tehtava töö hulga vahel on selge seos. See annab tööandjatele põhjust omale töötajate värbamisel neilt näiteks küsida, millal nad viimati mõnel kultuurisündmusel käisid. Siinsele statistikale tuginedes võib ka väita, et tööandjatel, kes sooviksid oma töötajate tootlikkust suurendada, oleks otstarbekas neid mõni kord aastas näiteks teatrisse või kontserdile saata või organiseerida ekskursioon mõne kultuurimälestise juurde. Kulu, mis sellega kaasneb, toob kindlasti rohkem tagasi selle tööhulgana, mis inimesed pärast kultuurielamust tööd tehes tagasi annavad.
Allikad Sources
Cuypers, K., Krokstad, S., Holmen, T. L., Knudtsen, M. S., Bygren, L. O., Holmen, J. (23.05.2011). Patterns of receptive and creative cultural activities and their association with perceived health, anxiety, depression and satisfaction with life among adults: the HUNT study, Norway. Research report [www] http://jech.bmj.com/content/early/2011/05/04/jech.2010.113571.abstract (30.08.2011).
Khawaja, M., Mowafi, M. (2006). Cultural Capital and Self-Rated Health in Low Income Women: Evidence from the Urban Health Study, Beirut, Lebanon. – Journal of Urban Health, Vol 83, No 3, pp. 444–458 [www] http://www.ncbi.nlm.nih.gov/pmc/articles/PMC1473222/ (30.08.2011).
Pappas, S. (23.05.2011). Cultured Men Are Happier, Study Finds. – LiveScience [www] http://www.livescience.com/14283-culture-men-happy-healthy.html (30.08.2011).
Park, A. (24.05.2011). For Men, Good Health May Be Found at the Museum. – Healthland [www] http://healthland.time.com/2011/05/24/for-men-good-health-may-be-found-at-the-museum/ (30.08.2011).
KULTUURIASUTUSTES KÄIMINE VISITING OF CULTURAL INSTITUTIONS
MEHE KODU ON MAAILM, NAISE MAAILM ON KODU? MAN’S HOME IS THE WORLD, WOMAN’S WORLD IS HER HOME? 93
VISITING OF CULTURAL INSTITUTIONS AS AN INDICATOR OF POPULATION’S ACTIVENESS
Kutt Kommel
Introduction
The purpose of this article is to analyse whether there are any differences in the time use of the people who visit cultural institutions and the people who do not. Presuming that consumption of culture means more than just having a good time to reduce depression, improve health and increase the feeling of happiness both in case of men and women (Cuypers, Krokstad et al. 2011), but it also enriches people with new information and food for thought (which is a part of shaping people’s knowledge and beliefs, values, preferences and objectives throughout their life), we may assume that it has certain impact on their daily life and activities, too. Based on the fact that consumption of culture enhances mental activeness (Park 2011), one could assume that it also affects other aspects of daily human life. In order to verify this, I hereby set a hypothesis that people who consume culture are in general more active than people without the habit of consuming culture.
Activeness may be expressed in a variety of actions, such as intensive reading habits or buoyant voluntary contribution to some organisation. In this article, we have selected work and the average number of daily hours spent on work-related activities as an indicator of activeness; indirectly, it has also economic dimension. As a rule, for employees the amount of work performed corresponds to appropriate remuneration and, for the employer it means that besides the expenses made on the staff, work should bring in profit to the company or help it achieve other objectives. On the national level this means, on the one hand, a citizen who lives a good life in this country, and on the other hand, bigger workload may indirectly contribute to increasing the competitiveness of the state. On individual level, the average number of daily working hours may indirectly and in a simplified way be associated with person’s productivity, i.e. the more people work the greater the outcome. This is definitely not enough to measure the productivity of an organisation, as it consists of several other factors. The given analysis does not solely focus on the habits of people active in the labour market, but on the entire population at least ten years of age living in Estonia. As the number of working hours of employed people is larger than in case of officially unemployed people, there is no significant additional information, in terms of people’s activeness, to be gained from comparing these groups and it can even be misleading. Therefore, this analysis focuses on comparing the people visiting and those not visiting cultural institutions by social groups.
In 2010 Statistics Estonia conducted the Time Use Survey, which provided information about people’s daily time use. Among other information, the diaries of Time Use Survey also provided data concerning the average amount of work performed by people on a daily basis. In this analysis, the average number of working hours is viewed as the activeness indicator.
The respondents of the Time Use Survey were asked to write down all their activities within a ten-minute interval over the period of one week by making relevant diary entries. In addition, 7,000 participants in the Time Use Survey filled in personal questionnaires, where they were asked also about their habits with regard to the consumption of culture and involvement in cultural activities. Among other activities, people could also write down the time spent on working and work-related activities. This indicator must not be confused with the working time considered in the Labour Force Survey which concerns only the people who have worked for at least one hour during the week before the survey and which is also indicated in the questionnaire in hours. Despite the fact that working time is undoubtedly longer for employed people, this also concerns, although to a smaller extent, other groups of people, who are officially unemployed or inactive. Even though it is not reasonable to compare the activeness of employed and unemployed people by measuring the number of working hours, it could still be done in case of other comparable social groups, assuming that they actually did what they indicated in the diary under work and
KULTUURIASUTUSTES KÄIMINE VISITING OF CULTURAL INSTITUTIONS
MEHE KODU ON MAAILM, NAISE MAAILM ON KODU? MAN’S HOME IS THE WORLD, WOMAN’S WORLD IS HER HOME? 94
work-related activities. Although the nature and intensity of work may be quite different (which, again, complicates comparison of activeness in statistical terms), the time they spend on working is a neutral and comprehensive dimension which shows personal concentration on one type of activity during a certain period of time. A lot of work also means that people are (both physically and mentally) ready and motivated (by internal or external factors). Working less means lower level or lack of readiness and motivation. In the context of protestant outlook, a lot of work may be considered a value in itself, but it also has a certain economic dimension, when working hours are used to measure labour. In modern days, working time is in most cases regulated by law. For instance, pursuant to the Employment Contracts Act, the established working time is 40 hours per week in Estonia and 35 hours per week in France.
In order to analyse time use, people’s daily activities are distributed into five main groups. In addition to the time spent on work and study, there are separate categories for spending active, re-active and inactive leisure time. Besides main job, the time spent on work also includes farming, second job, and other work-related time. Working time does not include work-related travel, this means e.g. the time spent on commuting to and from work. In the Time Use Survey (unlike the Labour Force Survey), working time includes the time spent on looking for a job, which is relevant due to its ultimate purpose to earn money, which is also the purpose of working. In general, the time spent on finding a job is relatively brief, yet it represents a significant indicator when comparing the activeness of employed and unemployed people. Study includes all learning activities, but not the motion related to study. Active leisure time involves engagement in hobbies, cultural activities and sports, and attendance of various events, such as volunteer work outside home, attendance of meetings, religious activities as well as paying visits and other social activeness outside home. Active leisure time generally involves activities performed by people on their own initiative and having a certain intentional character, i.e. they are activities associated with a more or less certain purpose or aspiration towards something. Re-active leisure time activities, on the other hand, include activities performed by people based either on their personal, family or household needs. Thus, these include activities related to personal care or help to an adult family member, household upkeep, and also motion related to various activities and other forced activities or simply obligations related to personal life. Inactive or passive leisure time covers sleep, but also other activities that do not require particular effort or intent. This includes eating, socializing with family members and telephone conversations, computer games and other games, as well as other unspecified leisure time activities. This category also involves activities that – in some other context – might be classified under the activities related to culture or information technology, such as using the computer at home or watching television. However, inactive leisure time should not be seen with negative connotation, i.e. as time spent without any purpose. A certain number of sleeping hours per 24 hours is essential for human health and even the seemingly idle moments might be necessary for composing oneself, in order to be active enough for performing other necessary activities later on. Inactive leisure time could be viewed as negative if it would not involve any other activity. In the course of this analysis, the main indicator observed is the time spent on work activities by people attending cultural events and visiting cultural institutions and by people who do not do it. A separate article should be dedicated to the analysis of study and leisure time activities. Considering that this collection of articles is focused on the differences in the habits of males and females, this article points out gender-specific indicators.
Daily time division of men and women
There are a lot of common features but also some differences in the primary daily activities of males and females who are at least ten years of age. Males dedicate a bit more time to inactive leisure time activities and on work. Females, on the other hand, have more active leisure time and re-active activities. (Figure 1)
Most of the 24 hours (60% for men and 57% for women) is deemed as inactive. Inactive time is more prevalent for men – approximately 14.5 hours in total, and a little more than 13.5 hours a day for women. This is followed by re-active activities, which constitute 17% (more than four
KULTUURIASUTUSTES KÄIMINE VISITING OF CULTURAL INSTITUTIONS
MEHE KODU ON MAAILM, NAISE MAAILM ON KODU? MAN’S HOME IS THE WORLD, WOMAN’S WORLD IS HER HOME? 95
hours) of the day for women and 14% (more than three hours) for men. Active leisure time, which takes a bit less than three hours a day for men and more than 3.5 hours for women a day, ranks as third. Active leisure time activities are generally more common in case of women, except for sports-related leisure time, in which men are slightly more active. This is followed by work activities, which take approximately three hours (or 12%) per day for men and a bit less time i.e. less than 2.5 hours (10%) per day for women. Studies hold the last position with an average of 2% per day, i.e. less than half an hour. Yet men spend slightly more time on studying than women. Such average indicators concern all people aged 10 years or older regardless of whether they are employed, unemployed or inactive. The average value is calculated based on both working days and holidays. However, there might be rather great variance when viewed individually or by age group or by labour status, because school-aged people dedicate more time to their studies, whereas people of working age spend more time on working, etc. (Figure 2)
One parameter for measuring cultural activeness is whether the respondent has, within the last 12 months, attended at least one cultural event or visited at least one cultural institution or venue. Or, more specifically – attended at least once the theatre, cinema, concert, visited museum, art exhibition, library, castle, church, cultural monument, or attended any other cultural event.
When comparing people who had attended a culture event for at least once within the last 12 months and those who had not attended any culture event at all, differences are noticeable already in case of lower frequency of visiting cultural institutions. Men attending culture events and visiting cultural institutions work on average over three hours, while men who do not attend culture events, work on average less than two hours. This difference is even threefold in case of women. Females who do not visit cultural institutions, work on average for one hour; whereas females who have visited a cultural institution for at least once, work for almost three hours a day. This average concerns all days of the week, both workdays and holidays. As the calculation of the average involves both employed and unemployed people, this indicator may seem low in comparison with official working time. In view of this calculation method, however, it is inappropriate to compare it with the official eight-hour working day. The frequency of attending cultural events and visiting cultural institutions increases along with the average number of working hours, but only to a certain point, where it begins to decrease again. For men, the highest number of working hours is reported in the group that attends cultural events 7 to 12 times a year, for women such number of working hours is found in the group who attends cultural events 4 to 6 times a year. In both cases the average number of working hours is slightly lower for people actively involved in cultural activities, but the number is still close to the overall average (including both employed and unemployed people, and both workdays and holidays). A small decline in the number of working hours of culturally highly active people can be explained by the fact that people who have more time to visit cultural institutions are either of school age or retired who are more frequently also subject to discounts (in case of paid services). The group of people who have never enjoyed culture overlaps to a significant extent with the group of people who are either unemployed or have lower income, i.e. they have fewer opportunities to enjoy culture due to their economic status (when ignoring the fact that several cultural services, such as visiting the library or cultural monuments can be done free of charge).
Age-specific differences in the time spent on work activities by women and men
When comparing the daily time dedicated to work activities by age group, it should definitely be remembered that middle-aged people are at their prime working age. At a younger age, on the other hand, people dedicate themselves more to studies. At an older age, retiring is naturally accompanied by a decreasing average number of hours dedicated to work activities in a day. (Figures 3 and 4)
Both for men and women in all age groups, there is a noticeable difference between people who had visited some cultural institution at least once within the 12 months preceding the survey and the people who had not visited any cultural institutions during that time. These diagrams do not
KULTUURIASUTUSTES KÄIMINE VISITING OF CULTURAL INSTITUTIONS
MEHE KODU ON MAAILM, NAISE MAAILM ON KODU? MAN’S HOME IS THE WORLD, WOMAN’S WORLD IS HER HOME? 96
include people younger than 18 as they are mostly dedicated to studying, but the same culture consumption rule applies to them, too. The highest number of working hours per day is naturally reported in the group of people who are at their prime working age, ranging from 24 to 50 years of age. In this age group, the average working time per day is almost four hours for men and approximately 3.5 hours for women. The average working time per day in case of men (aged 24–50) who consume culture for at least once a year is 4.5 hours, and the relevant time for men who do not consume culture during a year, is approximately 3 hours and 20 minutes. The average difference between the two groups is 75 minutes (approximately 38%). The average working time for 24–50-year-old women attending cultural events is 3 hours 39 minutes and for those who do not attend cultural events within 12 months it is about 39 minutes less, i.e. three hours (the difference is 21%). The greatest difference between people attending and not attending cultural events is seen in case of people at the retirement age. The difference in favour of people participating in cultural events is approximately 2.5 times for men and even six times for women.
There are probably several reasons why this difference is so significant at an older age. On the one hand, culture attendance helps to maintain people’s mental sprightliness. People, who occasionally visit cultural institutions are accustomed to receiving more new information and are thus more familiar with the surrounding environment and ready to adopt changes encountered in the modern world. In addition, cultural activeness involves social activeness, i.e. more communication outside home, as well as another factor crucial for older population – physical activeness. Considering that a low level of physical activeness often poses a problem for the elderly, visiting of cultural institutions gives a reason to get out of home, which has a positive effect both on the body and the mind.
The average working time for all age groups is 2.5 hours for men and about two hours for women. The difference is also rather remarkable in case of people attending and those not attending cultural events as a whole, and this applies to both men and women. Men who visit cultural institutions work for about 3 hours and 15 minutes and men who do not visit cultural institutions work a little more than two hours, the difference being 71 minutes (58%). Across all age groups in total, women who visit cultural institutions work on average for 2 hours and 44 minutes and women who do not visit cultural institutions work for about 1 hour and 20 minutes. Consequently, the difference is 84 minutes or 205%.
Differences in working time in urban and rural areas
Observation of the active nature of the at least 10-year-old population in work activities reveals that, there is no significant difference in urban and rural population with respect to those who do not visit cultural institutions. Of those who have visited a cultural institution for at least once, particularly urban people spend longer time on work activities. (Figure 5)
When comparing urban and rural population in terms of the average working hours of people who have not visited any cultural institution within the last 12 months, there is a similar, almost unnoticeable difference in favour of rural population. In case of those who have visited some cultural institutions, there is also a certain difference between urban and rural population. Urban people, however, exceed rural people in terms of the average number of working hours. One may assume that there is a different pace in the city and in the country, arising from population concentration. Apparently, more frequent work-related contacts with colleagues and e.g. holding meetings also have the effect of extending the average working time. Works performed in the city and in the country often have dissimilar nature and, we may assume that physical work is more characteristic of rural environment and mental work is more common in the city, although these days you do not have to live in the city to do mental work. Constantly improving Internet connection even in the most distant rural areas should enable computer-mediated work virtually anywhere in the country. Yet, there is one significant difference between urban and rural population in terms of cultural institutions, as the access to cultural institutions is limited in the country due to a sparse location of them and poorer means of transportation. Better access to cultural services is most likely one of the factors that causes difference between the average
KULTUURIASUTUSTES KÄIMINE VISITING OF CULTURAL INSTITUTIONS
MEHE KODU ON MAAILM, NAISE MAAILM ON KODU? MAN’S HOME IS THE WORLD, WOMAN’S WORLD IS HER HOME? 97
working time in the country and in the city. Assuming that a better access to culture also means more frequent consumption of culture and, that there is a connection between consumption of culture and average working time, we may presume that a better access to cultural events is also one of the reasons why urban population has a bigger number of working hours than rural population. Although the difference between the number of working hours of rural and urban population is not that large – on average 22 minutes for men and 13 minutes for women – it is still there. A better access to cultural services affects also the decisions about choosing the place of residence in case of culturally active people, as they often choose more attractive locations subconsciously. Here the attraction does not necessarily mean e.g. a sea view, but whether the institutions required for daily life (such as a store and school) are in a reasonable vicinity of the place of residence. Although the vicinity of cultural and entertainment institutions is probably not always the first priority for all persons when choosing the residence, the vicinity or easy access to such institutions is undoubtedly considered more attractive than the non-existence of these facilities.
Impact of education on working time
The impact of education on the average time spent on work activities is in correlation with a person’s educational level i.e. the higher the educational level, the more time the person dedicates to working in a day. Visiting of cultural institutions amplifies this difference in terms of educatioanl level even more. (Figure 6)
Comparison of the average number of working hours by educational level confirms that people with upper secondary education (general secondary education, vocational education and professional secondary education based on basic education) and tertiary education (professional secondary education based on secondary education and higher education) are much more productive workers. One reason for that lies in the professional skills usually gained after the acquisition of general basic education. However, it is also true that not all people work in their specialty; lots of them have acquired one specialty, but work in another field, by studying after work and taking various refresher courses. But based on these statistics we can say that time and money invested in education pay off because the average number of working hours increases in proportion with the growing level of education. Men with below upper secondary education work on average for one hour per day. Men with below upper secondary education represent an interesting group because unlike others (persons visiting cultural institutions dedicate more time in a day to work activities), visiting cultural institutions has reduced their average working time by approximately eight minutes. Is it possible that visiting cultural institutions has an inhibiting effect on working time in case of men with lower level of education? Indeed, higher level of education brings about cultural awareness and an increasing interest in culture, but can culture attendance really reduce the average number of working hours? In this case, the reason seems to be that males (as well as females) with lower level of education are rather schoolchildren who mostly do not work.
In case of people with secondary or higher level of education, the difference between the working hours of the people visiting or not visiting cultural institutions is 48–65%, i.e. in their case, persons consuming culture have 50% more working hours. Women with upper secondary education, who do not visit cultural institutions, work on average for 1 hour and 48 minutes, but those who visit a cultural institution at least once a year, work on average for 3 hours and 36 minutes. Hence, the difference is approximately 70 minutes (1 hour and 10 minutes) per day. In case of women with higher level of education, the difference between the average number of working hours of women visiting and those not visiting cultural institutions is as much as 79 minutes.
The average working time for men with secondary level of education who do not visit cultural institutions is approximately 2.5 hours, whereas those who visit cultural institutions work on average for 3 hours and 50 minutes, which means that they work daily on average 74 minutes more (1 hour and 14 minutes). In case of men with tertiary education this difference is on average as much as 102 minutes (1 hour and 42 minutes) per day. Therefore, there is also a significant
KULTUURIASUTUSTES KÄIMINE VISITING OF CULTURAL INSTITUTIONS
MEHE KODU ON MAAILM, NAISE MAAILM ON KODU? MAN’S HOME IS THE WORLD, WOMAN’S WORLD IS HER HOME? 98
difference in the daily working time of people with secondary and those with higher level of education, which further depends on whether people occasionally attend culture institutions or not.
Observation of the time dedicated to work activities by labour status reveals that there is no sense in comparing the time spent on work activities by employed and unemployed persons, because the first mentioned group has got a job and the latter one has not. Nevertheless, here too, there are factors which should be set out. (Figure 7)
As expected, the average number of working hours of the employed is bigger than that of the unemployed. As in this case work and work-related activities also include looking for a job, this indicator apparently indicates the time spent on looking for a job in case of the unemployed. When analysing the time use of the unemployed it occurs that here, too, people who visit cultural institutions for at least once a year are in a more advantageous position. Supposedly, more time spent on looking for a job also means greater probability of finding a job. In case of unemployed men, a person visiting cultural institutions is three times more likely to be searching for a job. Unemployed women attending cultural events also spend on average about half an hour a day on searching for a job. In case of people who are not interested in cultural events, the amount of time spent on looking for a job is insignificant. (Figure 8)
In case of employed persons, too, there occurs a small difference in the time dedicated to work activities, if we compare those who visit cultural institutions and those who do not. People who go in for cultural activities spend on average a bit more time in a day on work activities.
Enjoyment of cultural benefits is more commonly associated with higher than lower income (Pappas 2011). Furthermore, in addition to health and happiness, enjoying cultural events may also effect the socio-economic situation. The vertical scale in Figure 8 refers to the difference in the number of working hours of the visitors of cultural institutions and of the people who do not visit cultural institutions. When analysing the working time of people on the basis of income deciles, there is a general tendency that people belonging to lower income deciles have on average fewer hours spent on work activities per day than people belonging to higher deciles. A small difference is found in the 5th income decile for both sexes, which actually indicates a smaller number of working hours than the deciles higher and lower of that indicator. With a few exceptions, the difference between people visiting cultural institutions and those not visiting cultural institutions also holds. Figure 8 depicts the difference of the average number of working hours spent daily on work activities in terms of people who visit and those who do not visit cultural institutions. The reading ‘0’ would mean that there is no difference in the number of working hours between people who visit cultural institutions and those who do not do it. A positive indicator shows the average number of working hours that a person visiting cultural institutions works more compared to a person not visiting cultural institutions. A negative indicator shows how many hours less, respectively. Although the difference in the number of working hours sometimes indicates fluctuations and in some cases a negative indicator shows that the people not visiting cultural institutions have on average a little more working time, the main outcome confirms the statement that people who visit cultural institutions have longer average working time per day than those who do not visit cultural institutions. The most drastic differences are found in income deciles of some women. Based on these statistics, one measure to reduce the wage gap between men and women could be to reduce the proportion of those women who do not visit cultural institutions or attend cultural events at all, in other words – people should be directed to attend a cultural event at least once or twice a year.
Impact of cohabitation on the number of persons’ working hours
A person’s daily time-specific division between primary activities is influenced also by the fact whether he/she is single or lives together with a partner. (Figure 9)
Viewing the working hours of people based on the form of cohabitation reveals that cohabiting people have much more working time than single persons. Such difference is more than an hour for women and more than an hour and a half for men. Comparison of the number of average
KULTUURIASUTUSTES KÄIMINE VISITING OF CULTURAL INSTITUTIONS
MEHE KODU ON MAAILM, NAISE MAAILM ON KODU? MAN’S HOME IS THE WORLD, WOMAN’S WORLD IS HER HOME? 99
working hours of couples and single persons based on their habits of visiting cultural institutions again reveals a huge difference in favour of those who visit cultural institutions. Such a difference is the smallest in case of single men (36 minutes per day) and the biggest in case of men in cohabitation (approximately 1 hour and 43 minutes per day). The difference is present but more modest in case of women, being about one hour for single women and an hour and a half per day for women living together with a partner. The reason for a generally higher level of activeness in case of persons living together with a partner probably lies in the fact that cohabiting people have more obligations towards each other and children than single people, which means that they make more efforts to plan their spare time. On the other hand, cohabitation also means greater mutual motivation, which is not necessarily experienced on a daily basis by single people. However, visiting cultural institutions offers couples living together an opportunity to have a good time together, reviving the cohabitation and contributing to the capacity for work in this way.
Summary
No matter how you compare the people who visit cultural institutions and those who do not, it is clearly noticeable that, as a rule, people who visited either cinema, theatre, concert, museum, cultural monument or attended any other cultural event at least once within the 12 months preceding the survey, tend to work more, i.e. their average number of working hours exceeds those of the people who do not consume culture. In spite of the need to consider statistical error to a certain extent, visiting cultural institutions still refers to a correlation with people’s activeness in work activities. We may only assume the type of direct impact of visiting cultural institutions on personal capacity for work. Perhaps active employees are the ones who love to entertain and broaden their minds from time to time. However, this impact is probably reciprocal, as attending cultural events helps people focus on something else and thus gives an opportunity to leave the routine for a short period and then have a new, refreshed approach to their daily duties. Apparently, people who work intensively need to detach themselves from their work at some point to resume working with the same level of intensity later on. Visiting of cultural institutions is an investment in cultural capital (Khawaja and Mowafi 2006), the positive effect of which is rather diverse. There is a direct connection between visiting cultural institutions and the amount of work performed. This, however, gives to the employers an opportunity to ask – in the course of recruitment – when they last attended a cultural event. Yet, based on such statistics we may also state that employers who want to increase the productivity of their staff should perhaps send their employees to the theatre or concert for a couple of times a year or arrange a tour for them to see some cultural monuments. Related expenses will surely be covered by the amount of work people produce after such a cultural experience.
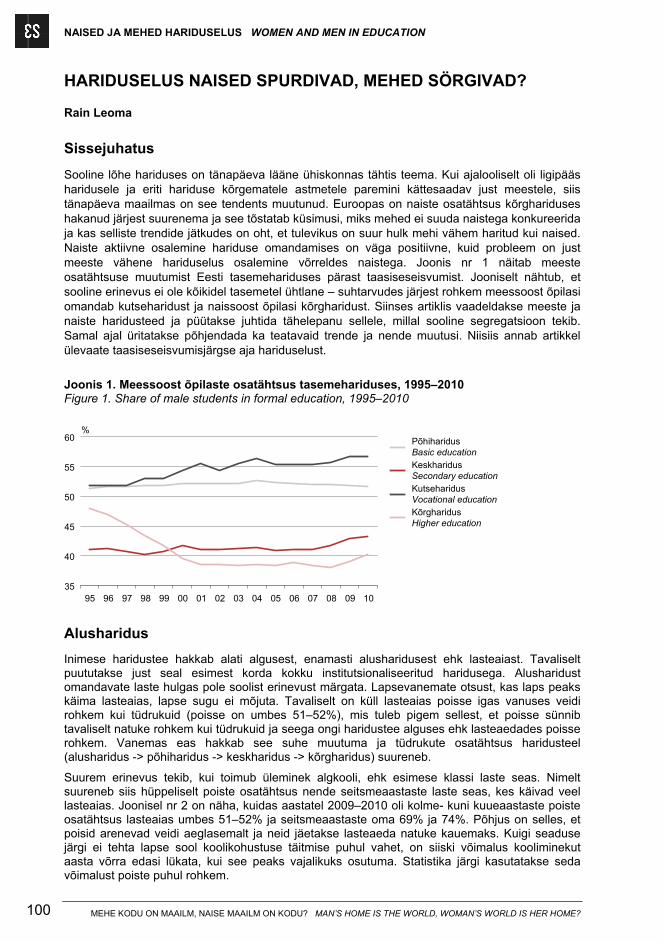
NAISED JA MEHED HARIDUSELUS WOMEN AND MEN IN EDUCATION
MEHE KODU ON MAAILM, NAISE MAAILM ON KODU? MAN’S HOME IS THE WORLD, WOMAN’S WORLD IS HER HOME? 100
HARIDUSELUS NAISED SPURDIVAD, MEHED SÖRGIVAD?
Rain Leoma
Sissejuhatus
Sooline lõhe hariduses on tänapäeva lääne ühiskonnas tähtis teema. Kui ajalooliselt oli ligipääs haridusele ja eriti hariduse kõrgematele astmetele paremini kättesaadav just meestele, siis tänapäeva maailmas on see tendents muutunud. Euroopas on naiste osatähtsus kõrghariduses hakanud järjest suurenema ja see tõstatab küsimusi, miks mehed ei suuda naistega konkureerida ja kas selliste trendide jätkudes on oht, et tulevikus on suur hulk mehi vähem haritud kui naised. Naiste aktiivne osalemine hariduse omandamises on väga positiivne, kuid probleem on just meeste vähene hariduselus osalemine võrreldes naistega. Joonis nr 1 näitab meeste osatähtsuse muutumist Eesti tasemehariduses pärast taasiseseisvumist. Jooniselt nähtub, et sooline erinevus ei ole kõikidel tasemetel ühtlane – suhtarvudes järjest rohkem meessoost õpilasi omandab kutseharidust ja naissoost õpilasi kõrgharidust. Siinses artiklis vaadeldakse meeste ja naiste haridusteed ja püütakse juhtida tähelepanu sellele, millal sooline segregatsioon tekib. Samal ajal üritatakse põhjendada ka teatavaid trende ja nende muutusi. Niisiis annab artikkel ülevaate taasiseseisvumisjärgse aja hariduselust.
Joonis 1. Meessoost õpilaste osatähtsus tasemehariduses, 1995–2010 Figure 1. Share of male students in formal education, 1995–2010
%
95 96 97 98 99 00 01 02 03 04 05 06 07 08 09 1035
40
45
50
55
60 PõhiharidusBasic educationKeskharidusSecondary educationKutseharidusVocational educationKõrgharidusHigher education
Alusharidus
Inimese haridustee hakkab alati algusest, enamasti alusharidusest ehk lasteaiast. Tavaliselt puututakse just seal esimest korda kokku institutsionaliseeritud haridusega. Alusharidust omandavate laste hulgas pole soolist erinevust märgata. Lapsevanemate otsust, kas laps peaks käima lasteaias, lapse sugu ei mõjuta. Tavaliselt on küll lasteaias poisse igas vanuses veidi rohkem kui tüdrukuid (poisse on umbes 51–52%), mis tuleb pigem sellest, et poisse sünnib tavaliselt natuke rohkem kui tüdrukuid ja seega ongi haridustee alguses ehk lasteaedades poisse rohkem. Vanemas eas hakkab see suhe muutuma ja tüdrukute osatähtsus haridusteel (alusharidus -> põhiharidus -> keskharidus -> kõrgharidus) suureneb.
Suurem erinevus tekib, kui toimub üleminek algkooli, ehk esimese klassi laste seas. Nimelt suureneb siis hüppeliselt poiste osatähtsus nende seitsmeaastaste laste seas, kes käivad veel lasteaias. Joonisel nr 2 on näha, kuidas aastatel 2009–2010 oli kolme- kuni kuueaastaste poiste osatähtsus lasteaias umbes 51–52% ja seitsmeaastaste oma 69% ja 74%. Põhjus on selles, et poisid arenevad veidi aeglasemalt ja neid jäetakse lasteaeda natuke kauemaks. Kuigi seaduse järgi ei tehta lapse sool koolikohustuse täitmise puhul vahet, on siiski võimalus kooliminekut aasta võrra edasi lükata, kui see peaks vajalikuks osutuma. Statistika järgi kasutatakse seda võimalust poiste puhul rohkem.
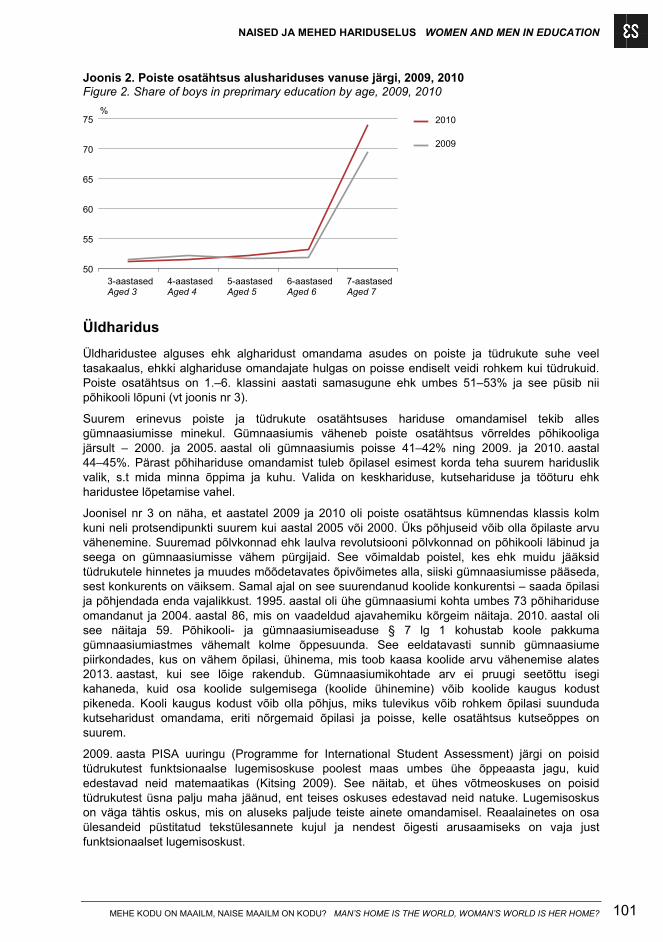
NAISED JA MEHED HARIDUSELUS WOMEN AND MEN IN EDUCATION
MEHE KODU ON MAAILM, NAISE MAAILM ON KODU? MAN’S HOME IS THE WORLD, WOMAN’S WORLD IS HER HOME? 101
Joonis 2. Poiste osatähtsus alushariduses vanuse järgi, 2009, 2010 Figure 2. Share of boys in preprimary education by age, 2009, 2010
%
3-aastasedAged 3
4-aastasedAged 4
5-aastasedAged 5
6-aastasedAged 6
7-aastasedAged 7
50
55
60
65
70
75 2010
2009
Üldharidus
Üldharidustee alguses ehk algharidust omandama asudes on poiste ja tüdrukute suhe veel tasakaalus, ehkki alghariduse omandajate hulgas on poisse endiselt veidi rohkem kui tüdrukuid. Poiste osatähtsus on 1.–6. klassini aastati samasugune ehk umbes 51–53% ja see püsib nii põhikooli lõpuni (vt joonis nr 3).
Suurem erinevus poiste ja tüdrukute osatähtsuses hariduse omandamisel tekib alles gümnaasiumisse minekul. Gümnaasiumis väheneb poiste osatähtsus võrreldes põhikooliga järsult – 2000. ja 2005. aastal oli gümnaasiumis poisse 41–42% ning 2009. ja 2010. aastal 44–45%. Pärast põhihariduse omandamist tuleb õpilasel esimest korda teha suurem hariduslik valik, s.t mida minna õppima ja kuhu. Valida on keskhariduse, kutsehariduse ja tööturu ehk haridustee lõpetamise vahel.
Joonisel nr 3 on näha, et aastatel 2009 ja 2010 oli poiste osatähtsus kümnendas klassis kolm kuni neli protsendipunkti suurem kui aastal 2005 või 2000. Üks põhjuseid võib olla õpilaste arvu vähenemine. Suuremad põlvkonnad ehk laulva revolutsiooni põlvkonnad on põhikooli läbinud ja seega on gümnaasiumisse vähem pürgijaid. See võimaldab poistel, kes ehk muidu jääksid tüdrukutele hinnetes ja muudes mõõdetavates õpivõimetes alla, siiski gümnaasiumisse pääseda, sest konkurents on väiksem. Samal ajal on see suurendanud koolide konkurentsi – saada õpilasi ja põhjendada enda vajalikkust. 1995. aastal oli ühe gümnaasiumi kohta umbes 73 põhihariduse omandanut ja 2004. aastal 86, mis on vaadeldud ajavahemiku kõrgeim näitaja. 2010. aastal oli see näitaja 59. Põhikooli- ja gümnaasiumiseaduse § 7 lg 1 kohustab koole pakkuma gümnaasiumiastmes vähemalt kolme õppesuunda. See eeldatavasti sunnib gümnaasiume piirkondades, kus on vähem õpilasi, ühinema, mis toob kaasa koolide arvu vähenemise alates 2013. aastast, kui see lõige rakendub. Gümnaasiumikohtade arv ei pruugi seetõttu isegi kahaneda, kuid osa koolide sulgemisega (koolide ühinemine) võib koolide kaugus kodust pikeneda. Kooli kaugus kodust võib olla põhjus, miks tulevikus võib rohkem õpilasi suunduda kutseharidust omandama, eriti nõrgemaid õpilasi ja poisse, kelle osatähtsus kutseõppes on suurem.
2009. aasta PISA uuringu (Programme for International Student Assessment) järgi on poisid tüdrukutest funktsionaalse lugemisoskuse poolest maas umbes ühe õppeaasta jagu, kuid edestavad neid matemaatikas (Kitsing 2009). See näitab, et ühes võtmeoskuses on poisid tüdrukutest üsna palju maha jäänud, ent teises oskuses edestavad neid natuke. Lugemisoskus on väga tähtis oskus, mis on aluseks paljude teiste ainete omandamisel. Reaalainetes on osa ülesandeid püstitatud tekstülesannete kujul ja nendest õigesti arusaamiseks on vaja just funktsionaalset lugemisoskust.
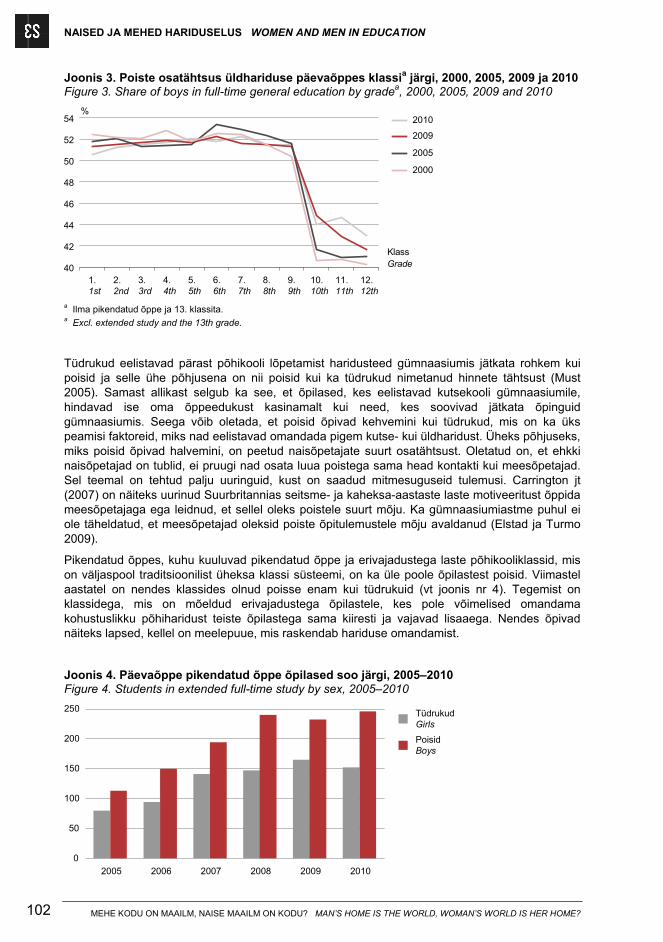
NAISED JA MEHED HARIDUSELUS WOMEN AND MEN IN EDUCATION
MEHE KODU ON MAAILM, NAISE MAAILM ON KODU? MAN’S HOME IS THE WORLD, WOMAN’S WORLD IS HER HOME? 102
Joonis 3. Poiste osatähtsus üldhariduse päevaõppes klassia järgi, 2000, 2005, 2009 ja 2010 Figure 3. Share of boys in full-time general education by gradea, 2000, 2005, 2009 and 2010
%
1.1st
2.2nd
3.3rd
4.4th
5.5th
6.6th
7.7th
8.8th
9.9th
10.10th
11.11th
12.12th
40
42
44
46
48
50
52
54 2010
2009
2005
2000
KlassGrade
a Ilma pikendatud õppe ja 13. klassita. a Excl. extended study and the 13th grade.
Tüdrukud eelistavad pärast põhikooli lõpetamist haridusteed gümnaasiumis jätkata rohkem kui poisid ja selle ühe põhjusena on nii poisid kui ka tüdrukud nimetanud hinnete tähtsust (Must 2005). Samast allikast selgub ka see, et õpilased, kes eelistavad kutsekooli gümnaasiumile, hindavad ise oma õppeedukust kasinamalt kui need, kes soovivad jätkata õpinguid gümnaasiumis. Seega võib oletada, et poisid õpivad kehvemini kui tüdrukud, mis on ka üks peamisi faktoreid, miks nad eelistavad omandada pigem kutse- kui üldharidust. Üheks põhjuseks, miks poisid õpivad halvemini, on peetud naisõpetajate suurt osatähtsust. Oletatud on, et ehkki naisõpetajad on tublid, ei pruugi nad osata luua poistega sama head kontakti kui meesõpetajad. Sel teemal on tehtud palju uuringuid, kust on saadud mitmesuguseid tulemusi. Carrington jt (2007) on näiteks uurinud Suurbritannias seitsme- ja kaheksa-aastaste laste motiveeritust õppida meesõpetajaga ega leidnud, et sellel oleks poistele suurt mõju. Ka gümnaasiumiastme puhul ei ole täheldatud, et meesõpetajad oleksid poiste õpitulemustele mõju avaldanud (Elstad ja Turmo 2009).
Pikendatud õppes, kuhu kuuluvad pikendatud õppe ja erivajadustega laste põhikooliklassid, mis on väljaspool traditsioonilist üheksa klassi süsteemi, on ka üle poole õpilastest poisid. Viimastel aastatel on nendes klassides olnud poisse enam kui tüdrukuid (vt joonis nr 4). Tegemist on klassidega, mis on mõeldud erivajadustega õpilastele, kes pole võimelised omandama kohustuslikku põhiharidust teiste õpilastega sama kiiresti ja vajavad lisaaega. Nendes õpivad näiteks lapsed, kellel on meelepuue, mis raskendab hariduse omandamist.
Joonis 4. Päevaõppe pikendatud õppe õpilased soo järgi, 2005–2010 Figure 4. Students in extended full-time study by sex, 2005–2010
2005 2006 2007 2008 2009 2010
0
50
100
150
200
250 TüdrukudGirls
PoisidBoys
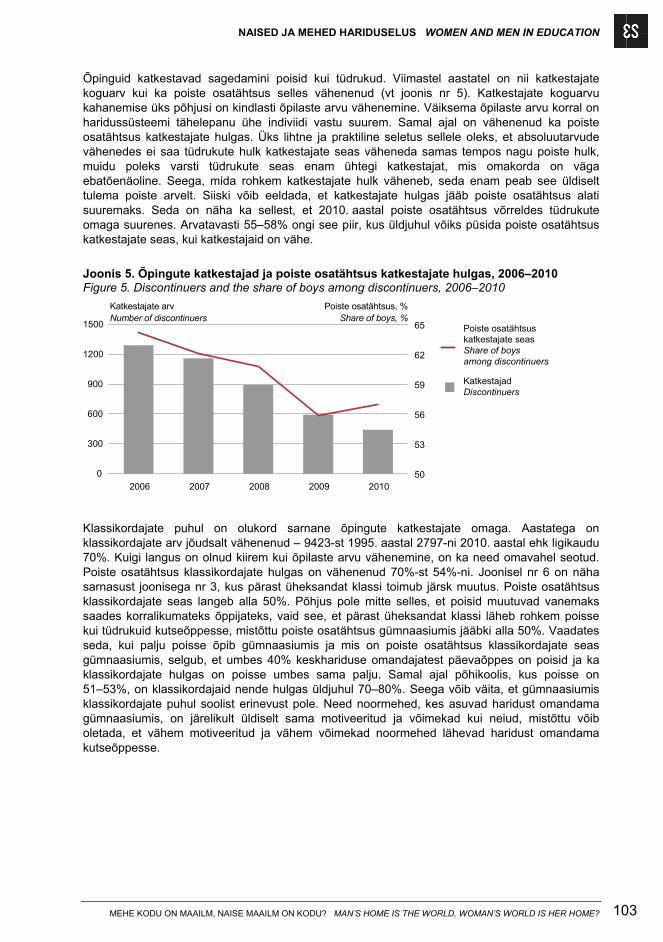
NAISED JA MEHED HARIDUSELUS WOMEN AND MEN IN EDUCATION
MEHE KODU ON MAAILM, NAISE MAAILM ON KODU? MAN’S HOME IS THE WORLD, WOMAN’S WORLD IS HER HOME? 103
Õpinguid katkestavad sagedamini poisid kui tüdrukud. Viimastel aastatel on nii katkestajate koguarv kui ka poiste osatähtsus selles vähenenud (vt joonis nr 5). Katkestajate koguarvu kahanemise üks põhjusi on kindlasti õpilaste arvu vähenemine. Väiksema õpilaste arvu korral on haridussüsteemi tähelepanu ühe indiviidi vastu suurem. Samal ajal on vähenenud ka poiste osatähtsus katkestajate hulgas. Üks lihtne ja praktiline seletus sellele oleks, et absoluutarvude vähenedes ei saa tüdrukute hulk katkestajate seas väheneda samas tempos nagu poiste hulk, muidu poleks varsti tüdrukute seas enam ühtegi katkestajat, mis omakorda on väga ebatõenäoline. Seega, mida rohkem katkestajate hulk väheneb, seda enam peab see üldiselt tulema poiste arvelt. Siiski võib eeldada, et katkestajate hulgas jääb poiste osatähtsus alati suuremaks. Seda on näha ka sellest, et 2010. aastal poiste osatähtsus võrreldes tüdrukute omaga suurenes. Arvatavasti 55–58% ongi see piir, kus üldjuhul võiks püsida poiste osatähtsus katkestajate seas, kui katkestajaid on vähe.
Joonis 5. Õpingute katkestajad ja poiste osatähtsus katkestajate hulgas, 2006–2010 Figure 5. Discontinuers and the share of boys among discontinuers, 2006–2010
2006 2007 2008 2009 2010
0
300
600
900
1200
1500
50
53
56
59
62
65
KatkestajadDiscontinuers
Poiste osatähtsuskatkestajate seasShare of boysamong discontinuers
Katkestajate arvNumber of discontinuers
Poiste osatähtsus, %Share of boys, %
Klassikordajate puhul on olukord sarnane õpingute katkestajate omaga. Aastatega on klassikordajate arv jõudsalt vähenenud – 9423-st 1995. aastal 2797-ni 2010. aastal ehk ligikaudu 70%. Kuigi langus on olnud kiirem kui õpilaste arvu vähenemine, on ka need omavahel seotud. Poiste osatähtsus klassikordajate hulgas on vähenenud 70%-st 54%-ni. Joonisel nr 6 on näha sarnasust joonisega nr 3, kus pärast üheksandat klassi toimub järsk muutus. Poiste osatähtsus klassikordajate seas langeb alla 50%. Põhjus pole mitte selles, et poisid muutuvad vanemaks saades korralikumateks õppijateks, vaid see, et pärast üheksandat klassi läheb rohkem poisse kui tüdrukuid kutseõppesse, mistõttu poiste osatähtsus gümnaasiumis jääbki alla 50%. Vaadates seda, kui palju poisse õpib gümnaasiumis ja mis on poiste osatähtsus klassikordajate seas gümnaasiumis, selgub, et umbes 40% keskhariduse omandajatest päevaõppes on poisid ja ka klassikordajate hulgas on poisse umbes sama palju. Samal ajal põhikoolis, kus poisse on 51–53%, on klassikordajaid nende hulgas üldjuhul 70–80%. Seega võib väita, et gümnaasiumis klassikordajate puhul soolist erinevust pole. Need noormehed, kes asuvad haridust omandama gümnaasiumis, on järelikult üldiselt sama motiveeritud ja võimekad kui neiud, mistõttu võib oletada, et vähem motiveeritud ja vähem võimekad noormehed lähevad haridust omandama kutseõppesse.
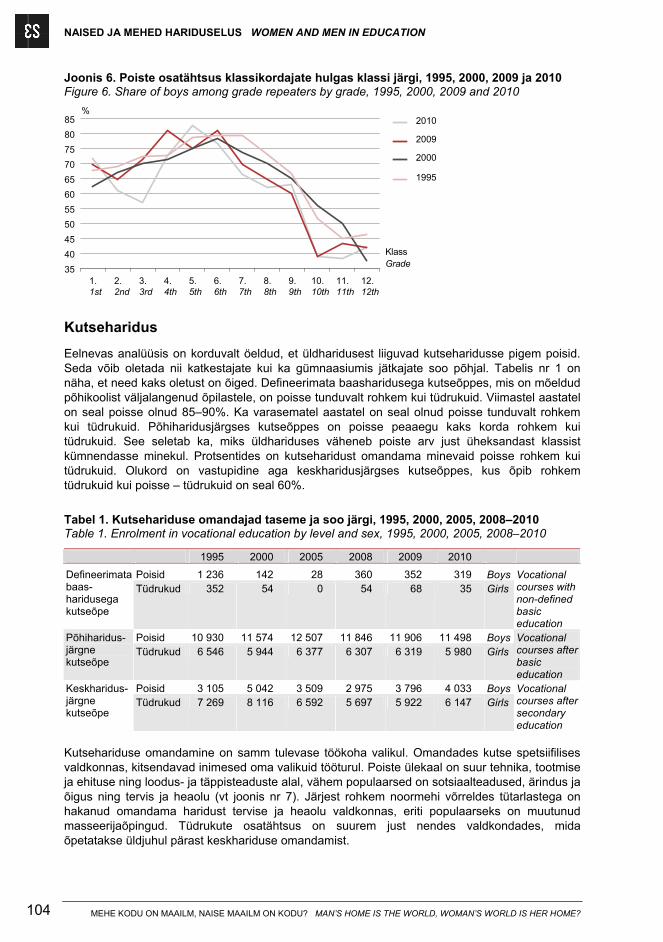
NAISED JA MEHED HARIDUSELUS WOMEN AND MEN IN EDUCATION
MEHE KODU ON MAAILM, NAISE MAAILM ON KODU? MAN’S HOME IS THE WORLD, WOMAN’S WORLD IS HER HOME? 104
Joonis 6. Poiste osatähtsus klassikordajate hulgas klassi järgi, 1995, 2000, 2009 ja 2010 Figure 6. Share of boys among grade repeaters by grade, 1995, 2000, 2009 and 2010
%
35
40
45
50
55
60
65
70
75
80
85 2010
2009
2000
1995
KlassGrade
1.1st
2.2nd
3.3rd
4.4th
5.5th
6.6th
7.7th
8.8th
9.9th
10.10th
11.11th
12.12th
Kutseharidus
Eelnevas analüüsis on korduvalt öeldud, et üldharidusest liiguvad kutseharidusse pigem poisid. Seda võib oletada nii katkestajate kui ka gümnaasiumis jätkajate soo põhjal. Tabelis nr 1 on näha, et need kaks oletust on õiged. Defineerimata baasharidusega kutseõppes, mis on mõeldud põhikoolist väljalangenud õpilastele, on poisse tunduvalt rohkem kui tüdrukuid. Viimastel aastatel on seal poisse olnud 85–90%. Ka varasematel aastatel on seal olnud poisse tunduvalt rohkem kui tüdrukuid. Põhiharidusjärgses kutseõppes on poisse peaaegu kaks korda rohkem kui tüdrukuid. See seletab ka, miks üldhariduses väheneb poiste arv just üheksandast klassist kümnendasse minekul. Protsentides on kutseharidust omandama minevaid poisse rohkem kui tüdrukuid. Olukord on vastupidine aga keskharidusjärgses kutseõppes, kus õpib rohkem tüdrukuid kui poisse – tüdrukuid on seal 60%.
Tabel 1. Kutsehariduse omandajad taseme ja soo järgi, 1995, 2000, 2005, 2008–2010 Table 1. Enrolment in vocational education by level and sex, 1995, 2000, 2005, 2008–2010
1995 2000 2005 2008 2009 2010
Poisid 1 236 142 28 360 352 319 Boys Defineerimata baas-haridusega kutseõpe
Tüdrukud 352 54 0 54 68 35 Girls Vocational courses with non-defined basic education
Poisid 10 930 11 574 12 507 11 846 11 906 11 498 Boys Põhiharidus-järgne kutseõpe
Tüdrukud 6 546 5 944 6 377 6 307 6 319 5 980 Girls Vocational courses after basic education
Poisid 3 105 5 042 3 509 2 975 3 796 4 033 Boys Keskharidus-järgne kutseõpe
Tüdrukud 7 269 8 116 6 592 5 697 5 922 6 147 Girls Vocational courses after secondary education
Kutsehariduse omandamine on samm tulevase töökoha valikul. Omandades kutse spetsiifilises valdkonnas, kitsendavad inimesed oma valikuid tööturul. Poiste ülekaal on suur tehnika, tootmise ja ehituse ning loodus- ja täppisteaduste alal, vähem populaarsed on sotsiaalteadused, ärindus ja õigus ning tervis ja heaolu (vt joonis nr 7). Järjest rohkem noormehi võrreldes tütarlastega on hakanud omandama haridust tervise ja heaolu valdkonnas, eriti populaarseks on muutunud masseerijaõpingud. Tüdrukute osatähtsus on suurem just nendes valdkondades, mida õpetatakse üldjuhul pärast keskhariduse omandamist.
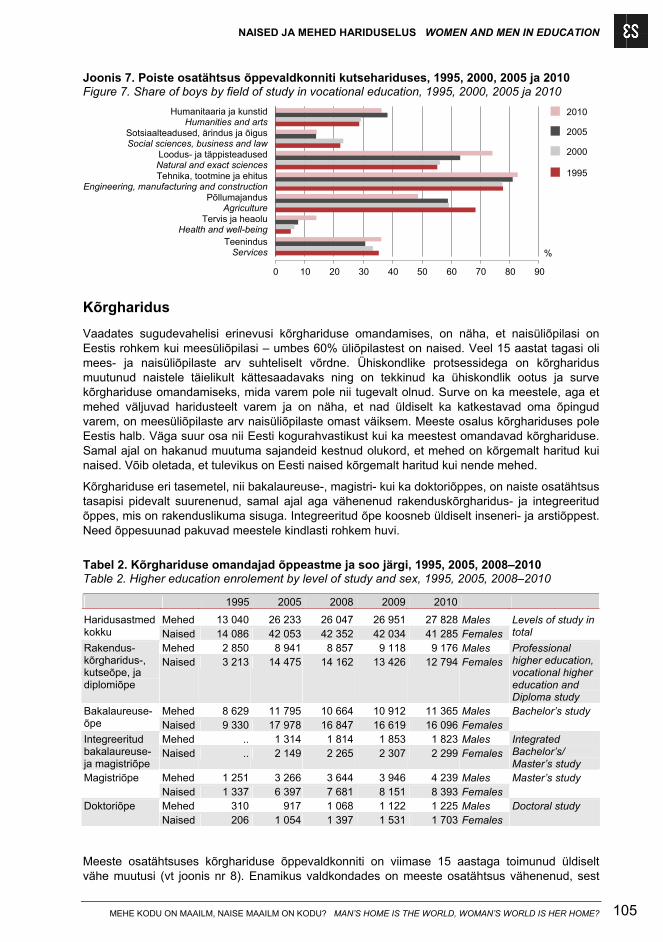
NAISED JA MEHED HARIDUSELUS WOMEN AND MEN IN EDUCATION
MEHE KODU ON MAAILM, NAISE MAAILM ON KODU? MAN’S HOME IS THE WORLD, WOMAN’S WORLD IS HER HOME? 105
Joonis 7. Poiste osatähtsus õppevaldkonniti kutsehariduses, 1995, 2000, 2005 ja 2010 Figure 7. Share of boys by field of study in vocational education, 1995, 2000, 2005 ja 2010
TeenindusServices
Tervis ja heaoluHealth and well-being
PõllumajandusAgriculture
Tehnika, tootmine ja ehitusEngineering, manufacturing and construction
Loodus- ja täppisteadusedNatural and exact sciences
Sotsiaalteadused, ärindus ja õigusSocial sciences, business and law
Humanitaaria ja kunstidHumanities and arts
0 10 20 30 40 50 60 70 80 90
2010
2005
2000
1995
%
Kõrgharidus
Vaadates sugudevahelisi erinevusi kõrghariduse omandamises, on näha, et naisüliõpilasi on Eestis rohkem kui meesüliõpilasi – umbes 60% üliõpilastest on naised. Veel 15 aastat tagasi oli mees- ja naisüliõpilaste arv suhteliselt võrdne. Ühiskondlike protsessidega on kõrgharidus muutunud naistele täielikult kättesaadavaks ning on tekkinud ka ühiskondlik ootus ja surve kõrghariduse omandamiseks, mida varem pole nii tugevalt olnud. Surve on ka meestele, aga et mehed väljuvad haridusteelt varem ja on näha, et nad üldiselt ka katkestavad oma õpingud varem, on meesüliõpilaste arv naisüliõpilaste omast väiksem. Meeste osalus kõrghariduses pole Eestis halb. Väga suur osa nii Eesti kogurahvastikust kui ka meestest omandavad kõrghariduse. Samal ajal on hakanud muutuma sajandeid kestnud olukord, et mehed on kõrgemalt haritud kui naised. Võib oletada, et tulevikus on Eesti naised kõrgemalt haritud kui nende mehed.
Kõrghariduse eri tasemetel, nii bakalaureuse-, magistri- kui ka doktoriõppes, on naiste osatähtsus tasapisi pidevalt suurenenud, samal ajal aga vähenenud rakenduskõrgharidus- ja integreeritud õppes, mis on rakenduslikuma sisuga. Integreeritud õpe koosneb üldiselt inseneri- ja arstiõppest. Need õppesuunad pakuvad meestele kindlasti rohkem huvi.
Tabel 2. Kõrghariduse omandajad õppeastme ja soo järgi, 1995, 2005, 2008–2010 Table 2. Higher education enrolement by level of study and sex, 1995, 2005, 2008–2010
1995 2005 2008 2009 2010
Mehed 13 040 26 233 26 047 26 951 27 828 Males Haridusastmed kokku Naised 14 086 42 053 42 352 42 034 41 285 Females
Levels of study in total
Mehed 2 850 8 941 8 857 9 118 9 176 Males Rakendus-kõrgharidus-, kutseõpe, ja diplomiõpe
Naised 3 213 14 475 14 162 13 426 12 794 Females Professional higher education, vocational higher education and Diploma study
Mehed 8 629 11 795 10 664 10 912 11 365 Males Bakalaureuse-õpe Naised 9 330 17 978 16 847 16 619 16 096 Females
Bachelor’s study
Mehed .. 1 314 1 814 1 853 1 823 Males Integreeritud bakalaureuse- ja magistriõpe
Naised .. 2 149 2 265 2 307 2 299 Females Integrated Bachelor’s/ Master’s study
Mehed 1 251 3 266 3 644 3 946 4 239 Males Magistriõpe Naised 1 337 6 397 7 681 8 151 8 393 Females
Master’s study
Mehed 310 917 1 068 1 122 1 225 Males Doktoriõpe Naised 206 1 054 1 397 1 531 1 703 Females
Doctoral study
Meeste osatähtsuses kõrghariduse õppevaldkonniti on viimase 15 aastaga toimunud üldiselt vähe muutusi (vt joonis nr 8). Enamikus valdkondades on meeste osatähtsus vähenenud, sest
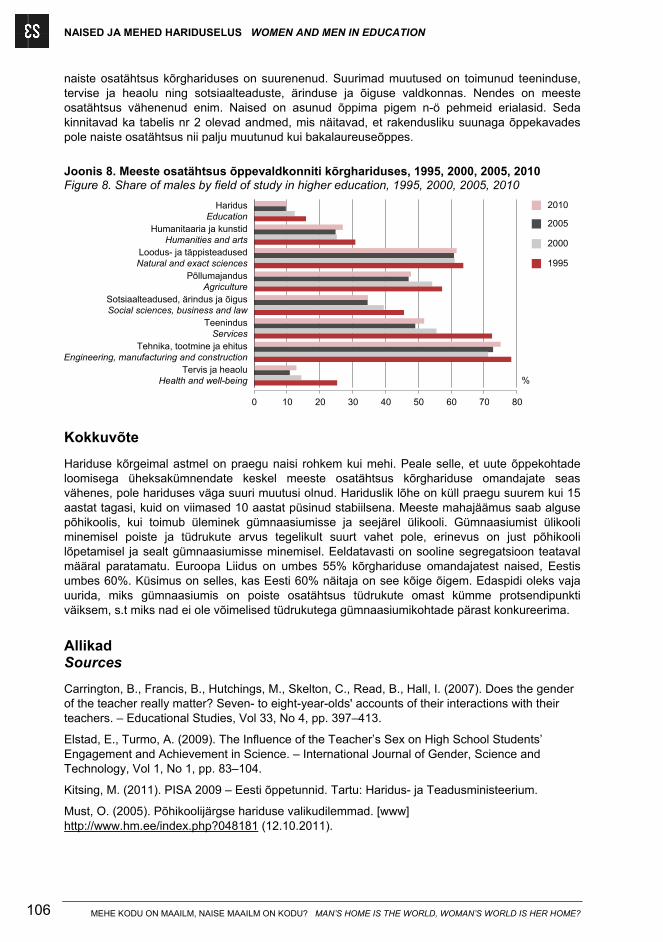
NAISED JA MEHED HARIDUSELUS WOMEN AND MEN IN EDUCATION
MEHE KODU ON MAAILM, NAISE MAAILM ON KODU? MAN’S HOME IS THE WORLD, WOMAN’S WORLD IS HER HOME? 106
naiste osatähtsus kõrghariduses on suurenenud. Suurimad muutused on toimunud teeninduse, tervise ja heaolu ning sotsiaalteaduste, ärinduse ja õiguse valdkonnas. Nendes on meeste osatähtsus vähenenud enim. Naised on asunud õppima pigem n-ö pehmeid erialasid. Seda kinnitavad ka tabelis nr 2 olevad andmed, mis näitavad, et rakendusliku suunaga õppekavades pole naiste osatähtsus nii palju muutunud kui bakalaureuseõppes.
Joonis 8. Meeste osatähtsus õppevaldkonniti kõrghariduses, 1995, 2000, 2005, 2010 Figure 8. Share of males by field of study in higher education, 1995, 2000, 2005, 2010
Tervis ja heaoluHealth and well-being
Tehnika, tootmine ja ehitusEngineering, manufacturing and construction
TeenindusServices
Sotsiaalteadused, ärindus ja õigusSocial sciences, business and law
PõllumajandusAgriculture
Loodus- ja täppisteadusedNatural and exact sciences
Humanitaaria ja kunstidHumanities and arts
HaridusEducation
0 10 20 30 40 50 60 70 80
2010
2005
2000
1995
%
Kokkuvõte
Hariduse kõrgeimal astmel on praegu naisi rohkem kui mehi. Peale selle, et uute õppekohtade loomisega üheksakümnendate keskel meeste osatähtsus kõrghariduse omandajate seas vähenes, pole hariduses väga suuri muutusi olnud. Hariduslik lõhe on küll praegu suurem kui 15 aastat tagasi, kuid on viimased 10 aastat püsinud stabiilsena. Meeste mahajäämus saab alguse põhikoolis, kui toimub üleminek gümnaasiumisse ja seejärel ülikooli. Gümnaasiumist ülikooli minemisel poiste ja tüdrukute arvus tegelikult suurt vahet pole, erinevus on just põhikooli lõpetamisel ja sealt gümnaasiumisse minemisel. Eeldatavasti on sooline segregatsioon teataval määral paratamatu. Euroopa Liidus on umbes 55% kõrghariduse omandajatest naised, Eestis umbes 60%. Küsimus on selles, kas Eesti 60% näitaja on see kõige õigem. Edaspidi oleks vaja uurida, miks gümnaasiumis on poiste osatähtsus tüdrukute omast kümme protsendipunkti väiksem, s.t miks nad ei ole võimelised tüdrukutega gümnaasiumikohtade pärast konkureerima.
Allikad Sources
Carrington, B., Francis, B., Hutchings, M., Skelton, C., Read, B., Hall, I. (2007). Does the gender of the teacher really matter? Seven- to eight-year-olds' accounts of their interactions with their teachers. – Educational Studies, Vol 33, No 4, pp. 397–413.
Elstad, E., Turmo, A. (2009). The Influence of the Teacher’s Sex on High School Students’ Engagement and Achievement in Science. – International Journal of Gender, Science and Technology, Vol 1, No 1, pp. 83–104.
Kitsing, M. (2011). PISA 2009 – Eesti õppetunnid. Tartu: Haridus- ja Teadusministeerium.
Must, O. (2005). Põhikoolijärgse hariduse valikudilemmad. [www] http://www.hm.ee/index.php?048181 (12.10.2011).
NAISED JA MEHED HARIDUSELUS WOMEN AND MEN IN EDUCATION
MEHE KODU ON MAAILM, NAISE MAAILM ON KODU? MAN’S HOME IS THE WORLD, WOMAN’S WORLD IS HER HOME? 107
IN EDUCATION, ARE WOMEN SPRINTERS AND MEN JOGGERS?
Rain Leoma
Introduction
Gender gap in education is an important topic in the contemporary western world. Historically, men had better access to education and it was even more so at higher levels of education. But in the modern world, this trend has changed. In Europe, the share of women in higher education is showing a constant increase and, hence, questions arise as to why men are not able to compete with women, and furthermore, whether the continuation of such trends will bring about a risk that in the future a large number of men will be less educated than women. It is extremely positive that women actively participate in educational life. But the problem lies in a modest participation of men in the attainment of education compared to that of women. Figure 1 displays a change in the share of men in formal education of Estonia after restoration of independence. Figure 1 reveals that the gender gap is not even at all of the levels – an increasingly bigger ratio of boys are acquiring vocational education and an increasingly bigger ratio of girls are acquiring higher education. In this article, we will look at men’s and women’s road to education and point out when there occurs a gender gap in the attainment of education. At the same time, we try to find reasons for certain trends and the relevant changes. Thus, the article gives an overview of educational life in the post re-independence period. (Figure 1)
Preprimary education
A road to education usually starts from preprimary education i.e. from the kindergarten. This is mostly the first point of contact with institutionalised education. No gender differences have been observed among children acquiring preprimary education. The child’s sex has no influence on the parents’ decision to take their child to a kindergarten for acquiring preprimary education. However, the number of boys in all age groups in the kindergarten is usually slightly larger than the number of girls (there are around 51–52% of boys), due to the fact that there are usually more boys born than girls, which means that there are more boys in kindergartens i.e. at the start of the path to education. This ratio starts to change at older ages and the percentage of girls on the path to education (preprimary education -> basic education -> secondary education -> higher education) increases.
A larger difference can be noticed at the moment of transition to primary school, i.e., among the first graders. The share of 7-year-old boys who remain in a kindergarten steeply increases at that point. Figure 2 shows, based on years 2009–2010, that the share of boys in the age group 3–6 in kindergartens is around 51–52%, but rises to 69% and 74%, respectively, in the age group of 7-year-olds. This is caused by the well-known fact that boys’ development is somewhat slower and they are kept in the kindergarten for a little longer. Even though the law does not differentiate between sexes in the context of compulsory school attendance, it enables to postpone the start of compulsory school attendance by one year, if considered necessary, and statistics indicate that this option is used more often in case of boys. (Figure 2)
General education
At the start of the general education path, i.e. when starting to acquire primary education, there is still a balance between boys and girls, although the number of boys in primary education remains slightly higher than the number of girls. The share of boys remains unchanged over years in grades 1–6, being at around 51–53%. This percentage persists until the end of basic school. (See Figure 3)
A greater difference between educational paths of boys and girls is noticeable at the transition to the gymnasium. In the gymnasium, the share of boys sharply drops compared to the basic school
NAISED JA MEHED HARIDUSELUS WOMEN AND MEN IN EDUCATION
MEHE KODU ON MAAILM, NAISE MAAILM ON KODU? MAN’S HOME IS THE WORLD, WOMAN’S WORLD IS HER HOME? 108
– in 2000 and 2005 there were 41–42% of boys in the gymnasium, and in 2009 and 2010 the respective indicator was 44–45%. Upon graduation from the basic school, students for the first time have to make a major educational choice about what and where to continue studies. The options include secondary education, vocational education, and labour market, i.e., termination of the education path.
Figure 3 indicates that the share of boys in the tenth grade was 3–4 percentage points higher in 2009 and 2010 than in 2005 or 2000. One of the reasons for this may lie in the decreasing number of students. Larger generations, i.e., the so-called ‘generations of the Singing Revolution’, have passed the basic school, which means that fewer students are striving to enter the gymnasium. This enables boys, who would otherwise lag behind girls in terms of grades and other measurable learning abilities, to have access to gymnasiums due to reduced competition. However, this has also forced schools to compete for students and to promote themselves. In 1995 there were approximately 73 persons with attained basic education per one gymnasium; in 2004 this figure was 86 being the highest indicator of the observed period. In 2010 the respective indicator was 59. Subsection 7 (1) of the Basic Schools and Upper Secondary Schools Act requires schools to provide at least three different study specialisations at the gymnasium level. This presumably forces mergers of gymnasiums in regions with fewer students, which leads to a reduced number of schools starting from 2013 when this subsection will apply. This does not even have to mean a decrease in the number of study places in gymnasiums, but the distance to school may become longer after shutdown or merger of some schools. A longer distance from home could be one of the reasons for students increasingly opting for vocational education in the future. This is particularly the case with weaker students and especially boys, who constitute a larger share of students in vocational education.
According to PISA 2009 (Programme for International Student Assessment), boys are by about one academic year behind girls in reading skills but ahead of them in maths (Kitsing 2009). This shows that in one key skill boys are quite a lot behind girls and a little ahead in another one. Reading skill is a very important skill being a fundamental skill in a lot of subjects. In sciences, a part of assignments are presented in the form of text assignment, therefore reading skills are necessary for correct understanding of them (Figure 3)
After graduating from the basic school, girls more than boys, prefer to continue their studies in the gymnasium. One of the reasons stated by both boys and girls is the importance of grades (Must 2005). Based on the same source, students who prefer a vocational school to the gymnasium rate their own educational performance as worse than the ones who intend to continue studies in the gymnasium. Thus, we can assume that boys are getting weaker grades than girls and that is one of the main factors why boys rather prefer to attain vocational than general education. One of the reasons why boys are getting weaker grades is considered to be a large proportion of female teachers. It has been assumed that although female teachers are good they might not be able to get as good a contact with boys as male teachers. A lot of different research studies have given varying outcomes. Carrington et al. (2007), for example, has studied how motivated the 7- and 8-year-old children in the United Kingdom are to study under the guidance of male teachers. They found that this had no big influence on boys. It was also found that, at the gymnasium level, male teachers had no influence on the educational performance of boys (Elstad and Turmo 2009).
Over a half of students are boys also in the extended study which embraces basic school classes for extended study and for children with special needs and is positioned outside the traditional 9-grade system. Figure 4 indicates that the share of boys in such classes has been higher than the share of girls in recent years. These are classes for students with special needs, who are unable to acquire mandatory basic education at the same pace as other students, and require additional time. This also includes sensory disabilities which complicate learning. (Figure 4)
Boys tend to discontinue their studies more frequently than girls. Figure 5 indicates that the total number of those, who have discontinued their studies, has decreased, as has the share of boys among them. The decreased number of students is certainly one of the reasons for the decrease in the total number of discontinuers. In addition, with fewer students, the educational system can
NAISED JA MEHED HARIDUSELUS WOMEN AND MEN IN EDUCATION
MEHE KODU ON MAAILM, NAISE MAAILM ON KODU? MAN’S HOME IS THE WORLD, WOMAN’S WORLD IS HER HOME? 109
pay greater attention to individuals. The share of boys among those, who have discontinued their studies, has also decreased. A simple explanation for that would be that the number of girls among discontinuers cannot decrease at the same rate as the number of boys if absolute figures fall. Otherwise, there would soon be no discontinuers among girls, which is highly unlikely. Consequently, any decrease in the number of discontinuers should generally mean that the decrease is bigger on account of boys. However, it can be assumed that the proportion of boys will remain higher than that of the girls among those who have discontinued their studies. This is also noticeable in the increased share of boys in comparison with the share of girls in 2010. It could be assumed that 55–58% is the expected share of boys among discontinuers in case the number of discontinuers is small. (Figure 5)
The situation with grade repeaters is similar to discontinuers. The number of grade repeaters has significantly decreased over years: from 9,423 in 1995 to 2,797 in 2010, representing a decrease by almost 70%. Even though the decrease has been faster than the drop in the number of students, there is a correlation between these figures. The share of boys among all grade repeaters has fallen from 70% to 54%. Figure 6 reveals a pattern similar to Figure 3 which shows a sudden change after the ninth grade. The share of boys among students who repeat grades drops under 50%. This cannot be explained by the fact that boys become better students when growing older. The main reason is the fact that the share of boys in the gymnasium is generally under 50%, because boys, more often than girls, opt for vocational education after the ninth grade. Comparing the share of boys studying in gymnasiums to the share of grade repeaters among boys, we can see that boys constitute around 40% of full-time students in secondary education and a roughly similar percentage among grade repeaters. However, in basic school, where boys comprise 51–53% of students, they constitute generally 70–80% of all grade repeaters. This leads to a conclusion that there is no gender difference in the grade repeater rates in gymnasiums. The young men enrolled in the gymnasium have generally similar levels of motivation and abilities as the girls. This leads to the assumption that less motivated young men with lower abilities continue in vocational education. (Figure 6)
Vocational education
It was repeatedly indicated in the above analysis that boys are more likely to transfer to vocational education from the general education path. This conclusion can be based on the sex of discontinuers and those who continue in the gymnasium. Table 1 indicates that these two assumptions are true. The number of boys is significantly higher than the number of girls in vocational courses with non-defined basic education which is designed specifically for students who have dropped out of basic school. In recent years, 85–90% of such students have been boys. The share of boys has been significantly larger than the share of girls in previous years as well. The number of boys in vocational courses after basic education is almost twice as high as the number of girls. This also explains the decrease in the number of boys in general education between grades nine and ten. In percentage terms, boys are more likely to opt for vocational education than girls. However, the situation is reversed in vocational courses after secondary education. Namely, this level includes more girls than boys. Girls constitute 60% of students at this level. (Table 1)
Studying in vocational education is a step towards choosing a future job. By acquiring vocational qualification in a specific area, people restrict their choices in the labour market. Figure 7 indicates that boys constitute a great majority of students in engineering, manufacturing and construction as well as natural and exact sciences. Social services, business and law as well as health and well-being are less popular. However, the share of young men studying health and well-being specialties is gradually increasing. Massage studies, in particular, have become more popular. Girls constitute a higher share in those fields, which are taught after the upper secondary school level. (Figure 7)
NAISED JA MEHED HARIDUSELUS WOMEN AND MEN IN EDUCATION
MEHE KODU ON MAAILM, NAISE MAAILM ON KODU? MAN’S HOME IS THE WORLD, WOMAN’S WORLD IS HER HOME? 110
Higher education
A review of gender differences in the acquisition of higher education indicates that women are more prevalent than men among Estonian university students – roughly 60% of university students are women. The number of male and female students was relatively equal only 15 years ago. Social processes have made higher education fully accessible to women. There are also increased social expectations and pressures to acquire higher education, which was not so clearly visible earlier. This pressure also applies to men but, as lots of men exit the education path earlier and, it can be seen that they in general also discontinue their studies earlier, the number of male students in universities is lower than the number of female students. In percentage terms, we cannot complain about the share of men acquiring higher education in Estonia. A very large proportion of total Estonian population as well as of males has higher education. However, the centuries-old situation, where men’s level of education was generally higher than that of women, is now changing. We can expect that women in Estonia will be more educated than their husbands in the future.
The share of women has been gradually increasing at all levels of higher education: Bachelor’s, Master’s and Doctoral studies. However, the percentage of women has decreased in professional higher education and integrated studies. These forms of education focus more on applied knowledge. Integrated study generally comprises engineering and medical studies. These fields of study tend to be of more interest for men. (Table 2)
Figure 8 illustrating the share of men by fields of higher education indicates that there have been no major changes in the past 15 years. The share of men has decreased in most fields, corresponding to increased presence of women in higher education. The largest changes have been detected in the fields of services, health and well-being, social sciences, business and law. The decrease in the share of men has been the largest in these fields. Women have generally preferred to study ‘soft’ specialties. This is also confirmed by the data displayed in Table 2 which indicate that the change in the share of women in applied education curricula has been less significant than in Bachelor’s study. (Figure 8)
Summary
Currently, the number of women acquiring the highest level of education is larger than the respective number of men. Besides the fact that the share of males among the persons acquiring higher education decreased in the mid-1990s, caused by the addition of new study places, there have been no other major changes in the field of education. Although the educational gap is currently bigger than 15 years ago, it has stood relatively stable during the last 10 years. The lagging behind of men starts at the moment of transition from basic school to the gymnasium and continues at the transition to university education. While there is no difference in the number of young men and women at the transition from the gymnasium to the university, the difference is present at the transition from the basic school to the gymnasium. Evidently, gender gap is to a certain extent inevitable. In the European Union, about 55% of the persons acquiring higher education are women. In Estonia the respective share is 60%. The question is whether Estonia’s corresponding percentage 60% is the rightest one. In the future, it would be necessary to study why the proportion of boys in gymnasiums is by ten percentage points smaller, i.e. why they are unable to compete with girls for places in the gymnasium.
HARIDUSE PEEGELDUS TÄISKASVANUEAS REFLECTION OF EDUCATION IN ADULTHOOD
MEHE KODU ON MAAILM, NAISE MAAILM ON KODU? MAN’S HOME IS THE WORLD, WOMAN’S WORLD IS HER HOME? 111
HARIDUSE PEEGELDUS TÄISKASVANUEAS
Karolin Kõrreveski
Sissejuhatus
Õppimine ei lõppe tänapäeval mitte pärast keskkooli ega ülikooli, vaid toimub edasi nii tööl kui ka vabal ajal. Pidev enesetäiendamine on vajalik, et tööturul edukalt konkureerida. Samamoodi nagu on suurenenud haritud tööjõu nõudlus, on kasvanud haritud tööjõu pakkumine. Nii nagu teistes riikides, kus on palju haritud tööjõudu, on ka Eestis tööturul tihe konkurents. Ligikaudu 90% Eesti tööjõust on vähemalt keskharidusega ja 37% kõrgharidusega. Juba ammu on teada fakt, et naiste haridustase on kõrgem kui meestel. Kuidas aga kajastub see tööelus ja kas naiste aktiivsem osalus hariduses on nähtav ka täiskasvanuõppes?
Käesolevas artiklis on esiteks vaadatud seda, kas naiste ja meeste haridustase vastab nende töökoha nõuetele või kas nad on oma töö jaoks pigem üle- või alaharitud. Varasemad uuringud on näidanud, et Eestis töötab ligi 13% hõivatutest madalamat haridustaset eeldaval töökohal (Paulus 2007; Lamo ja Messina 2010). Artikli teine pool keskendub täiskasvanute elukestvale õppele. Analüüsitud on, kas haridustaseme ja töökoha mittevastavust parandatakse täiskasvanu-õppes osalemisega. Võib ju eeldada, et mehed püüavad oma madalamat haridustaset kompenseerida täiendusõppega, käies töökoolitustel rohkem kui naised. Mida aga näitavad 2010. aasta Eesti tööjõu-uuringu andmed?
Ala- ja üleharitus tööturul
Tehnoloogia arengu tõttu on ära kadunud palju madala kvalifikatsiooninõudega töökohti ja samal ajal loodud uusi töökohti, kus oskusteabe eeldused aina suurenevad. Prognoositakse, et aastaks 2020 on kõrghariduse nõue umbes 30%-l kõikidest töökohtadest Euroopas ja et kolmandik tööjõust nendele tingimusele ka vastab (Skill … 2010: 1). Vaadates sellist prognoosi, ei tundu tulevik üldsegi tume. Kuid tänapäeva ühiskonna proovikivi seisneb milleski muus. Haritud tööjõu hulgast on keeruline leida töökohale vastavate oskuste ja teadmistega töötajaid (Skill … 2010: 1). Kvalifitseeritud inimestel pole alati neid teadmisi või oskusi, mida otsivad tööandjad, mistõttu tekib tööturul ebakõla (Kutseoskuste … 2010). Eestis on praegu ligi 37%-l tööjõust kolmanda taseme haridus. Avalikes diskussioonides on Eestis tegutsevad välisinvestorid aga kurtnud heade kutseoskuste puuduse üle (Pilvinski 2010). Ka Majandus- ja Kommunikatsiooniministeeriumi tööjõuvajaduse prognoos aastani 2017 viitab praegusest veidi suuremale vajadusele kutseharidusega töötajate järele (Tööjõuvajaduse … 2010).
Hariduse ja töö mittevastavusel on palju olulisi negatiivseid tagajärgi nii töötajale, tööandjale kui ka ühiskonnale tervikuna. Kui inimene ei saa teha oma võimetele vastavat tööd, tekib rahulolematus ja langeb motivatsioon, mis avaldub ebaproduktiivsuses. Töötulemus kannatab ka siis, kui inimesele käivad tööülesanded üle jõu. Üleharituse korral kaotab inimene palgas ja alaharituse korral peavad tööandjad töötajate koolitamisse rohkem investeerima. Selline olukord suurendab tööjõu voolavust ja töötuks jäämise riski. Hinnanguliselt 30% Euroopa tööjõust on üleharitud (Skill … 2010: 1). Tööjõu kõrge haridustase iseenesest ei olegi probleem. Probleem tekib siis, kui inimesed ei saa oma oskusi ja teadmisi maksimaalselt ja õigesti kasutada. Kui kõrge haridustasemega töötaja ei leia oma haridusele vastavat tööd, on ta töötuse vältimiseks nõus vastu võtma ametikoha, mis eeldab madalamat haridustaset. See aga seab raskemasse olukorda madalama haridustasemega inimesed, kes peavad asuma veelgi vähemtasuvatele ja ebastabiilsematele töökohtadele ning kes tõrjutakse lõpuks tööturult välja (Philips ja Loova 2005). Et pikaajaline üle- või alaharituse seisund tekitab majanduslikke ja sotsiaalseid kahjusid, on oluline analüüsida, kuivõrd ulatuslik on hariduse ja töö mittevastavus Eestis. Artiklis ongi vaadatud, millised on soolised erinevused üle- või alaharituse puhul.
Mida ikkagi tähendab hariduse ja töö mittevastavus ning kuidas seda mõõta? Teoreetilistes käsitlustes eristatakse vertikaalset ja horisontaalset hariduse ning töökoha mittevastavust (Skill … 2010: 1). Vertikaalne mittevastavus on see, kui töötaja haridustase ei vasta töökoha
HARIDUSE PEEGELDUS TÄISKASVANUEAS REFLECTION OF EDUCATION IN ADULTHOOD
MEHE KODU ON MAAILM, NAISE MAAILM ON KODU? MAN’S HOME IS THE WORLD, WOMAN’S WORLD IS HER HOME? 112
nõuetele. Horisontaalne mittevastavus tähendab, et inimene ei tööta omandatud erialal. Üle- ja alaharituse ehk vertikaalse mittevastavuse mõõtmiseks kasutatakse kolme meetodit (Ramos jt 2008; Skill … 2009). Esiteks võrreldakse töökohal nõutavat haridust töötaja haridusega (nn objektiivne meetod). Teiseks analüüsitakse töötajate hinnanguid oma hariduse ja töö vastavuse kohta (nn subjektiivne meetod). Kolmas meetod näeb ette konkreetse ametipositsiooni keskmise haridustaseme arvutamist, misjärel vaadatakse, kui palju töötaja haridustase keskmisest erineb (nn statistiline meetod). Käesolevas artiklis on kasutatud subjektiivset meetodit ehk analüüsitud tööjõu-uuringuga kogutud andmeid hariduse ja töö vertikaalse mittevastavuse kohta. Andmed põhinevad töötajate hinnangutel.
Uuringud on näidanud, et hariduse ja töökoha mittevastavus puudutab enim noori, vanemaealisi ja naisi (Skill … 2009). Karjääri mobiilsuse teooria seisukohalt on tööturule sisenejad nõus kogemuste saamise nimel ajutiselt töötama madalamat haridustaset nõudval töökohal, kust hiljem on lihtsam edasi liikuda kõrgemale positsioonile (Sicherman 1991; Marchante jt 2007), seetõttu on palju üleharituid äsja kõrgkooli lõpetanute hulgas. Eriti keeruline on noortel esimest töökohta leida majandustsükli langusfaasis, kui tööandjad vähendavad töölevõetavate arvu või eelistavad vanemaid ja kogenumaid töötajaid. 2008. aastal alguse saanud tõsine üleilmne finants- ja majanduskriis näitas selgelt, et ühed peamised kannatajad tööturul olid noored. Eestis kasvas noorte (15–24-aastased) töötuse määr 12%-st 2008. aastal rekordiliselt kõrge 32,9%-ni 2010. aastal. Et vältida töötuks jäämist, ei lähtu noored tööotsinguil oma haridustasemest ega erialast. Eesti tööjõu-uuringu kohaselt otsis 2010. aastal vaid 16% noortest oma haridustasemele vastavat tööd ja 84% olid nõus vastu võtma madalamat haridustaset eeldava töökoha.
Mida vanemaks inimene saab, seda enam suureneb tõenäosus, et tal on oma haridustasemele vastav töö, kuid ainult teatava piirini. Uuringud on näidanud, et pärast 50. eluaastat (Brunello 2008, viidatud Skill … 2009: 12 järgi) on hariduse ja töö mittevastavus jälle suurem. Näiteks Wolbers (2003) ning Witte ja Kalleberg (1995) on leidnud, et üleharitute osatähtsus hõivatute hulgas suureneb vanusega ja seda põhjendatakse tehnoloogia muutumisega. Vanemad inimesed, kelle oskused ja teadmised ei pruugi alati järele jõuda tehnoloogilistele arendustele muutlikul tööturul, on valmis tegema tööd, mis eeldab madalamat haridustaset, kui neil on (Paulus 2007). Leitud aga on ka vastupidist – vanuse tõustes suureneb võimalus olla alaharitud, sest kogemustepagasit väärtustatakse rohkem kui ülikoolidiplomit (Sicherman 1991). Inimkapitali teooria kohaselt on töökogemus ja omandatud haridustase omavahel asendatavad (Marchante jt 2007). See tähendab, et vanem inimene saab oma madalat haridustaset kompenseerida töö-kogemusega, mis võimaldab tal teha kõrgemat haridustaset nõudvat tööd, olles tegelikult alaharitud.
2010. aasta tööjõu-uuringu andmetel on Eestis üle- ja alaharitute osatähtsused suhteliselt väikesed – 3% töötajatest on ala- ja 12% üleharitud. Nii nagu teistes riikides ohustab uuringute kohaselt ka Eestis üleharitus enam naisi (Paulus 2007). Kui meestest on üleharitud keskmiselt iga kümnes, siis naistest iga kuues. Arvestades seda, et naiste haridustee on pikem, neid on kolmanda taseme hariduse omandanute hulgas rohkem kui mehi, on naiste üleharituse võimalus suurem. Alaharituid on kaks korda sagedamini meeste seas. Alaharitud mehi on Eestis ligikaudu 4% ja naisi 2%. Neid, kelle haridustase ja töö on vastavuses, on meeste hulgas enam kui naiste hulgas. 87% meestest väidab, et nende töö ja haridustase on kookõlas, naistest vastavalt 84%. Mehed ja naised on valmis vastu võtma tööd, mis ei ole kooskõlas nende haridusega, erinevatel põhjustel. Eeldatakse, et mehed on orienteeritud karjäärile. Meeste otsused on rohkem mõjutatud palga suurusest ja ametikõrgendusest, naised aga lähtuvad pere- ja tööelu ühitamise võimalustest (Robst 2007). Samal ajal ei saa naiste karjääritegemise soovi alahinnata, sest tänapäeval on naised meeste kõrval arvestatava panusega leivateenijad. 2010. aastal oli nii meestel kui ka naistel uue või lisatöö otsimise peamine põhjus töötasu. Neid ambitsioonikaid, kes otsisid oma oskustele ja võimetele paremini vastavat tööd, oli aga rohkem naiste hulgas. Isiklikel või perekondlikel põhjustel sobivama tööajakorraldusega tööd otsinuid oli meeste ja naiste seas peaaegu võrdselt ehk kümnendik.
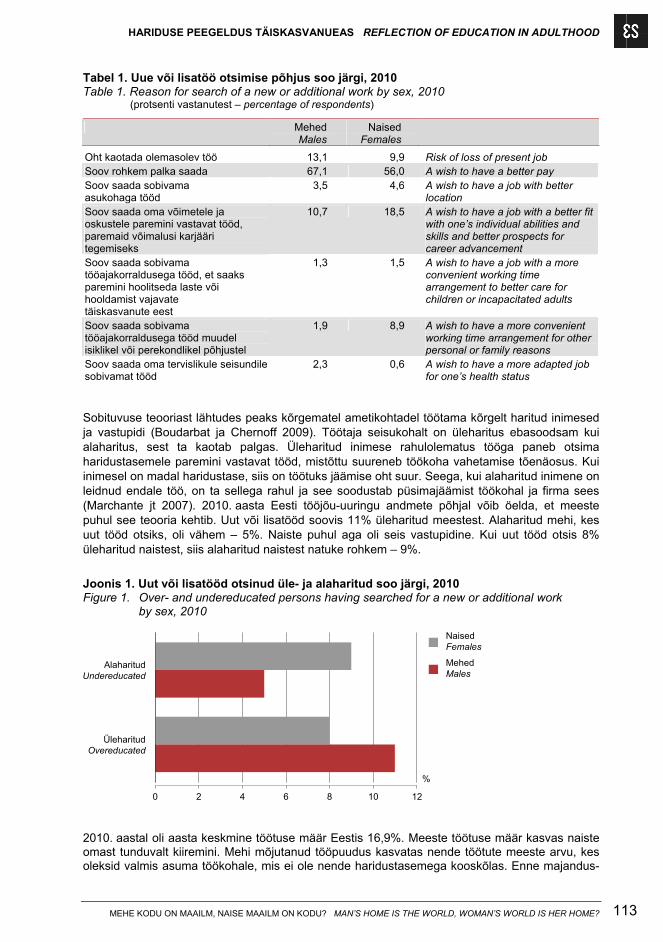
HARIDUSE PEEGELDUS TÄISKASVANUEAS REFLECTION OF EDUCATION IN ADULTHOOD
MEHE KODU ON MAAILM, NAISE MAAILM ON KODU? MAN’S HOME IS THE WORLD, WOMAN’S WORLD IS HER HOME? 113
Tabel 1. Uue või lisatöö otsimise põhjus soo järgi, 2010 Table 1. Reason for search of a new or additional work by sex, 2010
(protsenti vastanutest – percentage of respondents)
Mehed Males
Naised Females
Oht kaotada olemasolev töö 13,1 9,9 Risk of loss of present job Soov rohkem palka saada 67,1 56,0 A wish to have a better pay Soov saada sobivama asukohaga tööd
3,5 4,6 A wish to have a job with better location
Soov saada oma võimetele ja oskustele paremini vastavat tööd, paremaid võimalusi karjääri tegemiseks
10,7 18,5 A wish to have a job with a better fit with one’s individual abilities and skills and better prospects for career advancement
Soov saada sobivama tööajakorraldusega tööd, et saaks paremini hoolitseda laste või hooldamist vajavate täiskasvanute eest
1,3 1,5 A wish to have a job with a more convenient working time arrangement to better care for children or incapacitated adults
Soov saada sobivama tööajakorraldusega tööd muudel isiklikel või perekondlikel põhjustel
1,9 8,9 A wish to have a more convenient working time arrangement for other personal or family reasons
Soov saada oma tervislikule seisundile sobivamat tööd
2,3 0,6 A wish to have a more adapted job for one’s health status
Sobituvuse teooriast lähtudes peaks kõrgematel ametikohtadel töötama kõrgelt haritud inimesed ja vastupidi (Boudarbat ja Chernoff 2009). Töötaja seisukohalt on üleharitus ebasoodsam kui alaharitus, sest ta kaotab palgas. Üleharitud inimese rahulolematus tööga paneb otsima haridustasemele paremini vastavat tööd, mistõttu suureneb töökoha vahetamise tõenäosus. Kui inimesel on madal haridustase, siis on töötuks jäämise oht suur. Seega, kui alaharitud inimene on leidnud endale töö, on ta sellega rahul ja see soodustab püsimajäämist töökohal ja firma sees (Marchante jt 2007). 2010. aasta Eesti tööjõu-uuringu andmete põhjal võib öelda, et meeste puhul see teooria kehtib. Uut või lisatööd soovis 11% üleharitud meestest. Alaharitud mehi, kes uut tööd otsiks, oli vähem – 5%. Naiste puhul aga oli seis vastupidine. Kui uut tööd otsis 8% üleharitud naistest, siis alaharitud naistest natuke rohkem – 9%.
Joonis 1. Uut või lisatööd otsinud üle- ja alaharitud soo järgi, 2010 Figure 1. Over- and undereducated persons having searched for a new or additional work
by sex, 2010
ÜleharitudOvereducated
AlaharitudUndereducated
0 2 4 6 8 10 12
NaisedFemales
MehedMales
%
2010. aastal oli aasta keskmine töötuse määr Eestis 16,9%. Meeste töötuse määr kasvas naiste omast tunduvalt kiiremini. Mehi mõjutanud tööpuudus kasvatas nende töötute meeste arvu, kes oleksid valmis asuma töökohale, mis ei ole nende haridustasemega kooskõlas. Enne majandus-
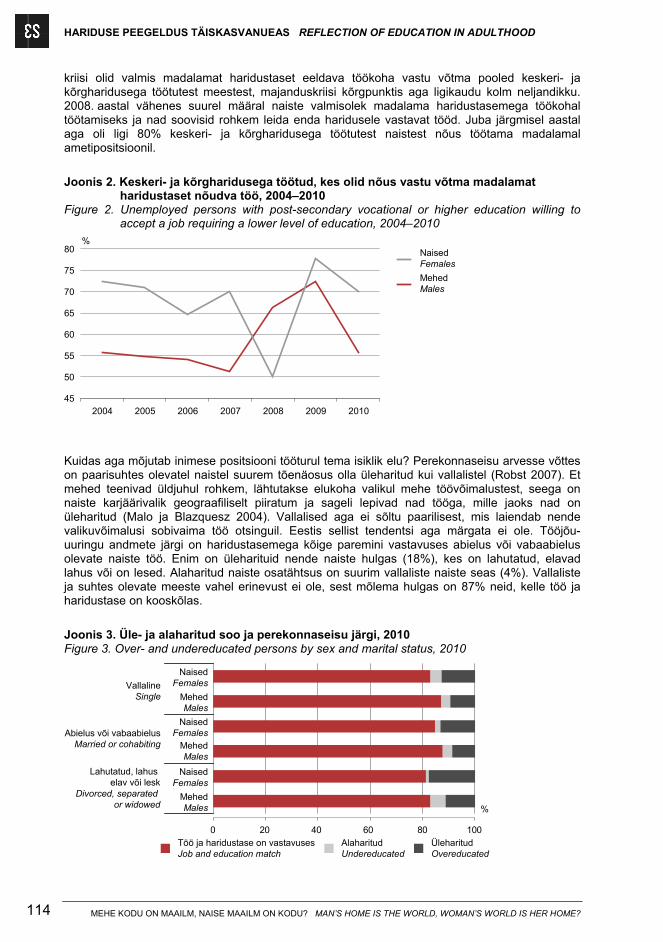
HARIDUSE PEEGELDUS TÄISKASVANUEAS REFLECTION OF EDUCATION IN ADULTHOOD
MEHE KODU ON MAAILM, NAISE MAAILM ON KODU? MAN’S HOME IS THE WORLD, WOMAN’S WORLD IS HER HOME? 114
kriisi olid valmis madalamat haridustaset eeldava töökoha vastu võtma pooled keskeri- ja kõrgharidusega töötutest meestest, majanduskriisi kõrgpunktis aga ligikaudu kolm neljandikku. 2008. aastal vähenes suurel määral naiste valmisolek madalama haridustasemega töökohal töötamiseks ja nad soovisid rohkem leida enda haridusele vastavat tööd. Juba järgmisel aastal aga oli ligi 80% keskeri- ja kõrgharidusega töötutest naistest nõus töötama madalamal ametipositsioonil.
Joonis 2. Keskeri- ja kõrgharidusega töötud, kes olid nõus vastu võtma madalamat
haridustaset nõudva töö, 2004–2010 Figure 2. Unemployed persons with post-secondary vocational or higher education willing to
accept a job requiring a lower level of education, 2004–2010
%
2004 2005 2006 2007 2008 2009 201045
50
55
60
65
70
75
80
MehedMales
NaisedFemales
Kuidas aga mõjutab inimese positsiooni tööturul tema isiklik elu? Perekonnaseisu arvesse võttes on paarisuhtes olevatel naistel suurem tõenäosus olla üleharitud kui vallalistel (Robst 2007). Et mehed teenivad üldjuhul rohkem, lähtutakse elukoha valikul mehe töövõimalustest, seega on naiste karjäärivalik geograafiliselt piiratum ja sageli lepivad nad tööga, mille jaoks nad on üleharitud (Malo ja Blazquesz 2004). Vallalised aga ei sõltu paarilisest, mis laiendab nende valikuvõimalusi sobivaima töö otsinguil. Eestis sellist tendentsi aga märgata ei ole. Tööjõu-uuringu andmete järgi on haridustasemega kõige paremini vastavuses abielus või vabaabielus olevate naiste töö. Enim on üleharituid nende naiste hulgas (18%), kes on lahutatud, elavad lahus või on lesed. Alaharitud naiste osatähtsus on suurim vallaliste naiste seas (4%). Vallaliste ja suhtes olevate meeste vahel erinevust ei ole, sest mõlema hulgas on 87% neid, kelle töö ja haridustase on kooskõlas.
Joonis 3. Üle- ja alaharitud soo ja perekonnaseisu järgi, 2010 Figure 3. Over- and undereducated persons by sex and marital status, 2010
MehedMales
NaisedFemales
MehedMales
NaisedFemales
MehedMales
NaisedFemales
Töö ja haridustase on vastavusesJob and education match
AlaharitudUndereducated
ÜleharitudOvereducated
%
0 20 40 60 80 100
VallalineSingle
Abielus või vabaabielusMarried or cohabiting
Lahutatud, lahuselav või lesk
Divorced, separatedor widowed
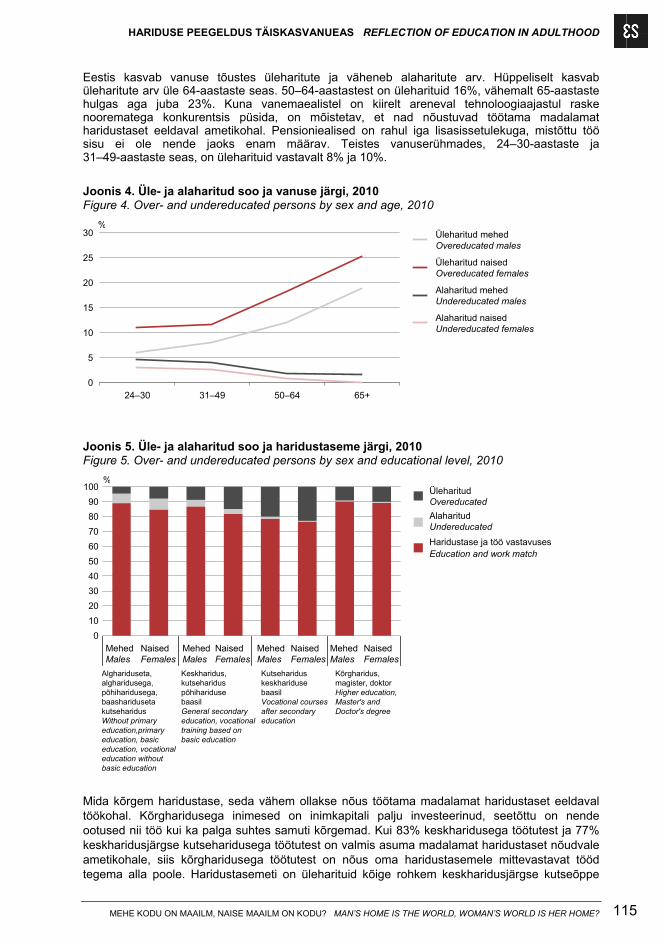
HARIDUSE PEEGELDUS TÄISKASVANUEAS REFLECTION OF EDUCATION IN ADULTHOOD
MEHE KODU ON MAAILM, NAISE MAAILM ON KODU? MAN’S HOME IS THE WORLD, WOMAN’S WORLD IS HER HOME? 115
Eestis kasvab vanuse tõustes üleharitute ja väheneb alaharitute arv. Hüppeliselt kasvab üleharitute arv üle 64-aastaste seas. 50–64-aastastest on üleharituid 16%, vähemalt 65-aastaste hulgas aga juba 23%. Kuna vanemaealistel on kiirelt areneval tehnoloogiaajastul raske noorematega konkurentsis püsida, on mõistetav, et nad nõustuvad töötama madalamat haridustaset eeldaval ametikohal. Pensioniealised on rahul iga lisasissetulekuga, mistõttu töö sisu ei ole nende jaoks enam määrav. Teistes vanuserühmades, 24–30-aastaste ja 31–49-aastaste seas, on üleharituid vastavalt 8% ja 10%.
Joonis 4. Üle- ja alaharitud soo ja vanuse järgi, 2010 Figure 4. Over- and undereducated persons by sex and age, 2010
%
24–30 31–49 50–64 65+0
5
10
15
20
25
30 Üleharitud mehedOvereducated males
Üleharitud naisedOvereducated females
Alaharitud mehedUndereducated males
Alaharitud naisedUndereducated females
Joonis 5. Üle- ja alaharitud soo ja haridustaseme järgi, 2010 Figure 5. Over- and undereducated persons by sex and educational level, 2010
MehedMales
NaisedFemales
MehedMales
NaisedFemales
MehedMales
NaisedFemales
MehedMales
NaisedFemales
0
10
20
30
40
50
60
70
80
90
100
Haridustase ja töö vastavusesEducation and work match
AlaharitudUndereducated
ÜleharitudOvereducated
%
Alghariduseta,algharidusega,põhiharidusega,baasharidusetakutseharidusWithout primaryeducation,primaryeducation, basiceducation, vocationaleducation withoutbasic education
Keskharidus,kutsehariduspõhiharidusebaasilGeneral secondaryeducation, vocationaltraining based onbasic education
KutsehariduskeskharidusebaasilVocational coursesafter secondaryeducation
Kõrgharidus,magister, doktorHigher education,Master's andDoctor's degree
Mida kõrgem haridustase, seda vähem ollakse nõus töötama madalamat haridustaset eeldaval töökohal. Kõrgharidusega inimesed on inimkapitali palju investeerinud, seetõttu on nende ootused nii töö kui ka palga suhtes samuti kõrgemad. Kui 83% keskharidusega töötutest ja 77% keskharidusjärgse kutseharidusega töötutest on valmis asuma madalamat haridustaset nõudvale ametikohale, siis kõrgharidusega töötutest on nõus oma haridustasemele mittevastavat tööd tegema alla poole. Haridustasemeti on üleharituid kõige rohkem keskharidusjärgse kutseõppe
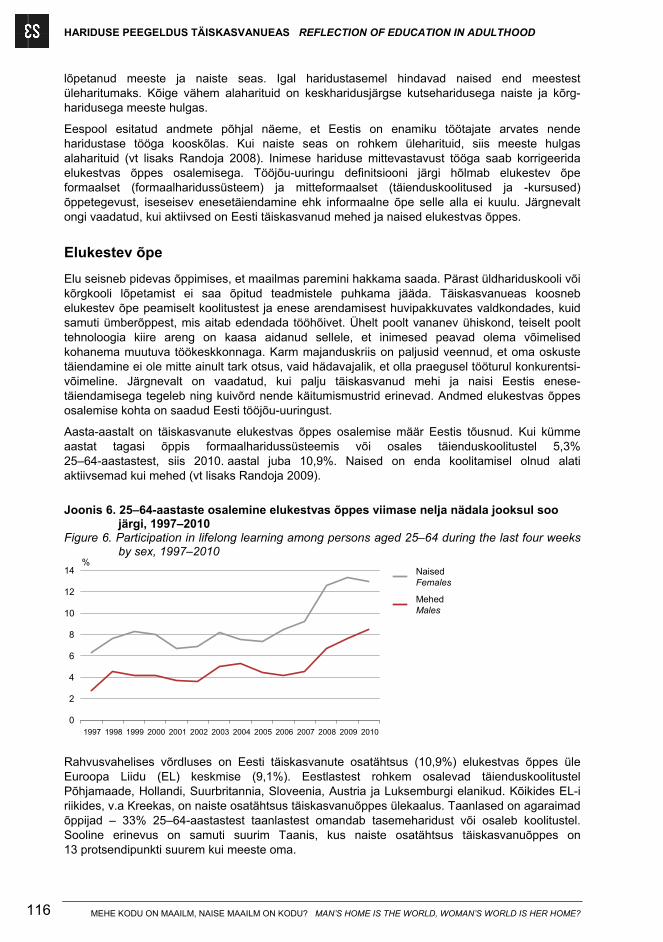
HARIDUSE PEEGELDUS TÄISKASVANUEAS REFLECTION OF EDUCATION IN ADULTHOOD
MEHE KODU ON MAAILM, NAISE MAAILM ON KODU? MAN’S HOME IS THE WORLD, WOMAN’S WORLD IS HER HOME? 116
lõpetanud meeste ja naiste seas. Igal haridustasemel hindavad naised end meestest üleharitumaks. Kõige vähem alaharituid on keskharidusjärgse kutseharidusega naiste ja kõrg-haridusega meeste hulgas.
Eespool esitatud andmete põhjal näeme, et Eestis on enamiku töötajate arvates nende haridustase tööga kooskõlas. Kui naiste seas on rohkem üleharituid, siis meeste hulgas alaharituid (vt lisaks Randoja 2008). Inimese hariduse mittevastavust tööga saab korrigeerida elukestvas õppes osalemisega. Tööjõu-uuringu definitsiooni järgi hõlmab elukestev õpe formaalset (formaalharidussüsteem) ja mitteformaalset (täienduskoolitused ja -kursused) õppetegevust, iseseisev enesetäiendamine ehk informaalne õpe selle alla ei kuulu. Järgnevalt ongi vaadatud, kui aktiivsed on Eesti täiskasvanud mehed ja naised elukestvas õppes.
Elukestev õpe
Elu seisneb pidevas õppimises, et maailmas paremini hakkama saada. Pärast üldhariduskooli või kõrgkooli lõpetamist ei saa õpitud teadmistele puhkama jääda. Täiskasvanueas koosneb elukestev õpe peamiselt koolitustest ja enese arendamisest huvipakkuvates valdkondades, kuid samuti ümberõppest, mis aitab edendada tööhõivet. Ühelt poolt vananev ühiskond, teiselt poolt tehnoloogia kiire areng on kaasa aidanud sellele, et inimesed peavad olema võimelised kohanema muutuva töökeskkonnaga. Karm majanduskriis on paljusid veennud, et oma oskuste täiendamine ei ole mitte ainult tark otsus, vaid hädavajalik, et olla praegusel tööturul konkurentsi-võimeline. Järgnevalt on vaadatud, kui palju täiskasvanud mehi ja naisi Eestis enese-täiendamisega tegeleb ning kuivõrd nende käitumismustrid erinevad. Andmed elukestvas õppes osalemise kohta on saadud Eesti tööjõu-uuringust.
Aasta-aastalt on täiskasvanute elukestvas õppes osalemise määr Eestis tõusnud. Kui kümme aastat tagasi õppis formaalharidussüsteemis või osales täienduskoolitustel 5,3% 25–64-aastastest, siis 2010. aastal juba 10,9%. Naised on enda koolitamisel olnud alati aktiivsemad kui mehed (vt lisaks Randoja 2009).
Joonis 6. 25–64-aastaste osalemine elukestvas õppes viimase nelja nädala jooksul soo
järgi, 1997–2010 Figure 6. Participation in lifelong learning among persons aged 25–64 during the last four weeks
by sex, 1997–2010 %
1997 1998 1999 2000 2001 2002 2003 2004 2005 2006 2007 2008 2009 2010
0
2
4
6
8
10
12
14
MehedMales
NaisedFemales
Rahvusvahelises võrdluses on Eesti täiskasvanute osatähtsus (10,9%) elukestvas õppes üle Euroopa Liidu (EL) keskmise (9,1%). Eestlastest rohkem osalevad täienduskoolitustel Põhjamaade, Hollandi, Suurbritannia, Sloveenia, Austria ja Luksemburgi elanikud. Kõikides EL-i riikides, v.a Kreekas, on naiste osatähtsus täiskasvanuõppes ülekaalus. Taanlased on agaraimad õppijad – 33% 25–64-aastastest taanlastest omandab tasemeharidust või osaleb koolitustel. Sooline erinevus on samuti suurim Taanis, kus naiste osatähtsus täiskasvanuõppes on 13 protsendipunkti suurem kui meeste oma.
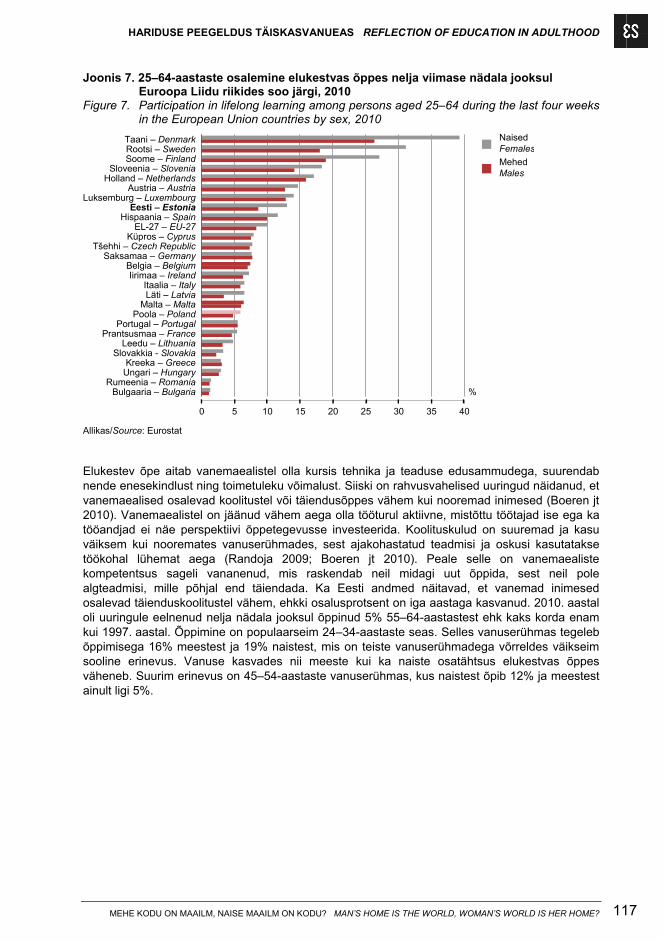
HARIDUSE PEEGELDUS TÄISKASVANUEAS REFLECTION OF EDUCATION IN ADULTHOOD
MEHE KODU ON MAAILM, NAISE MAAILM ON KODU? MAN’S HOME IS THE WORLD, WOMAN’S WORLD IS HER HOME? 117
Joonis 7. 25–64-aastaste osalemine elukestvas õppes nelja viimase nädala jooksul Euroopa Liidu riikides soo järgi, 2010
Figure 7. Participation in lifelong learning among persons aged 25–64 during the last four weeks in the European Union countries by sex, 2010
Bulgaaria – BulgariaRumeenia – Romania
Ungari – HungaryKreeka – Greece
Slovakkia - SlovakiaLeedu – Lithuania
Prantsusmaa – FrancePortugal – Portugal
Poola – PolandMalta – Malta
Läti – LatviaItaalia – Italy
Iirimaa – IrelandBelgia – Belgium
Saksamaa – GermanyTšehhi – Czech Republic
Küpros – CyprusEL-27 – EU-27
Hispaania – SpainEesti – Estonia
Luksemburg – LuxembourgAustria – Austria
Holland – NetherlandsSloveenia – Slovenia
Soome – FinlandRootsi – SwedenTaani – Denmark
0 5 10 15 20 25 30 35 40
NaisedFemales
MehedMales
%
Allikas/Source: Eurostat
Elukestev õpe aitab vanemaealistel olla kursis tehnika ja teaduse edusammudega, suurendab nende enesekindlust ning toimetuleku võimalust. Siiski on rahvusvahelised uuringud näidanud, et vanemaealised osalevad koolitustel või täiendusõppes vähem kui nooremad inimesed (Boeren jt 2010). Vanemaealistel on jäänud vähem aega olla tööturul aktiivne, mistõttu töötajad ise ega ka tööandjad ei näe perspektiivi õppetegevusse investeerida. Koolituskulud on suuremad ja kasu väiksem kui nooremates vanuserühmades, sest ajakohastatud teadmisi ja oskusi kasutatakse töökohal lühemat aega (Randoja 2009; Boeren jt 2010). Peale selle on vanemaealiste kompetentsus sageli vananenud, mis raskendab neil midagi uut õppida, sest neil pole algteadmisi, mille põhjal end täiendada. Ka Eesti andmed näitavad, et vanemad inimesed osalevad täienduskoolitustel vähem, ehkki osalusprotsent on iga aastaga kasvanud. 2010. aastal oli uuringule eelnenud nelja nädala jooksul õppinud 5% 55–64-aastastest ehk kaks korda enam kui 1997. aastal. Õppimine on populaarseim 24–34-aastaste seas. Selles vanuserühmas tegeleb õppimisega 16% meestest ja 19% naistest, mis on teiste vanuserühmadega võrreldes väikseim sooline erinevus. Vanuse kasvades nii meeste kui ka naiste osatähtsus elukestvas õppes väheneb. Suurim erinevus on 45–54-aastaste vanuserühmas, kus naistest õpib 12% ja meestest ainult ligi 5%.
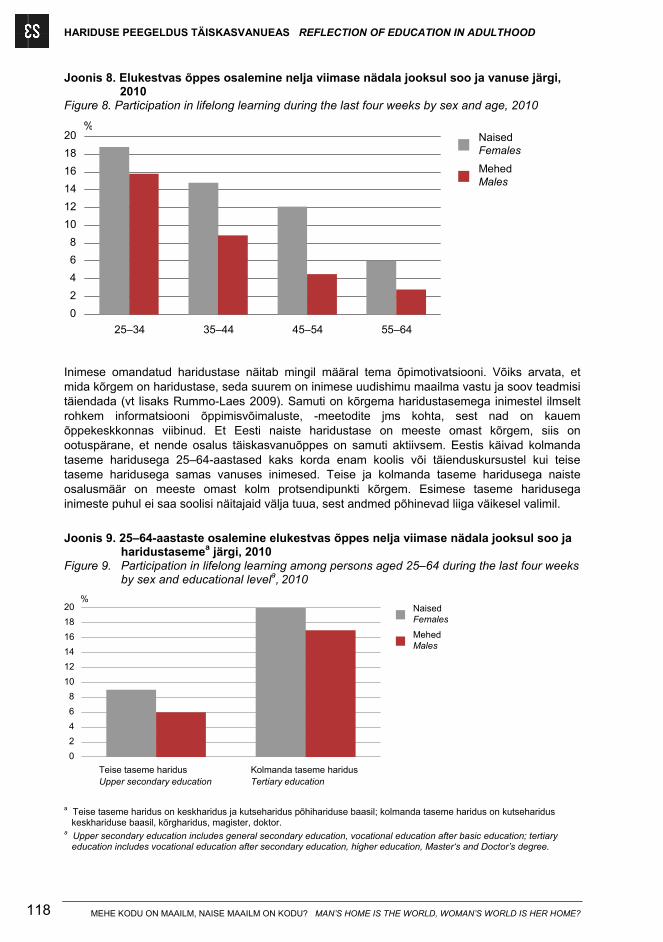
HARIDUSE PEEGELDUS TÄISKASVANUEAS REFLECTION OF EDUCATION IN ADULTHOOD
MEHE KODU ON MAAILM, NAISE MAAILM ON KODU? MAN’S HOME IS THE WORLD, WOMAN’S WORLD IS HER HOME? 118
Joonis 8. Elukestvas õppes osalemine nelja viimase nädala jooksul soo ja vanuse järgi, 2010
Figure 8. Participation in lifelong learning during the last four weeks by sex and age, 2010
%
25–34 35–44 45–54 55–64
0
2
4
6
8
10
12
14
16
18
20 NaisedFemales
MehedMales
Inimese omandatud haridustase näitab mingil määral tema õpimotivatsiooni. Võiks arvata, et mida kõrgem on haridustase, seda suurem on inimese uudishimu maailma vastu ja soov teadmisi täiendada (vt lisaks Rummo-Laes 2009). Samuti on kõrgema haridustasemega inimestel ilmselt rohkem informatsiooni õppimisvõimaluste, -meetodite jms kohta, sest nad on kauem õppekeskkonnas viibinud. Et Eesti naiste haridustase on meeste omast kõrgem, siis on ootuspärane, et nende osalus täiskasvanuõppes on samuti aktiivsem. Eestis käivad kolmanda taseme haridusega 25–64-aastased kaks korda enam koolis või täienduskursustel kui teise taseme haridusega samas vanuses inimesed. Teise ja kolmanda taseme haridusega naiste osalusmäär on meeste omast kolm protsendipunkti kõrgem. Esimese taseme haridusega inimeste puhul ei saa soolisi näitajaid välja tuua, sest andmed põhinevad liiga väikesel valimil.
Joonis 9. 25–64-aastaste osalemine elukestvas õppes nelja viimase nädala jooksul soo ja
haridustasemea järgi, 2010 Figure 9. Participation in lifelong learning among persons aged 25–64 during the last four weeks
by sex and educational levela, 2010
%
Teise taseme haridusUpper secondary education
Kolmanda taseme haridusTertiary education
0
2
4
6
8
10
12
14
16
18
20 NaisedFemales
MehedMales
a Teise taseme haridus on keskharidus ja kutseharidus põhihariduse baasil; kolmanda taseme haridus on kutseharidus
keskhariduse baasil, kõrgharidus, magister, doktor. a Upper secondary education includes general secondary education, vocational education after basic education; tertiary
education includes vocational education after secondary education, higher education, Master‘s and Doctor’s degree.
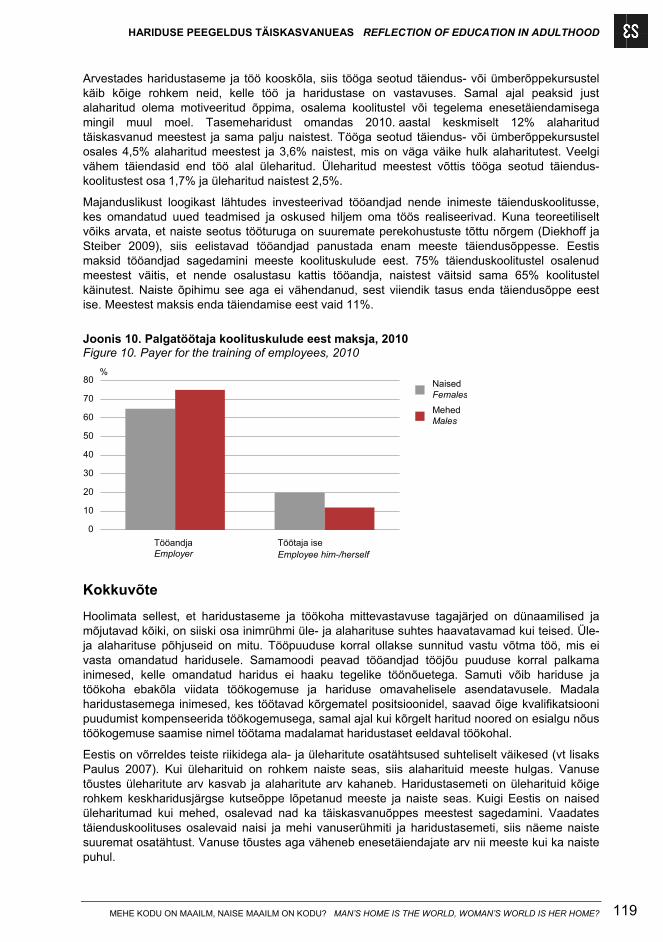
HARIDUSE PEEGELDUS TÄISKASVANUEAS REFLECTION OF EDUCATION IN ADULTHOOD
MEHE KODU ON MAAILM, NAISE MAAILM ON KODU? MAN’S HOME IS THE WORLD, WOMAN’S WORLD IS HER HOME? 119
Arvestades haridustaseme ja töö kooskõla, siis tööga seotud täiendus- või ümberõppekursustel käib kõige rohkem neid, kelle töö ja haridustase on vastavuses. Samal ajal peaksid just alaharitud olema motiveeritud õppima, osalema koolitustel või tegelema enesetäiendamisega mingil muul moel. Tasemeharidust omandas 2010. aastal keskmiselt 12% alaharitud täiskasvanud meestest ja sama palju naistest. Tööga seotud täiendus- või ümberõppekursustel osales 4,5% alaharitud meestest ja 3,6% naistest, mis on väga väike hulk alaharitutest. Veelgi vähem täiendasid end töö alal üleharitud. Üleharitud meestest võttis tööga seotud täiendus-koolitustest osa 1,7% ja üleharitud naistest 2,5%.
Majanduslikust loogikast lähtudes investeerivad tööandjad nende inimeste täienduskoolitusse, kes omandatud uued teadmised ja oskused hiljem oma töös realiseerivad. Kuna teoreetiliselt võiks arvata, et naiste seotus tööturuga on suuremate perekohustuste tõttu nõrgem (Diekhoff ja Steiber 2009), siis eelistavad tööandjad panustada enam meeste täiendusõppesse. Eestis maksid tööandjad sagedamini meeste koolituskulude eest. 75% täienduskoolitustel osalenud meestest väitis, et nende osalustasu kattis tööandja, naistest väitsid sama 65% koolitustel käinutest. Naiste õpihimu see aga ei vähendanud, sest viiendik tasus enda täiendusõppe eest ise. Meestest maksis enda täiendamise eest vaid 11%.
Joonis 10. Palgatöötaja koolituskulude eest maksja, 2010 Figure 10. Payer for the training of employees, 2010
%
TööandjaEmployer
Töötaja iseEmployee him-/herself
0
10
20
30
40
50
60
70
80 NaisedFemales
MehedMales
Kokkuvõte
Hoolimata sellest, et haridustaseme ja töökoha mittevastavuse tagajärjed on dünaamilised ja mõjutavad kõiki, on siiski osa inimrühmi üle- ja alaharituse suhtes haavatavamad kui teised. Üle- ja alaharituse põhjuseid on mitu. Tööpuuduse korral ollakse sunnitud vastu võtma töö, mis ei vasta omandatud haridusele. Samamoodi peavad tööandjad tööjõu puuduse korral palkama inimesed, kelle omandatud haridus ei haaku tegelike töönõuetega. Samuti võib hariduse ja töökoha ebakõla viidata töökogemuse ja hariduse omavahelisele asendatavusele. Madala haridustasemega inimesed, kes töötavad kõrgematel positsioonidel, saavad õige kvalifikatsiooni puudumist kompenseerida töökogemusega, samal ajal kui kõrgelt haritud noored on esialgu nõus töökogemuse saamise nimel töötama madalamat haridustaset eeldaval töökohal.
Eestis on võrreldes teiste riikidega ala- ja üleharitute osatähtsused suhteliselt väikesed (vt lisaks Paulus 2007). Kui üleharituid on rohkem naiste seas, siis alaharituid meeste hulgas. Vanuse tõustes üleharitute arv kasvab ja alaharitute arv kahaneb. Haridustasemeti on üleharituid kõige rohkem keskharidusjärgse kutseõppe lõpetanud meeste ja naiste seas. Kuigi Eestis on naised üleharitumad kui mehed, osalevad nad ka täiskasvanuõppes meestest sagedamini. Vaadates täienduskoolituses osalevaid naisi ja mehi vanuserühmiti ja haridustasemeti, siis näeme naiste suuremat osatähtust. Vanuse tõustes aga väheneb enesetäiendajate arv nii meeste kui ka naiste puhul.
HARIDUSE PEEGELDUS TÄISKASVANUEAS REFLECTION OF EDUCATION IN ADULTHOOD
MEHE KODU ON MAAILM, NAISE MAAILM ON KODU? MAN’S HOME IS THE WORLD, WOMAN’S WORLD IS HER HOME? 120
Allikad Sources
Boeren, E., Nicaise, I., Baert, H. (2010). Theoretical models of participation in adult education: the need for an integrated model. – International Journal of Lifelong Education, Vol 29, No 1, pp. 45–61.
Boudarbat, B., Chernoff, V. (2009). The Determinants of Education-Job Match among Canadian University Graduates. – IZA Discussion Papers 4513, Institute for the Study of Labor (IZA). [www] http://ftp.iza.org/dp4513.pdf (05.09.2011).
Kutseoskuste ja töökohtade eksperdid esitavad üleskutse koheseks tegutsemiseks. (04.02.2010). Euroopa Komisjoni Esindus Eestis. [www] http://ec.europa.eu/eesti/press/press_releases/100204_kutseoskus_et.htm (05.09.2011).
Lamo, A., Messina, J. (2010). Formal Education, Mismatch and Wages after Transition: Assessing the Impact of Unobserved Heterogeneity Using Matching Estimators. – Working Paper Series No 1215, European Central Bank. [www] http://www.ecb.int/pub/pdf/scpwps/ecbwp1215.pdf (05.09.2011).
Marchante, A. J., Ortega B., Pagan, R. (2007). An Analysis of Educational Mismatch and Labor Mobility in the Hospitality Industry. – Journal of Hospitality & Tourism Research,Vol 3, No 3, pp. 299–320.
Paulus, M. (2007). Haridustasemete ja töökohtade mittevastavus Eestis. Tartu Ülikool. [Magistritöö]. Tartu. [www] http://dspace.utlib.ee/dspace/bitstream/handle/10062/2728/paulus_margit.pdf?sequence=1 (05.09.2011).
Philips, K., Loova, M. (2005). Madala kvalifikatsiooniga tööjõud Eestis. – Estonian Social Science Online. Eesti sotsiaalteaduste V aastakonverents. Tallinn. [www] http://www.sotsioloogia.ee/vana/esso3/2/kaia_philips_margit_loova.htm (05.09.2011).
Pilvinski, K. (27.05.2010). FICE: eestlaste kutseoskuste puudumine on suur probleem. – Äripäev. [www] http://www.ap3.ee/?PublicationId=31503ED6-39D4-4163-9D98-74AA1E3959CE&code=4694/uud_uudidx_469403 (05.09.2011).
Ramos, R., Surinach, J., Artís, M. (2009). Regional Economic Growth and Human Capital: The Role of Overeducation. – IZA Discussion Papers 4453, Institute for the Study of Labor (IZA). [www] http://ftp.iza.org/dp4453.pdf (05.09.2011).
Randoja, M. (2008). Soolised palgaerinevused. – Pilk tööellu. A Glimpse into the Working life. Tallinn: Statistikaamet, lk 116–125.
Randoja, M. (2009). Soolised erinevused täiskasvanute koolituses. – Täiskasvanute koolitus. Adult Education. Tallinn: Statistikaamet, lk 68–79.
Rummo-Laes, T.-L. (2009). Täiskasvanute õppimisvõimalused ja -valmidus. – Täiskasvanute koolitus. Adult Education. Tallinn: Statistikaamet, lk 6–17.
Robst, J. (2007). Education, College Major, and Job Match: Gender Differences in Reasons for Mismatch. – Education Economics, Vol 15, No 2, pp. 159–175.
Sicherman, N. (1991). “Overeducation“ in the Labor Market. – Journal of Labor Economics, Vol 9, No 2, pp. 101–122.
Skill mismatch: identifying priorities for future research. Cedefop working paper No 3. Thessaloniki. (2009). Cedefop [www] http://www.cedefop.europa.eu/EN/publications/5987.aspx (05.09.2011).
Skill Mismatch in Europe. Briefing note. (2010). Cedefop [www] http://www.cedefop.europa.eu/EN/news/16114.aspx (05.09.2011).
Tööjõuvajaduse prognoos aastani 2017. (2010). Majandus- ja Kommunikatsiooniministeerium. [www] http://www.mkm.ee/public/Toojouvajaduse_prognoos_aastani_2017.pdf (05.09.2011).
HARIDUSE PEEGELDUS TÄISKASVANUEAS REFLECTION OF EDUCATION IN ADULTHOOD
MEHE KODU ON MAAILM, NAISE MAAILM ON KODU? MAN’S HOME IS THE WORLD, WOMAN’S WORLD IS HER HOME? 121
Wtte, J. C., Kalleberg, A. L. (1995). Matching Training and Jobs: The Fit between Vocational Education and Employment in the German Labour Market. – European Sociological Review, Vol 11, No 3, pp. 293–317.
Wolbers, H. J. (2003). Job Mismatches and their Labour-Market Effects among School-Leavers in Europe. – European Sociological Review, Vol 19, No 3, pp. 249–266.
HARIDUSE PEEGELDUS TÄISKASVANUEAS REFLECTION OF EDUCATION IN ADULTHOOD
MEHE KODU ON MAAILM, NAISE MAAILM ON KODU? MAN’S HOME IS THE WORLD, WOMAN’S WORLD IS HER HOME? 122
REFLECTION OF EDUCATION IN ADULTHOOD
Karolin Kõrreveski
Introduction
Nowadays, learning does not end after graduating from high school or university, but people continue learning at work and in their spare time. Continuous self-education is needed in order to successfully compete in the labour market. The demand for educated workforce has increased and the supply of educated workforce has grown as well. Similarly to other countries with a lot of educated workforce, the Estonian labour market is highly competitive. Approximately 90% of Estonia's labour force has at least secondary education and 37% has higher education. Compared to men, women’s educational level is higher, which is a well-known fact. How is it reflected in working life and can women’s more active participation in education be noticed also in adult learning?
The article concentrates firstly on whether men’s and females’ educational level corresponds to the requirements set for their jobs and whether they are either over- or undereducated for their jobs. Previous research has shown that around 13% of the employed work in a position that requires a lower educational level (Paulus 2007; Lamo and Messina 2010). The second half of the article deals with lifelong learning of adults. It analyses whether the mismatch between educational level and job can be reduced by participation in adult learning. It can be assumed that men would try to compensate for their lower level of education by attending work related courses more often than women. What do the results of the Labor Force Survey of 2010 show us?
Under- and overeducation in the labour market
Lots of jobs with low qualification requirements have disappeared due to technological development, while lots of new jobs have increasingly higher requirements for specialised knowledge. It is estimated that, by the year 2020, higher education will be required in approximately 30% of all jobs in Europe and one third of labour force does indeed meet this criterion (Skill … 2010: 1). In the light of this forecast, the future does not seem that bleak. However, the challenge of modern society lies elsewhere. It is difficult to find employees with adequate skills and knowledge for particular jobs from this educated labour force (Skill … 2010: 1). Educated persons do not necessarily have the knowledge or skills desired by employers, leading to discrepancies in the labour market (Kutseoskuste … 2010). Approximately 37% of Estonian labour force currently has tertiary education. At the same time, foreign investors in Estonia have complained in public discussions about the lack of good professional skills (Pilvinski 2010). Similarly, the labour demand forecast until 2017 of the Ministry of Economic Affairs and Communications indicates a slightly higher future demand for workforce with vocational education (Tööjõuvajaduse … 2010).
Job-education mismatch creates a lot of important negative consequences for employees, employers and the society in general. If a person’s job is not adequate for his or her abilities, this could lead to dissatisfaction and a drop in motivation, which is manifested in a lack of productivity. Similarly, work performance suffers when job duties exceed a person’s abilities. Overeducation is often associated with wage penalty, while undereducation requires higher investment in employee training from employers. Such a situation facilitates labour turnover and increases the risk of unemployment. An estimated 30% of European workforce is overeducated (Skill … 2010: 1). The high educational level of workforce is not a problem in itself, but a problem emerges when people are unable to utilise their skills and knowledge effectively and to an optimum extent. If highly educated persons do not find jobs corresponding to their education, they often accept positions requiring lower educational level in order to avoid unemployment. However, this complicates the situation for people with lower levels of education, who are forced
HARIDUSE PEEGELDUS TÄISKASVANUEAS REFLECTION OF EDUCATION IN ADULTHOOD
MEHE KODU ON MAAILM, NAISE MAAILM ON KODU? MAN’S HOME IS THE WORLD, WOMAN’S WORLD IS HER HOME? 123
to work in even less remunerative and unstable positions and could be completely frozen out of the labour market in the end (Philips and Loova 2005). As a long-term situation of over- or undereducation causes economic and social losses, it is important to analyse the extent of job-education mismatch in Estonia. In the following, we will focus on gender-specific differences in the context of over- or undereducation.
What exactly constitutes a mismatch between education and work and how can it be measured? Theorists differentiate between vertical and horizontal mismatches between education and work (Skill … 2010: 1). Vertical incoherence is a situation where the employee’s educational level does not meet the requirements of the job. Horizontal mismatch means that the person’s acquired field of education, rather than the level, does not fit the profession. Three methods are used to measure over- and undereducation, or the vertical mismatch (Ramos et al. 2008; Skill … 2009). Firstly, education requirements of a job are compared with the education of the employee (the so-called objective method). Secondly, employees’ own assessments of the match between their education and job are analysed (the so-called subjective method). The third method is based on determining the average level of education for a particular position and then looking at the difference between the actual education of an employee and the average level (the so-called statistical method). This article relies on the subjective method, i.e., it analyses data on the vertical mismatch between education and employment on the basis of employee assessments collected in the Labour Force Survey (LFS).
Various studies have indicated that the mismatch between education and work affects, in particular, younger workers, ageing workers, and women (Skill … 2009). According to the career mobility theory, people entering the labour market often agree to work in positions requiring lower educational level in order to gain experience and facilitate subsequent movement to higher positions (Sicherman 1991, Marchante et al. 2007); as a result, overeducation is common among people who have recently graduated from a higher school. Finding their first job is especially difficult for young people during the contraction phase of the economic cycle, when employers reduce recruitment levels or prefer experienced older candidates. The severe global financial and economic crisis that started in 2008 clearly demonstrated that young people constitute a major disadvantaged group in the labour market. Between 2008 and 2010, the unemployment rate of young people (15–24 years of age) jumped from 12% to a record high of 32.9%. To avoid unemployment, young people are not basing their job search on their acquired level or type of education. In 2010, only 16% of young people were looking for a job corresponding to their educational level, while 84% were willing to accept a job requiring lower educational level according to the Estonian LFS.
The likelihood of finding a job that matches a person’s level of education increases with age, but only to a certain limit. Studies have indicated (Brunello 2008, cit. via Skill … 2009: 12) that the mismatch between education and work is bigger again after the age of 50. For instance, Wolbers (2003) and Witte and Kalleberg (1995) have observed that the share of overeducated persons among the employed increases with age; this could be explained by the theory of technological change. Older people, whose skills and knowledge are not necessarily keeping pace with technological developments in a fluid labour market, are prepared to accept jobs requiring education below their actual level of education (Paulus 2007). At the same time, an opposite trend has been noticed – the possibility of being undereducated for a position increases with age, as experiences are valued more than university diplomas (Sicherman 1991). According to the human capital theory, work experience and acquired level of education are mutually interchangeable (Marchante et al. 2007). It means that older people are able to compensate for their lower level of education with work experience, which enables them to work in positions requiring higher educational level, while being actually undereducated.
According to the 2010 LFS, the shares of over- and undereducated people are relatively low in Estonia, with 3% of employees being undereducated and 12% being overeducated. Likewise, according to the surveys conducted in other countries, the risk of being overeducated is more prevalent among women (Paulus 2007). On average, every tenth man and every sixth woman is overeducated in Estonia. Considering the fact that women’s path of education lasts longer and
HARIDUSE PEEGELDUS TÄISKASVANUEAS REFLECTION OF EDUCATION IN ADULTHOOD
MEHE KODU ON MAAILM, NAISE MAAILM ON KODU? MAN’S HOME IS THE WORLD, WOMAN’S WORLD IS HER HOME? 124
there are more women than men among persons having attained tertiary education, the possibility of being overeducated is indeed greater for women. At the same time, undereducation is twice as prevalent among men. Approximately 4% of men and 2% of women in Estonia are undereducated. An adequate match between education and work is more common among men than among women. 87% of men and 84% of women state that their job corresponds to their education. Men and women are prepared, for varying reasons, to accept jobs that do not match their education. It is often assumed that men are career-oriented. Men often make their decisions based on salary figures and promotion prospects, while women primarily tend to consider opportunities for balancing work and family life (Robst 2007). However, women’s career advancement ambitions cannot be underestimated and, nowadays, women’s contribution to breadwinning alongside men is quite considerable. In 2010, pay was the main reason for search of a new or additional work among both men and women. However, the share of ambitious persons, who were trying to find a job with a better match with their skills and abilities, was higher among women. The share of persons, who were looking for a job with more convenient working time arrangements for personal or family reasons, was almost equal among men and women i.e. roughly one tenth. (Table 1)
Based on the job-matching theory, higher positions should be occupied by highly educated people and vice versa (Boudarbat and Chernoff 2009). From an employee’s viewpoint, being overeducated is more unfavourable than being undereducated, because it means a loss in potential earnings. Dissatisfaction with work forces overeducated people to search for a job with a better fit with their level of education, i.e., it increases the likelihood of job change. A low level of education usually means a high risk of unemployment. As a result, if an undereducated person has found a job, he or she tends to be satisfied with it, which facilitates his or her staying in the job or in the company (Marchante et al. 2007). The data from the 2010 Estonian LFS indicate that this theory is valid for men. 11% of overeducated men were looking for new or additional work compared to 5% of undereducated men who were looking for new work. However, the situation was reversed in case of women: 8% of overeducated and 9% of undereducated women were searching for new work. (Figure 1)
In 2010, the annual average unemployment rate in Estonia was 16.9%. The unemployment rate increased at a significantly higher pace among men than among women. The risk of unemployment increased the number of unemployed men who were willing to accept jobs not corresponding to their level of education. Before recession, a half of unemployed men with post-secondary vocational or higher education were prepared to accept a job requiring lower educational level, but this share increased to around three quarters during the nadir of recession. Women’s willingness to work in positions requiring lower education level decreased drastically in 2008, with women generally hoping for jobs that would fit their education. However, as soon as the following year, nearly 80% of unemployed women with post-secondary vocational or higher education were prepared to accept lower level occupational positions. (Figure 2)
How does a person’s personal life affect his/her position in the labour market? In terms of marital status, women in a relationship are more likely to be overeducated than single women (Robst 2007). As men tend to earn more money, families often choose a place of residence based on job opportunities for men, which imposes geographic restrictions on women’s career choices and they often settle for jobs for which they are overeducated (Malo and Blazquesz 2004). At the same time, single persons do not depend on their partner and this expands their range of choices in the search for a suitable job. No such trends have been observed in Estonia. In the LFS, the best match between education and work was observed in the case of women in marriage or in cohabitation. Overeducation is most prevalent (18%) among divorced, separated or widowed women. The share of undereducated women is the largest (4%) among single women. There are no differences between single men and men in relationship, because both groups included 87% of those whose work matched their level of education. (Figure 3)
In Estonia, the number of overeducated people increases and the number of undereducated people decreases with age. There is a sudden upsurge in overeducation in the group of people over 64 years of age. 16% of people aged 50–64 are overeducated, but among those aged 65 or
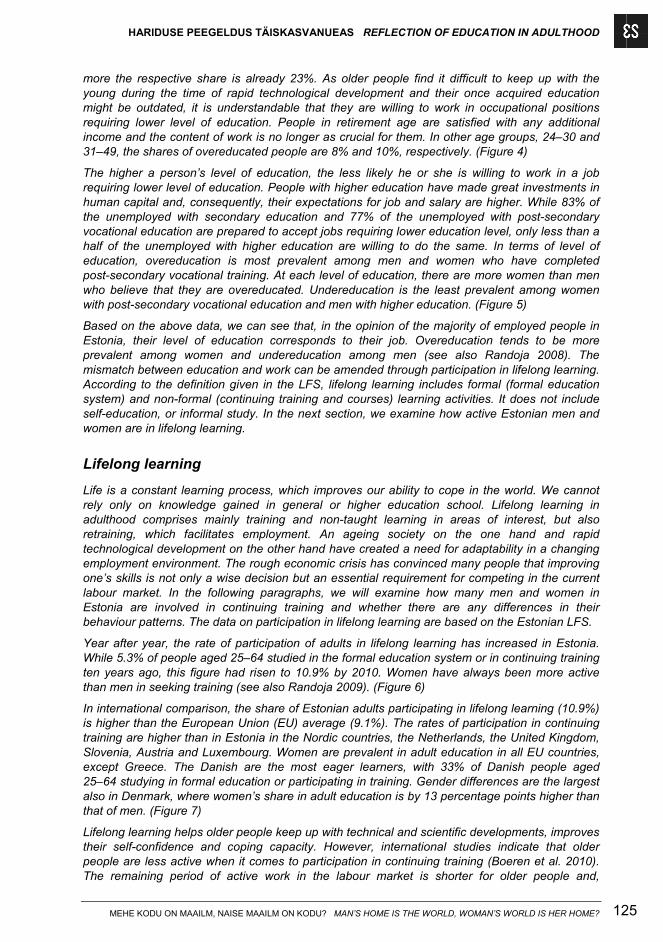
HARIDUSE PEEGELDUS TÄISKASVANUEAS REFLECTION OF EDUCATION IN ADULTHOOD
MEHE KODU ON MAAILM, NAISE MAAILM ON KODU? MAN’S HOME IS THE WORLD, WOMAN’S WORLD IS HER HOME? 125
more the respective share is already 23%. As older people find it difficult to keep up with the young during the time of rapid technological development and their once acquired education might be outdated, it is understandable that they are willing to work in occupational positions requiring lower level of education. People in retirement age are satisfied with any additional income and the content of work is no longer as crucial for them. In other age groups, 24–30 and 31–49, the shares of overeducated people are 8% and 10%, respectively. (Figure 4)
The higher a person’s level of education, the less likely he or she is willing to work in a job requiring lower level of education. People with higher education have made great investments in human capital and, consequently, their expectations for job and salary are higher. While 83% of the unemployed with secondary education and 77% of the unemployed with post-secondary vocational education are prepared to accept jobs requiring lower education level, only less than a half of the unemployed with higher education are willing to do the same. In terms of level of education, overeducation is most prevalent among men and women who have completed post-secondary vocational training. At each level of education, there are more women than men who believe that they are overeducated. Undereducation is the least prevalent among women with post-secondary vocational education and men with higher education. (Figure 5)
Based on the above data, we can see that, in the opinion of the majority of employed people in Estonia, their level of education corresponds to their job. Overeducation tends to be more prevalent among women and undereducation among men (see also Randoja 2008). The mismatch between education and work can be amended through participation in lifelong learning. According to the definition given in the LFS, lifelong learning includes formal (formal education system) and non-formal (continuing training and courses) learning activities. It does not include self-education, or informal study. In the next section, we examine how active Estonian men and women are in lifelong learning.
Lifelong learning
Life is a constant learning process, which improves our ability to cope in the world. We cannot rely only on knowledge gained in general or higher education school. Lifelong learning in adulthood comprises mainly training and non-taught learning in areas of interest, but also retraining, which facilitates employment. An ageing society on the one hand and rapid technological development on the other hand have created a need for adaptability in a changing employment environment. The rough economic crisis has convinced many people that improving one’s skills is not only a wise decision but an essential requirement for competing in the current labour market. In the following paragraphs, we will examine how many men and women in Estonia are involved in continuing training and whether there are any differences in their behaviour patterns. The data on participation in lifelong learning are based on the Estonian LFS.
Year after year, the rate of participation of adults in lifelong learning has increased in Estonia. While 5.3% of people aged 25–64 studied in the formal education system or in continuing training ten years ago, this figure had risen to 10.9% by 2010. Women have always been more active than men in seeking training (see also Randoja 2009). (Figure 6)
In international comparison, the share of Estonian adults participating in lifelong learning (10.9%) is higher than the European Union (EU) average (9.1%). The rates of participation in continuing training are higher than in Estonia in the Nordic countries, the Netherlands, the United Kingdom, Slovenia, Austria and Luxembourg. Women are prevalent in adult education in all EU countries, except Greece. The Danish are the most eager learners, with 33% of Danish people aged 25–64 studying in formal education or participating in training. Gender differences are the largest also in Denmark, where women’s share in adult education is by 13 percentage points higher than that of men. (Figure 7)
Lifelong learning helps older people keep up with technical and scientific developments, improves their self-confidence and coping capacity. However, international studies indicate that older people are less active when it comes to participation in continuing training (Boeren et al. 2010). The remaining period of active work in the labour market is shorter for older people and,
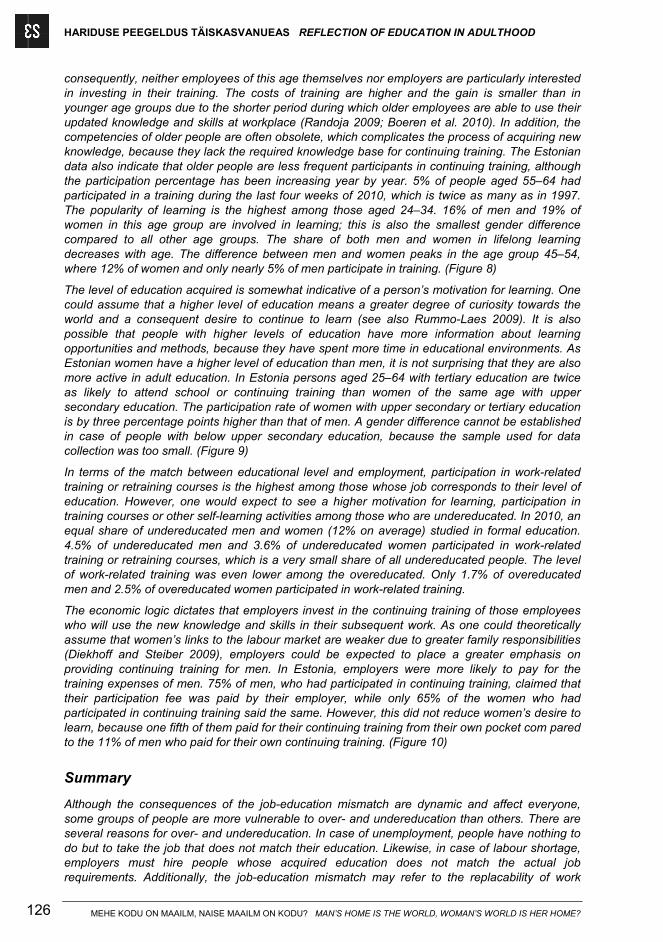
HARIDUSE PEEGELDUS TÄISKASVANUEAS REFLECTION OF EDUCATION IN ADULTHOOD
MEHE KODU ON MAAILM, NAISE MAAILM ON KODU? MAN’S HOME IS THE WORLD, WOMAN’S WORLD IS HER HOME? 126
consequently, neither employees of this age themselves nor employers are particularly interested in investing in their training. The costs of training are higher and the gain is smaller than in younger age groups due to the shorter period during which older employees are able to use their updated knowledge and skills at workplace (Randoja 2009; Boeren et al. 2010). In addition, the competencies of older people are often obsolete, which complicates the process of acquiring new knowledge, because they lack the required knowledge base for continuing training. The Estonian data also indicate that older people are less frequent participants in continuing training, although the participation percentage has been increasing year by year. 5% of people aged 55–64 had participated in a training during the last four weeks of 2010, which is twice as many as in 1997. The popularity of learning is the highest among those aged 24–34. 16% of men and 19% of women in this age group are involved in learning; this is also the smallest gender difference compared to all other age groups. The share of both men and women in lifelong learning decreases with age. The difference between men and women peaks in the age group 45–54, where 12% of women and only nearly 5% of men participate in training. (Figure 8)
The level of education acquired is somewhat indicative of a person’s motivation for learning. One could assume that a higher level of education means a greater degree of curiosity towards the world and a consequent desire to continue to learn (see also Rummo-Laes 2009). It is also possible that people with higher levels of education have more information about learning opportunities and methods, because they have spent more time in educational environments. As Estonian women have a higher level of education than men, it is not surprising that they are also more active in adult education. In Estonia persons aged 25–64 with tertiary education are twice as likely to attend school or continuing training than women of the same age with upper secondary education. The participation rate of women with upper secondary or tertiary education is by three percentage points higher than that of men. A gender difference cannot be established in case of people with below upper secondary education, because the sample used for data collection was too small. (Figure 9)
In terms of the match between educational level and employment, participation in work-related training or retraining courses is the highest among those whose job corresponds to their level of education. However, one would expect to see a higher motivation for learning, participation in training courses or other self-learning activities among those who are undereducated. In 2010, an equal share of undereducated men and women (12% on average) studied in formal education. 4.5% of undereducated men and 3.6% of undereducated women participated in work-related training or retraining courses, which is a very small share of all undereducated people. The level of work-related training was even lower among the overeducated. Only 1.7% of overeducated men and 2.5% of overeducated women participated in work-related training.
The economic logic dictates that employers invest in the continuing training of those employees who will use the new knowledge and skills in their subsequent work. As one could theoretically assume that women’s links to the labour market are weaker due to greater family responsibilities (Diekhoff and Steiber 2009), employers could be expected to place a greater emphasis on providing continuing training for men. In Estonia, employers were more likely to pay for the training expenses of men. 75% of men, who had participated in continuing training, claimed that their participation fee was paid by their employer, while only 65% of the women who had participated in continuing training said the same. However, this did not reduce women’s desire to learn, because one fifth of them paid for their continuing training from their own pocket com pared to the 11% of men who paid for their own continuing training. (Figure 10)
Summary
Although the consequences of the job-education mismatch are dynamic and affect everyone, some groups of people are more vulnerable to over- and undereducation than others. There are several reasons for over- and undereducation. In case of unemployment, people have nothing to do but to take the job that does not match their education. Likewise, in case of labour shortage, employers must hire people whose acquired education does not match the actual job requirements. Additionally, the job-education mismatch may refer to the replacability of work
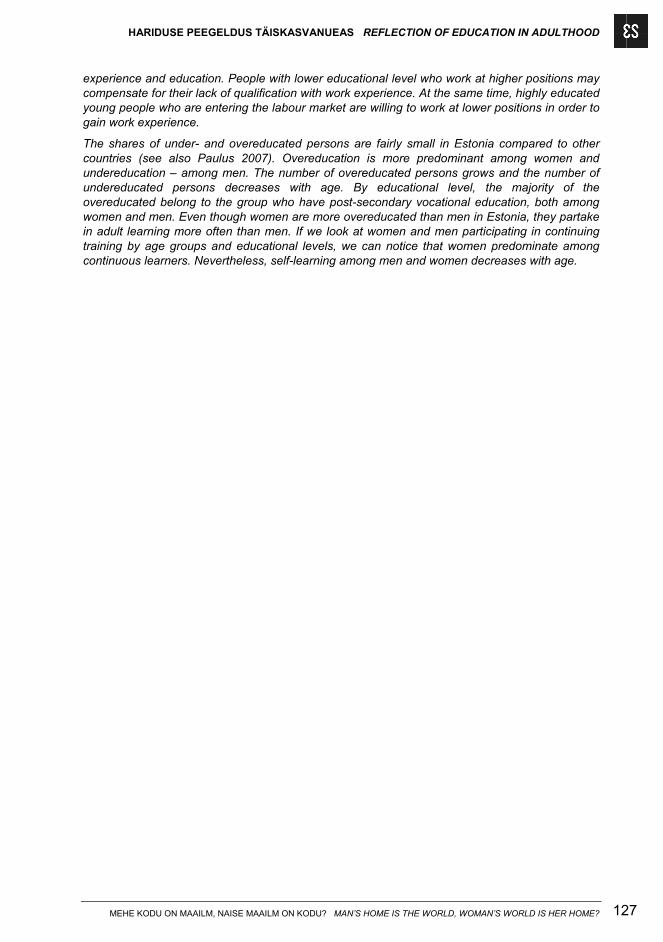
HARIDUSE PEEGELDUS TÄISKASVANUEAS REFLECTION OF EDUCATION IN ADULTHOOD
MEHE KODU ON MAAILM, NAISE MAAILM ON KODU? MAN’S HOME IS THE WORLD, WOMAN’S WORLD IS HER HOME? 127
experience and education. People with lower educational level who work at higher positions may compensate for their lack of qualification with work experience. At the same time, highly educated young people who are entering the labour market are willing to work at lower positions in order to gain work experience.
The shares of under- and overeducated persons are fairly small in Estonia compared to other countries (see also Paulus 2007). Overeducation is more predominant among women and undereducation – among men. The number of overeducated persons grows and the number of undereducated persons decreases with age. By educational level, the majority of the overeducated belong to the group who have post-secondary vocational education, both among women and men. Even though women are more overeducated than men in Estonia, they partake in adult learning more often than men. If we look at women and men participating in continuing training by age groups and educational levels, we can notice that women predominate among continuous learners. Nevertheless, self-learning among men and women decreases with age.

MEHE KODU ON MAAILM, NAISE MAAILM ON KODU? MAN’S HOME IS THE WORLD, WOMAN’S WORLD IS HER HOME? 128
MÄRKIDE SELETUS
EXPLANATION OF SYMBOLS
X andmete avaldamist ei võimalda andmekaitse põhimõte data are confidential
– nähtust ei esinenud magnitude nil
0 näitaja väärtus väiksem kui pool kasutatud mõõtühikust 0,0 magnitude less than half of the unit employed
… andmeid ei ole saadud või need on avaldamiseks ebakindlad data not available or too uncertain for publication
.. mõiste pole rakendatav category not applicable