Embed Size (px)
Citation preview

Guided by: Dr. Shital Butani
Prepared by: Dhara Patel
14MPH103
2
Introduction
Importance
Level of correlation
Parameters
Correlation method
Stages of IVIVC model development
Application
Future aspects
Reference

3
In IVIVC, "C" denotes "Correlation", which means "the
degree of relationship between two variables".
Correlation deals with the "tightness" in how two variables
vary together. This term does not limit a relationship to only
the linear type, but allows for non-linear relationships as
well.
Conceptually, IVIVC describes a relationship between the in
vitro dissolution / release versus the in vivo absorption.
4
The Food and Drug Administration (FDA) defines
“A predictive mathematical model describing the relationship
between an in-vitro property of a dosage form and an in-vivo
response”.
The United States Pharmacopoeia (USP) also defines
“The establishment of a relationship between a biological
property, or a parameter derived from a biological property
produced from a dosage form, and a physicochemical property of
the same dosage form”.

5
To serve as a surrogate for in vivo bioavailability.
To support biowaivers for bioequivalence testing.
To validate the use of dissolution methods and set the dissolution
specifications.
IVIVC proves an important research tool in the development of drug delivery
systems.
The IVIVC model facilitates the rational development & evaluation of
immediate or extended release dosage forms. Hence it acts as a tool for
formulation screening.
To assist quality control for certain scale-up and post-approval changes
(SUPAC).

6
It can be achieved usingo Pharmacological correlations based on clinical observations.
o Semi quantitative correlations based on the drug blood levelsor urinary excretion data.
o Quantitative correlations arising from absorption kinetics andcalculation of in vivo dissolution rate and absorption rateconstants.
Establishing an IVIVC is nothing more complicated thantrying to reproduce all the complex phenomena thatlead to the in vivo release and solubilization of the APIin the gut in a “simple” in vitro system like a vesselagitated with a paddle.

7
In vitro dissolution parameters In vivo plasma data parameters
Time for specific amount of drug to
dissolve (e.g. 50% of the dose)
Amount dissolved at a specific time point
Mean dissolution time
Parameter estimated after modeling the
dissolution process
AUC, Cmax
Fraction absorbed, absorption rate constant
Ka
Mean residence time, mean dissolution time,
mean absorption time
Concentration at time t, amount absorbed at
time t
Linear relationship between dissolution parameters and plasma level data are established.
Parameters used for correlating
In Vitro Dissolution with Plasma Data
8
Dissolution parameters are correlated to the amount of drug
excreted unchanged in the urine, cumulative amount of drug
excreted as a function of time, etc.
An acute pharmacological effect such as LD50 in animals is
related to any of the dissolution parameters.

9
Complexity of the delivery
system.
Composition of formulation.
Physicochemical properties of
drug.
Dissolution method
Method of manufacture

10
• The mean time for which the drug resides in the body. Also known as mean transit time.
• MRT = AUMC / AUC
• where, AUMC = Area under first moment Curve (Concentration*time Vs time)
• AUC = Area under curve (Concentration Vs time)
• Both AUMC & AUC can be obtained by using Trapezoidal rule.
Mean Residence Time:
• The mean time required for drug to reach systemic circulation from the time of drug administration.
• MAT = MRT oral – MRT i.v.
Mean Absorption Time:
• It reflects the mean time for drug to dissolve in-vivo. For solid dosage form:
• MDT solid = MRT solid – MRT solution
Mean In-vivo Dissolution Time:
• % PE = [(Observed value – Predicted value) / Observed value] x 100
Percent Prediction Error:

11
Level A
• Most informative & recommended
Level B
• Least useful in regulatory purpose
Level C
• Useful for early stages of formulation development
Multiple
Level C
• Useful as Level A

12
It is defined as a hypothetical model describing the relationship between a fraction of drug absorbed and fraction of drug dissolved.
In order to develop a correlation between two parameters one variable should be common between them.
The data available is in vitro dissolution profile and in vivo plasma drug concentration profile whose direct comparison is not possible.
To have a comparison between these two data, data transformation is required.
It is considered as a predictive model for relationship between the entire in vitro release time courses.
Level A Level B Level C Multiple C

13
Most commonly a linear correlation exists but sometimes non-linear In vitro-
in vivo correlation may prove appropriate.
MATHS TOOL:
o In vivo – deconvolution of plasma profile( wagner- nelson, loo-riegelman,
numeric deconvolution)
o In vitro – weibull, hill or simple interpolation
Model-dependant
oBased on the mass balance among the pharmacokinetic compartments
(e.g. Wagner-Nelson, Loo-Riegelman)
Model-independant
oBased on Theory of Linear System Analysis (Convolution /
Deconvolution)
Level A Level B Level C Multiple C

14
Advantages:
1. A point to point correlation is developed. The in vitro dissolution curve serves as asurrogate for in vivo performance. Any change in manufacturing procedure or modificationin formula can be justified without the need for additional human studies.
2. The in vivo dissolution serves an in vivo indicating quality control procedure for predictingdosage form’s performance.
Level A Level B Level C Multiple C
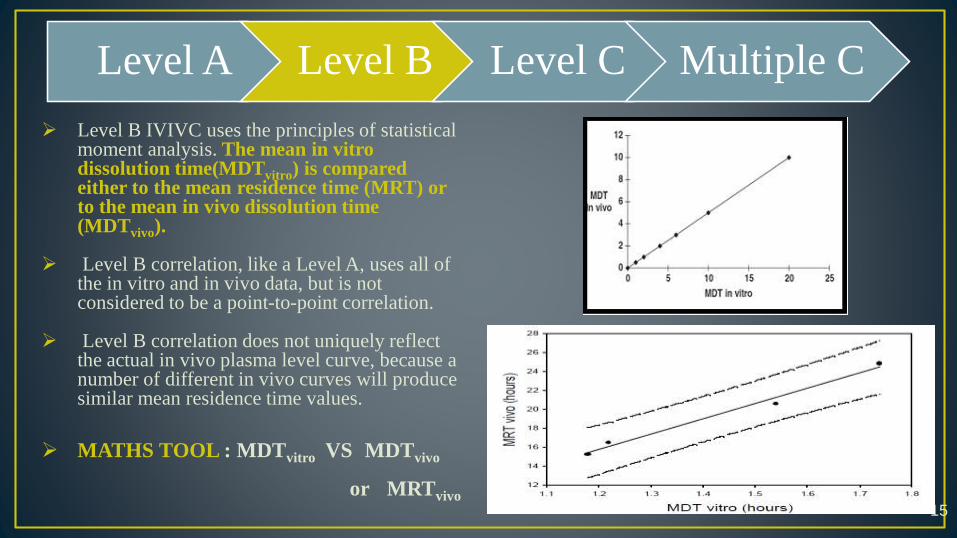
Level B IVIVC uses the principles of statistical moment analysis. The mean in vitro dissolution time(MDTvitro) is compared either to the mean residence time (MRT) or to the mean in vivo dissolution time (MDTvivo).
Level B correlation, like a Level A, uses all of the in vitro and in vivo data, but is not considered to be a point-to-point correlation.
Level B correlation does not uniquely reflect the actual in vivo plasma level curve, because a number of different in vivo curves will produce similar mean residence time values.
MATHS TOOL : MDTvitro VS MDTvivo
or MRTvivo15
Level A Level B Level C Multiple C

In this level of correlation, one dissolution
time point (t50%, t90%, etc.) is compared
to on mean pharmacokinetic parameter
such as AUC, t max or C max.
It represents a single point correlation and
doses not reflect the entire shape of the
plasma drug concentration curve.
Level C correlations can be useful in the early
stages of formulation development when pilot
formulations are being selected.
While the information may be useful in
formulation development, biowaiver is
generally not possible.
16
Level A Level B Level C Multiple C

A multiple level C correlation relates one or several pharmacokinetic parameters ofinterest (Cmax, AUC, or any other suitable parameters) to the amount of drugdissolved at several time points of the dissolution profile.
A multiple point level C correlation may be used to justify a bio waiver, provided thatthe correlation has been established over the entire dissolution profile with one or morepharmacokinetic parameters of interest.
If such a multiple level C correlation is achievable, then the development of a level Acorrelation is also likely.
A multiple Level C correlation should be based on at least three dissolution time pointscovering the early, middle, and late stages of the dissolution profile.
17
Level A Level B Level C Multiple C

Level In vitro In vivo
A Dissolution curve Input (absorption) curves
B Statistical Moments: MDTStatistical Moments: MRT,
MAT
C
Disintegration time,
Time to have 10, 50, 90%
Dissolved,
Dissolution rate,
Dissolution efficiency
Cmax,
Tmax,
Ka,
Time to have 10, 50, 90%
absorbed,
AUC (total or cumulative)18

19
Developed formulation with different release rate like slow, medium ,fast
In-vitro dissolution profile In- vivo plasma concentration
Predict plasma concentration from in vitro profile using a LINK MODEL
Do not involve DECONVOLUTION
Estimate in vivo absorption / dissolution time for each formulation
Establish LINK model between in vivo & in vitro variable
Predict plasma concentration from in vitro data using LINK model
One step approach Two step approach

20

1 . Quantitative correlation: o In vivo parameter-y, in vitro-x, y = mx +c.
oPearson product-moment correlation coefficient, r (-1 to +1) quantify strength of relationship between x & y.
oPearson's correlation reflects the degree of linear relationship between two variables.
PMCC = Product-Moment Correlation Coefficient
21
Measurement
of Pearson
PMCC
Symbol
In a Population rho (ρ)
In a Sampler or "Pearson's
r."
Correlation between
variablesLinear relationship
+1 Perfect Positive
-1 Perfect Negative
0 No Linear Relationship

2 . Rank order correlation:
oSpearman rank correlation
oValues of the two variables are ranked in ascending or descending
order. Rank order correlations are qualitative and are not
considered useful for regulatory purposes.
22

Correlation Methods
• Simple point type
• Comparison of profiles
• Direct differential equation-based IVIVC
23

Simple point type:
• The percentage of drug dissolved in a given time or the time taken for a certain percentage of drug to be dissolved, is correlated with a certain parameter of the bioavailability.
• Since the selection of these correlative points usually is arbitrary, the interpretation of the results can be misleading.
Comparison of Profiles:
• The entire in vivo response time profile can be correlated to the complete dissolution rate time curve.
• More preferable method to develop dissolution tests that predict reliably the time course of the in vivo behavior of the drug.
Differential Equation-Based IVIVC
• A novel method is proposed that directly relates the time-profiles of in-vitro dissolution rates and in-vivo plasma concentrations by using one- or multi-compartment pharmacokinetic models and a corresponding system of differential equations that allows for time scaling and time shifting.
• A multiplying factor for the variability of absorption conditions as the drug moves along can also incorporated. By avoiding the integral transforms used in the existing deconvolution- or convolution-based IVIVC models, the present method can provide increased transparency, improved performance, and greater modelling flexibility.
24

Human data should be supplied for regulatory consideration of an IVIVC.
Bioavailability studies for IVIVC development should be performed with
enough subjects to characterize adequately the performance of the drug
product under study. In prior acceptable data sets, the number of subjects
has ranged from 6 to 36.
• Crossover studies are preferred, parallel studies or cross-study analyses
may be acceptable. The latter may involve normalization with a common
reference treatment. The reference product in developing an IVIVC may be
an intravenous solution, an aqueous oral solution, or an immediate release
product.
IVIVCs are usually developed in the fasted state. When a drug is not tolerated
in the fasted state, studies may be conducted in the fed state. 25

Any in vitro dissolution method may be used for dissolution characteristics of theER dosage form. The same system should be used for all formulations tested.
The preferred dissolution apparatus is USP apparatus I (basket) or II (paddle), used at compendially recognized rotation speeds (e.g., 100 rpm for the basketand 50-75 rpm for the paddle). In other cases, the dissolution properties ofsome ER formulations may be determine with USP apparatus III (reciprocatingcylinder) or IV (flow through cell). Appropriate review staff in CDER should beconsulted before using any other type of apparatus.
An aqueous medium, either water or a buffered solution preferably notexceeding pH 6.8, is recommended as the initial medium for development of anIVIVC. Sufficient data should be submitted to justify pH greater than 6.8.
For poorly soluble drugs, addition of surfactant (e.g., 1% sodium lauryl sulfate)may be appropriate. In general, non aqueous and hydroalcoholic systems arediscouraged unless all attempts with aqueous media are unsuccessful.Appropriate review staff in CDER should be consulted before using any othermedia.
26

The dissolution profiles of at least 12 individual dosage units from each lot should be
determined. A suitable distribution of sampling points should be selected to define adequately the
profiles. The coefficient of variation (CV) for mean dissolution profiles of a single batch should
be less than 10 %.
A Level A IVIVC is considered to be the most informative and is recommended, if possible.
Multiple Level C correlations can be as useful as Level A correlations. However, if a multiple
Level C correlation is possible, then a Level A correlation is also likely and is preferred.
Level C correlations can be useful in the early stages of formulation development when pilot
formulations are being selected.
Level B correlations are least useful for regulatory purposes.
Rank order correlations are qualitative and are not considered useful for regulatory purposes.
27
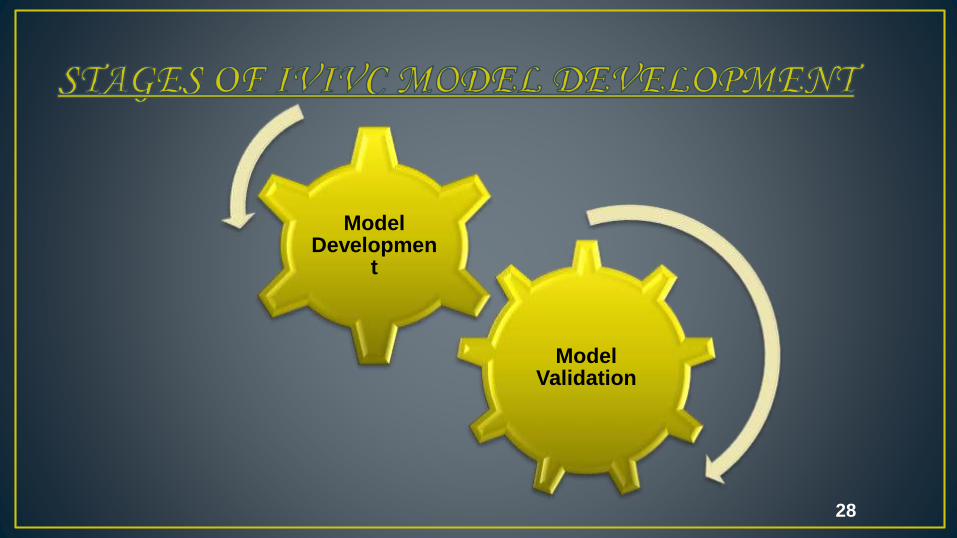
Model Validation
Model Developmen
t
28

The principles of IVIVC model development have been successfully applied to oral
dosage forms.
The rules for developing and validating IVIVC models for novel and non-oral dosage
forms/delivery systems (micro spheres, implants, liposomes, etc) are still unclear today.
For orally administered drugs, IVIVC is expected for highly permeable drugs or drugs
under dissolution rate-limiting conditions, which is supported by BCS.
For extended-release formulations following oral administration, modified BCS
containing the three classes (high aqueous solubility, low aqueous solubility, and variable
solubility) is proposed.
29
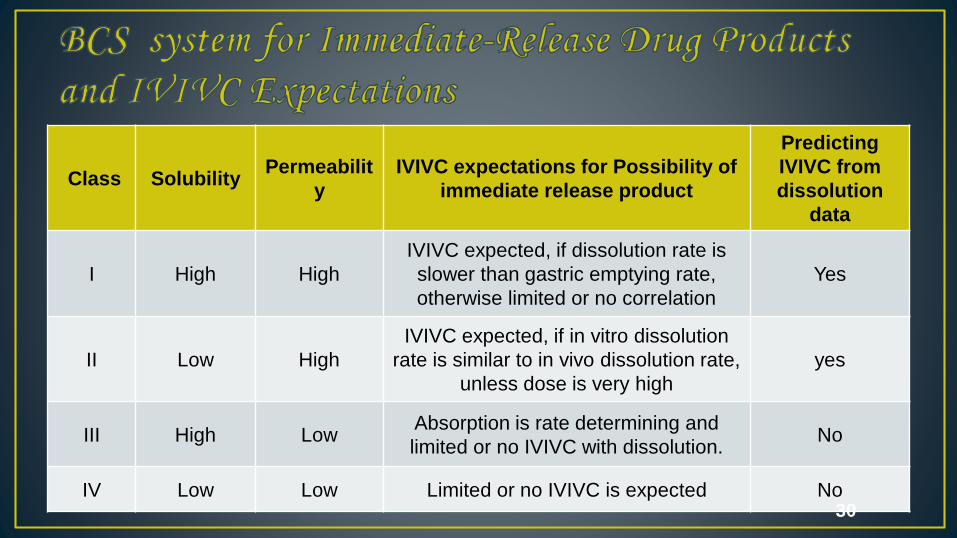
Class SolubilityPermeabilit
y
IVIVC expectations for Possibility of
immediate release product
Predicting
IVIVC from
dissolution
data
I High High
IVIVC expected, if dissolution rate is
slower than gastric emptying rate,
otherwise limited or no correlation
Yes
II Low High
IVIVC expected, if in vitro dissolution
rate is similar to in vivo dissolution rate,
unless dose is very high
yes
III High Low Absorption is rate determining and
limited or no IVIVC with dissolution.No
IV Low Low Limited or no IVIVC is expected No 30

Class Solubility Permeability IVIVC
IaHigh and site
IndependentHigh and site independent
IVIVC Level A
expected
IbHigh and site
Independent
Dependent on site and
narrow absorption window
IVIVC Level C
expected
IIa
Low and site
IndependentHigh and site independent
IVIVC Level A
expected
IIbLow and site
Independent
Dependent on site and
narrow absorption windowLittle or no IVIVC
Va:
acidicVariable Variable Little or no IVIVC
Vb:
BasicVariable Variable
IVIVC Level A
expected
31
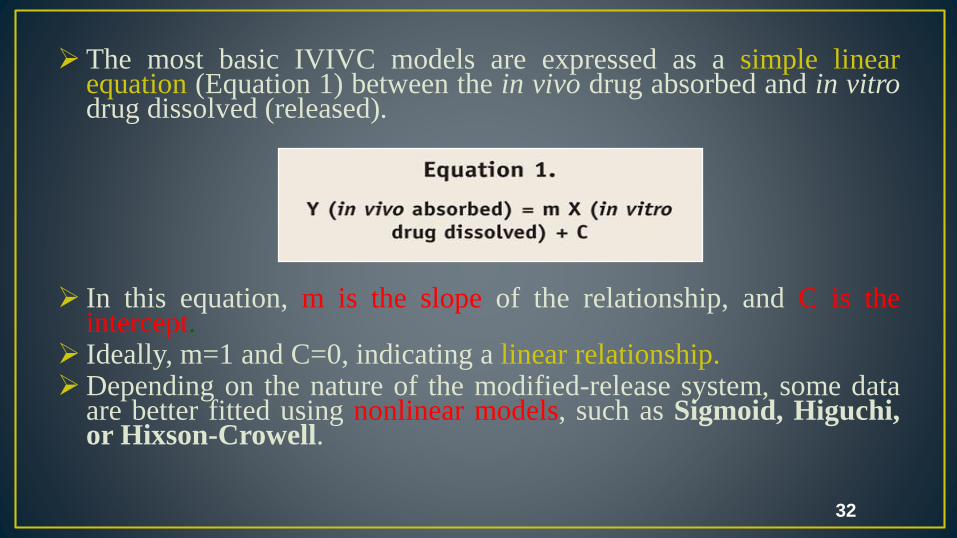
The most basic IVIVC models are expressed as a simple linearequation (Equation 1) between the in vivo drug absorbed and in vitrodrug dissolved (released).
In this equation, m is the slope of the relationship, and C is theintercept.
Ideally, m=1 and C=0, indicating a linear relationship.Depending on the nature of the modified-release system, some data
are better fitted using nonlinear models, such as Sigmoid, Higuchi,or Hixson-Crowell.
32

However, for dosage forms with complicated mechanisms of release(longer duration), in vitro release may not be in the same time scaleas the in vivo release.
Thus, in order to model such data, it is necessary to incorporate time-shifting and time-scaling parameters within the model.
This kind of data is routinely encountered in the development ofsustained-release dosage forms.
In vivo release rate (X’vivo) can also be expressed as a function of invitro release rate (X’rel,vitro) with empirically selected parameters(a, b), as shown in Eq 2.
33

Model Dependent methods
Wagner Nelson Equation
Loo-Riegelman Method
Model Independent methods
Deconvolution
• The numerical deconvolution/convolution method is more general and thus preferred because it does not make any pharmacokinetic model assumptions.
• Using a pharmacokinetic compartmental analysis approach, the in vivo absorption rate can be calculated when the pharmacokinetic parameters of the drug substance are known.
34

• Convolution is the process ofcombined effect of dissolutionand elimination of drug in thebody to reflect blood drugconcentration-time profile(right to left).
• On the other hand, extractingdissolution profiles from blooddrug concentration-time profileis known as the deconvolutionprocess (left to right).
35

Internal Validation
• (using data from the formulations used to build the model)
• validation serves the purpose of providing basis for the acceptability of the model.
External Validation
• (using data obtained from a different (new) formulation)
• External validation is superior and affords greater “confidence” in the model.
36

Using the IVIVC model, for each formulation, the relevant exposure parameters (C
max and AUC) are predicted and compared to the observed values.
Prediction Error (% PE)
= ( Cmax observed – Cmax predicted) * 100
C max observed
= ( AUC observed –AUC predicted ) * 100
AUC observed
The criteria set in the FDA guidance on IVIVC are: For C max and AUC, the mean
absolute % PE should not exceed 10%, and the prediction error for individual
formulations should not exceed 15%.
37

For a new formulation the relevant exposure parameters are predicted using its
in vitro dissolution profile and the IVIVC model and are compared to the
observed parameters.
For C max and AUC, the % PE for the external validation formulation should not
exceed 10%. A prediction error of 10% to 20% indicates inconclusive
predictability and illustrates the need for further study using additional data sets.
For drugs with narrow therapeutic index, external validation is required despite
acceptable internal validation, whereas internal validation is usually sufficient
with non-narrow therapeutic index drugs.38

1. Early Stages of Drug Delivery & Development:
• Proof of Concept
2. Formulation Assessment:
• In Vitro Dissolution
3. Dissolution Specifications
4. Future Biowaivers
5 . IVIVC – Parenteral Drug Delivery
• Burst Release
• Potent Drugs & Chronic Therapy
• Limited volume of tissue fluids and Area of absorption
39
1. Guidance for Industry; Extended Release Oral Dosage Forms: Development, Evaluation, and Application of In Vitro/In Vivo Correlations. www.fda.gov/cder/guidance/index.htm
2. Dissolution, Bioavailability and Bioequivalence by Hamed M. Abdou, Mack Publishing House.
3. IVIVC: Methods and Applications in Modified-Release Product Development; Harald Rettig and Jana Mysicka. Dissolution Technologies | FEBRUARY 2008
4. International Journal of Generic Drugs ISSN 0793 758X US/ Canada
40

41