Embed Size (px)
Citation preview

WHAT IS INVENTORY“Inventory” refers to the stockpile of production a firm is offering for sale and the components that make up the production.

Raw material Purchased but not processed
Work-in-process Undergone some change but not completed A function of cycle time for a product
Maintenance/repair/operating (MRO) Necessary to keep machinery and processes
productive
Finished goods Completed product awaiting shipment
TYPES OF INVENTORY
1. Avoid irregularities in supply.2. Demand met during off production.3. To meet seasonal demand4. Advantage of price discount.5. Maintain continuity to production
FUNCTIONS OF INVENTORY

FIVE CATEGORIES OF STOCKS
1.PIPELINE STOCK2.CYCLE STOCK3.SEASONAL STOCK4.SAFETY STOCK5.OTHER STOCKS

• the unnecessary tie up of the firm’s funds and loss of profit. • excessive carrying cost • the risk of liquidity
DANGERS OF EXCESSIVE INVENTORY

On the other hand, a low level of inventories may result in frequent interruptions in the production schedule resulting in under-utilization of capacity and lower sales

MATERIAL FLOW CYCLE
Input Wait for Wait to Move Wait in queue Setup Run Outputinspection be moved time for operator time time
Cycle time
95% 5%

INVENTORY MANAGEMENT
It is management of materials which include material planning , purchasing ,receiving ,stores ,inventory control ,scrap and surplus disposal
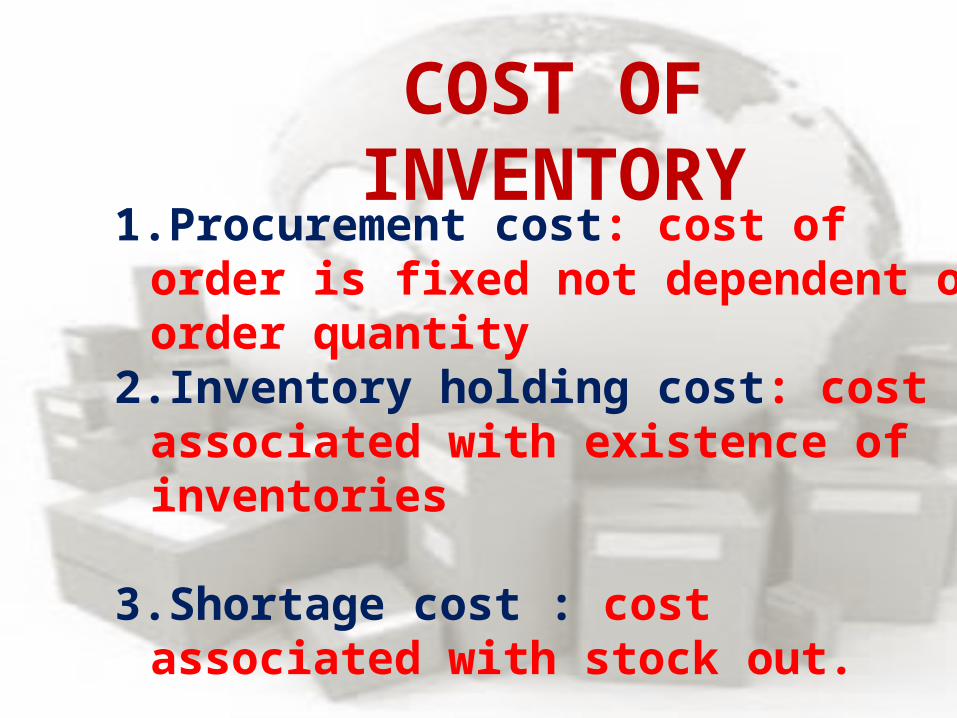
COST OF INVENTORY
1.Procurement cost: cost of order is fixed not dependent on order quantity
2.Inventory holding cost: cost associated with existence of inventories
3.Shortage cost : cost associated with stock out.
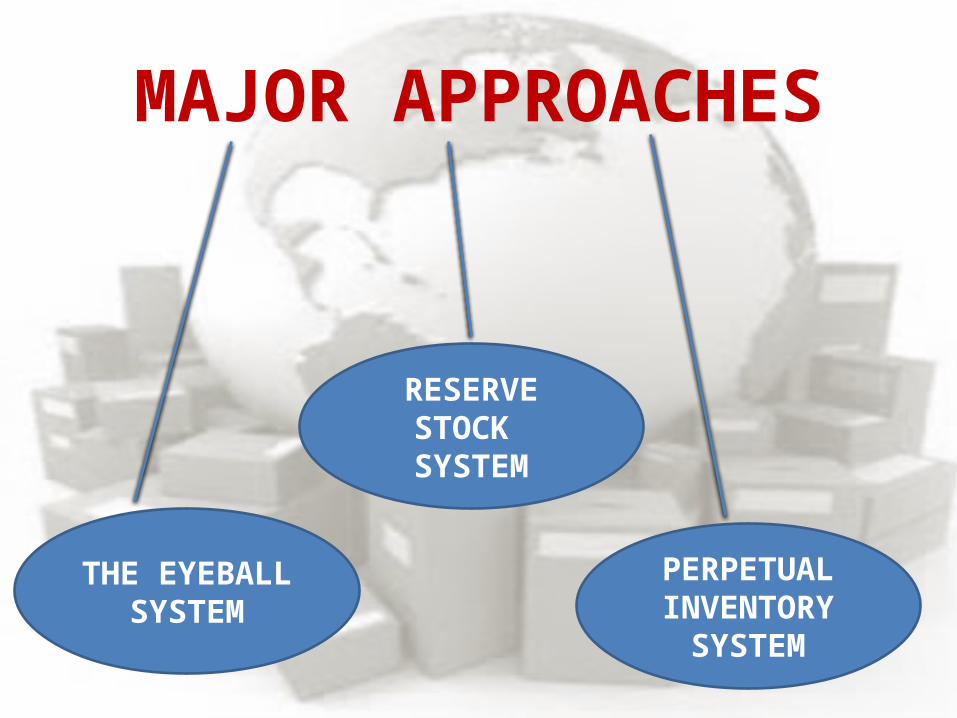
MAJOR APPROACHES
THE EYEBALL SYSTEM
PERPETUAL INVENTORY
SYSTEM
RESERVE STOCK SYSTEM

THE EYEBALL SYSTEM
Standard inventory control system for the vast majority of small retail and many small manufacturing operations and is very simple in application.

RESERVE STOCK SYSTEM
This approach is much more systematic than the eyeball system. It involves keeping a reserve stock of items aside, often literally in a brown bag placed at the rear of the stock bin or storage area
Various types of perpetual inventory systems include manual, card-oriented, and computer- operated systems. In computer-operated systems, programmed instruction referred to commonly as a trigger, automatically transmits an order to the appropriate vendor once supplies fall below a prescribed level
PERPETUAL INVENTORY SYSTEM
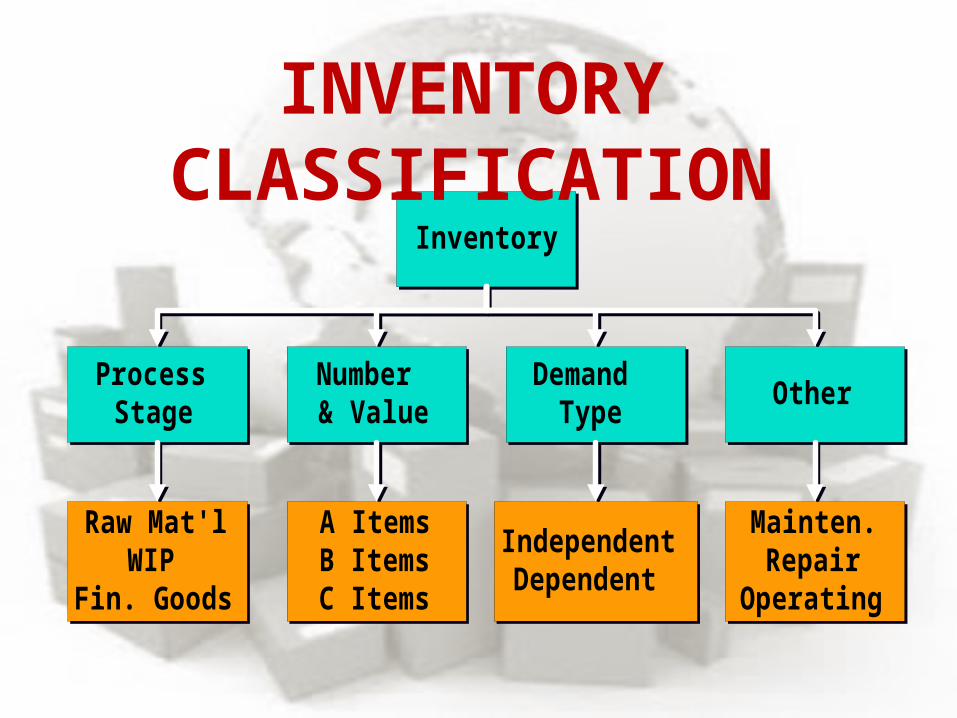
Inventory
ProcessStage
DemandType
Number& Value
Other
Raw Mat'lWIP
Fin. Goods
IndependentDependent
A ItemsB ItemsC Items
Mainten.Repair
Operating
Inventory
ProcessStage
DemandType
Number& Value
Other
Raw Mat'lWIP
Fin. Goods
IndependentDependent
A ItemsB ItemsC Items
Mainten.Repair
Operating
INVENTORY CLASSIFICATION

Divides on-hand inventory into 3 classes A class, B class, C class
Basis is usually annual $ volume $ volume = Annual demand x Unit cost
Policies based on ABC analysis Develop class A suppliers more Give tighter physical control of A items Forecast A items more carefully
ABC ANALYSIS

Item Stock
Number
Percent of Number of
Items Stocked
Annual Volume (units) x
Unit Cost =
Annual Dollar
Volume
Percent of Annual Dollar
Volume Class
#10286 20% 1,000 $ 90.00 $ 90,000 38.8% A
#11526 500 154.00 77,000 33.2% A
#12760 1,550 17.00 26,350 11.3% B
#10867 30% 350 42.86 15,001 6.4% B
#10500 1,000 12.50 12,500 5.4% B
ABC ANALYSIS
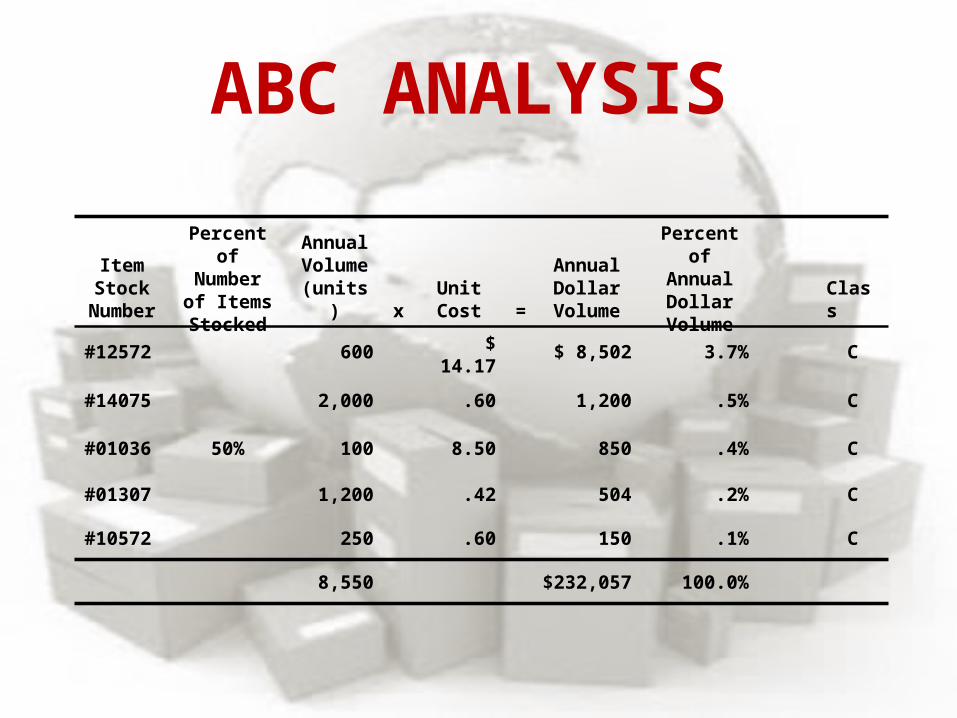
ABC ANALYSIS
Item Stock
Number
Percent of Number of
Items Stocked
Annual Volume (units) x
Unit Cost =
Annual Dollar
Volume
Percent of Annual Dollar
Volume Class
#12572 600 $ 14.17 $ 8,502 3.7% C
#14075 2,000 .60 1,200 .5% C
#01036 50% 100 8.50 850 .4% C
#01307 1,200 .42 504 .2% C
#10572 250 .60 150 .1% C
8,550 $232,057 100.0%
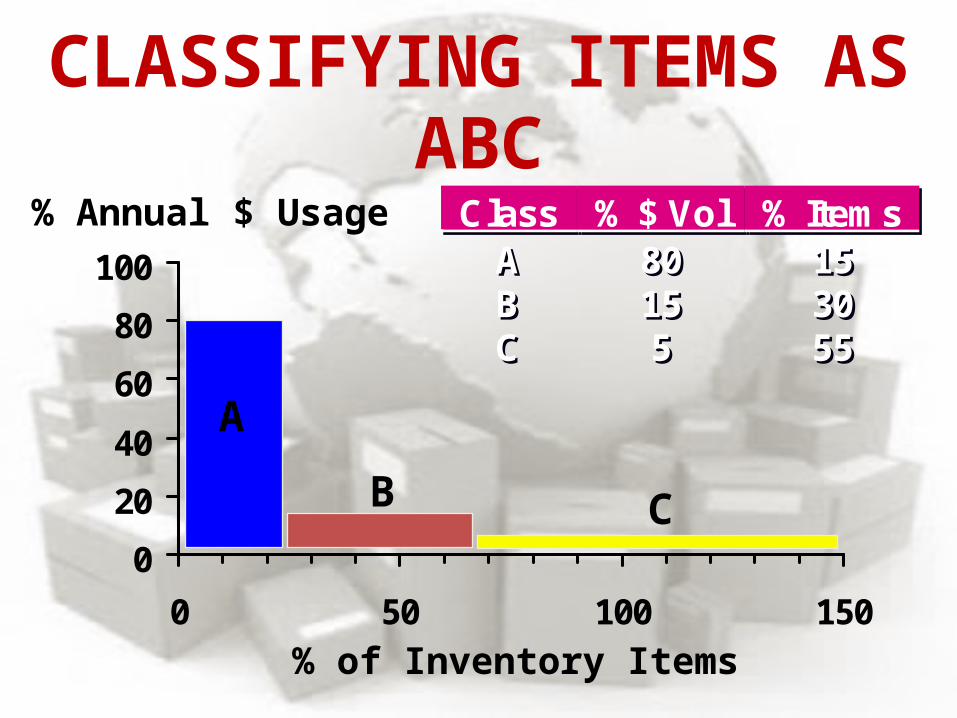
CLASSIFYING ITEMS AS ABC
0
20
40
60
80
100
0 50 100 150
% of Inventory Items
% Annual $ Usage
A
B C
Class % $ Vol % ItemsA 80 15B 15 30C 5 55
Class % $ Vol % ItemsA 80 15B 15 30C 5 55

CYCLE COUNTING• A physical count of items in inventory
• Cycle counting management
– How much accuracy is needed?
– When should cycle counting be performed?
– Who should do it?

CYCLE COUNTING EXAMPLE
5,000 items in inventory, 500 A items, 1,750 B items, 2,750 C itemsPolicy is to count A items every month (20 working days), B items every quarter (60 days), and C items every six months (120 days)
Item Class Quantity Cycle Counting Policy
Number of Items Counted per Day
A 500 Each month 500/20 = 25/day
B 1,750 Each quarter 1,750/60 = 29/day
C 2,750 Every 6 months 2,750/120 = 23/day
77/day
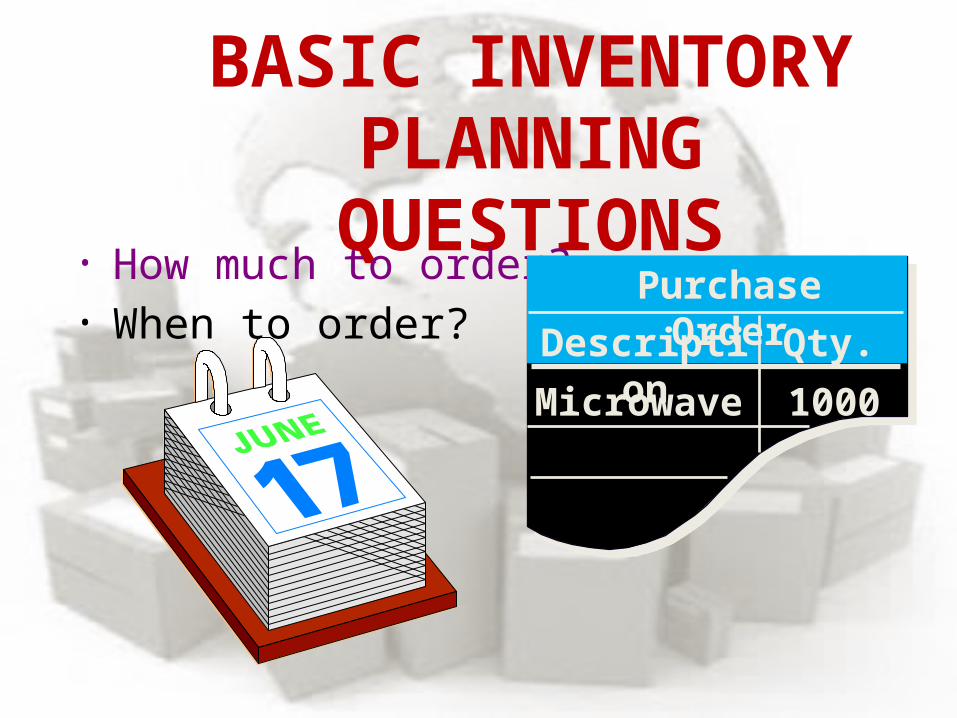
BASIC INVENTORY PLANNING QUESTIONS
• How much to order?• When to order?
Purchase Order
Description Qty.
Microwave 1000

INVENTORY MODELS• Fixed order quantity models
– Economic order quantity– Production order
quantity– Quantity discount
• Probabilistic models• Fixed order period models
Help answer the inventory planning questions!
Help answer the inventory planning questions!
© 1984-1994 T/Maker Co.

DEPENDENT v/s INDEPENDENT
• Independent demand – finished goods, items that are ready to be sold– E.g. a computer
• Dependent demand – components of finished products– E.g. parts that make up the computer

Need to determine when and how much to order
Basic economic order quantity
Production order quantityQuantity discount model
INVENTORY MODELS FOR INDEPENDENT DEMAND

1. Demand is known, constant, and independent
2. Lead time is known and constant3. Receipt of inventory is instantaneous and
complete4. Quantity discounts are not possible5. Only variable costs are setup and holding6. Stock outs can be completely avoided
BASIC EOQ MODEL

INVENTORY USAGE OVERTIME
Order quantity = Q (maximum inventory level)
Inve
ntor
y le
vel
Time
Usage rate Average inventory on
handQ2
Minimum inventory
© 2011 Pearson Education, Inc. publishing as Prentice Hall
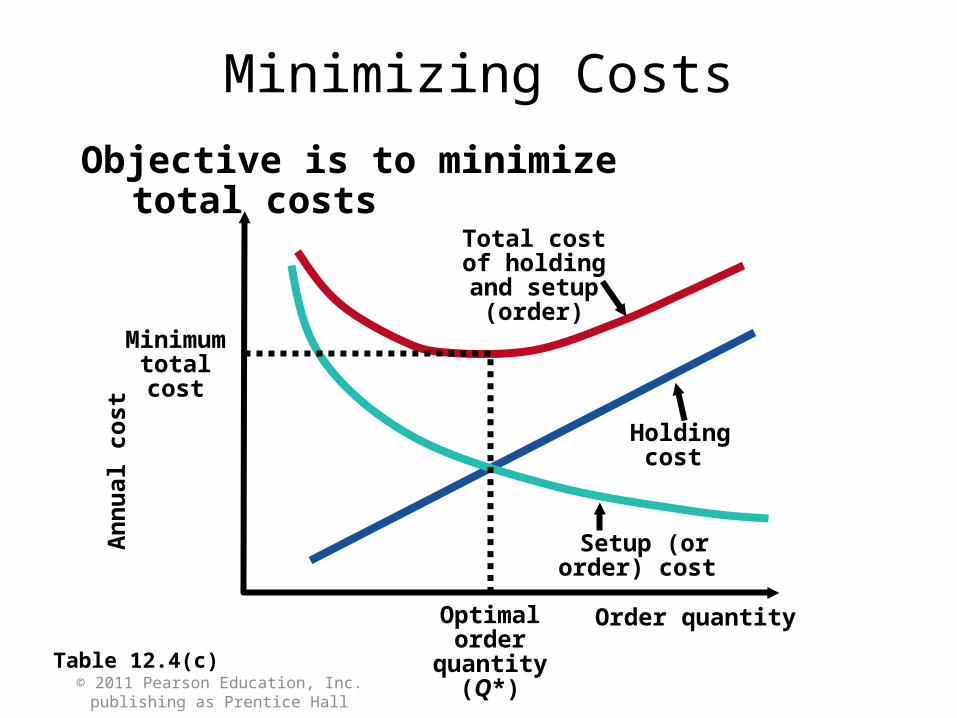
Minimizing CostsObjective is to minimize total costs
Table 12.4(c)
Annu
al c
ost
Order quantity
Total cost of holding and setup
(order)
Holding cost
Setup (or order) cost
Minimum total cost
Optimal order quantity (Q*)

EOQ answers the “how much” question The reorder point (ROP) tells when to order
ROP = Lead time for a new order in days
Demand per day
= d x L
d = DNumber of working days in a year
REORDER POINTS
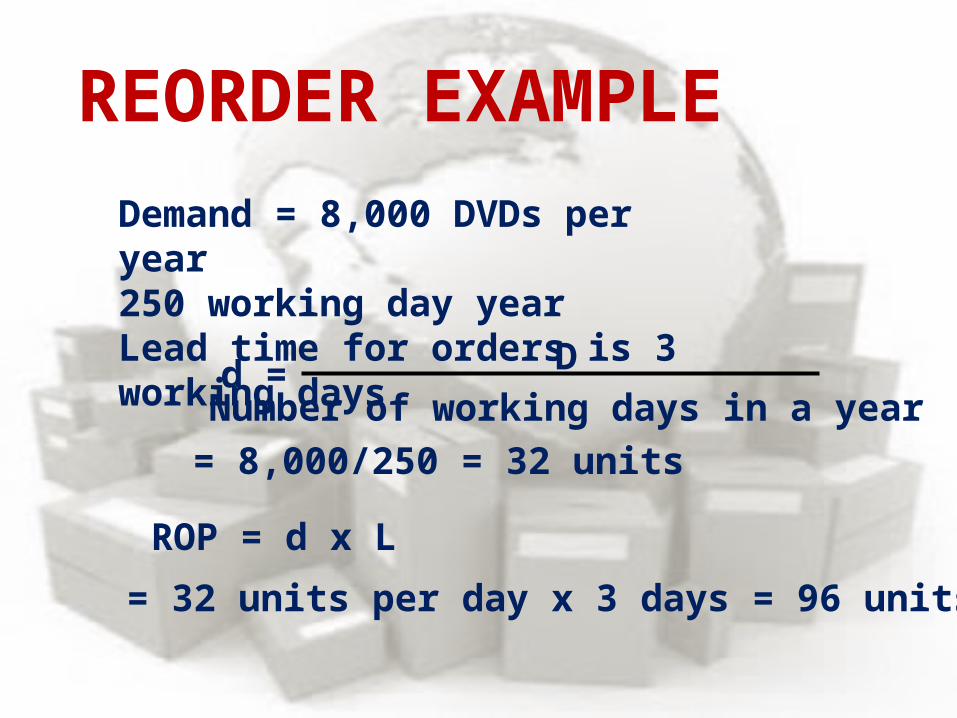
Demand = 8,000 DVDs per year250 working day yearLead time for orders is 3 working days
ROP = d x L
d = DNumber of working days in a year
= 8,000/250 = 32 units
= 32 units per day x 3 days = 96 units
REORDER EXAMPLE
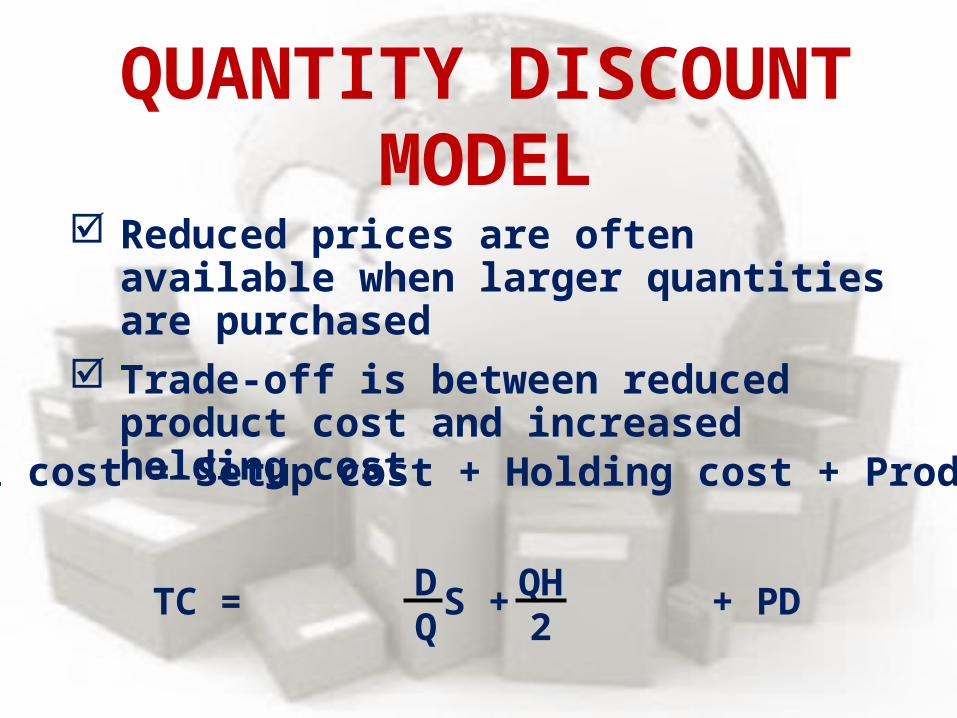
Reduced prices are often available when larger quantities are purchased
Trade-off is between reduced product cost and increased holding cost
Total cost = Setup cost + Holding cost + Product cost
TC = S + + PDDQ
QH2
QUANTITY DISCOUNT MODEL
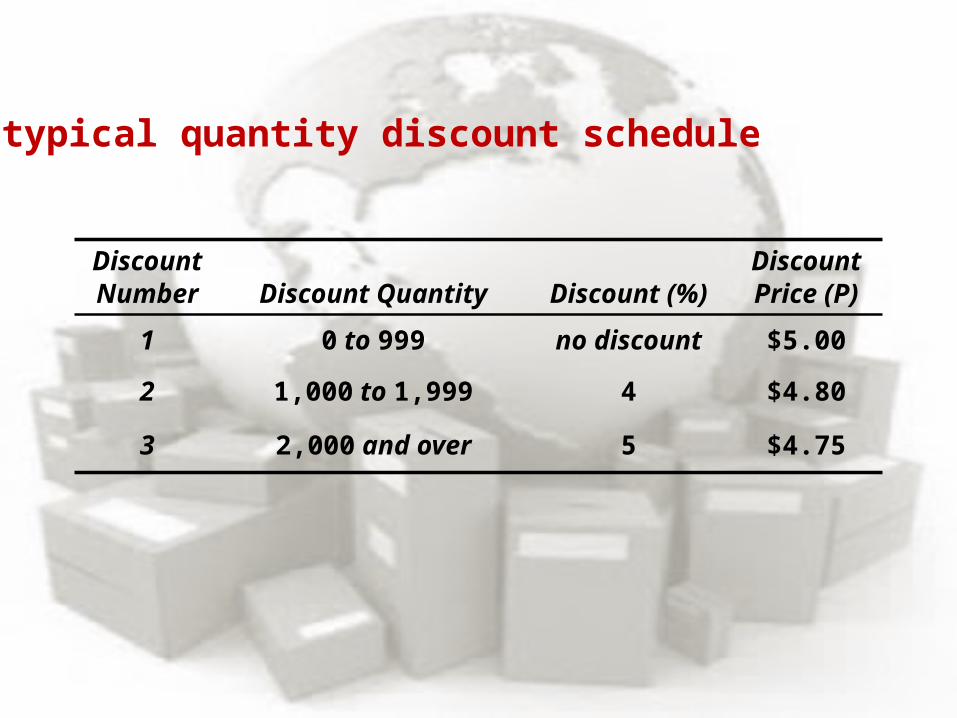
Discount Number Discount Quantity Discount (%)
Discount Price (P)
1 0 to 999 no discount $5.00
2 1,000 to 1,999 4 $4.80
3 2,000 and over 5 $4.75
A typical quantity discount schedule

Used when inventory builds up over a period of time after an order is placed
Used when units are produced and sold simultaneously
PRODUCTION ORDER QUANTITY MODEL

Inve
ntor
y le
vel
Time
Demand part of cycle with no production
Part of inventory cycle during which production (and usage) is taking place
t
Maximum inventory
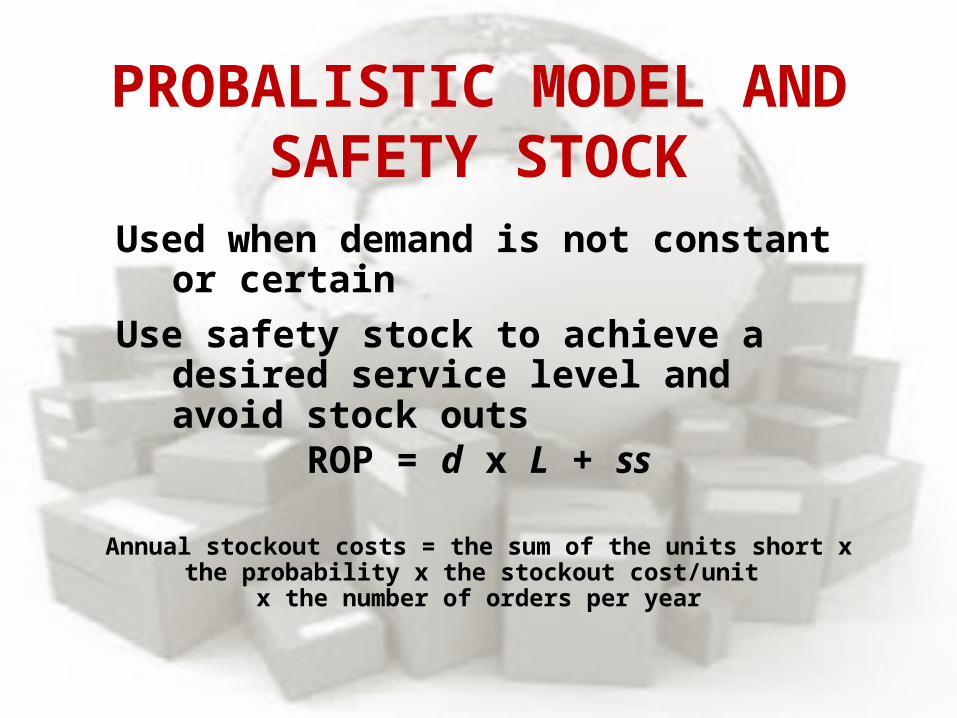
PROBALISTIC MODEL AND SAFETY STOCK
Used when demand is not constant or certainUse safety stock to achieve a desired service
level and avoid stock outs
ROP = d x L + ss
Annual stockout costs = the sum of the units short x the probability x the stockout cost/unit
x the number of orders per year

SAFETY STOCK EXAMPLE
ROP = 50 units Stock out cost = $40 per frameOrders per year = 6 Carrying cost = $5 per frame per year
Safety Stock
Additional Holding Cost Stockout Cost
Total Cost
20 (20)($5) = $100 $0 $100
10 (10)($5) = $ 50 (10)(.1)($40)(6) = $240 $290
0 $ 0 (10)(.2)($40)(6) + (20)(.1)($40)(6) =$960 $960
A safety stock of 20 frames gives the lowest total cost
ROP = 50 + 20 = 70 frames

OTHER PROBALISTIC MODEL
1. When demand is variable and lead time is constant
2. When lead time is variable and demand is constant
3. When both demand and lead time are variable
When data on demand during lead time is not available, there are other models available

SINGLE PERIOD MODEL
• Only one order is placed for a product• Units have little or no value at the end
of the sales period

THANK YOU