Embed Size (px)
Citation preview

Innovation in the Life Sciences: the Impact of Intellectual Property Rights on Scientific Knowledge Diffusion, Accumulation and Utilization
byKenneth Guang-Lih Huang
S.M. Technology and Policy, Massachusetts Institute of Technology, 2003B.S. Biomedical Engineering, Johns Hopkins University, 2001B.S. Electrical Engineering, Johns Hopkins University, 2001
Submitted to the Engineering Systems Divisionin Partial Fulfillment of the Requirements for the Degree of
DOCTOR OF PHILOSOPHY IN TECHNOLOGY, MANAGEMENT AND POLICYat the
MASSACHUSETTS INSTITUTE OF TECHNOLOGY
September 2006
b2006 Kenneth Guang-Lih Huang. All rights reserved.The author hereby grants MIT permission to reproduce and to distribute publicly
paper and electronic copies of this thesis document in whole or in part.
Signature of Author Technology, Management and Policy Program, Engineering Systems Division
Certified by Fiona E. Murray
Associate Professor of Management of Technology Innovation and EntrepreneurshipThesis Supervisor
Certified by Thomas J. Allen
Howard Johnson Professor of Management and of Engineering Systems, Doctoral Committee
Certified by Anthony J. Sinskey
Professor of Microbiology and Health Sciences and Technology, Doctoral Committee
Certified by David J. Gabel
Professor of Economics, Queens College, City University of New York, Doctoral Committee
Accepted by Richard de Neufville
Professor of Engineering SystemsChair, ESD Education Committee

2

Innovation in the Life Sciences: the Impact of Intellectual Property Rights on Scientific Knowledge Diffusion, Accumulation and Utilization
by
Kenneth Guang-Lih Huang
Submitted to the Engineering Systems Division on August 9, 2006 in Partial Fulfillment of the Requirements for the Degree of
Doctor of Philosophy in Technology, Management and Policy
ABSTRACT
The impact of intellectual property rights on the production, diffusion and accumulation of
scientific knowledge has been a central concern of public policymakers and economists in
both public and private institutions, and scholars in management economics and sociology. In
this dissertation, I examine the central patenting debates over the role of patenting the life
sciences and address a set of interrelated questions: (1) the impact of strategic intellectual
property policies of institutions on their cumulative knowledge dissemination, utilization and
commercialization; (2) the unique attributes of life science innovations captured by patents
generated under different institutional settings; and (3) the degree to which patenting activities
impact the rate and trajectories of scientific knowledge accumulation under varying
intellectual property conditions.
I take as my research setting, the Human Genome Project (HGP) and our mapping of the
entire human genome that emerged from the project (as defined in both scientific publications
and patents). The HGP was a 13-year, $3.8 billion research effort funded and coordinated by
the U.S. Department of Energy and the National Institute of Health, and one of the most
significant life science research projects ever undertaken. To address the first question, I study
the seven key genome centers in the HGP, which produced almost all the genome sequence
output and provide an unusually matched and well-controlled natural experiment to examine
the impact of different knowledge institutions on the subsequent diffusion of scientific
knowledge.
3

To explore the second question, I build on the data set of the population of 4270 gene patents
to systematically quantify and analyze the important attributes of these gene-based
innovations. Through the construction of a set of validated measures, I specifically
characterize the variation in these innovations when made under public versus private
institutional settings and compare them to the innovations across broad technology fields from
previous studies. To answer the third question, I identify and construct a large-scale, novel
data set of 1279 unique patent-paper pairs from the gene patents and apply econometric
models to shed light on the degree to which patent grant in the life sciences impacts the rate of
follow-on scientific research.
I find that publications with matched patent pairs are associated with higher citations on the
average. Since only an institutional policy allowing patents results in patents, such policy does
not stifle cumulative knowledge dissemination and use. In addition, patents contribute to
technological innovation, commercialization and start-up. Furthermore, I identified a growing
convergence of public/academic and industry innovations in the life sciences especially in
terms of their “basicness” and appropriability as characterized by the Pasteur’s quadrant, and
that variation in institutional setting is associated with differential innovation characteristics.
I also find evidence of “technological trajectories”, coherence and persistence across various
attributes of life science innovations.
However, I determine that gene patenting impedes temporal knowledge diffusion and use and
decreases citations of paired publications once they are granted and become “visible” to the
public, as predicted by the anti-commons effect. I also ascertain that patenting hinders
knowledge diffusion and use to a greater degree on private sector authored publications than
public ones and for U.S. authored than non-U.S. authored ones, and that corporate patenting
has a more adverse impact than public institution patenting. As the first study of its kind to
directly test the “patent thicket” conceptualization, I find direct statistical evidence of the
adverse effect of “patent thickets” and that the patenting of disease and cancer genes
negatively impacts knowledge dissemination and use by follow-on scientists and researchers.
Thesis Supervisor: Fiona E. MurrayTitle: Associate Professor of Management of Technology Innovation and Entrepreneurship
4

ACKNOWLEDGEMENTS
The writing of this dissertation has been an incredible journey and a monumental milestone in
my academic life. I could not have embarked on this expedition and traveled this far without
the passionate and continued support of advisors, colleagues, friends and family.
First of all, I would like to express my heartfelt gratitude to Professor Fiona Murray, my main
dissertation advisor and supervisor. Over the past three and half years, she has been the major
pillar of my professional life at MIT, transforming my interests into something concrete and
fundamentally important in the field of technology innovation and guiding me wisely through
the rapids of this exciting intellectual exploration. She has been the most perceptive and
patient mentor – the numerous conversations and electronic exchanges we had constantly
improved and refined this work. She is also an understanding and encouraging friend who has
stood by me in times of difficulties.
Professors Thomas Allen and Anthony Sinskey have helped in so many ways to enable and
shape this work while continue to provide firm support and constructive feedback along the
way. For that, I will always be grateful. Professor David Gabel has been an inspiration and
has steered me through some rough terrains during my formative years as a Master’s student
here and has generously extended his counsel and warm friendship in my doctoral endeavor.
Professor Arnold Barnett, though not formally on my doctoral committee, has enlightened me
in so many aspects about Statistics, teaching, other academic matters and life in general. He is
a wonderful pal and ally whom one has the good fortune to know.
5
This venture has been financially supported by the two-year Merck-MIT fellowship made
possible through friends like Professor Bruce Tidor and Dr. Brigitta Tadmor at CSBi. Dr.
Kyle Jensen has offered remarkable research and computational assistance in terms of
acquiring the patent data while being a terrific personal friend.
I would also like to thank the ESD and TPP/TMP community, especially Professors Richard
De Neufville, Daniel Hastings, David Marks, Chris Magee, Dava Newman, Dr. Frank Field,
Eda Daniel, Elizabeth Milnes, Sydney Miller and Melissa Manolis, among many others, for
their professional and administrative backup and for securing a place where we can rest our
fatigued minds. This extraordinary voyage would certainly have been less extraordinary and
colorful if not for the engaging and heartwarming time spent with friends – Carrie Pei-Chun,
Yinthai, Sybor, Kenny, Charlie, Gale, Rie, Christine and the whole “2003 TMP gang”, among
others.
“All our dreams can come true if we have the courage to pursue them” as Walt Disney once
put it so well. My parents, Wann-Ching and Moon-Ying, and my sister, Chyi-Yun have
certainly blessed my life with an environment in which I could freely pursue my dreams and
have the courage to surmount higher mountains. They mean the world to me and this
undertaking would not have been possible without their love.
6

To my parents, for their love
7

T ABLE OF C ONTENTS
ABSTRACT .............................................................................................................................. 3ACKNOWLEDGEMENTS ..................................................................................................... 5TABLE OF CONTENTS ......................................................................................................... 8LIST OF FIGURES................................................................................................................ 10LIST OF TABLES.................................................................................................................. 11
CHAPTER 1: .......................................................................................................................... 12INTRODUCTION .................................................................................................................. 12
1.1 Motivation and Context: Intellectual Properties and Public Policymaking .......... 121.2 Significance of Dissertation Topic............................................................................... 131.3 Dissertation Objective .................................................................................................. 171.4 Dissertation Overview and Structure ......................................................................... 171.5 Chapters Summary and Findings ............................................................................... 21
CHAPTER 2: .......................................................................................................................... 23LITERATURE REVIEW ...................................................................................................... 23
2.1 Institutional Intellectual Property Regimes ............................................................... 232.1.1 Pasteur’s Quadrant and Duality of Knowledge.................................................. 26
2.2 Intellectual Property Right Debates ........................................................................... 272.2.1 Economics and Public Policy ................................................................................ 292.2.2 Sociology of Science: Ethos of Science ................................................................. 362.2.3 Ethics ...................................................................................................................... 42
2.3 Research, Development and the Innovative Process ................................................. 44
CHAPTER 3: .......................................................................................................................... 46HISTORY OF THE HUMAN GENOME PROJECT ........................................................ 46
3.1 Historical Landmarks of the Human Genome Project and Genome Centers ........ 473.2 Major Policy Debates on the Ethical, Legal and Social Fronts ................................ 64
CHAPTER 4: .......................................................................................................................... 68IMPACT OF STRATEGIC INSTITUTIONAL DECISIONS........................................... 68
4.1 University Research and Technology Commercialization in the Human GenomeProject.................................................................................................................................. 684.2 Central Patenting Dilemma and Hypothesis Development ...................................... 734.3 The Genome Institutions and their Strategic Patenting Decisions .......................... 744.4 Empirical Test Strategy ............................................................................................... 82
4.4.1 A Natural Experiment........................................................................................... 824.4.2 “Anti-commons” Test: Negative Binomial Regression Model .......................... 84
4.5 Closer Examination of Data Set .................................................................................. 884.6 Statistical Analyses, Findings and Discussion ............................................................ 964.7 Conclusion ................................................................................................................... 103
8
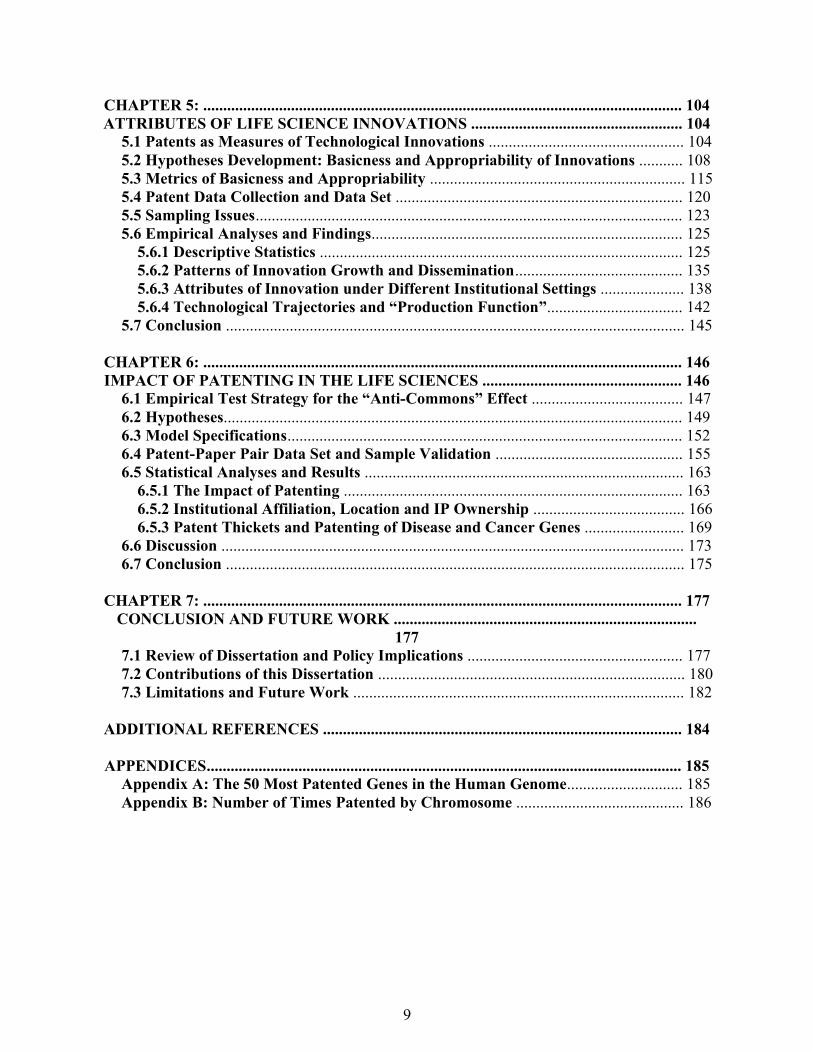
CHAPTER 5: ........................................................................................................................ 104ATTRIBUTES OF LIFE SCIENCE INNOVATIONS ..................................................... 104
5.1 Patents as Measures of Technological Innovations ................................................. 1045.2 Hypotheses Development: Basicness and Appropriability of Innovations ........... 1085.3 Metrics of Basicness and Appropriability ................................................................ 1155.4 Patent Data Collection and Data Set ........................................................................ 1205.5 Sampling Issues........................................................................................................... 1235.6 Empirical Analyses and Findings.............................................................................. 125
5.6.1 Descriptive Statistics ........................................................................................... 1255.6.2 Patterns of Innovation Growth and Dissemination.......................................... 1355.6.3 Attributes of Innovation under Different Institutional Settings ..................... 1385.6.4 Technological Trajectories and “Production Function”.................................. 142
5.7 Conclusion ................................................................................................................... 145
CHAPTER 6: ........................................................................................................................ 146IMPACT OF PATENTING IN THE LIFE SCIENCES .................................................. 146
6.1 Empirical Test Strategy for the “Anti-Commons” Effect ...................................... 1476.2 Hypotheses................................................................................................................... 1496.3 Model Specifications................................................................................................... 1526.4 Patent-Paper Pair Data Set and Sample Validation ............................................... 1556.5 Statistical Analyses and Results ................................................................................ 163
6.5.1 The Impact of Patenting ..................................................................................... 1636.5.2 Institutional Affiliation, Location and IP Ownership ...................................... 1666.5.3 Patent Thickets and Patenting of Disease and Cancer Genes ......................... 169
6.6 Discussion .................................................................................................................... 1736.7 Conclusion ................................................................................................................... 175
CHAPTER 7: ........................................................................................................................ 177CONCLUSION AND FUTURE WORK ............................................................................
1777.1 Review of Dissertation and Policy Implications ...................................................... 1777.2 Contributions of this Dissertation ............................................................................. 1807.3 Limitations and Future Work ................................................................................... 182
ADDITIONAL REFERENCES .......................................................................................... 184
APPENDICES....................................................................................................................... 185Appendix A: The 50 Most Patented Genes in the Human Genome............................. 185Appendix B: Number of Times Patented by Chromosome .......................................... 186
9
LIST OF FIGURES
Figure 2.1: Pasteur’s Quadrant: “Use-inspired Basic Research” ............................................. 27Figure 3.1: U.S. Human Genome Project Funding (1988 – 2003) ...........................................
47Figure 3.2A: Decrease in sequencing costs, 1990-2005........................................................... 55Figure 3.2B: Increase in DNA sequence in GenBank, 1990-2005........................................... 55Figure 3.3: Number of Disease Genes Identified from 1981 to 2002 ...................................... 60
Figure 3.4: HGP Organization Map of the Key Stakeholders .................................................. 63
Figure 4.1: U.S. National Expenditure on Academic and Related Research by Main Fields .. 68Figure 4.2: Mapping of Observed CFC to Negative Binomial and Poisson Distributions ...... 85Figure 4.3: Publications from Whitehead, Sanger, Washington University, Baylor, University
of Washington, Stanford and Joint Genome Institute ...................................................... 91Figure 4.4: MIT Whitehead Institute Patents and Publications................................................ 94Figure 4.5: Patterns of Mean Cumulative Forward Citation in the 7 Genome Centers ........... 96Figure 4.6: Citations of Publications with and without Patent Pairs (All Whitehead HGP
Articles) .......................................................................................................................... 100
Figure 5.1: Transcripts and Products of BRCA1 (Breast Cancer 1) Gene ............................. 123Figure 5.2: Number of Gene Patents by Application Year .................................................... 126Figure 5.3: Number of Gene Patents Granted by Type of Assignees .................................... 127Figure 5.4: Average Patent Grant Delay by Patent Application Vintage ............................... 128
Figure 5.5: The Backward Measures ...................................................................................... 133
Figure 5.6: Number of Core Patents at Risk and Number of Core Patents Cited .................. 136Figure 5.7: Number of Forward Cites to Core Patents for Each Patent Application Year..... 137Figure 5.8: Number of Forward Cites Over Number of Core Patent Cited ........................... 138Figure 6.1: Distribution of Annual Forward Citations ........................................................... 153Figure 6.2: Vein Diagram of Patents on OMIM Disease Genes and Cancer Genes in Data Set
........................................................................................................................................ 170

10

LIST OF TABLES
Table 1.1: Overview of Chapters in the Dissertation ............................................................... 20Table 1.2: Summary and Findings of Key Dissertation Chapters ............................................ 21Table 3.1: HGP Goals and Dates of Achievement ................................................................... 62Table 4.1: Utility Patents Issued to U.S. Universities and Colleges, 1969-1997 (Year of Issue)
.......................................................................................................................................... 71Table 4.2: Patenting Policy of the 7 Genome Centers.............................................................. 83Table 4.3: Characteristics of Publication for the 7 Genome Centers ....................................... 89Table 4.4: Whitehead Patent Analysis by Year (CFC as of June 2004)................................... 93Table 4.5: Summary Statistics for the Key Variables in Regression Models .......................... 95Table 4.6: Summary of Variables in Fixed-Effects NBRM and OLS Model Output .............. 98Table 5.1: Notations and Definitions Used in Metrics of Basicness, Distance and
Appropriability ............................................................................................................... 116Table 5.2: Metrics of Basicness and Appropriability ............................................................. 119Table 5.3: Descriptive Statistics of Basic Patent Variables ................................................... 125Table 5.4: Descriptive Statistics of Basicness, Technology Distance and Appropriability ... 129Table 5.5: Correlations between Basicness, Distance and Appropriability Metrics .............. 134Table 5.6: Comparison of Means (ANOVA): Public Institutions/Universities (Left) vs.
Corporation (Right) ....................................................................................................... 139Table 5.7: Correlations across F/B Measures ......................................................................... 143Table 5.8: Regression of IMPORTF on B/Variables (Controlling for Characteristics of
Research, Technological Fields and Application Year) ................................................. 144Table 5.9: Regression of GENERAL on B/Variables (Controlling for Characteristics of
Research, Technological Fields and Application Year) ................................................. 144Table 6.1: Sample of Patents with Potential Matching Paper Set (2093 Observations) ........ 157Table 6.2: Population of Patent Data Set (4270 Observations) .............................................. 158Table 6.3: List of Top Ten Most Frequently Appearing Journals .......................................... 159Table 6.4: Summary Statistics of Publications and Patents in Data Set................................. 161Table 6.5: Impact of Post Patent Grant ................................................................................. 165Table 6.6: NBRM Results by Institutional or National Affiliations ...................................... 168Table 6.7: NBRM Results by OMIM Disease Gene or Cancer Gene IPR ............................. 172
11

CHAPTER 1:
INTRODUCTION
1.1 Motivation and Context:Intellectual Properties and Public Policymaking
The intellectual property system is an integral part of a nation’s public policymaking to
promote technological innovation in the knowledge based economy. A strong intellectual
property system, as envisioned by the U.S. Patent and Trademark Office (USPTO)
“contributes to a strong global economy, encourages investment in innovation, and fosters
entrepreneurial spirit.” USPTO recognizes that “the strength and vitality of the U.S. economy
depends directly on effective mechanisms that protect new ideas and investments in
innovation and creativity.”1 U.S. President George Bush has emphasized its importance in his
letter to the USPTO “to promote strong intellectual property laws around the globe and to
encourage countries to be responsible stakeholders in the international economic system.”2
Previous studies by Scherer et al. (1959),3 Mansfield et al. (1981),4 Mansfield (1986),5
Levin et al. (1987)6 and Cohen et al. (2000)7 suggest that patent protection is important
only in certain industries and shapes their innovative efforts, most notably pharmaceutical and
the life
1 USPTO mission statement: http://www.uspto.gov/web/menu/intro.html2 President’s letter for USPTO April, 25, 2006.3 Scherer, F.M., et al. (1959) Patents and the Corporation. 2nd edn. Boston, privately published.4 Mansfield, E., Schwartz, M. and Wagner, S. (1981) "Imitation Costs and Patents: An Empirical Study."Economic Journal, 91:907-918.5 Mansfield, E. (1986) "Patents and innovation: An empirical study." Management Science, 32:173-181.6 Levin, R., Kievorick, A., Nelson, R.R., and Winter, S.G. (1987) "Appropriating the returns from industrial R&D." Brookings Papers on Economic Activity, 783-820.7 Cohen, Wesley M., Richard R. Nelson, John P. Walsh (2000) “Protecting Their Intellectual Assets: Appropriability Conditions and Why US Manufacturing Firms Patent (or Not).” NBER Working Paper 7552

12
sciences. Taylor and Silberston (1973) find similar results for the United Kingdom.8 Other
scholars have suggested the differential impact of patenting due to the scope (Merges and
Nelson, 1994; Lerner, 1994),9 geographic localization (Jaffe et al., 1993),10 and under certain
circumstances with limited empirical data, the timing (Murray and Stern, 2005; Sampat,
2005).11 However, important questions beg to be answered: (1) How do strategic intellectual
property policies of institutions impact their cumulative knowledge dissemination, utilization
and commercialization? (2) What are the unique attributes of innovations captured by patents
in the life sciences under different institutional settings especially in terms of their “basicness”
and appropriability? (3) How do such patenting activities affect the trajectories of scientific
knowledge diffusion, accumulation and utilization under varying conditions and for genes of
medical importance? This dissertation addresses these critical questions that are at the heart
of the policy debate over patents which concerns public policymakers, scholars, decision
makers in both public and private institutions and our society.
1.2 Significance of Dissertation Topic
The focus of this dissertation is on the relationship between technological innovation and
technology policy affecting such innovation, especially in the life sciences. But in the first
8 Taylor, C.T. and Silberston, Z.A. (1973) The Economic Impact Of The Patent System: A Study Of The BritishExperience. Cambridge: Cambridge University Press.9 Merges, Robert P. and Richard R. Nelson (1994) “On Limiting or Encouraging Rivalry in Technical Progress: The Effect of Patent Scope Decisions.” Journal of Economic Behavior & Organization , Volume 25, Issue 1 ,September, Pg 1-24Lerner, Joshua (1994) "The Importance of Patent Scope: An Empirical Analysis", Rand Journal of Economics, Vol. 25, No. 2 (Summer).10 Jaffe, Adam B., Manuel Trajtenberg and Rebecca Henderson (1993) "Geographic Localization of KnowledgeSpillovers as Evidenced by Patent Citations." Quarterly Journal of Economics, Vol. 108(3), pp. 577-98, August.11 Murray, F. and S. Stern (2005) "Do formal Intellectual Property Rights Hinder the Free Flow of ScientificKnowledge? An Empirical Test of the anti-Commons Hypothesis," NBER Working Paper 11465. Forthcoming,Journal of Economic Behavior and OrganizationSampat, Bhaven N. (2005) “Genomic Patenting by Academic Researchers: Bad for Science?” Working Paper, School of Public Policy, Georgia Institute of Technology.
13

place, why would technological innovation be of interest to anyone? On a high level, the
following paragraph from the Economist article12 sums it up nicely:
Innovation has become the industrial religion of the late 20th century. Business sees it
as the key to increasing profits and market share. Governments automatically reach for
it when trying to fix the economy. Around the world, the rhetoric of innovation has
replaced the post-war language of welfare economics. It is the new theology that
unites the left and the right of politics.
This captures the general sentiments of influential decision makers, policymakers and
business executives who are directly involved in shaping a nation’s socio-economic system.
There is also a huge body of scholarly literature devoted to the topic of (technological)
innovation as drivers of economic growth, as summarized by Nelson (1996):13
In my view, technological change has been the central driving force behind the
economic growth we have experienced. However, the relationships and mechanisms
involved are complex and not simple.
Such importance is reinforced by influential studies such as The National Millennium Survey,
where seventy-eight percent of executives surveyed anticipate staying abreast of technological
12 The Economist (February 20, 1999), "Survey: Innovation in Industry - Industry Gets Religion", p 5. See all the articles in the survey (pp 5 onwards).13 Richard Nelson, the George Blumenthal Professor at Columbia's School of International and PublicAffairs, professor at Columbia Law School, and professor at Columbia Graduate School of Business,has been one of the major voices on innovation.
14
advance was to be the primary challenge in 2005;14 found in speeches given by CEOs;15
articles and lectures by business experts;16 books devoted to American business;17 and
testimony by the former Chairman of the Federal Reserve, Alan Greenspan:18
While there are various competing explanations for an economy that is in many
respects without precedent in our annals, the most compelling appears to be the
extraordinary surge in technological innovation that developed through the latter
decades of the last century… In summary, we appear to be in the midst of a period of
rapid innovation that is bringing with it substantial and lasting benefits to our
economy.
14 The National Millennium Survey, published in July 1998, was conducted by Yankelovich Partners for Deloitte and Touch. From October to December 1997, they interviewed 409 senior executives from U.S. firms with revenues exceeding $1 billion.15 See Sommer (1999) where the chairman and CEO of Deutsche Telekom points out that: "In the long term, only providers with the necessary capital, innovative strength, and presence in the world’s growth regions will thrive in the global market.'16 Drucker (1999) states the sustainability of London’s future as a financial center relies on how successful itsfinancial firms play the roles of innovators. Porter (1999) demonstrated before the World Productivity Congress in Edinburgh that innovative output, dependent upon a nation's innovative capacity, is critical to a nation's productivity. Also see Stern, Porter and Furman (2000), and Porter and Stern (1999). Porter (2001) in his lecture at Congress's Forum on Technology and Innovation, stressed the importance of education in in strengthening a nation's innovative capacity.Drucker, Peter (1999) "Innovate or Die: Drucker On Financial Services", Economist, September 25, p 25. Porter, Michael (1999) "Creating Innovative Capacity". Gilbreth Memorial Lecture given before World
Productivity Congress sponsored by the Institute of Management Services, Edinburgh, Scotland, October. Porter, Michael and Stern, Scott (1999) "The New Challenge to America's Prosperity: Findings from the
Innovation Index", Washington, D.C.: Council on Competitiveness Publication.Stern, Scott, Michael Porter and Jeffrey Furman (2000) "The Determinants of National Innovative Capacity",
National Bureau of Economic Research Working Paper No. W7876, September.Porter, Michael (2001) Lecture given at the Forum on Technology and Innovation: Is the Tech Boom Over? The
Real Story of the U.S. Economy, sponsored by the U.S. Senate and the Council on Competitiveness, Feb. 7.17 Rosenbaum (1998) argues that a critical element to sustain a firm's dominant position in its industry lies in its development and integration of innovation.Rosenbaum, David (1998) Market Dominance: How Firms Gain, Hold, or Lose It and the Impact on Economic
Performance, Westport: Praeger, Chapter 12.18 Greenspan, Alan (2000) before the White House Conference on the New Economy: "Technological Innovation and the Economy", Washington, D.C., April 5.
15
In addition to leaders in America, the Chairman of the Chinese Communist Party and Central
Military Commission, President Jin-Tao Hu stressed the importance of science and
technological innovations:19
From the perspective of the development of technologies around the world, science and
technology, especially the highly strategic ones, are gradually becoming the decisive
power that influences the development of the economy and society. For this reason, they
have become the focuses of the comprehensive national power…our emphasis should be
placed on understanding and resolving the obvious dilemma and problems that may affect
the development of our nation and rely more on technological advances and innovation to
drive the good and fast development of the economy and society.
Given the strong belief that technological innovation as a key driver of growth and advance of
organizations, industries and nations, it follows that policymakers have particular imperatives
to understand the implication of the current intellectual property system in order to devise
better policies to shape and enhance the innovative potential of the nation (Landes, 1969;
Mokyr, 1990).20 This dissertation is significant in this respect and it comprehensively
addresses, in particular, innovations in the life sciences as captured by patents and their
interaction with paired publications.
19 Mr. Jin-Tao Hu (2006) before the Chinese Academy of Science and the Chinese Academy of Engineering general assemblies in the Great Hall of the People, China, June 5.20 Landes, David (1969) The Unbound Prometheus: Technological Change and Industrial Development inWestern Europe from 1750 to the Present. Cambridge, UK: Cambridge University Press.
Mokyr, Joel (1992) The Lever of Riches. Oxford University Press.
16

1.3 Dissertation Objective
This dissertation aims to provide a clear roadmap for the unique attributes of innovations in
the life sciences as captured by genomic patents. It aims to resolve the chronic debate of
whether patenting affects scientific knowledge diffusion, accumulation and utilization and if
so, how and to what extent. In addition, through a detailed examination of all public genomic
institutions involved in the Human Genome Project, this dissertation hopes to provide insight
on the key institutional drivers and characteristics affecting scientific knowledge
dissemination and utilization. This will not only shed light on the relationship between
intellectual property rights and scientific knowledge trajectories but also help inform and
formulate better intellectual property policies and processes to enhance the dissemination and
accumulation of knowledge and promote its potential in downstream utilization and
commercialization.
1.4 Dissertation Overview and Structure
How does this dissertation go about achieving these objectives? It is intended to be the most
comprehensive and definitive study to date on this contentious subject through a methodical
literature and historical review and micro level quantitative empirical studies augmented by
qualitative evidence from technology licensing office and various other sources.
17

The ensuing Chapter 2 describes the institutional intellectual property regimes followed by a
definition of research that falls into the Pasteur’s quadrant (Stokes, 1997),21 or “use-inspired
basic research” displaying both basic and applied values. This then leads to a comprehensive
discussion of the intellectual property right debates in the economics and public policy,
sociology of science and ethics literature. The chapter concludes by setting the context for the
Human Genome Project in terms of the innovation and its significance for university research
and technology commercialization.
Chapter 3 builds on Chapter 2 by first presenting the major historical landmarks of the human
genome project, where it all begins, in relation to the genome institutions and private
corporation responsible for sequencing the entire human genome. Chapter 4 describes the
empirical study that builds on the historical review and focuses on the impact of institutional
patenting decisions on cumulative scientific knowledge diffusion, accumulation and
utilization. This study is concerned primarily with quantitative instruments and econometric
models to analyze all the research outputs: patents and paired publications of all the public
and private genome institutions. It is supplemented by data from the Massachusetts Institute
of Technology (MIT) Technology Licensing Office as evidence for downstream technological
innovation and commercialization of research output. In addition, a qualitative comparative
analysis of extensive primary and secondary source materials and interviews is conducted to
analyze the unique institutional characteristics of Whitehead Institute versus other public
genome centers.
21 Stokes, Donald E. (1997) Pasteur's Quadrant: Basic Science and Technological Innovation. Washington, DC: Brookings Institution Press
18

This is followed by a characterization of life science innovation attributes in Chapter 5 as
captured by all genomic patents, especially in terms of their basicness and appropriability and
their technological trajectories. The empirical study in Chapter 6 builds on this foundation
and examines quantitatively the differential impact of intellectual property under differing
patent characteristics and institutional settings on scientific knowledge diffusion,
accumulation and utilization captured by matched paper pairs to each gene patent. Using the
differences-in-differences negative binomial regression models, it seeks to establish the
temporal citation trends and knowledge dissemination trajectories of these patent-paper pairs
to complement the cumulative impact ascertained in Chapter 4. Together, they form a
comprehensive analysis and offer a determinative answer to the anti-commons questions
posed.
Chapter 7 reviews the dissertation and gives policy implications of these findings before it
concludes this dissertation research by acknowledging its limitation and highlighting potential
areas for future works.
A brief overview of the chapters in this dissertation is presented in Table 1.1 below. The four
color codes represent the four major “segments” of this dissertation: 1) introduction and
literature review; 2) historical overview and impact of institutional patenting decisions; 3) life
science innovation characteristics and patent-paper pair analyses; 4) policy implications and
conclusion.
19

Table 1.1: Overview of Chapters in the Dissertation
CONTENT OVERVIEW
CHAPTER 1 Introduction
CHAPTER 2
Literature Review:
Institutional Intellectual Property Regimes and Debates
Commercialization of University Biotechnologies and
the Human Genome Project
CHAPTER 3Historical Overview of the Human Genome Project
Ethical, Legal and Social Policy Debates
CHAPTER 4 Impact of Institutional Patenting Decisions on Scientific Knowledge
CHAPTER 5
Overview of Life Sciences Innovation as Captured by Patents
Attributes of Life Science Innovations:
Basicness and Appropriability
CHAPTER 6Impact of Patenting on Knowledge Diffusion, Accumulation and
Utilization as Captured by Specific Patent-Paper Pairs
CHAPTER 7Discussion and Policy Implications
Conclusion and Future Work
20

1.5 Chapters Summary and Findings
A summary of findings from key dissertation chapters is presented in Table 1.2 below:
Table 1.2: Summary and Findings of Key Dissertation Chapters
Chapter 4 Chapter 5 Chapter 6ResearchQuestions
How do strategicintellectual property policies of institutions impact their cumulative knowledge dissemination, utilization and commercialization?
What are the uniqueattributes of life science innovations captured by patents under different institutional settings, especially in terms of their “basicness” and appropriability?
How do patentingactivities affect the trajectories of scientific knowledge diffusion, accumulation and utilization under different IP conditions and for genes of medical importance?
ResearchSettings
The Human GenomeProject: all seven public genome institutions
Life sciences IP:population of entire 4270 genomic patents/ innovations and measures of “basicness” and appropriability
Population of 4270genomic patents and their publication pairs (1279 patent-paper pairs)
Unit ofAnalysis
A paper/publication A patent/innovation A patent-paper pair
ResearchDesign
Econometric modelssupported by qualitative evidence from MIT TLO and various primary and secondary sources
Quantitative analyses:ANOVA and regression. Descriptive statistics and graphical representations
Differences-in-differences econometric modeling and analyses
Key Findings * Publications withmatched patent pairs are associated with higher cumulative citations. Since only an institutional policy allowing patents results in patents, such policy does not stifle cumulative knowledge dissemination and use.
* There is growingconvergence of public/academic and industry innovations in the life sciences in terms of basicness and appropriability, characterized by the Pasteur’s quadrant.
* Gene patentingimpedes temporal knowledge diffusion and use and decreases citations of paired publications once granted and become visible to the public, as predicted by the anti-commons effect.
* Patenting hinders knowledge diffusion and use to a higher
21
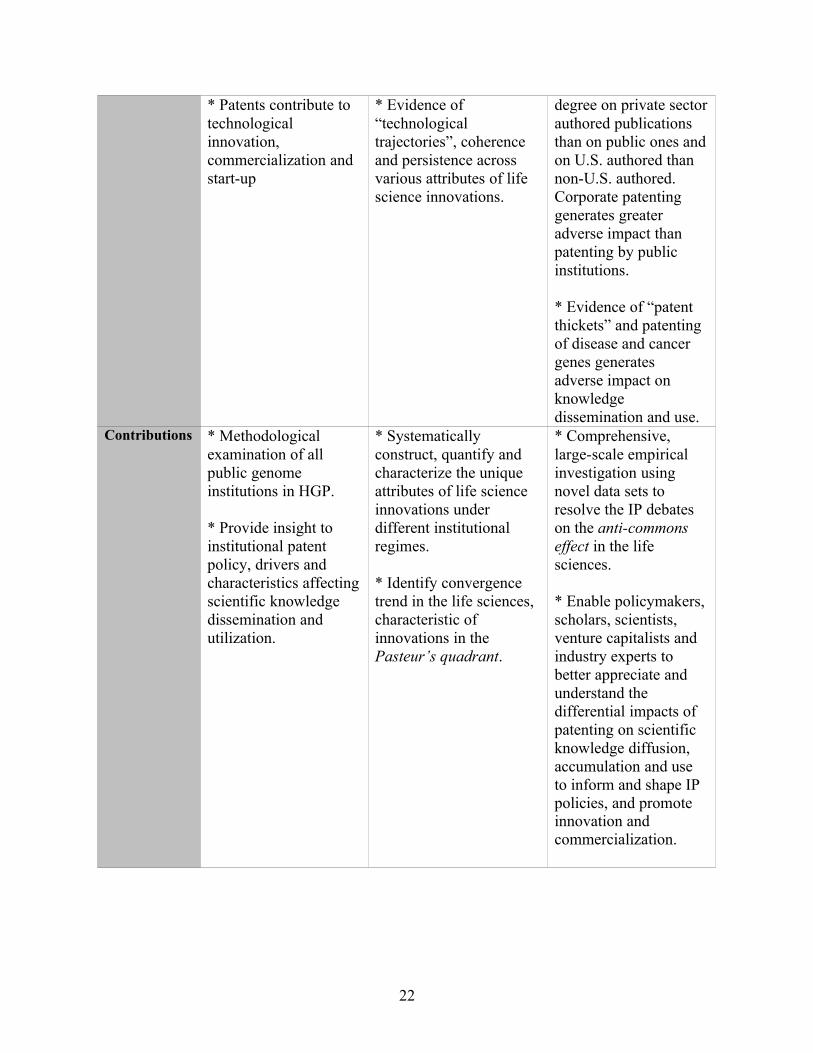
* Patents contribute totechnological innovation, commercialization and start-up
* Evidence of“technological trajectories”, coherence and persistence across various attributes of life science innovations.
degree on private sectorauthored publications than on public ones and on U.S. authored than non-U.S. authored. Corporate patenting generates greater adverse impact than patenting by public institutions.
* Evidence of “patent thickets” and patenting of disease and cancer genes generatesadverse impact on knowledge dissemination and use.
Contributions * Methodologicalexamination of all public genome institutions in HGP.
* Provide insight to institutional patent policy, drivers and characteristics affecting scientific knowledge dissemination and utilization.
* Systematicallyconstruct, quantify and characterize the unique attributes of life science innovations under different institutional regimes.
* Identify convergence trend in the life sciences, characteristic of innovations in the Pasteur’s quadrant.
* Comprehensive,large-scale empirical investigation using novel data sets to resolve the IP debates on the anti-commons effect in the life sciences.
* Enable policymakers, scholars, scientists, venture capitalists and industry experts to better appreciate and understand the differential impacts of patenting on scientific knowledge diffusion, accumulation and useto inform and shape IP policies, and promote innovation and commercialization.
22
CHAPTER 2:
LITERATURE REVIEW
2.1 Institutional Intellectual Property Regimes
The impact of intellectual property rights on the growth, diffusion and use of scientific
knowledge has been a central concern of economists, law and policymakers, technology and
sociology scholars and decision makers in public and private institutions (Heller and
Eisenberg, 1998; David, 2001, Campbell et al. 2002; Strauss et al. 2002; Walsh et al. 2002).22
Intellectual property can be used to exclude competitors and other users of scientific
knowledge and it could inhibit the efficient and unrestricted usage and access to knowledge.
Heller and Eisenberg (1998)23 in their landmark paper brings to limelight the “anti-commons”
effect, which describes the problem of complex and interlocking private claims, especially in
terms of intellectual property rights, deterring investment and stifling innovation instead of
spurring it. Conceivably, it may impede the free flow of scientific knowledge and the ability
of researchers to cumulatively build on each other’s discoveries, especially in the context of
22 Heller, M. A. and R. S. Eisenberg (1998). “Can Patents Deter Innovation? The Anti-commons in BiomedicalResearch.” Science, 280 (5364): 698-701.David, Paul. (2001) “From Keeping 'Nature's Secrets' to the Institutionalization of 'Open Science” StanfordWorking Paper #01-006.Campbell, Eric G., Brian R. Clarridge, Manjusha Gokhale, Lauren Birenbaum, Stephen Hilgartner, Neil A. Holtzman, and David Blumenthal (2002) Data Withholding in Academic Genetics: Evidence from a National Survey. Journal of the American Medical Association 287 (4):473 - 479.Straus, Joseph, Henrik Holzapfel, and Matthias Lindenmeir (2002) Empirical Survey on "Genetic Inventions andPatent Law". Munich.Walsh, John P., Ashish Arora, and Wesley M. Cohen (2002) The Patenting and Licensing of Research Tools andBiomedical Innovation: United States National Academies' Science, Technology and Economic PolicyBoard.23 Heller, M. A. and R. S. Eisenberg (1998). “Can Patents Deter Innovation? The Anti-commons in BiomedicalResearch.” Science, 280 (5364): 698-701.
23

Biomedical research (Heller and Eisenberg, 1998; Etzkowitz, 1998; David, 2004; Murray and
Stern, 2005).
To understand the economic rationale of the anti-commons effect, we have to first
contemplate the “linear” model of the relationship between basic and applied research, versus
the alternative institutional arrangements and incentive regimes of knowledge production in
the “new economics” of Science. (See also Section 5.2 for an elaboration on basic versus
applied research.) Under the traditional “linear” view, institutions and norms associated with
basic and applied research were distinguishable and discrete. It is viewed by many scholars
that under this model, applied research takes advantage of the publicly available and
accessible basic research, and transform them into innovations with practical and
commercializable outputs. Much theoretical and empirical economic work from the impact of
science and basic research on economic growth (Adams, 1990; Romer, 1990),24 to the
evaluation of university research and commercialization (Narin and Olivastro, 1992; Zucker
et al., 1998; Jensen and Thursby, 2001; Mowery et al., 2001)25 have been based on the
“linear” view.
24 Adams, J. (1990) “Fundamental Stocks of Knowledge and Productivity Growth.” Journal of PoliticalEconomy, 98, 673-702.Romer, Paul M. (1990) "Endogenous Technological Change." Journal of Political Economy, Vol. 98 (5) pp. S71-102.25
Narin, F., Olivastro, D. (1992) “Status Report: Linkage Between Technology and Science.” Research PolicyVol 21(3).Zucker, L., Darby, M., Brewer, M. (1998) “Intellectual Human Capital and the Birth of U.S. BiotechnologyEnterprises.” American Economic Review 88, 290-306.Jensen, Richard and Marie C. Thursby (2001) "Proofs and prototypes for sale: The licensing of university inventions." American Economic Review, 91:1, pp. 240-59.Mowery, David, Richard Nelson, Bhaven Sampat, and Arvids Ziedonis (2001) “The Growth of Patenting andLicensing by U.S. Universities: An Assessment of the Effects of the Bayh-Dole Act of 1980.” ResearchPolicy 30:99-119.
24

This has been harshly criticized by such scholars as Kline and Rosenberg (1986).26 The
“new” economics of science research builds on the classical concepts of “free access” and
“private property rights” (Weitzman, 1974)27 and is founded on the principles of the sociology
of science first proposed by Merton (1973).28 Open rights regime for basic research (or
“Science) essentially relies on the acceptance and adoptions of norms of full disclosure for
knowledge dissemination. As Merton (1973)29 and Dasgupta and David (1994)30 insightfully
pointed out that this regime rewards scientific priority (or first discovery), repeatable and
replicable scientific experiments through community recognition for those with the greatest
contribution to the pool of knowledge over a sustained period of time. It offers career
incentives such as tenure to encourage open disclosure through publication to ensure basic
research remains as public goods and readily accessible input to applied research.
By a sharp contrast, private property rights regime incentivizes researchers and scientists
through their right to exclude others and follow-on researchers and institutions in order to
appropriate values created by their knowledge through effective licensing and contractual
arrangements and/or commercialization of innovative technologies (Nelson 1959; Arrow
1962; Levin et al. 1987; Kremer 1997).31 Intellectual property rights under this regime is
26 Kline, Stephen J. and Nathan Rosenberg (1986) “An Overview of Innovation,” in The Positive Sum Strategy: Harnessing Technology for Economic Growthy, eds. R. Landau and N. Rosenberg, Washington DC:National Academy Press27 Weitzman, M. (1974) "Free Access vs. Private Ownership as Alternative Systems for Managing CommonProperty." Journal of Economic Theory 8, no. 2: 225-234, June.28 Merton, R. K. (1973). The Sociology of Science: Theoretical and Empirical Investigations. Edited by NormanStorer. Chicago: University of Chicago Press29 Ditto.30 Dasgupta, Partha. and David, Paul (1994) “Towards a New Economics of Science” Research Policy (23), 487-521.31
Nelson, R.R. (1959) “The Simple Economics of Basic Scientific Research,” Journal of Political Economy67(3), 297-306.Arrow, Kenneth (1962) "Economic Welfare and the Allocation of Resources for Invention." In The Rate andDirection of Inventive Activity, edited by Richard R. Nelson, 609-25. Princeton, NJ: Princeton University Press.
25
designed to promote innovation while maximizing disclosure of these technological
innovations after a limited number of years (i.e. 20 from the date of patent filing in the U.S.)
for long-term knowledge growth and utilization.
2.1.1 Pasteur’s Quadrant and Duality of Knowledge
The linear model depicts well certain relationship between knowledge and incentives for its
production and dissemination. However, this fails when knowledge demonstrates both basic
and applied value. To address this concern, Donald Stokes (1997) restructured the traditional
view of basic and applied research by incorporating the duality of research – a distinct, single
discovery that possesses both applied and basic characteristics (Figure 2.1).32 Unlike a uni-
dimensional depiction of research from basic to applied, Stokes reconceptualizes the nature of
research to vary along two axes: “considerations of use” and “quest for fundamental
understanding”. Distinct from the linear model of pure basic research, such as the
fundamental work by Neil Bohr, and of pure applied research, in the case of Thomas Edison,
Stokes described a Pasteur’s quadrant, or “use-inspired basic research” by scientists like
Louis Pasteur. Pasteur’s original work in the field of microbiology had advanced
fundamental understanding of the germ theory of disease as much as provided practical
application to the epidemic of cholera and rabies. (Geison, 1995;33 Stokes, 1997).
Levin, R., A. Klevorick, R. Nelson, S. Winter (1987) “Appropriating the returns from industrial R&D.”Brookings Papers on Economic Activity 3: 783-831.Kremer, M. (1997) “Patent Buy-Outs: A Mechanism for Encouraging Innovation,” NBER, Working Paper no.6304.32 Stokes, Donald (1997). Pasteur’s Quadrant: Basic Science and Technological Innovation. Washington D.C.: The Brookings Institution.
33 Geison, G. L. (1995) The Private Science of Louis Pasteur. Princeton, NJ: Princeton University Press.
26

Figure 2.1: Pasteur’s Quadrant: “Use-inspired Basic Research”
Consideration of Use?
NO YES
NOPure Applied Research (Edison)
YESPure Basic Use-Inspired
2.2 Intellectual Property Right Debates
Scientific knowledge generated through research often exhibits such duality and could fuel
further basic and applied research (Rosenberg, 1974; Stokes, 1997).34,35 Increasingly over the
past couple of decades, scientific knowledge traditionally stored in the public domain has
been linked to the application for and receipt of intellectual property rights like patents. Much
of these recent debates and public concerns have focused on the impact of patenting in
biomedical sciences such as on gene sequences and their applications and if they threaten
research in terms of knowledge dissemination, accumulation and restrict availability of new
biomedical innovations (e.g. Heller and Eisenberg, 1998; Henry et al., 2002; Cho et al.,
34 Rosenberg, N. (1974).” Science, Invention, and Economic Growth.” The Economic Journal, 84(333):90-108.35 Stokes, Donald (1997). Pasteur’s Quadrant: Basic Science and Technological Innovation. Washington D.C.: The Brookings Institution.
27

2003).36,37,38 These arguments about the benefits versus the adverse impacts of patenting are
ever more crucial in the United States, Europe and other developed countries as increasingly
more genes are discovered and patented, and genetic testing becomes part of standard medical
care. For example, in 2001 alone, it is estimated that about 1,500 patents were issued
claiming human genetic material.39,40 This controversy is especially manifest after the
completion of the Human Genome Project (HGP).41 These debates are central to my
dissertation research and are important for the formulation of alternative hypotheses and
explanations.
The next three sections describe in more details the debates in the economics, public policy,
sociology of science and ethics literature, in terms of the alternative theoretical arguments and
the evidence available, over the pros and cons of intellectual property rights (i.e. patenting) on
knowledge accumulation, dissemination and utilization.
36 Heller, M. A. and R. S. Eisenberg (1998). “Can Patents Deter Innovation? The Anti-commons in BiomedicalResearch.” Science, 280 (5364): 698-701.37 Henry, R. Michelle, Mildred K. Cho, Meredith A. Weaver, and Jon F. Merz (2002). “DNA Patenting andLicensing.” Science, Vol. 297, pp. 1279.38 Cho, Mildred K., Samantha Illangasekare, Meredith A. Weaver, Debra G. B. Leonard and Jon F. Merz (2003). "Effects of Patents and Licenses on the Provision of Clinical Genetic Testing Services." Journal of Molecular Diagnostics, Vol. 5, No.1: 3-8.39 Genetic Inventions, Intellectual Property Rights and Licensing Practices, Evidence and Policies, Organizationfor Economic Co-operation and Development (2002) [online] (cited 12.23.02)http://www.oecd.org/dataoecd/42/21/2491084.pdf40 Furthermore, according to the same OECD report, if one looks specifically at gene patents, grants have also climbed rapidly since the second half of the 1990s in the United States. One estimates that the total number ofDNA patents granted by the USPTO to date is somewhere around 10 000. In 2001 alone over 5 000 DNApatents were granted by the USPTO. Source: Leroy Walters, DNA Patent Database, Georgetown University and Foundation for Genetic Medicine, as cited on the World Survey of Genomics Research www.stanford.edu/class/siw198q/websites/genomics/41 See for example, Borson, D. Benjamin (1995). “The Human Genome Projects: Patenting Human Genes andBiotechnology. Is the Human Genome Patentable?” IDEA: The Journal of Law and Technology, Vol. 35, No. 4, p.461-496

28

2.2.1 Economics and Public Policy
Public institutions such as universities, their affiliated research institutes and to a lesser extent,
private companies and research institutions face the central dilemma: to patent or not to
patent for a multitude of reasons, especially when placed under public scrutiny.
An invention must satisfy the key criteria (or bar) set forth by the United States Patent and
Trademark Office (USPTO): utility (identification of useful purpose), novelty (not known or
used before the filing), non-obviousness (not an improvement easily made by someone trained
in the relevant area), and enablement (described in sufficient detail to enable one skilled in the
field to use it for the stated purpose) in order to be patentable.42 For patenting in biomedical
sciences, public policy seeks to address: “if the goal is to improve human health through
effective diffusion, utilization and accumulation of knowledge to create better diagnostics and
therapeutics, does patenting help to attain that goal? What are the pros and cons?” The
classical public policy rationale for patenting is intertwined with (and often motivated by) the
economic incentives for innovation, while instituting a formal mechanism for disclosure of
new inventions and discoveries.
A basic rationale in economics for patent grant is to “impede the emergence of competitors to
some newly-invented product or process, thereby allowing the inventor to realize, or at least
expect to realize, profits that will on average repay the cost of its inventive efforts.” (Scherer,
42 For detailed patentability criteria description, refer to “Patentable Subject Matter — Living Subject Matter.”USPTO Manual of Patent Examining Procedure (MPEP), Chapter 2100, Section 2105, Eighth Edition, August2001 (Latest Revision May 2004). http://www.uspto.gov/web/offices/pac/mpep/mpep_e8r2_2100_508.pdf
29

2002)43 In pharmaceutical and biotechnology, especially for products based on the human
gene sequence information, patents are more important for capturing the economic benefits
from innovation and stimulating R&D than most other industries according to survey
evidence presented by Levin et al. (1987) and Mansfield (1986).44 These also underscore the
public policy rationale for pro-patenting in these industries. There are three main empirical
explanations for this:
1) Precision in product definition and description by patent claims in pharmaceuticals
and biotechnology. This makes patenting particularly useful and “inventing around”
the patents less probable and less pervasive than other industries as the product may
not function even if one atom is substituted by another.
2) The exorbitant cost of R&D, pre-clinical and clinical trials to prove safety and
efficacy for therapeutic products and bio-molecular compounds under U.S. Food and
Drug Administration (FDA) regulations. In a recent study, Tufts University Center for
the Study of Drug Development (2001)45 conducted a survey of molecules introduced
into clinical testing between 1983 and 1994 by pharmaceutical firms and reported an
estimated cost of $802 million per approved drug, which included capitalized pre-
43 Scherer, Frederic M. (2002). “The Economics of Human Gene Patenting.” Academic Medicine, 77:1348–1367.44 Levin, Richard, Alvin Klevorick, Richard R. Nelson, and Sidney Winter (1987). ‘‘Appropriating the Returns from Industrial Research and Development.’’ Brookings Papers on Economic Activity: Microeconomics, pp.783–820.See also Mansfield, Edwin (1986). ‘‘Patents and Innovation: An Empirical Study.’’ Management Science, vol.32, p. 175.45 See Tufts University Center for the Study of Drug Development, News Release, July 16, 2001. Note that because therapeutic substances originated during the 1980s and early 1990s by biotechnology firms required onaverage fewer human test subjects and shorter testing periods than traditional ‘‘small molecule’’ entities, the average capitalized cost of approved biotech-based pharmaceuticals would undoubtedly be found to be lowerthan $800 million.

30

clinical, clinical, and failed-molecule costs. Most of the increased expenditure from
previous estimates is due to more extensive and costly clinical trials.
3) Protection and litigation rights against imitation and generic molecules. Product
formulation, process development and clinical trials to provide safety and efficacy
information are highly expensive for the market innovators. Patenting is one of the
most effective ways to safeguard these early innovators from their generic competitors
who may spend very few million dollars to take a free-ride, and to provide a
comfortable profit margin for future innovations.
The main theoretical benefits of patenting in terms of economics and public policy
formulation, as outlined by Mazzoleni and Nelson (1998)46 include:
1) Patent anticipation motivates scientists and researchers for useful invention as they are
rewarded for their discoveries in terms of financial incentives and reputation gains
(“invention motivation” theory).
2) Patents serve as mechanisms for inventors to disclose their inventions. This reduces
secrecy, facilitates wide knowledge dissemination about the inventions and their uses
and ensures access of researchers to new inventions (“invention dissemination”
theory).
46 Mazzoleni, R. and R. R. Nelson (1998). “Economic theories about the benefits and costs of patents.” Journal of Economic Issues 32(4): 1031-1052.
31

3) Patents on inventions induce and encourage investment of resources to develop and
commercialize them as patents provide a monopoly to the inventors and legally restrict
competitors from making, utilizing and selling the inventions without license or prior
consents (“induce commercialization” theory).
4) Patents force research into new and unexplored areas in a systematic and orderly
fashion while reducing the duplication of effort (“exploration control” theory).
However, the impact of patenting remains highly controversial. In addition to Heller and
Eisenberg (1998)47 who first observed the phenomenon of the “anti-commons”, Murray and
Stern (2005) have presented some evidences that under certain conditions patents may deter
the diffusion and growth of scientific knowledge and restrict researchers’ efforts for follow-on
discoveries in the life sciences. Mowery et al. (2001) in a separate study also asserted that
“widespread patenting and restrictive licensing terms may in some cases hamper, rather than
promote, technology transfer from universities to industry. These policies may also obstruct
the process of scientific research.” They further claimed that “an administrative emphasis on
patenting and licensing may interfere with the operation of other effective channels through
which university inventions reach commercial application.” Other anecdotal evidence for
anti-commons in genetic diagnostic research includes the debates ensuing the granting of
multiple patents to BRCA1 and BRCA2 genes to Myriad Genetics in 2001 and 2004, and in
genetic tests as described by Merz (1999) that “monopolization of medical testing services
threatens to restrict research activities… reduce patient access to testing… and interfere with
47 Heller, M. A. and R. S. Eisenberg (1998). “Can Patents Deter Innovation? The Anti-commons in BiomedicalResearch.” Science, 280 (5364): 698-701.
32

the practice of medicine.”48 Henry et al. (2002) also agreed that “patents on gene sequences
and their applications threaten research and impede availability of new medical
innovations.”49
In biomedical and genome research, the main arguments (with evidence where applicable)
against patenting include:
1) Overlapping and stacking patents prohibit downstream product development and
commercialization because of high royalty costs owed to all patent owners (for
example, in the case of patenting a single genomic sequence in several ways such as
an EST, a gene, and a SNP). This is the “anti-commons” argument (Heller and
Eisenberg, 1998).
2) Patents may restrict laboratories from offering clinical testing services for certain
diseases (e.g. haemochromatosis) which in turn will limit further discovery and
understanding in medical fields that require such services (e.g. Merz, 1999).50
3) Similarly, in the case of diagnostics and therapeutics, patents could restrict their
development by third parties because of the high costs associated with using patented
research data.
48 Merz, Jon F. (1999). “Disease Gene Patents: Overcoming Unethical Constraints on Clinical LaboratoryMedicine.” Clinical Chemistry, 45:3, 324-330.49 Henry, R. Michelle, Mildred K. Cho, Meredith A. Weaver, and Jon F. Merz (2002). “DNA Patenting andLicensing.” Science, Vol. 297, pp. 1279.50 Merz, Jon F. (1999). “Disease Gene Patents: Overcoming Unethical Constraints on Clinical LaboratoryMedicine.” Clinical Chemistry, 45:3, 324-330.
33

4) In addition, researchers have to incur costs and precious resources simply by trying to
decipher and navigating the thickets of patents in order to find out what patents apply
and who has rights to downstream products.
5) Unexpected licensing costs and possible infringement penalties will be incurred if new
patents are granted while companies are in the process of developing related products,
as patent applications remain secret until granted.
6) In the case of gene patenting, granting patents to partial and uncharacterized cDNA
sequences will inappropriately reward those who make routine discoveries (the easiest
step in the process) but penalize those who determine biological function or
application.
7) Patent filings may potentially be replacement to and cause reduction of journal articles
as a depository of knowledge.
“Research that is both basic and applied is increasingly instantiated as both a scientific
publication and patent.” (Murray and Stern, 2005) Extending from this insight, they asserted
that “scientific knowledge receiving formal IP often appears also in the form of scientific
research articles” also known as patent-paper pair and that “relative to the expected citation
pattern for publications with a given quality level, the anti-commons theory predicts that the
citation rate to a scientific publication should fall after formal IP rights associated with that
publication are granted.” This study by Murray and Stern (2005) gives limited empirical
34
evidence that although publications with patent pairs from Nature Biotech receive
cumulatively more forward citation than those without, sample of pairs exhibits a small fall in
citation rates post patent grant relative to un-patented research for academic articles only
(about 1 in 5 projects “stops”). Another study by Sampat (2005)51 that builds on their work
provides preliminary evidence that academic genomic patents can hinder subsequent scientific
research. Specifically, “genomic articles which are patented at a given point in time receive
approximately 8 percent fewer U.S. citations than similar articles on which patents have not
yet issued” as driven by patented sequences, while there are “no statistically significant
decline in citations after patent issue” in non-sequence genomic discoveries (“techniques”).
Naturally, these empirical findings have deep economic and public policy implications, and
have caused much heated debates in these fields.
Given the pro and cons of patenting discussed (especially in the biotechnology,
pharmaceutical and healthcare industry), public policy makers continue to struggle with,
among other issues, i) ways to maximize future (and downstream) research possibilities
through mechanisms such as legal precedents that exempt from injunction and the payment of
royalties the use of patented technologies solely for research purposes; ii) the (narrowing of)
interpretation of the scope of the claims in such patent applications; iii) the “patentability bar”
of utility, novelty, and non-obviousness and validity of such claims in applications;52
iv)
means of ensuring new product development is not obstructed or seriously hindered by an
51 Sampat, Bhaven N. (2005). “Genomic Patenting by Academic Researchers: Bad for Science?” Working Paper, School of Public Policy, Georgia Institute of Technology.52 For example, it appears that the USPTO has so far not been issuing patents for human DNA sequences without additional claims showing their utility, e.g., through identification of the proteins they express or the medicaltreatments they enable (Scherer, 2002).
35

array of prior patent claims,53 and putting in place channels to resolve possible bargaining
stalemates. These measures aim to ensure sustained enhancement to human health through
effective diffusion, utilization and accumulation of scientific knowledge to create improved
diagnostic and therapeutic products.
2.2.2 Sociology of Science: Ethos of Science
The “private property rights regime” (in the case of pro-patenting) runs counter to the “open
rights regime” (in the case of anti-patenting) for basic research, which rests on the norm of
full disclosure – to assist oneself and colleagues in the communal search for knowledge, and
free diffusion of knowledge. This builds on the groundwork in sociology of science by
Merton (1973).54 Merton described in one of the ethos of science, “communism”, the
substantive findings of science are a product of social collaboration and are assigned to the
community... The scientist's claim to 'his' intellectual 'property' is limited to that of
recognition and esteem..."55 In other words, Merton would assert that the way scientists
ensure they obtain “intellectual property” to their findings is by publishing promptly and
announcing openly the results to the scientific community.
This system of Open Science encourages the recognition of scientific priority by future
scientific generations, and that scientific results should be analyzed objectively, held
verifiable, testable and repeatable – these are partially described by “universalism”, another
53 For example, arguments threatening the availability of new therapeutic products could be resolved by mandatory arbitration, with the standard of damages for infringement being ‘‘reasonable royalties’’ instead of the ‘‘lost profits’’ standard commonly seen in infringement cases (Scherer, 2002).54 Merton, Robert K. (1973). “The Normative Structure of Science”, The Sociology of Science: Theoretical andEmpirical Investigations, Chicago, IL: The University of Chicago Press, Chapter 13.55 Ibid. pp. 273.

36

ethos of science proposed by Merton. It also promotes a reward system based on public
expenditure to those who consistently contribute toward knowledge production over a long
period of time. As described by Hull (1985),56 science is structured in such a way to ensure
the convergence of group and individual goals – scientists have to make their work public or
give up priorities. Open Science promotes scientific advancement from close collaboration
and cooperative sharing of results among the community of scientists and across generations
of scientists. It enhances the public goods nature of basic research and builds a foundation for
applied research. Empirical studies suggest that this system can be adopted not only by
universities and other public institutions but also (profitably) by private companies, many of
which are dependent on the life sciences (Cockburn and Henderson, 1998; Zucker et. al.,
1998; Murray, 2002).57,58,59
On the contrary, a different set of incentives underlie the “private property rights regime”, in
the case of pro-patenting. Granting of formal intellectual property rights incentivizes
scientists and researchers through the rights to exclude others, so that part or all of the value
created by their knowledge could be appropriated in the form of, for example, downstream
commercialization of new technology. Under this regime, patenting provides incentives
(financial, reputation gains or otherwise) for innovation while mandating the long-term full
disclosure of scientific and technological know-how for knowledge dissemination, utilization
and accumulation.
56 Hull, David (1985). “Openness and Secrecy in Science: Their Origins and Limitations.” Science, Technology and Human Values, 10:4-13.57 Cockburn, Iain, and Rebecca Henderson (1998). “Absorptive Capacity, Coauthoring Behavior, and theOrganization of Research in Drug Discovery.” Journal of Industrial Economics, 46(2), pp.157-18258 Zucker, L., M. Darby, and M. Brewer (1998). “Intellectual Human Capital and the Birth of U.S. Biotechnology Enterprise.” American Economic Review, 88(1), 290-30659 Murray, F. (2002). “Innovation as Co-evolution of Scientific and Technological Networks: Exploring TissueEngineering.” Research Policy, Vol. 31 (8-9), pp. 1389-1403
37

However, David (2004)60 asserted that patenting may shift academic culture, incentives and
restrict access to knowledge by arguing “… in a few specific research fields, and particularly
in the life sciences (biotechnology, pharmaceuticals and medical devices), where the share of
funding from industrial sources approaches twenty-five percent at the leading institutions, the
commercialization movement is perceptibly encroaching upon the culture of academic
research and challenging the ethos of collaborative, open science… [and] we must worry that
further and sustained policies of applying the same ‘remedy’ for the current fiscal situation of
the global open science system is likely to have profound and seriously adverse
transformative effects. In the end it could result in the paradoxical rise of excessively
duplicative research projects by scientists and engineers who find themselves effectively
isolated from recent additions to the stock of codified knowledge by increasingly dense
‘patent thickets,’ and by steeper ‘royalty stacking’ in the licenses imposed collectively by
owners of copyrights and database rights.”
In addition, patenting jeopardizes “disinterestedness” which refers to the restraining of
personal emotions, biases and financial attachment to scientists’ work – another norm of
science proposed by Merton. Disinterestedness involves institutional mechanisms to control
the motives for scientific research to advance scientific knowledge. Rewards constitute peer
recognition of scientific achievement, not through monetary gains. Ideally, the system of
reward and punishment in science should align the interests of the scientists with the scientific
institution to act in a disinterested manner (Merton, 1973).61 The incentives of patenting rests
60 David, Paul A. (2004). “Can "Open Science" be Protected from the Evolving Regime of IPR Protections?” Journal of Institutional and Theoretical Economics (JITE), 160, 1, pp. 9-3461 Merton, Robert K. (1973). “The Normative Structure of Science”, The Sociology of Science: Theoretical andEmpirical Investigations, Chicago, IL: The University of Chicago Press, Chapter 13, pp. 275-277.
38

on the shifting and growing acceptance of motives from pure academic recognition to a
balance with financial incentives and entrepreneurship (Etzkowitz, 1998).62,63 Such
incentives further promote the emotional attachment of scientists to their work and adversely
impacts scientists’ behavior in a disinterested manner.
Other Deviant Behaviors and Social Control
Extending from the previous discussion, it is worthwhile to consider some other forms of
deviant behaviors and social controls among modern scientists that Merton (1973 [1957]) and
other sociology of science scholars have described (Mulkay, 1969; Hagstrom, 1974;
Zuckerman, 1977). Priorities in particular scientific discoveries have often become the causes
of contention among biological scientists and other scientists alike – “on being first in
contributing new knowledge and in being recognized for it” and there is “often the ironic
consequences of this institutionalized pattern” (Smelser, 1988). Sometimes, the competition
may get too intense in Biology, and fraud, plagiarism and other forms of deviant behaviors
can occur when the desire for recognition surpasses the endeavor and will to advance
knowledge (Smelser, 1988).
Fraud is typically concerned with deviant behavior from the norms of “disinterestedness” and
“organized skepticism”. Fraud usually occurs when scientists knowingly attempt deceptive
activities for peer recognition or monetary gains. It can come in the forms of “forging” or
data fabrication, “trimming” or data manipulation, and “cooking” or data suppression
62 Etzkowitz, Henry (1998). “The norms of entrepreneurial science: cognitive effects of the new university- industry linkages.” Research Policy, 27, 823-833.63 For example, in the survey conducted by Etzkowitz (1998), although it identified half the faculty in MIT Biology department as having industrial ties in the late 1980s, the informant could identify only one of hiscolleagues as uninvolved.
39
(Babbage, 1976 [1830]). Data suppression is perhaps among the most difficult form of fraud
to identify as no lies are told and scientists have to decide about the selection of trustworthy
data. All three forms of fraud described by sociology of science scholars have occurred
occasionally in Biology.
Plagiarism, on the other hand, typically involves deviation from the norms of “communism”
and “universalism” as scientists illegitimately claim credits for work that was not originally
performed by them. When scientists engage in deliberate acts of deception by taking credits
where they are not theirs, including the copying of documents and wrongful appropriation of
intellectual properties, plagiarism occurs. The latter is usually harder to detect especially
under the circumstances of weak intellectual property right protection (such as copyrights and
patents), or a lack of consensus on what constitutes property rights in science.64 This situation
can be further complicated by instances of “multiples” as mentioned previously. This illegal
act, although sometimes observed in the scientific community, remains an ill-defined
normative area in modern science (Smelser, 1988).
Sociologists of science have considered that the social control of deviant behavior to entail
procedures for deterrence, detection and punishment. For example, to instill the biological
scientists with the norms through education and social pressure is one way of deterrence.
Another particularly effective social control is the “methodological canon of reproducibility
64 A particularly controversial example of intellectual property claim in Biology is a DNA patent application demanding protection for cDNAs associated with Expressed Sequence Tags (ESTs). The U.S. Patent & Trademark Office (USPTO) takes the position that an EST may be patentable if it meets the utility, novelty and unobviousness requirements (e.g. ESTs sequenced from areas of the genome that have never been sequenced before would meet the novelty and unobviousness requirements.) The issue can get even more controversial and complicated when the invention claims not only the EST itself, but also the full-length gene that encompasses the EST and other related genes that will hybridize to the EST under specified stringency conditions.
40

and actual replication” of scientific results (Smelser, 1988). The former is another form of
deterrence for fraud while the latter serves to detect such activity in the event that it actually
happens. Knowledge by biological scientists (and scientists in general) that such control
mechanisms exist and fraud in all its forms may potentially be detected in the future prevents
deviation from the norms. Other slightly less effective forms of social controls include
planned and unplanned scrutiny and public “whistle blowing”.
It is clear why scientists take these acts of deviant behaviors very seriously. To the biological
and medical scientists, fraud is “heinous”,65 “scandal” with a “quality of desecration about
it”,66 “shocking”,67 and “intolerable”.68 In modern scientific community, as many sociology
of science writers have observed, scientists take what other scientists claim as almost always
trustworthy and reliable. This widely held belief has saved much precious time and efforts to
verify what other scientists claim in every case. Zuckerman (1977) sums it up succinctly, “the
institution of science involves an implicit social contract between scientists so that each can
depend on the trustworthiness of the rest… the entire cognitive system of science is rooted in
the moral integrity of individual scientists.” This applies to Biology, as well as other modern
science disciplines, particularly well.
65 Immunologist – Medawar, Peter (1976). “The Strange Case of the Spotted Mice.” New York Review of Books,23:6-11.66 Molecular biologist – Luria, Salvadore (1975). “What Makes a Scientist cheat?” Prism, (May): 15-18, 44.67 Medical scientist – Petersdorf, Robert G. (1986). “ The Pathogenesis of Fraud in Medical Science.” Annals ofInternal Medicine, 104:252-254.68 Biochemist and editor of Science, Koshland, Daniel (1987). “Fraud in Science.” Science, 235:141.
41

2.2.3 Ethics
One of the main arguments against patenting in the realm of ethics is that patenting is against
human dignity, especially in the case of gene or DNA patenting. Allowing human genes to be
patented suggests to many that they are commodities. According to Holland (2003),69
“biotechnology products are not widgets," and patenting genes may "erode our dignity, as the
process results in increasing acceptance that it's okay to buy and sell things that speak to us of
our humanity."
While patenting of genes or DNA runs the risk of diminishing respect for human dignity, pro-
patent advocates argue that some risk may be acceptable if such system results in an overall
increase in human well-being. That is, patenting helps to achieve the goal of improving
human health through effective diffusion, utilization and accumulation of knowledge to create
beneficial medical products and services in diagnostics and therapeutics.
It is also fundamentally arguable that “part of nature” or basic constituent of life can be
patented,70,71 allowing one person or organization to control part or all of another organism
and monopolize certain gene test markets.
69 Interview with Suzanne Holland, affiliate associate professor, Department of Medical History and Ethics,
University of Washington School of Medicine, in the article "Focus On Bioethics: Of SNPS, TRIPS, and Human Dignity.” BioProcess International, January Issue, 2003.70 Life forms were considered a part of nature and were not patentable before 1980. However, the 5 to 4 U.S. Supreme Court decision in the Diamond v. Chakrabarty case changed this – that genetically engineered(modified) bacteria were patentable because they did not occur naturally in nature. Chakrabarty in this case hadmodified a bacteria to create an oil-dissolving bioengineered microbe.71 Joint Appeal against Human and Animal Patenting. Washington, DC: National Press Club, 1995. This petition was organized by social activist Jeremy Rifkin to arouse religious opposition to any patents on "the richgenetic resources of the Earth's biological commons," especially human genes. He had secured the signatures of186 Roman Catholic, Protestant, Jewish, Buddhist, Hindu, and Muslim American religious leaders on a petition to ban biological patents by September.

42
This issue is complicated by the rapid advancement in science and technology. A
considerable novel, and non-obvious discovery of a sequence in the 1990s, such as the
association of the BRCA-1 gene to breast cancer may not seem to pass the patentability bar
today because of improved technology that eased such identification. It is also unclear that
patent application filed for gene fragments (e.g. ESTs and SNPs) will extend to the use of the
entire gene.
However, a pro-patenting argument is that while strong theological reservations exist,72 “it is
hard to equate assigning a patent to a DNA strip with ownership of a human body” (Caplan
and Merz, 1996).73 It would be a violation of human spirit to sell bodies into slavery because
of closely linked personal identity with our bodies, but it would not be such an obvious
violation to grant exclusive rights to develop and utilize part of a chromosome to a
biotechnology firm or government agency.
Furthermore, pro-patenting advocates argue that it has already been widely recognized in the
U.S. and in many European countries that genes of known function (human or otherwise) are
patentable. Granting of patents to gene fragments is acceptable as gene sequencing is
perceived as discovering "non-naturally occurring compositions of matter," and therefore
passes the patentability criteria of novel, useful and non-obvious.
Last but not least, there is the issue of compassion. Patenting may restrict access of
diagnostic testing and life-saving therapies to the poor and uninsured because of escalating
72 Pope John Paul II. Address to Pontifical Academy of Sciences, October 28, 1994. Vatican. L'OsservatoreRomano (weekly edition), 1994;45(9 November):3.73 Caplan, A.J., and J.F. Merz (1996). “Patenting Gene Sequences” (Editorial). British Medical Journal, 312:926.
43

costs. This is the most vulnerable segment of society that needs them most. These remain as
critical ethical issues to be addressed.
2.3 Research, Development and the Innovative Process
Research and development (R&D) in the public sector and university-affiliated research
centers create new knowledge and tools and produces highly trained researchers. All these
contribute to the growth, dissemination and utilization of knowledge in the public domain and
private sector R&D and commercialization efforts, as well as create beneficial spillover
effects.
R&D can be viewed as inputs to the innovative process, while patents can be viewed as an
output. It is important to have a basic understanding of the innovative process and the
distinction between invention and innovation. The innovative process can be generally
characterized into three-stage: invention, innovation, and imitation (Hall, 1994, p. 21).
Invention is defined as “…the devising of new ways of attaining given ends … [embracing]
both the creation of new things previously non-existent, using either new or existing
knowledge, and the ‘creation’ of things which have existed all the time (e.g. penicillin).”74
Inventive activity requires inputs such as university research although much inventive activity
can be characterized as utilizing existing knowledge in a new or different way. As inventions
74 Hall, Peter (1994) Innovation, Economics and Evolution: Theoretical Perspectives on Changing Technology inEconomic Systems. London: Harvester Wheatsheaf.Hall quoting from page 51 of Kennedy, C. and A. Thirlwall (1972) "Technical Progress", Economic Journal, 82,11-72.
44

may be patented, they can be considered as an input to the development of an innovation.
Innovation is defined as "the commercial application of inventions for the first time"
[Kennedy and Thirlwall (1972, p. 56) referenced by Hall (1994, p. 21)]. Invention brings
about an idea while commercialization of that idea occurs in innovations for imitation to
occur, whereby successful innovations are adopted throughout the market for society benefits.
This dissertation is primarily concerned with the characteristics (i.e. basicness and
appropriability) of innovations in the life sciences, the diffusion and accumulation of
scientific knowledge, and the impact of patenting on that process, set against the backdrop of
the Human Genome Project. It is natural to begin with a discussion and historical review of
the Human Genome Project in the next Chapter.
45

CHAPTER 3:
HISTORY OF THE HUMAN GENOME PROJECT
The series of heated debates and public concerns as discussed about whether IP on human
gene sequences and their applications threaten research and restrict availability of new
biomedical innovations,75 as well as questions about the benefits versus the adverse impacts
of patenting have become increasingly more critical in the United States, Europe and other
developed countries as the International Human Genome Sequencing Consortium completed
the sequence of the human genome for the Human Genome Project (HGP).76
The Human Genome Project, a 13 year research effort jointly coordinated by the U.S.
Department of Energy (DOE) and National Institute of Health (NIH) to identify the genetic
blueprint of human being, forms the setting of this dissertation. As one of the most significant
life science research projects ever undertaken, its funding totaled over $3.8 billion in the U.S.
between 1988 and 2003. Figure 3.1 illustrates the rapidly escalating amount of HGP funding
alone.
75 For example, see Heller, M. A. and R. S. Eisenberg (1998). “Can patents deter innovation? The anti-commons in biomedical research.” Science 280 (5364): 698-701; andHenry, R. Michelle, Mildred K. Cho, Meredith A. Weaver, and Jon F. Merz (2002). “DNA Patenting andLicensing.” Science, Vol. 297, pp. 1279.76 The International Human Genome Sequencing Consortium for the Human Genome Project had completed and announced in 2004 that the final sequence of the human genome encodes about 20,000 to 25,000 protein-codinggenes. See Nature Vol. 431, p. 927 and 931
46

$ M
illio
ns
1988
1989
1990
1991
1992
1993
1994
1995
1996
1997
1998
1999
2000
2001
2002
2003
Figure 3.1: U.S. Human Genome Project Funding (1988 – 2003)
U.S. Human Genome Project Funding
50045040035030025020015010050
0
NIH HGP Funding ($ M)
DOE HGP Funding ($ M)
Fiscal Year
Note: These numbers do not include construction funds, which are a very small part of the budget. Source: U.S. Department of Energy, 2004
Before we turn our focus to the strategic patenting decisions for the genome centers in
Chapter 4, it is critical to first consider the important historical landmarks of the HGP, with
specific references to the roles played by these genome centers and to understand the major
debates over patenting on the ethical, legal and social fronts.
3.1 Historical Landmarks of the Human Genome Project and GenomeCenters
The Human Genome Project has had a long and distinguished history of germination in the
minds of scientists, legislators and government agencies and its sustained development to its
47

completion, gaining broad support along the way, is a strong testimony of its critical
importance, which underlines the rationales behind this research. 77
Robert Sinsheimer, a distinguished molecular biologist and senior administrator at the
University of California, started the first serious push to sequence the human genome in 1984
by proposing to the UC President David Gardner to establish an institute to sequence the
human genome on University of California Santa Cruz (UCSC) campus. Although the
proposal was not funded, Sinsheimer continued the discussion with other molecular biologists
at UCSC then including Harry Noller, Robert Edgar, and Robert Ludwig.
In May of 1985, Sinsheimer held a meeting in UCSC and again made the dramatic
proposition that the entire human genome should not only be mapped with scattered but
specific road-markers along the highway, but also sequenced to determine the order of each
A, G, C and T. A number of distinguished biologists active in genetics and gene mapping
were present during the meeting, including Harry Noller, now the Sinsheimer Professor of
Molecular Biology at UCSC; geneticist David Botstein, now the director of the Lewis-Sigler
Institute for Integrative Genomics at Princeton University; Leroy Hood, now the President of
the Institute for Systems Biology in Seattle; and the 1980 Nobel laureate in Chemistry, Walter
Gilbert of Harvard University, who later became an enthusiastic advocate of this notion. At
around the same period of time, other scientists made independent proposals for the
sequencing of the human genome, notably Renato Dulbecco of the Salk Institute and Charles
DeLisi of the U.S. Department of Energy (DOE).
77See, for example:i) DOE Major Timeline: http://www.ornl.gov/sci/techresources/Human_Genome/project/timeline.shtmlii) Chapter 1 Gert, Bernard et al. (1996). "Morality and the New Genetics: A Guide for Students and Health CareProviders." Boston, MA: Jones and Bartlett, Publishersiii) Factiva online major news and publication: www.factiva.com
48

The proposal seemed idealistic and almost logistically impossible78 – the human genome
encompasses about 3 billion bases of DNA and the technology then only allowed reading
lengths of about 300 bases in each analysis. Decades of work by a huge number of research
scientists and technicians would be required to perform and complete the job. In addition,
analysis of a single base would cost over $10 at that time and it often required more than a
day to sequence 50 to 100 bases. Such suggestion to sequence the genome then was not only
ambitious but also prohibitively expensive.
Furthermore, opponents argued that sequencing the human genome would be a vast waste of
effort as majority of it, maybe as high as 95%, does not encode useful protein or regulatory
information, known as “junk DNA”. Such enormous effort to obtain detailed sequence
information about DNA, as they argue, would have little hope of shedding useful insight into
biological function. However, the proposal prevailed.
In early 1986, from the Office of Health and Environmental Research (OHER) of U.S.
Department of Energy (DOE),79 now Office of Biological and Environmental Research
(BER), biophysicist and administrator Charles DeLisi80 and David A. Smith81, director of the
78 Lander, Eric S. and Robert A. Weinberg (March 2000). “Genomics: Journey to the Center of Biology.”Science, Vol. 287, Issue 5459, 1777-1782.79 After the atomic bomb was developed and used, the U.S. Congress charged DOE's predecessor agencies (theAtomic Energy Commission and the Energy Research and Development Administration) with studying and analyzing genome structure, replication, damage, and repair and the consequences of genetic mutations, especially those caused by radiation and chemical by-products of energy production. From these studies grew the recognition that the best way to study these effects was to analyze the entire human genome to obtain a reference sequence. Planning began in 1986 for DOE's Human Genome Program and in 1987 for the National Institutes of Health's (NIH) program. The DOE-NIH U.S. Human Genome Project formally began October 1, 1990, after the first joint 5-year plan was written and a memorandum of understanding was signed between the two organizations.80 DeLisi, Charles (July 2001). “Genomes: 15 Years Later. A Perspective by Charles DeLisi, HGP Pioneer.”Human Genome News, Vol.11, No. 3-4. http://www.ornl.gov/sci/techresources/Human_Genome/publicat/hgn/v11n3/05delisi.shtml81 Smith, David A. (September-December 1995). “Evolution of a Vision: Genome Project Origins, Present andFuture Challenges, and Far-Reaching Benefits”. Human Genome News, 7(3-4): 2.

49

DOE Human Genome Program commissioned and held the first Santa Fe conference to assess
the feasibility of a Human Genome Initiative and the role of DOE in sequencing the entire
human genome, as a follow-up of the previous Santa Cruz meeting.
Later in 1986, following the Santa Fe conference, OHER of DOE, announced the Human
Genome Initiative. With $5.3 million, pilot projects first began at DOE national laboratories
to develop critical technologies and resources – three genome research centers were
established between 1988 and 1989 at Lawrence Berkeley National Laboratory (LBNL),
Lawrence Livermore National Laboratory (LLNL), and Los Alamos National Laboratory
(LANL).
In December 1987, legislation to begin debating a mammoth project that would provide a
detailed analysis of all the genes in the human body was introduced in the Senate, sponsored
by Senator Pete Domenici (R-N.M.), Edward M. Kennedy (D-Mass.), Lawton Chiles (D-Fla.),
Patrick J. Leahy (D-Vt.) and Bob Graham (D-Fla.). The bill will focus on establishing a
freestanding National Biotechnology Policy Board and Advisory Panel in order to keep a high
level of competitiveness of the biotechnology industry in the U.S. through policies that would
“enhance the efficient and timely advance of basic and applied biotechnology-related
research”. The bill also centered on a huge project to map and sequence the human genome.
However, the bill only authorizes enough funds to support the board through 1993.82
In the same year, congressionally chartered Department of Energy (DOE) advisory
committee, Health and Environmental Research Advisory Committee (HERAC),83
http://www.ornl.gov/sci/techresources/Human_Genome/publicat/hgn/v7n3/02smithr.shtml82 The Washington Post (12-22-1987), “Congress Begins to Consider the Genome Project”.83 http://www.ornl.gov/sci/techresources/Human_Genome/project/herac2.shtml
50

recommended a 15-year, multidisciplinary, scientific, and technological undertaking to map
and sequence the human genome. DOE also designated important multidisciplinary human
genome centers that year, including the Whitehead Institute Center for Genome Research at
Massachusetts Institute of Technology, Washington University School of Medicine Genome
Sequencing Center, University of Washington Genome Center in the U.S. National Institute
of General Medical Sciences at National Institutes of Health84
(NIGMS-NIH) began funding
of genome projects that year.
In 1988, congressional Office of Technology Assessment (OTA) and National Academy of
Sciences (NAS) National Research Council (NRC) committees recommended a concerted
genome research program. Over the next year, DOE and NIH held several other meetings and
independent hearings by OTA and by NAS to discuss the plans for the HGP.
Also in the same year, the Human Genome Organization (HUGO)85 was founded by scientists
to coordinate efforts internationally. The first annual Cold Spring Harbor Laboratory meeting
on human genome mapping and sequencing was also held.
That year, Congress funded both the Department of Energy (DOE) and the National Institute
of Health (NIH) to start further exploration of the human genome, and DOE and NIH signed a
84 The National Institutes of Health (NIH), founded in 1887, is one of the world's premier medical research centers, and the Federal focal point for medical research in the U.S. The NIH, comprising 27 separate Institutes and Centers , is one of eight health agencies of the Public Health Service which, in turn, is part of the U.S. Department of Health and Human Services.
The primary mission of NIH is to “acquire new knowledge to help prevent, detect, diagnose, and treat disease and disability, from the rarest genetic disorder to the common cold…[and] to uncover new knowledge that will lead to better health for everyone.” By its key involvement in the HGP, NIH works toward that mission and advances human health by “conducting research in its own laboratories; supporting the research of non-Federal scientists in universities, medical schools, hospitals, and research institutions throughout the country and abroad; helping in the training of research investigators; and fostering communication of medical and health sciences information.”85 http://www.gene.ucl.ac.uk/hugo/
51

formal Memorandum of Understanding (MOU),86 which first outlined plans for cooperation
on genome research to “coordinate research and technical activities related to the human
genome”.
These activities and the reports published culminated in 1988 in the establishment of the
Genome Office at the National Institute of Health headed by Nobelist James Watson.87 This
subsequently became the National Center for Human Genome Research (NCHGR) in October
1989 by Congressional authorization to carry out the role of NIH in the HGP. NCHGR was
created to support the development of resources and technology that would accelerate genome
research and its application to human health. In 1997, the NCHGR at NIH was restructured
and renamed the National Human Genome Research Institute (NHGRI) by the U.S.
Department of Health and Human Services (DHHS) to allow NHGRI to operate under the
same legislative authorities as other NIH research institutes. It became one of the 27 institutes
and centers that make up of NIH. Advisory boards were created to serve both agencies (NIH
and DOE).88
Meetings had been held twice annually on succeeding days since several
committees are "joint", especially the one on data (Joint Informatics Task Force).
In 1989, the biology community called for a $3 billion human genome project to identify and
decipher each of the estimated 30,000 genes that govern the form and function of the human
body (also see Figure 2).89,90 The largest funding agency of HGP activities, NHGRI, was
86 Human Genome News, May 1990; 2(1), “1988 Memorandum Sets Foundation for Interagency Cooperation”. http://www.ornl.gov/sci/techresources/Human_Genome/publicat/hgn/v2n1/03memo.shtml87 Washington Post (9-12-89), “The Man behind the Double Helix; Gene-buster James Watson Moves on toBiology’s Biggest Challenge – Mapping Heredity”.88 http://www.genome.gov/1000090589 Chicago Sunday Times (1-8-1989), “Scientists Calling for U.S. to Spend $3 Billion to Identify HumanGenes”.90 The Human Genome Project is sometimes reported to have a cost of about $3 billion. However, this figure refers to the total projected funding over a 13-year period (1990–2003) for a wide range of scientific activities
52

funded yearly through Congressional appropriation through a standard budget process.91 In
turn, the NHGRI was guided by a series of five-year plans outlining the priorities and goals of
the HGP. These plans detailed the objectives of the program to the scientific community and
informed the public while ensuring measurable aims to steer the work and determine
NHGRI’s progress. In allocating funds, NHGRI published areas of research interest in
program announcements so that individual scientists or academic institutions; non-profit
organizations; community hospitals and companies could apply for funding to carry out
research in these areas. A two-tier, peer-review process evaluated all application and NHGRI
funded the highest ranked proposals which were within the program priorities.92
Entering the 1990, DOE and NIH jointly presented the 5-year U.S. HGP plan to Congress.
The report scrutinized the present state of genome science and detailed the complementary
approaches of the two agencies for attaining scientific goals while laying out concrete plans
for governing research agendas. The report also explained the collaborative effort among
U.S. and international agencies and presented the budget of “…about $200 million per year
related to genomics. These include studies of human diseases, experimental organisms (such as bacteria, yeast, worms, flies, and mice); development of new technologies for biological and medical research; computational methods to analyze genomes; and ethical, legal, and social issues related to genetics. Human genome sequencing represents only a small fraction of the overall 13-year budget.91 Every year, the President submits a budget request for the entire federal government to Congress, which then conducts hearings on that budget request. Different committees have the authority to approve specific sectionsof the federal budget. Representatives of NHGRI testify before the House and Senate subcommittees on Labor; Health and Human Services; Education; and related agencies, where Congress is updated on theaccomplishments, needs and opportunities of NHGRI. Congress also hears testimony from public witnesses such as experts in genetic research, or representatives of genetic disease advocacy groups.
After listening to the testimony, the House of Representatives determines a funding level for NHGRI andsends its recommendation to the Senate. After the Senate conducts hearings, both bodies of Congress meet to agree on funding levels for all of the institutes and centers of the National Institutes of Health (NIH), including NHGRI. Congress then sends an appropriation bill with the recommended funding levels to the President. After the President signs the budget, NHGRI receives its funding.
See http://www.house.gov/rules/budget_pro.htm and http://www.genome.gov/1000093392 NHGRI Budget and Financial Information, 2004 http://www.genome.gov/10000933
53

for approximately 15 years.” 93 The estimated 15-year project formally began in this year.
Several projects had begun to mark gene sites on chromosome maps as sites of mRNA
expression, while research and development were also underway for efficient production of
more stable, large-insert Bacterial Artificial Chromosomes (BACs).94 The promise and
benefits of human genome project started to gain increasingly wider media attention in major
newspapers and publications.95, 96, 97
In 1991, human chromosome mapping data repository, Genome Database (GDB),98 an
international collaboration in support of the human genome project, was established. RTI
International, a prominent research institute located in the Research Triangle Park in North
Carolina, hosted it.
In the meantime, the technology and science were improving dramatically to produce high
cost reduction in sequencing efforts. It is interesting to note that by 1991, the cost of
sequencing 10,000 bases in a single day has dropped to about a dollar a base (Hunkapiller et
al, 199199). (Also see Figure 3.2A). By 1993, many laboratories concurrently used robotic
analyzers to sequence 500,000 bases daily and they cost about $0.10 to $0.15 a base. In terms
of genome mapping using restriction fragment length polymorphisms (RFLP) technology,
93 Human Genome News, May 1990; 2(1), “5-year Plan Goes to Capitol Hill”. http://www.ornl.gov/sci/techresources/Human_Genome/publicat/hgn/v2n1/04five.shtml
For more details of the document, see:http://www.ornl.gov/sci/techresources/Human_Genome/project/5yrplan/summary.shtml#toc94 Bacterial Artificial Chromosomes (BACs) was one of the most utilized resources for the following reasons: i)the large size was a good match for capabilities of high throughput sequencing centers; ii) compared to earlier resources, chimerism (having gene segments from multiple chromosome sites combined in one clone) is largely, if not completely absent.; iii) stability in their bacterial hosts; iv) the BACs are very useful for making transgenicanimals with segments of human DNAs, in support of the functional analysis of genes.95 Washington Post (8-5-90), “Cracking the Body’s Code”.96 The Wall Street Journal (8-10-90), “Scientists Find First Clues on How Gene Could Cause Nerve Tumors”.97 Business Week (5-28-90), “Cover Story – The Genetic Age”, Vol. No. 3161, Pg 68, McGraw-Hill, Inc.98
http://www.gdb.org/99 Hunkapiller T, Kaiser RJ, Koop BF, Hood L. "Large-scale and Automated DNA Sequence

Determination." Science 254: 59-67, 1991.
54
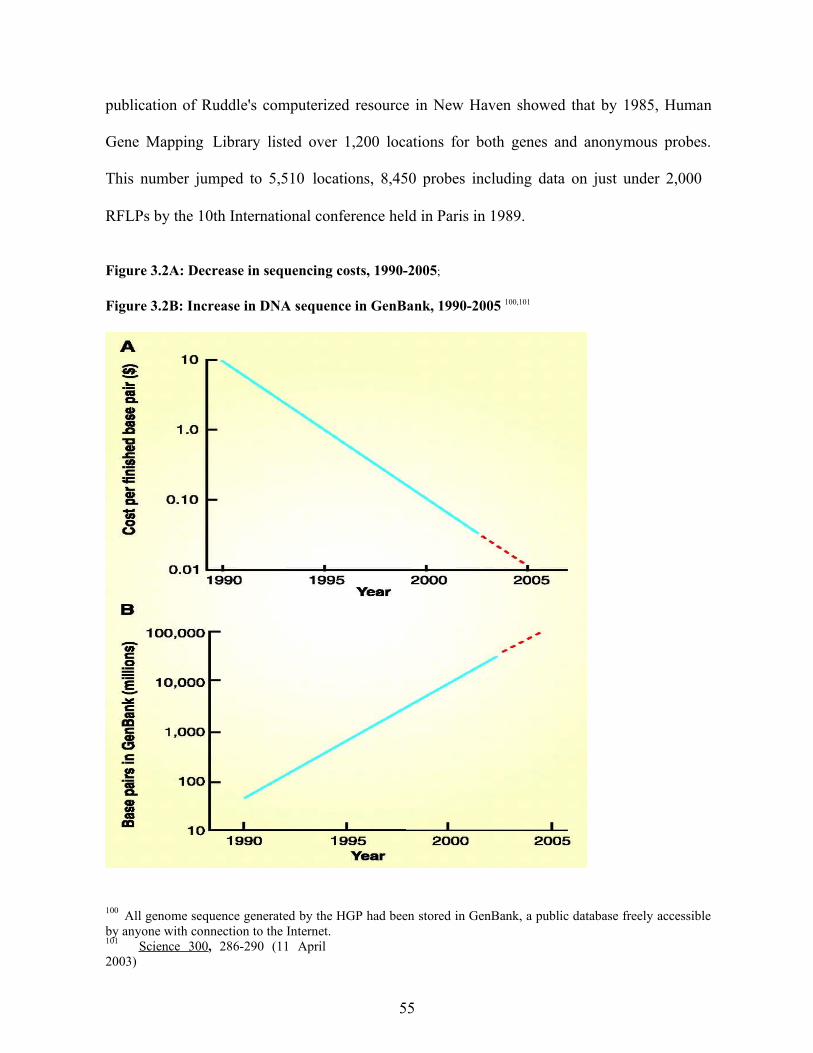
publication of Ruddle's computerized resource in New Haven showed that by 1985, Human
Gene Mapping Library listed over 1,200 locations for both genes and anonymous probes.
This number jumped to 5,510 locations, 8,450 probes including data on just under 2,000
RFLPs by the 10th International conference held in Paris in 1989.
Figure 3.2A: Decrease in sequencing costs, 1990-2005;
Figure 3.2B: Increase in DNA sequence in GenBank, 1990-2005 100,101
100 All genome sequence generated by the HGP had been stored in GenBank, a public database freely accessible by anyone with connection to the Internet.101 Science 300, 286-290 (11 April 2003)
55

The ensuing years saw continued and promising development and improvement of resources,
technologies and scientific techniques, and optimism for the potential for commercialization
of the human genome sequences.102 In 1992, low-resolution genetic linkage map of entire
human genome was published. The guidelines103 for data release and resource sharing of the
human genome project were also announced by DOE and NIH to encourage data and resource
sharing.
In 1993, the international Integrated Molecular Analysis of Gene Expression (IMAGE)
Consortium104 was established to coordinate efficient mapping and sequencing of gene-
representing cDNAs. The consortium produced highly cited scientific papers that made
significant contribution to the progress of the Human Genome Project.105 At the same time,
DOE and NIH revised their initial 5-year plan for the Human Genome Project due to rapid
advances in genome research and more in-depth understanding of how to attain long-term
objectives.106,107 In terms of technology advances, Lawrence Berkeley National Laboratory
(LBNL) of DOE implemented a novel transposon-mediated chromosome-sequencing system
while Gene Recognition and Analysis Internet Link (GRAIL) sequence-interpretation
102 Business Week (3-2-92), “Cover Story – This Genetic Map will Lead to a Pot of Gold”, Vol. No. 3254, Pg74, McGraw-Hill, Inc103 Human Genome News, January 1993; 4(5), “NIH, DOE Guidelines Encourage Sharing of Data, Resources.”http://www.ornl.gov/sci/techresources/Human_Genome/publicat/hgn/v4n5/04share.shtml104 Human Genome News, Mar.-Apr. 1995; 6(6), “IMAGE Characterizes cDNA Clones”. http://www.ornl.gov/sci/techresources/Human_Genome/publicat/hgn/v6n6/3image.shtml105 The Scientist 13[4]: 17, Feb. 15, 1999. Hot Papers In Genomics: G. Lennon, C. Auffray, M. Polymeropoulos,M.B. Soares, "The I.M.A.G.E. Consortium: An Integrated Molecular Analysis of Genomes and Their Expression," Genomics, 33:1512, 1996. (Cited in more than 290 papers since publication). http://www.ornl.gov/sci/techresources/meetings/wccs/hot1_990215.html106 Human Genome News, November 1993: 5(4), “U.S. Human Genome Project Updates Goals”. http://www.ornl.gov/sci/techresources/Human_Genome/publicat/hgn/v5n4/5yrtextr.shtml107 Science 262, 43-46 (Oct. 1,

1993)
56

service108 maintained by Oak Ridge National Laboratory (ORNL) of DOE started to provide
Internet access.
1994 brought in encouraging news that the genetic-mapping 5-year goal presented by DOE
and NIH was achieved one year ahead of schedule.109 The second-generation DNA clone
libraries representing each human chromosome were also completed that same year by
Lawrence Livermore National Laboratory (LLNL) and Lawrence Berkeley National
Laboratory (LBNL).
In terms of scientific breakthroughs, LANL and LLNL respectively announced in 1995 the
completion of high-resolution physical maps of chromosome 16 and 19.110 Moderate-
resolution maps of chromosomes 3, 11, 12, and 22 maps were also published.111 Research led
by scientists from the MIT Whitehead Institute Center for Genome Research and Genethon
revealed and published the physical map of the human genome with more than 15,000
sequence tagged site (STS) markers.112
In 1996, DOE and National Center for Human Genome Research (NCHGR) at National
Institutes of Health issued human subject guidelines for large-scale sequencing projects.113 In
the same year, DOE started another 6 pilot projects on BAC and sequencing.114, 115 This new
108 http://genome.ornl.gov/109 Human Genome News, Nov. 1994; 6(4):1, “Genetic Map Goal Met Ahead of Schedule”http://www.ornl.gov/sci/techresources/Human_Genome/publicat/hgn/V6N4/MAPGOALS.shtml110 Human Genome News, Jan.-Feb. 1995; 6(5): 2, “High-Resolution Physical Maps of Chromosomes 16 and 19Completed”. http://www.ornl.gov/sci/techresources/Human_Genome/publicat/hgn/v6n5/2safchrm.shtml111 Human Genome News, Jan.-Feb. 1995; 6(5): 14, “Groups Publish Detailed Chromosome 22 Map”. http://www.ornl.gov/sci/techresources/Human_Genome/publicat/hgn/v6n5/14chrom2.shtml112 Human Genome News, January-March 1996; 7(5), “Detailed Human Physical Map Published by Whitehead- MIT”. http://www.ornl.gov/sci/techresources/Human_Genome/publicat/hgn/v7n5/05detail.shtml113 Human Genome News, July-September 1996; 8:(1), “DOE, NCHGR Issue Human Subject Guidelines”.http://www.ornl.gov/sci/techresources/Human_Genome/publicat/hgn/v8n1/08humans.shtml114 These pilot projects to test the feasibility of this new strategy, its technologies, and its economics were conducted by Mark Adams [The Institute for Genomic Research (TIGR)], Leroy Hood (University of
57

strategy to assemble ordered, overlapping sets (or contigs) of high-quality, sequence-ready
clones for complete genome sequencing was prompted by the availability of newer, more
stable clone resources containing large human DNA inserts (up to 150,000 bases).
Another landmark event that occurred during that year is the large-scale sequencing strategy
meeting for international coordination of human genome sequencing in Bermuda on February
25-28, 1996 sponsored by the Wellcome Trust, U.K. Medical Research Council. About 50
scientists from countries publicly supporting large-scale human genome sequencing attended
the conference, which was designed to coordinate, compare, and evaluate human genome
mapping and sequencing strategies; consider the potential role of new technologies in
sequencing and informatics; and discuss scenarios for data release. A consensus was reached
that the eventual sequencing outcome representing the first human genome sequence should
be conducted at a high degree of accuracy.
In 1997, the Human Genome Project participants (participating organizations and funding
agencies) agreed on sequencing data release policy at the Second International Strategy
Meeting on Human Genome Sequencing.116 That year, in order to implement high-
throughput activities, DOE also made effort to tie the expertise and resources in genome
mapping, DNA sequencing, technology development, and information sciences pioneered at
the DOE genome centers at Lawrence Berkeley National Laboratory (LBNL), Lawrence
Livermore National Laboratory (LLNL), and Los Alamos National Laboratory (LANL) by
Washington, Seattle), and Melvin Simon (California Institute of Technology); and Glen Evans with Harold Garner [University of Texas Southwest (UTSW) Medical Center], Pieter de Jong (Roswell Park Cancer Center), and Julie Korenberg (Cedars Sinai Medical Center).See also Human Genome News, July-September 1996; 8:(1), “BAC End-Sequencing Projects Initiated”. http://www.ornl.gov/sci/techresources/Human_Genome/publicat/hgn/v8n1/08bacend.shtml115 Also see Nature (381, 364-66)116 Held in Bermuda from 27th February 1997 to 2nd March 1997.

58

forming the Joint Genome Institute (JGI). The institute would start with sequencing and
functional genomics.117 Internationally, United Nations Educational, Scientific, and Cultural
Organization (UNESCO) adopted the Universal, Declaration on the Human Genome and
Human Rights at its 29th session on 11 November 1997. This declaration served as the first
universal instrument in the field of biology and it was intended to provide the safeguard
between respect for human rights and fundamental freedoms and the need to ensure freedom
of research.
In 1998, the Human Genome Project, a massive 15-year biological undertaking officially
started in 1990, passed its midpoint. In fiscal year 1998, the DOE JGI had surpassed its
sequencing goal of 20 Megabytes of human DNA, which represented almost a tenfold
increase in production over the previous year. The DOE and NIH jointly announced the new
five-year plan for HGP, which forecasted project completion by 2003.118
December 1, 1999 marked the day when the first human chromosome, Chromosome 22 was
completely sequenced.119 The billion base pair celebration was held on November 23, 1999.
Participants include Bruce Alberts, President, National Academy of Sciences and early
planner of the Genome Project; Francis Collins, Director, NHGRI; Secretary of HHS, Donna
Shalala; Secretary of DOE, Bill Richardson.
117 Human Genome News, October-December 1996; 8:(2), “DOE Merges Genome Center Sequencing Efforts”. http://www.ornl.gov/sci/techresources/Human_Genome/publicat/hgn/v8n2/01doe.shtml118 Special note on bioinformatics and computational biology: the 5-year plan hopes to continue to improve content and utility of databases; develop better tools for data generation, capture, and annotation; develop andimprove tools and databases for comprehensive functional studies; develop and improve tools for representingand analyzing sequence similarity and variation; create mechanisms to support effective approaches for producing robust, exportable software that could be widely shared.119 Nature (Dec. 2, 1999)
59

Fueled by the rapid advance in technologies and past success in human genome sequencing,
HGP now scheduled to get a draft sequence of the entire human genome in 2000 instead of
2001. (Also see Figure 3.2B). Consequently, the number of disease genes discovered also
increased dramatically between years 1990 to 2002 as a result of the HGP (Figure 3.3).
Figure 3.3: Number of Disease Genes Identified from 1981 to 2002
Note: dramatic increase in disease gene discovery between years 1990 to 2002 as a result of the HGP
In 2000, the HGP leaders, including Ari Patrinos (director of DOE Human Genome Program
and Biological and Environmental Research Program), Francis Collins (director, NIH
National Human Genome Research Institute), Craig Venter (head of Celera Genomics) and
former U.S. president Bill Clinton together announced the completion of a “working draft”
DNA sequence of human genome.
In terms of the scientific breakthroughs, DOE researchers announced on April 13, 2000 that
they have decoded the genetic information on human chromosomes 5, 16 and 19 in draft
form. International human genome research consortium published the complete sequence of
60
chromosome 21 genome in May 2000,120 the smallest human chromosome and second to be
sequenced after chromosome 22.
On February 12, 2001, the initial working draft sequence of the human genome was
published. Both Nature121 and Science122 published special issues detailing the working draft
of the human genome sequence.123 A special press conference was held on the same day to
discuss the landmark publications. Since then, the Wellcome Trust Sanger Center, U.K. had
completed the sequencing of Chromosome 20.124 This is the third (following Chromosomes
22 and 21) and the largest of the human chromosomes to be completed to the high scientific
standard specified by the Human Genome Project.
On April 14, 2003, the International Human Genome Sequencing Consortium, led in the U.S.
by the National Human Genome Research Institute (NHGRI) and the Department of Energy
(DOE), announced the successful completion of the Human Genome Project more than two
years ahead of schedule.125,126 That same year, the sequencing of human chromosomes 14
(January 2003),127 Y (June 2003),128 7 (July 2003)129 and 6 (October 2003)130 had been
120 Nature, May 18, 2000.121 Nature, February 15, 2001. Nature papers focused on the initial analysis of the descriptions of the sequence generated by the publicly sponsored Human Genome Project.122 Science, February 16, 2001. Science publications focused on the draft sequence generated by the private company, Celera Genomics.123 Pieter de Jong's team (Oakland Children's Hospital, Oakland, CA) was a major provider of the BAC libraries used in the sequencing of the human and several other genomes.124 Nature, December 20, 2001.125 http://www.ornl.gov/sci/techresources/Human_Genome/project/50yr/press4_2003.shtml126 London, Reuters Health (4-14-2003), “Scientists complete human genome project.”127 Nature, January 2003128 Nature 423, 810 - 813 (19 June 2003)129 Nature 424, 157–164 (10 July 2003)130 Nature 425, 805 - 811 (23 October 2003)
61

52,000 STSs
successively completed. By March 2004, the sequencing of human chromosomes 13131 and
19132 had been completed. Table 3.1 summarizes the HGP goals and dates of achievement.
Table 3.1: HGP Goals and Dates of Achievement133
Area Goal Achieved Date
Genetic map2- to 5-cM resolution
map (600 to1,500 markers)
1-cM resolution map (3,000 markers) September
1994
Physical map30,000 sequence-tagged
sites (STSs)
October1998
DNA sequence
Capacity and cost of finished
sequence
Human
95% of gene-containing part of human sequence
finished to 99.99% accuracy
Sequence 500 Mb/year at <$0.25 per finished
base
100,000 mapped human
>98% of gene-containing part of human sequence finished to 99.99%
accuracy
Sequence >1,400 Mb/year at <$0.09 per finished base
April2003
November2002
Februarysequencevariation
Gene identification
SNPs3.7 million mapped human SNPs
Full-length humancDNAs
15,000 full-length human cDNAs
Finished sequences of E. coli,
2003
March2003
Model organisms
Functional
Complete sequences of E. coli, S. cerevisiae,
C. elegans,D. melanogaster
Develop genomic-scale
S. cerevisiae, C. elegans,D. melanogaster, plus whole-
genome drafts of several others, including
C. briggsae, D. pseudoobscura,mouse, and rat
High-throughput oligonucleotide
April2003
analysis technologies synthesis1994
131 Nature 428, 522-528 (01 April 2004)132 Nature 428, 529 - 535 (01 April 2004)133 Science 300, 286-290 (11 April 2003)

62

DNA microarrays 1996
Normalized and subtracted cDNAlibraries
1996
Eukaryotic, whole-genome knockouts(yeast) 1999
Scale-up of two-hybrid mapping 2002
Figure 3.4 below illustrates the inter-relationship among the key stakeholders (or
organizations) involved in the HGP.
Figure 3.4: HGP Organization Map of the Key Stakeholders
The Human Genome Project (1990-2003)
PUBLIC: HERAC (Advisory)
NIH DOEOTA
DHHS NIGMS BER [OHER]
NAS-NRC
(Renaming Org,)
(Funding)
(Announcement)
RTI(GenomeDatabase)
NHGRI (1997) Joint Genome Institute (JGI) [NCHGR] LBNL, LLNL, LANL (1997)
Genome Centers (U.S.A.) Whitehead, U Wash, Wash U
Other Genome Centers in the WorldSanger (U.K.), CHGC (China) etc.
PRIVATE:
Celera Genomics (1998)
63

3.2 Major Policy Debates on the Ethical, Legal and Social Fronts
There were many ethical, legal and social issues (ELSI) associated with the Human Genome
Project. Central to our consideration in this paper are the debates surrounding patenting and
commercialization of genome related technologies and products, which include property
rights (patents, copyrights and trade secrets) and accessibility of data and materials. For
example, who has ownership of the genes and pieces of DNA? Will DNA sequence patenting
restrict their use, accessibility and development into useful products? In this section, the
focus is on the landmark events of HGP concerning ELSI over patenting before addressing
other important questions in Chapter 4 and beyond.
In order to address these critical issues associated with the HGP, DOE and NIH first
established a joint ethical, legal, and social issues (ELSI) working group in 1989.134 James
Watson recommended that 3% of the total HGP funds were to be devoted to these activities, a
rather bold and innovative move both by Watson himself and by the NIH.135 This volume
was supported by a 3-year grant awarded by the National Center.
However, in 1991, tension developed when Craig J. Venter, then a biologist at NIH and the
discoverer of Expressed Sequence Tags (ESTs), or partial sequences of cDNA that code for
proteins with as yet undetermined biological functions, proposed patenting a large number of
ESTs. This led to the filing of patent application for ESTs by NIH, followed by a number of
134 Human Genome News, May 1990; 2(1), “NIH-DOE Joint Working Group on Ethical, Legal, and SocialIssues Established”. http://www.ornl.gov/sci/techresources/Human_Genome/publicat/hgn/v2n1/05elsi.shtml135 Since their inception, the DOE and NIH genome programs have set aside 3% to 5% of their respective total annual budgets for the study of the project's ELSI issues. For an in-depth look at the ELSI surrounding theproject, see the ELSI webpage: http://www.ornl.gov/sci/techresources/Human_Genome/elsi/elsi.shtml
64
private companies.136 Two primary reasons underlined the patent application by NIH: 1)
publication without patenting of even partial sequences of ESTs would be sufficient prior art
to make the patentability of the full length cDNA impossible because of lack of non-
obviousness;137 2) patenting the ESTs would ensure access through non-exclusive license.138
James Watson complained to the NIH administrators that patenting and privatizing nature was
not appropriate. When that failed to work, he took the case to Capitol Hill and defended his
position in front of the senate in 1991. Venter and NIH fought back vehemently on the merits
of patents.139 At the end, Watson was forced to resign from the HGP and NIH by NIH
Director then, Bernardine Healy over the differences of opinion on the patenting of genes and
her perception that he had conflicts of interests because of his ties to the pharmaceutical
industry. This ended his tenure with NIH from 1988 to 1992. He then returned to Cold
Spring Harbor Laboratory to resume his duty as its director.
In terms of the legislature, the Genetic Privacy Act,140 a landmark legislative product of the
U.S. Human Genome Project's ELSI component, was presented to and endorsed by the DOE-
NIH Joint ELSI Working Group in December 1994. The act was introduced into six state
legislatures to regulate collection, analysis, storage, and use of DNA samples and genetic
information obtained and it was drafted as a federal statute to provide uniformity.
136 Roberts, Leslie (Oct 11, 1991), “Genome Patent Fight Erupts”, 254 Science 184.137 This was suggested by Reid G. Adler, head of the Technology Transfer Division at the NIH. The rationale has merit because even short (200 - 500 base pairs) pieces of DNA are likely to be sufficiently unique to belongto only a single gene. Therefore, given the partial sequence, using the sequence to probe for the full length cDNA would be obvious.138 According to Reid G. Adler, "our concern was to protect the invention early enough to give meaningful patentprotection to the companies that might seek a license from NIH." However, the NIH policy of providing non- exclusive licenses is unlikely to provide enough security to ensure capital investment.139 Watson blasted Venter's work as something that "could be run by monkeys." Venter and the NIH fought back, saying Watson was old news, old science, and that patents were the future of biotechnology.140 Human Genome News, Mar.-Apr. 1995; 6(6), “Genetic Privacy Act Introduced”http://www.ornl.gov/sci/techresources/Human_Genome/publicat/hgn/v6n6/4genetic.shtml
65

In terms of commercialization of technologies and products, 1994, for example showcased
some promising and tangible commercialization efforts as a result of the initial fruits of the
human genome project. For example, the chromosome painting technology and the Merck
Gene Index Project originated from LLNL highlighted that collaborations among researchers
in academia, national laboratories, and industry could potentially yield major commercial
benefits for genomic research and the broader biomedical research community.141
From
Argonne National Laboratory (ANL), another DOE laboratory, sequencing by hybridization
(SBH) technologies were also commercialized. Responding to public calls, the DOE HGP
website142 was first opened for public and the research community.
Also on the commercial side, Celera Genomics was founded in 1998 as a competitive attempt
to sequence as much of the human genome in 3 years utilizing present HGP-produced
resources.143,144 This has shaped the development of public policy with respect to the HGP.
On the legal front, as more discoveries were being made and more genes were being
sequenced, there were mounting debates on the issuance of intellectual property rights which
should act as fair incentives to the inventors while not obstructing future R&D efforts. In
December 1999, the United States Patent and Trademark Office (USPTO) in the Department
of Commerce issued stiffer interim guidelines,145 stipulating that how the product functions in
nature must be more specifically demonstrated to fulfill the “usefulness” criterion before it
141 Human Genome News, January-March 1996; 7(5):1, “Collaborations Multiply Research, Commercial Benefits - Academic, National Laboratory, Industrial Innovations Yield Chromosome Painting, Merck Gene Index”. http://www.ornl.gov/sci/techresources/Human_Genome/publicat/hgn/v7n5/01collab.shtml142 http://www.doegenomes.org/143 Human Genome News, July 1998, Vol.9, No.3, “Private-Sector Sequencing Planned: New Venture Aims forRapid Coverage of Genome”. http://www.ornl.gov/sci/techresources/Human_Genome/publicat/hgn/v9n3/01venter.shtml144 Washington Post (5-15-98), “To Own the Human Genome”.145 The interim guidelines were made final in January 2001.

66
can be patented (e.g. gene fragments). These new guidelines required “specific and
substantial utility that is credible” although the patenting of products such as gene fragments,
also known as expressed sequence tags (ESTs), remained highly controversial.146
So far, Congress had only prohibited gene patents in a few cases where the granting of a
patent was contrary to the public interest. Other patent disputes involved rights to research
tools. These disputes stemmed from the body of law governing human gene patents although
they were often patents on living animals or bacterial cells, such as a mouse created at
Harvard University that was useful in cancer research. Companies charging exorbitant prices
for the access to such tools had provoked intense public criticisms.147
In 1998, ELSI took the center stage as the largest ever ELSI meeting took place and was
attended by over 800 professionals from various disciplines. The meeting was sponsored by
DOE, Whitehead Institute at MIT and the American Society of Law, Medicine, and Ethics.148
146 The Washington Post (30-12-2000), “Gene Research Success Spurs Profit Debate”.147 The Washington Post (30-12-2000), “Gene Research Success Spurs Profit Debate”.148 Human Genome News, February 1999, Vol.10, No.1-2, “The Human Genome Project: Science, Law, andSocial Change in the 21st Century”. http://www.ornl.gov/sci/techresources/Human_Genome/publicat/hgn/v10n1/13white.shtml
67

CHAPTER 4:
IMPACT OF STRATEGIC INSTITUTIONAL DECISIONS
4.1 University Research and Technology Commercialization in the Human
Genome Project
The Human Genome Project elaborately described in Chapter 3 sets the stage for the
empirical study in this chapter. As one of the most significant life science research projects
ever undertaken, its funding totaled over $3.8 billion in the U.S. between 1988 and 2003
(Figure 3.1). To put this in context, the U.S. government spent, for example, $14.8 billion of
health related research in 1999, about four times the amount that was spent in 1970 in real
terms, which constitutes approximately 38% of the non-defense Federal research budget. In
1987, at the initial conception of the HGP, the U.S. spent more on of its publicly available
research funds on life sciences than any other fields (Figure 4.1).
Figure 4.1: U.S. National Expenditure on Academic and Related Research by Main Fields
U.S. National Expenditure on Academic andRelated Research by Main Fields (1987)
2,163, 15% 1,966, 13%Engineering
411, 3% Physical Sciences754, 5%
7,285, 48%
2,325, 16%Life Sciences
Social Sciences
Arts & Humanities
Other
Notes: Expenditure data are based on OECD “purchasing power parities” for 1987 calculated in early 1989. Source: J. Irvine, B. Martin and P. Isard (1990) p219.
68

Why do U.S. tax payers fund such a substantial amount in life sciences research? According
to Henderson and Cockburn (2000),149 one important contribution of public science is that it
“sustains an environment in which for-profit firms can conduct their own basic research,
which in turn contributes to the global pool of knowledge.” They argued that the rate of
return to public funding of biomedical sciences, in terms of its effect on private sector R&D,
may be up to 30% per year. They also find evidence of significant reciprocal interaction
between public and private sectors in pharmaceutical research.150 These calculations, as high
as they may seem, are likely to be an under-estimate because they fail to fully capture the
wider impact of biomedical innovation on health and well-being.
The explicit goals of the HGP, a mammoth undertaking for the long-term human health and
well-being, included genetic maps, sequencing and the development of innovative sequencing
technologies. In addition to contributing to important scientific knowledge, the HGP was
designed to develop and transfer technologies to the private sector for commercialization. It
was in the definition and implementation of the commercial goals of the project that
controversy arose: different genome centers engaging in sequencing pursued distinctive
policies in their approach to patenting innovations. These different policy choices embedded
similar scientific research outputs in dramatically different institutional settings – the presence
or absence of patents.
149 Cockburn, Iain and Rebecca Henderson (2000). "Publicly Funded Science and the Productivity of thePharmaceutical Industry." NBER Conference Paper on Science and Public Policy.150
Cockburn, Iain and Rebecca Henderson (1996). "Public-private Interaction in Pharmaceutical Research.”Proceedings of the National Academy of Sciences, USA, Vol. 93, pp. 12725–12730.
69

There have been a series of initiatives since the 1980s, such as the Bayh-Dole Act of 1980
(P.L. 96-517),151 which was designed to create an incentive for research institutions and
universities patenting and licensing by allowing them to automatically appropriate the
intellectual property rights for federally funded research (such as from a NIH biomedical
research grant), and the Stevenson-Wydler Technology Innovation Act of 1980 (P.L. 96-480),
which explicitly set the mission of technology transfer for all federal laboratories and federal
agencies and created a host of institutional structures to facilitate this mission. Jaffe and
Lerner (1999)152 found using empirical evidence that they had significant and positive impact.
However, previous studies had neglected the important roles played by university-affiliated
research centers such as the genome centers.
Although the recent increases in university patenting and licensing activities have frequently
been attributed to the consequences of the Bayh-Dole Act (Trajtenberg et al., 1994; United
States Patent and Trademark Office, 1969-1997 (Table 4.1); Association of University
Technology Managers, 1998153), the effect of the Act remains controversial.
151 Officially named “The Patent and Trademark Law Amendments Act”.152 Jaffe, Adam B. and Josh Lerner (1999). “Privatizing R&D: Patent Policy and The Commercialization ofNational Laboratory Technologies.” National Bureau of Economic Research Working Paper No. 7064.153 In 1998, AUTM data showed U.S. universities also increased their efforts to license these patents while increasing their patenting – the number of universities with technology licensing and transfer offices increased from 25 in 1980 to 200 in 1990, a eight times jump, while licensing revenues of the AUTM universitiesincreased from US$222 million in fiscal year 1991 to US$698 million in fiscal year 1997.

70
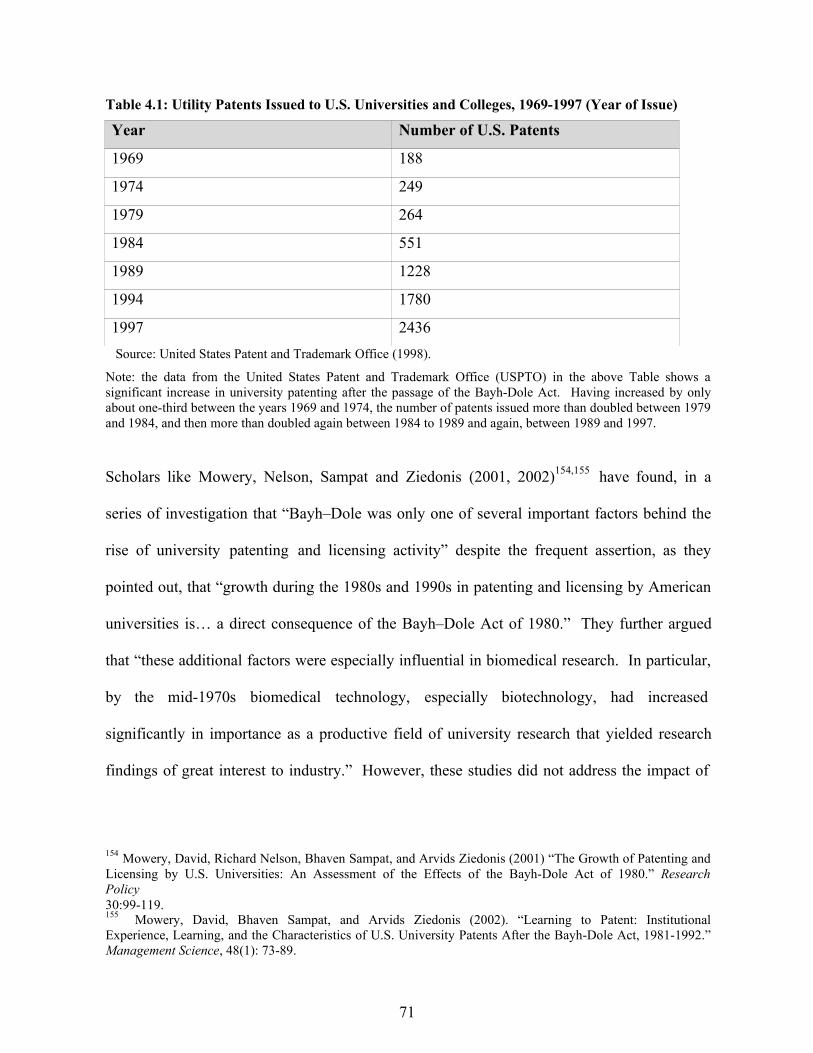
Table 4.1: Utility Patents Issued to U.S. Universities and Colleges, 1969-1997 (Year of Issue)
Year Number of U.S. Patents
1969 188
1974 249
1979 264
1984 551
1989 1228
1994 1780
1997 2436
Source: United States Patent and Trademark Office (1998).
Note: the data from the United States Patent and Trademark Office (USPTO) in the above Table shows a significant increase in university patenting after the passage of the Bayh-Dole Act. Having increased by only about one-third between the years 1969 and 1974, the number of patents issued more than doubled between 1979 and 1984, and then more than doubled again between 1984 to 1989 and again, between 1989 and 1997.
Scholars like Mowery, Nelson, Sampat and Ziedonis (2001, 2002)154,155 have found, in a
series of investigation that “Bayh–Dole was only one of several important factors behind the
rise of university patenting and licensing activity” despite the frequent assertion, as they
pointed out, that “growth during the 1980s and 1990s in patenting and licensing by American
universities is… a direct consequence of the Bayh–Dole Act of 1980.” They further argued
that “these additional factors were especially influential in biomedical research. In particular,
by the mid-1970s biomedical technology, especially biotechnology, had increased
significantly in importance as a productive field of university research that yielded research
findings of great interest to industry.” However, these studies did not address the impact of
154 Mowery, David, Richard Nelson, Bhaven Sampat, and Arvids Ziedonis (2001) “The Growth of Patenting andLicensing by U.S. Universities: An Assessment of the Effects of the Bayh-Dole Act of 1980.” Research Policy30:99-119.155 Mowery, David, Bhaven Sampat, and Arvids Ziedonis (2002). “Learning to Patent: Institutional Experience, Learning, and the Characteristics of U.S. University Patents After the Bayh-Dole Act, 1981-1992.” Management Science, 48(1): 73-89.
71

the institutional choice of patenting on public use and accumulation of knowledge, and
commercialization of the biotechnology.
Through the empirical study of the outputs (i.e. patents, publications and other
commercialization data) using econometric modeling across all seven public genome centers
involved in the HGP – MIT Whitehead Institute Center for Genome Research in Cambridge,
M.A.; Washington University Genome Sequencing Center in St. Louis, MO; Baylor Human
Genome Sequencing Center in Houston, TX; University of Washington Genome Center in
Seattle, W.A.; Stanford Human Genome Center in Palo Alto, CA; DOE Joint Genome
Institute; and the Wellcome Trust Sanger Institute in Cambridgeshire, U.K., I seek to address
the impact of the distinctive strategic choices that these centers made in their decision to use
patenting and publication for the dissemination, public use, and accumulation of knowledge,
and the commercialization of biotechnologies. I also highlight the controversial role of these
different choices as an exemplar of the distinctive views held on how to institutionalize
scientific knowledge.
These seven public genome centers involved in the HGP provide an unusually matched and
well-controlled opportunity to examine the impact of different knowledge institutions on the
subsequent diffusion of scientific knowledge. The research input and output of all the centers
are homogeneous – sequencing of the human genome and their resulting sequences and
applications. These centers do not have knowledge ex ante on the choice and fruitfulness of
the pieces of chromosomes they sequence and they are similarly reputable in this field.
Furthermore, these are centers within the same public consortium that follow similar
publication strategies in the HGP.
72

I find publications with a “matched patent” pair strongly correlate with a higher cumulative
forward citations and are thus associated with wider knowledge dissemination and utilization
and are considered as more important. Since only an institutional policy allowing (or even
encouraging) patenting in Whitehead and Baylor can result in matched patents, such policy
does not adversely impact cumulative knowledge dissemination and use. I also find evidence
of patents contributing to technological innovation, commercialization and start-up.
The ensuing Section 4.2 describes the central patenting dilemma and develops the hypothesis.
Section 4.3 gives an overview of the genome centers and their strategic patenting choices.
Section 4.4 describes the empirical test strategy for the “anti-commons” effect and statistical
models. Section 4.5 examines the data sets in greater detail while Section 4.6 presents the
statistical analyses, results and discussion. Section 4.7 concludes.
4.2 Central Patenting Dilemma and Hypothesis Development
To patent or not to patent has been the central dilemma facing the different university-
affiliated genome centers and research institutes. Amidst the heated theoretical arguments for
and against patenting in economics, public policy and sociology of science described in
Section 2.2, Heller and Eisenberg (1998)156 in their landmark paper raised the issue of the
“anti-commons”, which describes the problem of complex and interlocking private claims,
especially in terms of intellectual property rights, deterring investment and stifling innovation
instead of spurring it. It has the effect of hampering the free flow of scientific knowledge and
156 Heller, M. A. and R. S. Eisenberg (1998). “Can patents deter innovation? The anti-commons in biomedical research.” Science, 280 (5364): 698-701.
73
the ability of researchers to cumulatively build on each other’s discoveries, especially in the
context of Biomedical research (Heller & Eisenberg, 1998; Etzkowitz, 1998; David, 2004;
Murray and Stern, 2004).
Based on the “anti-commons” argument, together with empirical evidence from the patent-
paper pair analysis and other anecdotal evidences, I hypothesize:
H1: An institutional policy allowing patenting will negatively impact cumulative
knowledge dissemination and use by lowering the cumulative forward citation in
Whitehead and Baylor publications associated with patents, compared to those of
the other five institutions.
4.3 The Genome Institutions and their Strategic Patenting Decisions
University-affiliated genome centers, largely supported by public funding from agencies such
as DOE, NIH and National Science Foundation (NSF), serve as the flagships of the Human
Genome Project. I will examine all seven HGP genome centers, which together responsible
for sequencing more than 99% of the human genome, as centers for research and generation
of scientific knowledge, paying particular attention to their intellectual property policies in the
dissemination of scientific knowledge and the transfer and commercialization of HGP
biotechnologies.
74

MIT Whitehead Institute Center for Genome Research
Since the founding of the Whitehead Institute of Biomedical Research (WIBR) at MIT in
1990, the Center has grown to become one of the largest genome centers in the world and an
international leader in the field of genomics, the study of all of the genes in an organism and
how they function together in health and disease. It played a leading role in the Human
Genome Project – the Whitehead Institute’s Center for Genome Research was the largest
federally funded center157 for genome mapping and sequencing and contributed about 30% of
the human genome sequence announced in June 2000. Under the leadership of Professor Eric
S. Lander, the Center has an annual budget of $80 million dollars and employs more than 250
people – scientists, engineers, and medical researchers from Whitehead, MIT and Harvard
University. In 2003, the Center became the core facility in the Broad Institute, a collaboration
between WIBR, MIT and Harvard University.
Unlike the other main genome centers, the Whitehead Institute Center for Genome Research
actively patents and licenses its genome research outputs. However, it is practicing or
planning forms of data release in accordance with the data release policy endorsed by both the
Wellcome Trust Sanger Institute and the National Institutes of Health.158 This forms an
interesting and contrasting case study for our examination of the impact of patenting policy on
157 Whitehead Institute Center for Genome Research received $26 million NIH grant in April 1996 to start sequencing of the human genome; it subsequently opened its new genome sequencing facility at 320 Charles Street in March 1997. In March 1999, Whitehead received another $35 million grant from National Human Genome Research Institute (NHGRI) to participate in the full-scale effort to sequence the human genome. In addition, Whitehead received $7 million to build new genome sequencing machines. Whitehead member Paul Matsudaira and scientist Dan Ehrlich utilized the funding to develop revolutionary chip-based sequencing device.
158 Bentley, David R. (1996). “Genomic Sequence Information Should Be Released Immediately and Freely in the Public Domain.” Science, 274, 533-534 (written on behalf of the Sanger Institute, Wellcome Trust Genome Campus, Hinxton, Cambridge, UK, and Genome Sequencing Center, Washington University, St. Louis)
75

dissemination, public use and accumulation of knowledge, and the commercialization of these
biotechnologies.
Wellcome Trust Sanger Institute
The Wellcome Trust Sanger Institute in Cambridge, U.K., is one of the leading genomics
centers in the world. Its primary mission is to analyze and understand genomes. Led by
Nobel Laureate Sir John Sulston (first director of the Institute from 1992-2000),159 it is one of
the main sites for the HGP. Of the 2.9 billion letters of DNA code that had been sequenced,
the Wellcome Trust Sanger Institute has contributed more than 0.8 billion or more than 30%.
Originally committed to sequencing one-sixth of the human genome, the Wellcome Trust
increased its investment in 1998 to allow the Institute to decode one-third of the genome –
chromosomes 1,160 6,161 9,162 10,163 13,164 20,165 22166 and X.167
Formerly the Sanger Centre, the Wellcome Trust Sanger Institute was founded in 1993 by the
Wellcome Trust and the UK Medical Research Council (MRC). The Wellcome Trust Sanger
Institute is a non-trading, non-profit making registered charity involved in biomedical
research. The vast majority of the funding is currently provided by the Wellcome Trust – its
contribution to the Sanger Institute for the sequence of the human genome has totaled £150 M
159 John Sulston was awarded the 2002 Nobel Prize for Physiology or Medicine.160 http://www.sanger.ac.uk/HGP/Chr1/161 http://www.sanger.ac.uk/HGP/Chr6/162 http://www.sanger.ac.uk/HGP/Chr9/163 http://www.sanger.ac.uk/HGP/Chr10/164 http://www.sanger.ac.uk/HGP/Chr13/165 http://www.sanger.ac.uk/HGP/Chr20/166 http://www.sanger.ac.uk/HGP/Chr22/167 http://www.sanger.ac.uk/HGP/ChrX/
76

as of April 2003. In addition, the Trust announced in October 2001 a grant of 300 million
pounds sterling (430 million U.S. dollars) to support the Institute from 2001 to 2006.168
Emphasizing large-scale analysis and focused research and collaborations, the Institute which
started with temporary laboratories and only 15 members had grown to more than 600
researchers and staff and is currently housed in state-of-the-art buildings. It is producing less
than one error in every 100,000 bases. To provide rigorous analysis of accuracy, the error
rates are determined not only by reanalysis internally but also through reanalysis of data by
external organizations.
It is one of the main proponents of the “no patent” policy as it believes in the immediate and
free release of genomic sequence information to the public domain which i) permits
coordination; ii) is of immediate value to others and is not misleading; iii) promotes
maximum accessibility of the human genome sequence for interpretation and exploitation.
Furthermore, the institute believes that such “activities should flourish in both the academic
and commercial sectors….” and “withholding the genomic sequence ingredient from any
academic or commercial laboratory with such knowledge impedes scientific progress and is
not in the international public interest.” It takes the stand that “patenting of raw human
genomic DNA sequence or partial or complete gene sequences of unknown function is
inappropriate” as it may “discourage further research and development by others, for fear that
future inventions downstream of the gene sequence itself could not be adequately protected…
Free release of sequence data will also encourage exploitation by a maximum number of
commercial and academic centers that are keen to compete in the development of new
168 http://www.sanger.ac.uk/Info/Press/011015.shtml
77
therapeutic agents.”169 This serves as a sharp contrast to the patent policy adopted by the
Whitehead Institute.
Washington University Genome Sequencing Center
Washington University Medical School Genome Sequencing Center (WUGSC) was officially
established in August 1993 with a $29.7 million grant from the National Human Genome
Research Institute at the National Institutes of Health. The center focuses on the large scale
generation and analysis of DNA sequence. It was later chosen as the main genome
sequencing centers in the U.S. to complete the HGP. Like Whitehead, Washington University
GSC played a leading role in the HGP and it contributed about 25% of the finished human
genome sequences, including chromosomes 2, 7, 14 and 22. Furthermore, the center acted as
coordinator for chromosomes 2, 4, 7 and Y. To better understand the human genome
sequence, it was also responsible for sequencing the genomes of many other species such as
mouse, chimpanzee, C. elegans, as part of the HGP.
The director of the center is Richard K. Wilson, Professor of Genetics. Like the Sanger
Institute, WUGSC is a champion of the non-patenting policy on all its HGP research output,
believing this will maximize the dissemination and utilization of knowledge, and
commercialization.170
169 Bentley, David R. (1996). “Genomic Sequence Information Should Be Released Immediately and Freely in the Public Domain.” Science, 274, 533-534 (written on behalf of the Sanger Institute, Wellcome Trust Genome Campus, Hinxton, Cambridge, UK, and Genome Sequencing Center, Washington University, St. Louis)170 Ibid.
78

Baylor College of Medicine Human Genome Sequencing Center
The Baylor College of Medicine Human Genome Sequencing Center (BCM-HGSC) was
officially started in 1996 when NHGRI selected Baylor College of Medicine as one of the six
pilot programs for the final phase of the HGP. It was further chosen in 1999, together with
Washington University Genome Sequencing Center, and the MIT Whitehead Institute, as one
of the three genome sequencing centers from the pilot program to finish the last phase of the
HGP. It is responsible for sequencing about 10% of the human genome, including
chromosomes 3, 12 and X. It has allowed some genomic patents (e.g. methods, tools and
techniques) related to HGP by its scientists.
Today, the BCM-HGSC, directed by Richard Gibbs, Wofford Cain Professor of Molecular
and Human Genetics, has 18 primary faculty, 8 secondary faculty, and more than 200 staff. It
is located on the 14th, 15th, and 16th floors of the Margaret M. and Albert B. Alkek Building,
which occupies more than than 36,000 square feet, and operates 77 sequencing machines
24/7.
University of Washington Genome Center
The University of Washington Genome Center (UWGC) is directed by Professor Maynard
Olson. It received its funding from NIH and NSF. The focus of the center is on sequencing
human and microbial genomes and analysis of genetic variations among populations. As an
important genome center in the HGP, UWGC is responsible for sequencing 130 Mb or about
5% of the human genome spanning regions on human chromosomes 1, 3 and 7. Chromosome
79

1 is the largest of the human chromosomes, approximately 300 Mb in size and comprises
about 10% of the human genome. UWGC and Sanger Center in UK collaborated in
sequencing chromosome 1. Chromosome 3 is about 214 Mb in length and was sequenced as a
collaborative effort between Baylor college of Medicine HGSC, UWGC, and the genome
Center in Beijing, China. Human Chromosome 7 is 171 Mb in size and was jointly sequenced
by UWGC and Washington University Genome Sequencing Center.
Although UWGC “emphasizes innovative technology development and high quality sequence
production”, it had “decided to not to patent any of the sequences and it holds no patents on
anything…”171 This is in line with the “no patenting” policy of the Sanger Institute and the
Washington University Genome Sequencing Center.
Stanford Human Genome Center
The Stanford Human Genome Center (SHGC) was first established at the University of
California San Francisco (UCSF) in 1990 as one of the first human genome mapping centers
before moving to Stanford University in 1993. SHGC played an important role in the HGP
by completing the sequences for chromosomes 4, 5, 16 and 19, mostly in collaboration with
the DOE Joint Genome Institute (JGI). SHGC, together with JGI, are responsible for over
11% of the human genome sequences. The center is led by Richard Myers, professor of
genetics and currently has about 50 faculty, researchers and staff working on large-scale
genomic projects which include “genomic DNA sequence finishing, full-length cDNA
sequencing, large multi-group genetic association studies, genome-wide gene expression
171 According to the Computer Support Analyst from the University of Washington Genome Center (2003)
80

studies, and model organism mapping and sequencing.”172 Like most other human genome
centers, SHGC follows a non-patenting policy on its HGP research output.
DOE Joint Genome Institute
Formed in 1997, the DOE Joint Genome Institute (JGI) brings together the know-how and
technical competence of University of California managed Lawrence Berkeley National
Laboratory (LBNL), Lawrence Livermore National Laboratory (LLNL), and Los Alamos
National Laboratory (LANL) to collaborate on large-scale DNA sequencing, genome
mapping, technology development and information sciences. The JGI is led by Dr. Eddy
Rubin with an annual budget of about $60 million, funded primarily by DOE’s Office of
Science – Office of Biological and Environmental Research. The JGI is responsible for
completing the sequences of Chromosomes 5, 16, and 19, together with SHGC, which
accounted for about 11% of the human genome sequences.
In 1999, the University of California made arrangement to lease a 60,000 square feet
laboratory and office space in an industrial park in Walnut Creek in California to JGI, to
consolidate research activities and house its 160 employees in the Production Genomics
Facility (PGF). Currently, while focusing on human biomedical targets and applications, JGI
has diversified into other key areas of genomic research and sequencing to include more than
60 microbial genomes and other significant animal model systems like the puffer fish (Fugu
172 Stanford Human Genome Center (SHGC) center information:http://www-shgc.stanford.edu/information/index.html
81
rubripes) and a sea squirt (Ciona intestinalis), and in partnership with other federal
institutions and universities, a frog (Xenopus tropicalis), a green alga (Chlamydomonas
reinhardtii), a diatom (Thalassiosira pseudonana) , the cottonwood tree (Populus
trichocarpa), and a host of agriculturally important plant pathogens. 40% of JGI sequencing
is project driven but the other 60% is proposal driven through the “Community Sequencing
Program” (CSP), launched in 2004 to provide the scientific community with access to high-
throughput sequencing.
Like most its counterparts in the HGP, including the SHGC, DOE JGI follows a non-
patenting policy on its HGP research output.
4.4 Empirical Test Strategy
4.4.1 A Natural Experiment
Current empirical studies often face the “identification problem” in which “the variation in
many of the variables whose effects are of interest may not be orthogonal to the unobserved
factors that jointly influence the outcomes studied.”173 Due to this problem, it could be
difficult to disentangle and ascertain the particular parameter of interest to the corresponding
key variable. For example, it is often hard to simultaneously investigate knowledge diffusion
in two distinct institutional regimes (with or without patents). Using the HGP and its intrinsic
similarity in the knowledge generation process, our empirical data set consists of publication
and forward citation information, patenting activities and evidence of commercialization of
173 Rosenzweig, Mark R. and Kenneth I. Wolpin (2000). “Natural ‘Natural Experiments’ in Economics.” Journal of Economic Literature, Vol. 38, No. 4, pp. 827-874.
82

HGP technologies (where applicable) from all seven HGP genome centers, namely MIT
Whitehead Institute Center for Genome Research; Washington University Genome
Sequencing Center; Baylor Human Genome Sequencing Center; University of Washington
Genome Center; Stanford Human Genome Center; DOE Joint Genome Institute; and the
Wellcome Trust Sanger Institute.
This is a “natural experiment” as the seven centers in our sample represent three of the four
quadrants of public institutions, often affiliated with universities: i) in the U.S. allowing
patenting (Whitehead and Baylor); ii) in the U.S. not allowing patenting (Washington
University, University of Washington, Stanford and DOE Joint Genome Institute); and iii) in
the U.K with a no patenting policy (Sanger) respectively (Table 4.2).
Table 4.2: Patenting Policy of the 7 Genome Centers
Public (U.S.) Public (U.K.)
Patent Whitehead Institute,Baylor
---
No Patent Washington Univ., Univ. ofWashington, Stanford, DOE JGI
Sanger Institute
This “natural experiment” setting, in which the seven centers are in, provides an unusually
matched and well-controlled opportunity to examine the impact of different knowledge
institutions on the subsequent diffusion of scientific knowledge. The empirical test eliminates
common bias in previous forward citation studies due to heterogeneous research focus and
publication output and controls for the heterogeneity of research input and output by focusing
only on human genome sequencing activities. In addition, these centers do not have
83
knowledge ex ante on the choice and fruitfulness of the pieces of chromosomes they sequence
and they are similarly reputable in this field. All the centers are part of the same public
consortium and follow similar research and publication strategy in the collaborative
sequencing of the entire human genome. Furthermore, I include a center fixed effects to
control for any unobserved characteristics inherent within each center.
4.4.2 “Anti-commons” Test: Negative Binomial Regression Model
A good social scientist always starts with the simplest possible statistical model. I first
considered an ordinary least squared (OLS) model (results are included in Table 4.6, Model
4.6-0), which makes use of underlying normal distribution. However, it is ruled out as an
appropriate model primarily because of the right-skewed distribution of the CFC.174
A count model such as the Poisson regression model (PRM) and its variant, the negative
binomial regression model (NBRM) considers the number of times an event has occurred.
For example, Hausman et al. (1984) first used it to examine the effect of R&D expenditures
on the number of patents received by U.S. companies.175 Count models are superior to linear
regression model (LRM) because the use of LRM for count outcomes can result in inefficient,
inconsistent and biased estimates.
174 I did, however, included the results from OLS model for comparison, using ln(CFC) as the dependent variable in Table 6.175 Hausman, J.A., B.H. Hall, and Z. Griliches (1984). “Econometric Models for Count Data with an Application to the Patents-R&D Relationship.” Econometrica, 52: 909-938.
84

Proportio
n
0.0
5.1
.15
.2.2
5
The first count model being considered is PRM but it is not suitable in this case due to the
classic over-dispersion problem, i.e. the conditional variance is greater than the mean for the
underlying distribution. NBRM solves the problem of a skewed distribution by assuming a
gamma distribution for the conditional mean of the dependent count variable, and therefore
allows the conditional mean and variance to vary.
The goodness-of-fit test rejected the Poisson distribution assumption and indicated a zero
inflated distribution. Figure 4.2 maps the observed proportion of the CFC176 to both the
negative binomial distribution and the Poisson distribution. This provides the striking
graphical demonstration of a very close fit of the observed forward citation data with the
underlying negative binomial distribution.
Figure 4.2: Mapping of Observed CFC to Negative Binomial and Poisson Distributions
0 5 10 15 20 k
m ean = 76.2; overdispersion = 4.113
observed proportion neg binom
prob poisson prob
176 CFC < 20 since this is the threshold value which accounts for more than 60% of the observations and the remainder of the graph is approximately linear without much variation.
85

The econometric model takes into account of the following variables:
Response (dependent) variable:
1) Cumulative forward citation (CFC) of each publication related to the HGP from the
genome centers.
Causal explanatory (independent) variables:
1) “Matched patent” – 1 if there is a matched patent pair for that particular publication, 0
if none.
Control variables:
2) “Publication year” – year the paper is published
3) “Author count” – number of authors per publication
4) “Journal Impact factor” (2003) – as defined by ISI web of knowledge, one of the most
comprehensive and established database on scientific publication and citation in
existence. The journal impact factor is a measure of the frequency with which the
average article in a journal has been cited in a particular year. The impact factor helps
you evaluate a journal’s relative importance, especially in comparison with others in
the same field. The impact factor is calculated by dividing the number of citations in
the current year to articles published in the two previous years by the total number of
articles published in the two previous years. This provides a proxy for the quality and
reputation of each journal as these may affect citation. It is taken at 2003 since that is
the end period of the data set.
86

5) “Article Type” – 1 for article or review and 0 for other types including meeting
abstract, editorial, letter and note which typically attract less attention and have less
citation.
6) “Industrial collaboration” – 1 if one of the author address is a public or private
company, for-profit organization etc., excluding hospitals; 0 if none.
7) “Center count” – number of collaborating centers, organizations or companies in the
author address field.
8) Characteristics of HGP output/publication which include: i) HGP related; ii) human
and/or application to human; iii) specific human genome sequencing; iv) techniques,
tools, and/or software. These are controlled as citation patterns may vary with the
nature of the research described in the publication.
9) Center fixed effects which control for other unobserved characteristics of each genome
center (e.g. leadership, culture and location).
Taken together, the empirical test for the hypothesis, the fixed-effect negative binomial
regression model (full model), with robust standard error estimate,177 is therefore:
CFCi = f (εi; αMATCHED_PATENTi + δPUB_YEARi + ηAUTHOR_COUNTi
+ µJOURNAL_IF + νARTICLE_TYPE + σIND_COLLABORATIONi
+ φCENTER_COUNT + χHGP_OUTPUT_CHARACTERISTICS
+ ψCenter Fixed Effects,i)
177 Robust standard error estimate uses the Huber/White/sandwich estimator of variance in place of traditional calculation. This alternative variance estimator produces consistent standard errors even if the data are weighted or the residuals are not identically distributed. It corrects for arbitrary forms of heteroskedasticity which may be present in the model due to our observations extending over time.
87

,where MATCHED_PATENT is a nominal variable that equals 1 if there is a matched patent
pair for that particular publication and 0 otherwise; PUB_YEAR controls for the year the is
published; AUTHOR_COUNT controls for the number of authors per article; JOURNAL_IF
is a continuous variable that measures the impact factor of the journal; ARTICLE_TYPE is a
nominal variable that equals 1 if the document is an article or review and 0 otherwise;
IND_COLLABORATION is 1 if one of the author address is a public or private company or
for-profit organization and 0 otherwise; CENTER_COUNT controls for the number of
collaborating institutions/centers; and HGP_OUTPUT_CHARACTERISTICS include binary
variables such as HGP related; human and/or application to human; specific human genome
sequencing; techniques, tools, and/or software.
4.5 Closer Examination of Data Set
It is valuable now to take a closer look at the data set and some descriptive statistics before
performing the “anti-commons test” using statistical model (Section 4.4.2). The publication
database is primarily obtained from ISI Web of Science.
The main data set includes all publications by the 7 genome centers related to the Human
Genome Project – a total of 1573 publications from 1990 to December 2003. Table 4.3
illustrates the characteristics of publication for each of the 7 genome centers – the total
number of publications, number of articles and reviews, proportion of articles, number of
unique contributing authors, number of unique contributing centers, and number of unique
journals.
88

Table 4.3: Characteristics of Publication for the 7 Genome Centers
InstitutionNames
Inst. Code
No. of All Pubs (1990-2003)
No. of Articles andReviews(1990-2003)
No. of Unique Contributing Authors (1990-2003)
Proportion of Article (vs. Review)
No. of Unique Contributing Centers
No. of Unique Journals
Sanger, UK SGR 767 560 4354 0.918 710 153Baylor BLR 278 207 1584 0.917 316 75MITWhitehead WHD 232 161 1818 0.962 327 56WashingtonUniv., StLouis WUL 127 111 2329 0.907 328 39Univ. ofWashington, Seattle UWS 74 61 922 0.917 200 29Stanford SFD 40 27 659 0.923 110 12DOE JointGenomeInstitute JGI 55 44 761 0.837 150 24Total: 1573 1171
Each publication entry includes fields such as ISI number; title; author names; year published;
number of forward citation; assignee address; document type; journal source. Additional
fields collected, computed and coded include patent policy; location (U.S. or U.K.);
publication center, existence of matched patent (yes or no); author count; journal name;
journal impact factor (2003); center count; existence of industrial collaboration. Furthermore,
for each publication, characteristics of the publication as a HGP output were coded and added
in as binary control variables – HGP related; human and application to human; specific
human genome sequencing; technique or tools.
The patent data for Whitehead and Baylor are obtained from Delphion Research Intellectual
Property Network of the Thomson Corporation and USPTO. There are about 101 patents
from Whitehead (1990-2003), of which 40 belong to genome research but only 12 are
89

specifically human genome project related (since a portion of those belong to the Whitehead
functional genomics project). There are about 16 patents from Baylor (1994-2001) but only 3
are specifically HGP related and have a match to its publications. Similarly, each entry
includes fields such as publication number; title; inventor names; number of inventors;
publication date; publication country (U.S.A. in this case); number of cumulative forward
citation; assignee names; assignee city/ state; USPTO assignee code; application number;
application date among other standard patent fields. In addition, the Whitehead database is
augmented with information from the MIT Technology Licensing Office (TLO) which
includes fields such as number of cases with agreements; number of cases to start-ups; start-
up company names etc. Together, they form a comprehensive and detailed data set for our
quantitative analysis.
Publication Analysis
Overall, there is an increase in the number of publications for all 7 centers from 1993 to 2003,
all peaking at 2003 except Whitehead, Baylor and University of Washington Genome Center
– this is expected as 2003 is the year when the HGP is completed and results are published
(Figure 4.3).
90

N u
m b
e r
of P
ub
lic a
tio
ns
199
0
199
1
199
2
199
3
199
4
199
5
199
6
199
7
199
8
199
9
20
00
20
01
20
02
20
03
Figure 4.3: Publications from Whitehead, Sanger, Washington University, Baylor, University of
Washington, Stanford and Joint Genome Institute
180160140120100
80604020
0
Summary of 7 Center Publications (To 2003)
Whitehead
(WHD) Sanger
(SGR)
Washington Univ St Louis(WUL)
Baylor (BLR)
University of WashingtonSeattle (UWS)
Stanford (SFD)
Year Published
Joint Genome Inst (JGI)
All academically affiliated genome centers have a healthy proportion (about 13-30%) of
significant publications in the top 10 journals (i.e. impact factor greater than 25) like
“Science” and “Nature”. For example, Sanger has 14.08%; Whitehead has 25%; Baylor has
14.39%; University of Washington has 17.57%; Washington University has 29.92%; Stanford
has 20% and the Joint Genome Institute has 12.73%. This again speaks to the high quality of
research and consistency in publication quality across the 7 centers.
An examination of the number of authors for the publications reveals a good proportion of
publications have 20 authors and above (about 5% to 28%). For example, Sanger has
10.43%; Whitehead has 11.64%; Baylor has 4.68%; University of Washington has 12.16%;
Washington University has 27.56%; Stanford has 22.5% and the Joint Genome Institute has

91

10.91%. This observation reflects the increasingly complicated nature of life sciences
research and need for collaborative efforts for success.
A closer observation also introduces the phenomenon of “lead authors”. “Lead authors” can
be characterized as distinct intellectual leaders in each institution who have published
extensively and have indirectly led to the publication of other articles. They usually also sit
on the board of directors of the institutions or on the scientific advisory board. Examples
include Maynard V. Olson and Jun Yu from University of Washington Genome Center; Eric
Lander (director and scientific leader) and David M. Altshuler (scientific leader) and from
MIT Whitehead; and Sir John Sulston (former director) from the Sanger Institute.
Patent Analysis
Both Whitehead Institute and Baylor have allowed some patents on genomic research output.
The no patenting policy of the other five centers reflected their belief in the open science
model as the appropriate approach to increase the dissemination, public use, and accumulation
of knowledge by avoiding the “tragedy of the anti-commons” and minimizing barriers such as
licensing and royalty payment due to IPR protections.
Whitehead Institute actively patents and license their discoveries and innovations in life
sciences. There are about 101 patents for Whitehead (1990-2003) of which 40 belong to
genome research but only 12 are specifically human genome project related (Table 4.4). They
92
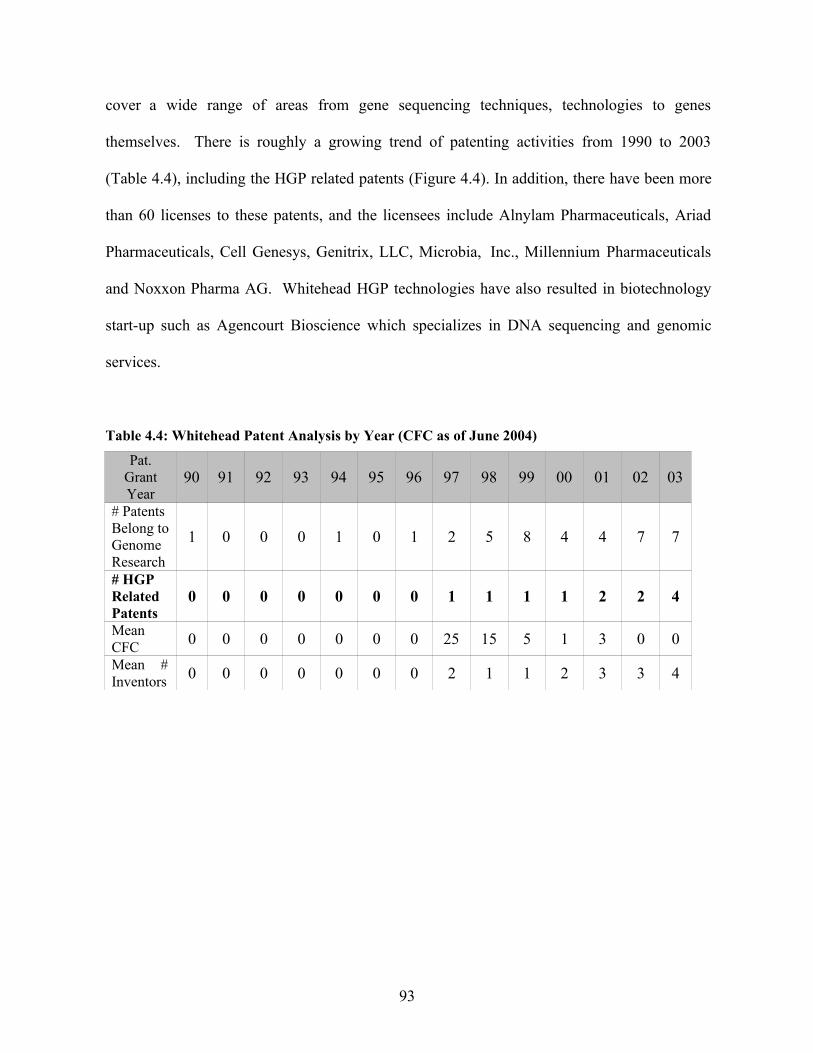
cover a wide range of areas from gene sequencing techniques, technologies to genes
themselves. There is roughly a growing trend of patenting activities from 1990 to 2003
(Table 4.4), including the HGP related patents (Figure 4.4). In addition, there have been more
than 60 licenses to these patents, and the licensees include Alnylam Pharmaceuticals, Ariad
Pharmaceuticals, Cell Genesys, Genitrix, LLC, Microbia, Inc., Millennium Pharmaceuticals
and Noxxon Pharma AG. Whitehead HGP technologies have also resulted in biotechnology
start-up such as Agencourt Bioscience which specializes in DNA sequencing and genomic
services.
Table 4.4: Whitehead Patent Analysis by Year (CFC as of June 2004)
Pat.GrantYear
90 91 92 93 94 95 96 97 98 99 00 01 02 03
# PatentsBelong to Genome Research
1 0 0 0 1 0 1 2 5 8 4 4 7 7
# HGP Related Patents
0 0 0 0 0 0 0 1 1 1 1 2 2 4
MeanCFC 0 0 0 0 0 0 0 25 15 5 1 3 0 0
Mean #Inventors 0 0 0 0 0 0 0 2 1 1 2 3 3 4
93

Num
ber
of
Pu
blic
atio
n/
Pat
ent
Gra
nte
d
199
0
199
119
92
199
3
199
4
199
5
199
619
97
199
8
199
9
20
00
20
01
20
02
20
03
Figure 4.4: MIT Whitehead Institute Patents and Publications
MIT Whitehead Institute Publications and Patents
40353025201510 6
17 15
116
3
33
27 25
15
38
36
4
Whitehead HGP Related Publications
Whitehead HGP Related Patents
5 00 00 0 0 0 0 0 1 1 1 1 2 2
0
Publication/ Pate nt Grant Ye ar(Inclusiv e
)
Source: Delphion and ISI Web of Science
Patterns of Mean Cumulative Forward Citation
The number of forward citation measures the "importance" of a publication (Henderson et al.,
1998),178 among other key attributes in knowledge dissemination and accumulation. Table 4.5
presents the summary statistics for cumulative forward citation (CFC), along with other key
variables: matched patent, publication year, author count, center count, journal impact factor,
article type, industrial collaboration (for research and publication) and publication
characteristics.
178 Henderson, R., A. B. Jaffe, and M. Trajtenberg (1998). “Universities as a source of commercial technology: A detailed analysis of university patenting, 1965-1988.” Review of Economics and Statistics, 80(1): 119-127.

94

Table 4.5: Summary Statistics for the Key Variables in Regression Models
Variable No. ofObservations
Mean Std. Dev. Minimum Maximum
CFC 1573 76.20 308 0 3984
Matched Patent 1573 .0070 .0834 0 1
Publication Year 1573 1999 3.12 1990 2003
Author Count 1573 14.04 29.5 1 243
Center Count 1573 5.101 7.45 1 76
Journal ImpactFactor (2003)
1573 10.38 9.46 0 34.8
Article Type(Article/ Review)
1573 .7432 .437 0 1
Industrial (Research) Collaboration
1573 .0509 .220 0 1
HGP & Related Pubs 1573 .898 .303 0 1
Human or DirectApplication to Human
1573 .7444 .436 0 1
Very Specific HumanGenome Sequencing
1573 .1793 .384 0 1
Techniques/ Tools/ Software
1573 .1170 .321 0 1
I use cumulative forward citation as the dependent variable for the "anti-commons"
hypothesis – that is, cumulative citation of a scientific publication should be relatively lower
in the presence of a matched patent pair which is only possible through an institutional policy
allowing patenting. Preliminary observation based on Figure 4.5 shows that the mean
cumulative forward citation by year of paper publication does not seem to be systematically
lower for Whitehead and Baylor versus the other centers. That is matched patents do not seem
to reduce the "importance" of the publications nor affect the knowledge dissemination and use
from year to year (1990-2003). However, this is inconclusive and statistical analyses are
performed in the next Section to test H1.
95

Mea
n C
um
ula
tive
Fo
rwar
d C
itat
ion
Figure 4.5: Patterns of Mean Cumulative Forward Citation in the 7 Genome Centers179
800
Mean Cumulative Forward Citation (To 3-05)
700
600
500
400
300
Whitehead (WHD)
Sanger (SGR)
Washington Univ St Louis (WUL)
Baylor (BLR)
Univ of Washington Seattle (UWS)
Stanford (SFD)
Joint Genome Inst (JGI)
200
100
0
1990 1991 1992 1993 1994 1995 1996 1997 1998 1999 2000 2001 2002 2003
Paper Vintage (Year of Publication)
4.6 Statistical Analyses, Findings and Discussion
To test for H1, statistical analyses are performed and results from the center fixed-effects
NBRMs and the OLS model are summarized in Table 4.6. I start with the ordinary least
squares regression Model 4.6-0. The dependent variable is the natural log of forward citations
+ 1 and the key explanatory variable is MATCHED PATENT. Although the OLS model does
not consider the nature of citation as right-skewed count data, it suggests a statistically
significant increase (p = 0.00) in the cumulative forward citation for publications with
179 Mean cumulative citation rate is calculated by adding up the cumulative forward citation for each publication published in a particular year (year cohort) and then that sum is averaged over the number of publications in that year. This establishes a more neutral comparison across the 7 institutions for each “year cohort” to account for the potential variability from year to year.
96

matched patent. The other three models show results from the negative binomial regressions.
Model 4.6-1 is the baseline model which controls for publication year, number of authors,
number of collaborating centers, journal impact factor, type of article, industrial collaboration,
including center fixed effects. Model 4.6-2 includes additional variables (compared with
Model 4.6-1) to control for the different publication characteristics: human and/or direct
application to human; specific human genome sequencing; techniques, tools and/or software
but with no center fixed effects to test for marginal effects. Finally, the full Model 4.6-3
includes all the variables in Model 4.6-2 and with center fixed effects. The coefficients of the
NBRMs in Table 4.6 are reported as incidence rate ratios (IRR) which can be interpreted as
the factor change in citation received in a given year due to a unit increase in the regressor (or
right-hand side variable).180
The null hypothesis of no impact would produce a coefficient of
one.
180 IRR can be derived simply by exponentiating the coefficients of the independent variable xk from NBRMs, i.e. for a unit change in the independent variable xk, the expected forward citation count changes by a factor of exp(βk), holding all other variables constant.
97

Table 4.6: Summary of Variables in Fixed-Effects NBRM and OLS Model Output181
[4.6-0] OLSDV = ln(CFC+1)
NBRM: DV = CFCHGP Related Publication OnlyCoefficients reported as incidence rate ratios, IRR
[4.6-1]Baseline:w/o PublicationCharacteristics
[4.6-2] Full w/o Center FE
[4.6-3]Full w/ Center FE
Independent VariablesMatched Patent [322] (2)
(163)2.59 (.700)
2.89 (.706)
2.25 (1) (.529)
Control VariablesPublication Year [-10.2]
(1.59).812 (.016)
.819 (.014)
.804 (.014)
Author Count [5.13] (1.14)
1.003 (N) (.0026)
1.004 (2) (.0018)
1.004 (2) (.0019)
Center Count [9.94] (2) (4.09)
1.05 (.013)
1.05 (.0099)
1.05 (.0105)
Journal IF 2003 (Journal Quality)
[1.68] (3) (.957)
1.08 (.0056)
1.09 (.0049)
1.08 (.0050)
Article Type(Article/ Review)
[30.2] (7.67)
16.1 (2.49)
14.5 (2.15)
14.9 (2.12)
Industrial (Research) Collaboration
[112] (2) (46.5)
.987 (N) (.177)
.922 (N) (.148)
1.01 (N) (.179)
Human or DirectApplication to Human
[33.5] (2) (16.6)
.961 (N) (.110)
1.01 (N) (.105)
Specific HumanGenome Sequencing
[2.14] (N) (12.5)
.568 (.060)
.593 (.061)
Techniques/ Tools/ Software
[42.4] (1) (13.4)
2.45 (.500)
2.41 (.484)
Parametric RestrictionsCenter Fixed Effects # Restrict 6
χ2 30.89p-value 0.00
# Restrict 6χ2 27.23p-value 0.00
Regression StatisticsLog Pseudo-likelihood -5745 -5708 -5684P-value of Wald χ2 0.000 0.000 0.000R-Squared 0.52# of Observations 1412 1412 1412 1412All with p-value = 0.000 unless otherwise specified below:(1) < 0.01; (2) < 0.05; (3) < 0.10; (N) > 0.10 (not stat. sig.) Robust standard errors are shown in parentheses.Lighter shade: statistically significant. Darker shade: not statistically significant
181 In all cases, we employed NBRM with dispersion as a function of the expected mean of the counts for the i-th observation, which yields a higher likelihood ratio (better goodness-of-fit) than NBRM with dispersion as a constant for all observations.Note: Including a “publication age” fixed effects, defined by year 2003 minus year of publication, on full model4.6-3 generated very similar results.
98

The results across all three NBRMs are robust and consistent (p =0.000), with the only
exception being number of authors in Model 4.6-1. For the NBRMs, the test of aplha=0 is
significant, again suggesting NBRM is more appropriate than PRM. Through the “anti-
commons” test (based on full Model 4.6-3), I found:
a) Publications with a “matched patent” pair is significant (at 0.1%), strongly and
positively correlated to the number of cumulative forward citations. This suggests that
cumulatively, publications with matched patent pairs (at some point in time) received
more citation and are associated with wider knowledge dissemination and utilization.
They could also be characterized as more important publications. Specifically, having
a matched patent increases the expected number of CFC by a factor of 2.25. Since
only an institutional policy allowing (or even encouraging) patenting in Whitehead
and Baylor can result in matched patents, this allows us to reject H1.
After controlling for the quality of the publications, their publication characteristics,
types, number of authors and the center they are coming from, there seems to be a
causal relationship in this sample of publications. However, we have to be cautious
about this interpretation because of the lack of a temporal examination (of forward
citation patterns) and an actual counterfactual – matching the patented invention with
an equally good unpatented invention to understand what would have occurred
without the patent.
As a graphical illustration, Figure 4.6 compares the average forward citations per year
of all Whitehead HGP articles with and without patent pairs. Cumulatively (i.e. on the
99

A v e
r ag
e C
it a t
io n
s P
e r
Ye
a r
average), citation rate of publications with matched patent pair displays a significant
boost of more than two times over the citation rate of publications without patent
pairs. However, the chart also shows that at the fifth year from publication, citation
rate of publication with patent pair decreases rapidly and converges to that of
publication without patent on its eighth year. During these later years, patented articles
are often in their post patent grant phase, perhaps helping to explain the rapid decline.
Chapter 6 complements this analysis in these regards by exploiting the temporal trend
of pre- versus post- patent grant period for approved patents with paired publication.
Figure 4.6: Citations of Publications with and without Patent Pairs (All Whitehead HGP
Articles)
Citations by Type (w and w/o Patent Pair) by Age
[All Whitehead HGP Articles]
160140120100
80604020
0-20 0 5 10 15
Years Since Publication
Avg Citation Per Year (w Pat
Pair) Avg Citation Per Year (no
PatPair)

100

A possible explanation for the positive coefficient may be research that results in both
a patent and a publication may be viewed as higher quality research (and hence
attracted more attention) than a paper that only appears in a journal, as observed in the
positive coefficient estimate on the matched patent variable. Research that results in
both a paper and a patent receives more forward citations because at least three
agencies, the journal, genome center and the USPTO, have concluded that the research
is of merit.
b) “Publication year” is significant (p=0.00), strongly and negatively correlated to the
number of CFC. This is expected as the longer the publication has been around, the
higher the CFC should be.
c) “Author count” per publication is significant (at 2%) but marginally positive. This
suggests the higher the number of authors, the higher the CFC although the effect is
small. A possible explanation is more authors signal the scale or complexity of the
research project and therefore, a larger and more complex project may likely be more
cited.
d) “Center count” or number of collaborating institutions/centers is significant (p= 0.00)
and positive. This suggests the higher the number of collaborating institutions, the
higher the CFC. This is reasonable probably for the same reason as author count.
101
e) “Journal impact factor” is significant and positive. This is reasonable because it
measures a journal’s relative importance and “visibility” and provides a proxy for its
quality, especially in comparison with other journals in the same field. A high impact
journal is also one that is more frequently cited.
f) “Article type” is significant and strongly positive. This is intuitive because
publications that are classified as “articles” or “reviews” are the most noticeable forms
of knowledge dissemination and most highly cited among other types of publications.
g) “Industrial collaboration” is not significant, which is expected as teaming up with the
industry scientists for the purpose of research and publication will not necessarily
increase knowledge dissemination measured by forward citation.
h) Interestingly, publications that describe “specific human gene sequencing” show a
more than 40% significant decline in CFC, while those on “technique, tools and
software” witness a factor of 2.4 significant increases. This suggests that if a
publication only captures specific human gene sequencing information, the scientific
knowledge is not disseminated and used as widely as those more practical (perhaps
with higher commercial value) publications describing a new scientific tools and/or
method.
102

4.7 Conclusion
The Human Genome Project is one of the most significant life science research ever
undertaken for the exploitation of science, technology and commercial benefits and a critical
case study worthy of close examination.
Through the empirical study employing econometric modeling of output from all the genome
centers in the HGP, I have described in this Chapter the impact of distinctive institutional
decisions these centers made in the use of patenting and publication for the dissemination,
public use, and accumulation of knowledge, and the commercialization of biotechnologies. I
have also highlighted the controversial role of these different decisions as an exemplar of the
distinctive views held on how to institutionalize scientific knowledge.
Contrary to our hypothesis based on the “anti-commons” effect, I find publications with a
“matched patent” pair strongly correlate with a higher cumulative forward citations (by a
factor of 2.25). This suggests that cumulatively, publications with matched patent pairs
received more citation and are associated with wider knowledge dissemination and utilization
and are considered as more important (Trajtenberg et al., 1997; Henderson et al., 1998). Since
only an institutional policy allowing (or even encouraging) patenting in Whitehead and
Baylor can result in matched patents, such policy does not adversely impact cumulative
knowledge dissemination and use, ceteris paribus.
In addition, Whitehead patents contribute to technological innovation and commercialization
– they are well cited, and there have been more than 60 licenses to these patents and their
technologies have resulted in biotechnology start-up such as Agencourt Bioscience.
103

CHAPTER 5:
ATTRIBUTES OF LIFE SCIENCE INNOVATIONS
5.1 Patents as Measures of Technological Innovations
Economists have long comprehended the importance of technological innovation as a key
driver of growth and advance of organizations, industries and nations (Chapters 1 and 2), and
the complexity and difficulties plaguing the studies of technological change which have often
been impeded by the lack of good indicators for the various attributes of innovations
(Trajtenberg, 1990; Trajtenberg et al., 1997).182 Patents seem to be one exception since they
are “the only manifestation of inventive activity covering virtually every field of innovation in
most developed countries and over long periods of time” (Trajtenberg, 1990). Patent citations
have been used to measure the various attributes of innovations: basicness, distance and
appropriability for samples of university and corporate innovations (Trajtenberg et al., 1997;
Hall et al., 2001).183 To date, however, there has been no systematic and large-scale
quantification of the important attributes of innovations in the life sciences, in which patents
are unique from other industries and particularly critical (Scherer et al., 1959;184 Mansfield et
al., 1981;185
Mansfield, 1986;186
Levin et al., 1987;187
Cohen et al., 2000188
). Specifically, the
182 Trajtenberg, M. (1990) “A Penny for Your Quotes: Patent Citations and the Value of Innovations.” RandJournal of Economics, 21(1), pp 172- 187.183 Trajtenberg, Manuel, Rebecca Henderson and Adam Jaffe (1997). "University versus Corporate Patents: A Window on the Basicness of Invention" Economics of Innovation and New Technology, Vol 5, No. 1, pp 19-50.Hall, B. H., A. B. Jaffe, and M. Tratjenberg (2001). "The NBER Patent Citation Data File: Lessons, Insights andMethodological Tools." NBER Working Paper 8498.184 Scherer, F.M., et al. (1959) Patents and the Corporation. 2nd edn. Boston, privately published.185 Mansfield, E., Schwartz, M. and Wagner, S. (1981) "Imitation Costs and Patents: An Empirical Study."Economic Journal, 91:907-918.186 Mansfield, E. (1986) "Patents and innovation: An empirical study." Management Science, 32:173-181.
104

characteristics of innovations associated with different institutional settings: public
(universities and non-profit research institutions) and private (corporations) beg answers.
The various attributes of life science innovations under different institutional settings could
characterize technological knowledge diffusion and production in institutions. Technological
knowledge diffusion can be characterized by the forward looking measures of basicness:
“importance” and “generality”; forward citation time lag and distance in technology space
between the core innovation and its offsprings; and forward appropriability by the same
inventors building on the innovation. Such mechanisms of diffusion are often tightly coupled
with institutional settings of public versus private. On the other hand, technological
knowledge production can be characterized by the backward looking measures of basicness:
“importance”, “originality” and extent of dependency of the innovation on scientific sources;
backward citation time lag and distance in technology space between the core innovation and
its predecessors; and backward appropriability measured by the fraction of citation coming
from preceding patents awarded to the same inventor of the core patent. By understanding the
differences in innovations associated with different institutional settings, we could get a
glimpse into the institutional technological knowledge diffusion and production mechanisms.
In 2005, Jensen and Murray have laid the ground work in defining the patenting landscape of
the human genome by gathering a data set of U.S. patents claiming gene sequences from 1990
to 2005 and then comparing them with the sequences stored in government’s National Center
187 Levin, R., Kievorick, A., Nelson, R.R., and Winter, S.G. (1987) "Appropriating the returns from industrialR&D." Brookings Papers on Economic Activity, 783-820.188 Cohen, Wesley M., Richard R. Nelson, John P. Walsh (2000) “Protecting Their Intellectual Assets: Appropriability Conditions and Why US Manufacturing Firms Patent (or Not)” NBER Working Paper 7552
105

for Biotechnology Information (NCBI) database of human genes.189 They found that at least
4,382 of the 23,688 genes or 18.5% in the NCBI database as of 2005 have been claimed as
intellectual property in 4270 patents.190 These patents were owned by 1156 assignees or
institutions of which about 63% are assigned to private firms.
This chapter, which also serves as the foundation for Chapter 6, uses the full 4270 gene patent
data set to systematically quantify and analyze in detail the important attributes of life science
innovations based on a set of validated measures (Trajtenberg et al., 1997). It also
characterizes the important dimensions of innovations associated with public versus private
institutional settings while comparing them to the innovations across broad technology fields
in the study by Trajtenberg et al. (1997). These depictions are particularly interesting in this
area where there seems to be a growing convergence of academic and industry research which
is an essential characterization of many innovations in the Pasteur’s quadrant (Stokes,
1997).191
This gene patent data set is a suitable context in which to explore the characteristics of life
science innovations and their differences under two distinct institutional settings because: i) it
189 Jensen, Kyle and Fiona Murray (2005)."The Intellectual Property Landscape of the Human Genome." Science, Vol. 310, 14 October, pp. 239-240190 This is likely an underestimate because patents claiming rights to proteins were not examined and corresponding gene sequences might have been omitted.191 I cite three examples here: Louis Pasteur in the 1870 was concerned with some very practical problemsassociated with fermentation and putrefaction in the wine industry in France. However, in addition to solving these practical problems (applied research), he was the founder of the modern science of bacteriology (an increased understanding in basic research). A similar example can be said of the French scientist, Sadi Carnot who was attempting to improve the efficiency of the steam engine but created the hugely important fundamental science discipline of thermodynamics. A third example is Karl Jansky from Bell Labs, who was charged with the responsibility of determining and reducing the source of noise of transatlantic radiotelephone service. His research reported three sources of noise: local thunderstorms, more distant thunderstorms and “a steady hiss static, the origin of which is not known” or “star noise”. His research laid the foundation for the scientific discipline of radio astronomy.
106

is very homogeneous in terms of the technology fields (76% under “Drugs and Medical” and
24% under “Chemical” by USPTO technology classification); ii) it controls for the
heterogeneity of research input and output by focusing only on gene sequencing activities.
This Chapter is intended as an exploratory study on the different dimensions of innovations in
the life sciences under varying institutional settings of public versus private to better
understand their technological knowledge diffusion and production, before we turn our
attention to examine the impact of patenting on scientific knowledge diffusion, accumulation
and utilization in the paired publications of these patents in Chapter 6.
I find evidence of growing convergence of public/academic and industry innovations in terms
of basicness and appropriability compared to previous findings (Trajtenberg et al., 1997). I
also find some evidence of “technological trajectories” through these systematic linkages in
life science innovations between the forward and backward measures: originality breeds
generality, coming from more remote technological roots produces off-springs that have
further technology distance, more appropriable predecessors lead to more appropriable off-
springs, and to a lesser degree, importance breeds importance, as well as coherence and
persistence across the various dimensions of these innovations.
The next section develops the hypotheses in basicness and appropriability of innovations.
Section 5.3 defines the various constructed metrics and outlines an empirical test for the
hypotheses. Section 5.4 describes the data collection process and data set while Section 5.5
highlights the sampling issues and compares this study with previous studies. Section 5.6
107

presents the results of the statistical analyses and explores the potential presence of
technology trajectories and “production function”. Section 5.7 concludes the study.
5.2 Hypotheses Development: Basicness and Appropriability of Innovations
Although the terms basic and applied research have been frequently used, the underlying
conception remains poorly defined. Economists often conceive basic research in terms of the
difficulty with which it can be appropriated while scientists perceive it primarily in terms of
its relationship to prior research or its scientific and technological impact. This tacit
understanding needs to be clarified before developing the hypotheses and testing them. It is
important therefore to first discuss what is meant by basic research versus applied research in
the context of basicness and appropriability of innovations.
The National Science Foundation, in conducting its resource survey, defines basic research as
a research that has as its objective “a fuller knowledge or understanding of the subject under
study, rather than a practical application thereof.” By contrast, it defines applied research as
research directed towards increasing “knowledge or understanding necessary for determining
the means by which a recognized and specific need may be met.”192 Basic research can also
be defined as “original investigation for the advancement of scientific knowledge that does
not have a specific commercial objective.”193
192 National Science Foundation, Science Indicators, 1985 (Washington, D.C., 1985). p.221193 National Science Foundation, Research and Development in Industry, 1977. Washington D.C., GovernmentPrinting Office, 1979.
108
To put it more plainly, according to Lawrence Berkeley National Laboratory's Ethical, Legal,
and Social Issues in Science program, basic, also known as fundamental or pure, research is
“driven by a scientist's curiosity or interest in a scientific question. The main motivation is to
expand man's knowledge, not to create or invent something.” There is no obvious commercial
value to the discoveries that result from basic research. On the other hand, applied research is
designed to “solve practical problems of the modern world, rather than to acquire knowledge
for knowledge's sake.” In a sense, the goal of the applied scientist is to improve the human
condition.194
Here, I draw the distinction between research and innovations (or useful research outcome).
The basicness of research can be defined as a characteristic of activities leading to
innovations and basicness of innovations which we are concerned with is a feature of the
outcomes of such activities (Kuznets, 1962;195 Trajtenberg et al., 1997). Thus, basicness (of
innovation) can be defined as “the fundamental features of innovation such as originality,
closeness to science, breadth” (Trajtenberg et al., 1997). Research projects in the universities
and industry laboratories exhibit different levels of basicness.
Following these conventional understanding in the literature, I hypothesize that life science
innovations from public institutions are associated with more basicness, compared to those
from private corporations. One of the characteristics of basicness is the forward importance
(IMPORTF) of a patent as Kuznets (1962) stated so elegantly:
194 Lawrence Berkeley National Laboratory's Ethical, Legal, and Social Issues (LBNL – ELSI) in Science program, 2004. http://www.lbl.gov/Education/ELSI/research-main.html195 Kuznets, S. (1962) “Inventive Activity: Problems of Definition and Measurement,” in R. Nelson (ed.) TheRate and Direction of Inventive Activity, Princeton, NJ: Princeton University Press.
109

“some inventions, representing as they do a breakthrough in a major field, have wide
technical potential in the sense that they provide a base for numerous subsequent technical
changes…”
IMPORTF captures citations of follow-up innovations to an originating patent on which they
built. In this sense, IMPORTF reflect both the number of subsequent citations and the
importance of the core innovation. This is a key characteristic of basic innovation. Hence,
H1a: Life science innovations from public institutions are associated with more forward-
looking importance (IMPORTF), compared to those from private corporations.
A second notion of forward basicness is the “generality” of innovation (GENERAL), or the
degree to which follow-up technical advances are spread across different technological fields,
rather than in just a few of them. Thus,
H1b: Life science innovations from public institutions are associated with more
generality (GENERAL), compared to those from private corporations.
The backward importance (IMPORTB), on the other hand, captures the extent to which a
given core patent build on a broad base of prior innovations which are important themselves.
This reflects aspects of originality or creativity in the sense that the more original patents
would build on less previous innovations and yield lower values of IMPORTB. Therefore,
110

H1c: Life science innovations from public institutions are associated with less backward-
looking importance (IMPORTB), compared to those from private corporations.
Originality (ORIGINAL) is the backward equivalent for GENERAL in the sense that the
more original the innovation, the broader the technological roots of the underlying research as
innovations based on synthesis of divergent concepts are more original innovations, an aspect
of backward basicness. Thus,
H1d: Life science innovations from public institutions are associated with more
originality (ORIGINAL), compared to those from private corporations.
Finally, the number of non-patent sources, predominantly scientific articles, cited by the core
patent is a proxy for the use of scientific sources (SCIENCE) by the core innovation. More
basic research tends to use more science than technology and thus would be associated with
higher SCIENCE value.
H1e: Life science innovations from public institutions are associated with more science
(SCIENCE), compared to those from private corporations.
The time and technology distance of an innovation have been shown to relate to aspects of
basicness and/or appropriability (Trajtenberg et al., 1997). Forward looking time distance
(TIMEF) is defined as the average forward citation time lag. Arguably, more basic innovation
111

will take more time in producing offsprings as they encounter proportionately more
difficulties in R&D relative to the degree of “basicness”. Thus,
H2a: Life science innovations from public institutions are associated with more forward
citation time lag (TIMEF), compared to those from private corporations.
In terms of forward technology distance (TECHF), basicness is considered to relate to higher
probability of serendipitous discoveries which tend to occur in more technologically remote
areas. Thus the occurrence of far-removed follow-ups would be higher the more basic a patent
is. Therefore,
H2b: Life science innovations from public institutions are associated with more forward
technology distance (TECHF), compared to those from private corporations.
By symmetry in reasoning, similar conditions apply to the backward time and technology
distance measures. These lead to the next two hypotheses:
H2c: Life science innovations from public institutions are associated with more
backward citation time lag (TIMEB), compared to those from private
corporations.
112
H2d: Life science innovations from public institutions are associated with more
backward technology distance (TECHB), compared to those from private
corporations.
Appropriability relates to the attributes of innovations that allow their inventors to reap the
benefits from their own innovations. In the United States, although the federal share has been
declining between years 1970 to 1990, it still makes up of about more than half of the total
funds devoted to basic research in public institutions like universities and other non-profit
research organizations (NSF, 2002).196 Economists have accepted that private enterprise
economy fails to provide adequate incentives for investment in knowledge production
(Arrow, 1962; Nelson 1959). This could be due to several reasons:
1) High degree of uninsurable risk and uncertainty – this is inherent as we move from the
applied research to the basic research end of the spectrum.
2) Long timeline – the commercialization and practical application for basic research
often cannot be envisioned in the near future (usually more than 25 years). This
exacerbates the conditions described in 1).
3) Knowledge as a commodity – once produced, it is “on the shelf” and freely available
to all, as economists would argue, including firms that have not made any contribution
196 National Science Foundation, Division of Science Resources Statistics (2002). Science and Engineering
Indicators–2002. Arlington, VA (NSB 02-01)
113

to the research and production of such knowledge. This can lead to a typical “free
rider” problem (Olson, 1965).197
These reasons, especially the third one, have led scholars to consider that there is a serious
problem of appropriability for firms undertaking basic research as they have no adequate
recourse or mechanisms to appropriate benefits of such research themselves, to exclude their
competitors. Society would not invest sufficient resources even under perfectly competitive
conditions (Arrow, 1962). Competition may even exacerbate the problem of firms doing
basic research as this would increase the likelihood that competitors will quickly exploit
useful new knowledge and weaken the incentives for investment in basic research and
knowledge production by private firms. Therefore, the general economic arguments that basic
innovations usually result from basic research, and more basic innovations are more difficult
to appropriate lead to the third and final set of hypotheses on appropriability:
H3a: Life science innovations from public institutions are associated with less forward
appropriability (PSELFF), compared to those from private corporations.
H3b: Life science innovations from public institutions are associated with less backward
appropriability (PSELFB), compared to those from private corporations.
197 A free rider can be defined as a person who decides to receive the benefits of a "public good" or a "positive externality" without contributing to paying the costs of producing those benefits.
114

5.3 Metrics of Basicness and Appropriability
The basicness and appropriability metrics rely exclusively on information contained in patents
– a stable, and richest source of data on innovation with the widest coverage. Many scholars
have used patents as various indicators of the innovation process (Griliches, 1984 and
1990;198
Jaffe, 1986199
) while other scholars have demonstrated that patent citations hold
important information about the value of patents and links among them (Carpenter et al.,
1981;200 Carpenter and Narin, 1983;201 Trajtenberg, 1990a and 1990b202). However, as these
previous scholars have observed, two limitations follow the use of patent data: i) the range of
patentable innovations forms a sub-set of all research outcomes and ii) patenting, as described
in Chapter 4 is a strategic decision and hence, not all patentable innovations are actually
patented.
Using the validated measurement models proposed by Trajtenberg et al. (1997), I construct
the following metrics of basicness, distance and appropriability to test my hypotheses. The
notations contained in the formulae of these metrics that follow are defined in Table 5.1.
198 Griliches, Z. (ed.) (1984). R&D, Patents and Productivity. Chicago, IL: University of Chicago Press Griliches, Z. (1990) "Patent Statistics as Economic Indicators: a Survey." Journal of Economic Literature, 27, pp. 1661-1707.199 Jaffe, A. (1986) "Technological Opportunity and Spillovers of R&D: Evidence from Firms' Patents, Profits and Market Value." American Economic Review, 76(5), pp.984-1001.200 Carpenter, M.P., Narin F. and Wolf P. (1981) "Citation Rates to Technologically Important Patents." WorldPatent Information, Vol. 3. No.4.201 Carpenter, M. and F. Narin. (1983) "Validation Study: Patent Citations as Indicators of Science and ForeignDependence," World Patent Information, Vol.5, No. 3, pp. 180-185.202 Trajtenberg, M. (1990a) “A Penny for Your Quotes: Patent Citations and the Value of Innovations.” RandJournal of Economics, 21(1), pp 172- 187.Trajtenherg, M. (1990b) Economic Analysis of Product Innovation: The Case of CT Scanners. Cambridge, MA: Harvard University Press
115

Table 5.1: Notations and Definitions Used in Metrics of Basicness, Distance and Appropriability
Notation Definition
NCITING Number of patents citing the core/originating patent (i.e. forward citations)
NCITED Number of patents cited by the core/originating patent (i.e. backward citation)
NPCITES Number of non-patent sources (i.e. scientific articles) cited by core patent
NCLASS 3-digit original patent class (by USPTO)
CATCODE 2-digit “technological class” which aggregates up NCLASS
FIELD 1-digit classification by main technological fields
LAG Difference in years between the application date of a citing or cited patent and
the application date of the core/ originating patent
λ Arbitrary “discount factor” to down-weight second generation descendants of
a patent relative to first-generation citing/cited patents (0< λ<1).
� IMPORTF – measure of F/ importance – captures technological impact of an
invention by looking at number of forward citations.
o Measure of importance depends on number of two generations of forward
citations
o λ =0.5
IMPORTFi = NCITINGi + λ
ncitingi
∑ NCITINGi + 1, j
j =1
� IMPORTB – measure of B/ importance – captures technological impact of an
invention by looking at number of backward citations.
o Measure of importance depends on number of two generations of backward
citations
116

o λ =0.5
ncitedi
IMPORTBi = NCITEDi + λ ∑ NCITINGi − 1, j
j =1
� GENERAL – measure of generality – captures “basicness of outcomes” of invention,
looking at range of fields of forward citations.
o Measure of generality depends on number of forward citations and the number
of classes of forward citations.
o F/measure (basicness of outcomes)
Ni
GENERALi = 1 − ∑ ( NCITINGik / NCITINGi )^2k =1
� ORIGINAL – measure of originality – captures “basicness of research” of invention,
looking at range of field of backwards citations.
o B/ measure (basicness of research)
o B/ analog of GENERAL
Ni
ORIGINALi = 1 − ∑ ( NCITEDik / NCITEDi )^2k =1
� SCIENCE – measure of scientific base – B/measurement of predominance of
scientific sources over technological sources.
o B/measure (basicness of research)
SCIENCEi = NPCITESi / ( NPCITESi + NCITEDi )
117

� TIMEF – measure of F/looking time distance – average forward LAG.
ncitingi
TIMEFi = ( ∑ LAGj ) / NCITINGi
j =1
� TIMEB – measure of B/looking time distance – average backward LAG.
ncitedi
TIMEBi = ( ∑ LAGj ) / NCITEDij =1
� TECHF – measure of F/looking technology space distance – looks at 3-digit class
(NCLASS), 2-digit class (CATCODE) and 1-digit class (FIELD) of citing patent and
original patent.
o If citing patent is in same 3-digit class (NCLASS) as the original patent, then
TECH = 0
o If citing patent is in the same 2-digit class (CATCODE) but not in the same 3-
digit class, then TECH = 0.33
o If citing patent is in the same 1-digit class (FIELD) but not in other two, then
TECH = 0.66
o If both are in different 1-digit classes, then TECH = 1.0
ncitingi
TECHFi = ( ∑TECHj ) / NCITINGi
j =1
� TECHB – measure of B/looking technology space distance – looks at 3-digit class
(NCLASS), 2-digit class (CATCODE) and 1-digit class (FIELD) of cited patent and
original patent.
118

ncitedi
TECHBi = ( ∑TECHj ) / NCITEDi
j =1
� PSELFF – measure of F/looking appropriability.
o Percentage of citing patents issued to the same assignee as that of the original
patent.
PSELFF = (∑ NCITINGoriginalassignee / ∑ NCITING ) ⋅ 100%
� PSELFB – measure of B/looking appropriability.
o Measures extent by which the originating innovation represents appropriation
of benefits to its predecessors.
PSELFB = (∑ NCITEDoriginalassignee / ∑ NCITED) ⋅100%
These eleven measures have been summarized below in Table 5.2 into the categories of
basicness, technology distance and appropriability.
Table 5.2: Metrics of Basicness and Appropriability
Forward Backward
Basicness IMPORTFGENERAL
IMPORTBORIGINAL SCIENCE
Distance TIMEFTECHF
TIMEBTECHB
Appropriability PSELFF PSELFB
119

After the construction of each of these eleven F/B measures, the means for respective
institutional setting, i.e. public institution (and universities) versus private corporation will be
computed for each measure. An analysis of variance (ANOVA) is performed to test the
hypotheses. For each hypothesis, the test will use one of the F/B measures as dependent
variable and institutional setting as the main independent variable, controlling for patent
application year, patent publication year, patent grant delay, technology (NCLASS), number
of inventors, total number of assignees, assignee location (US or not).
5.4 Patent Data Collection and Data Set
The representative data set of the entire human gene patents forms the thrust of this research.
As of 2005, at least 4382 of the 23688 genes (8,952 claimed sequence-gene pairs) or 18.5% in
the NCBI database have been claimed as intellectual property in 4270 patents within 3050
patent families. Most patents cover only a single gene but a few cover 10 or more (Jensen and
Murray, 2005). This number is lower compared with previous reports as ratio of sequences
that are claimed to those that are merely disclosed is about 1: 10.
The data set contains information on each patent searchable through NCBI Blast203 and
granted by USPTO, which generates a highly structured public document, detailing
information on the innovation itself; filing dates; the technological area to which it belongs;
the inventors e.g. names and geographic locations; institution affiliations to which the
inventors assign the intellectual property rights; references or citations to previous patents and
203 NCBI's Blast tool is the gold standard for comparing sequences and would be the most objective, robust and transparent documentary source for this study.
120

to the scientific literature, among others. It would also contain information on the matching
core publications such as ISSN, publication dates, titles and abstracts of publications, number
of forward citations, author names, number of authors, author affiliations and addresses etc.
The patent data set was developed through a two-step process: 1) gathering of the initial set of
U.S. granted patents; and 2) comparing if the sequences claimed match human nucleotide
sequences and the assignment of the sequence (i.e. the patent) to a specific gene. The first
stage of this procedure was described by Jensen and Murray (2005) below:204
“A set of 691,259 sequences was downloaded (all data were obtained on 5 April 2005)
from the U.S. National Center for Biotechnology Information nucleotide database using
the following Entrez Nucleotide search: "gbdiv pat" [Properties] AND srcdb_genbank
[PROP]. This search criterion extracts only those sequences from the GenBank database
that were entered by the GenBank patent division. These sequence data are sent weekly to
the GenBank patent division by the U.S. Patent and Trademark Office and contain
nucleotide sequences disclosed in issued U.S. patents. From the 691,259 sequences
obtained from our Entrez Nucleotide search criteria, we removed sequences from World
Intellectual Property Organization (WIPO) and European Patent Office (EPO) patents,
which were in the database for an unknown reason, giving an initial database size of
686,864 nucleotide sequences. These sequences were removed because our aim was to
develop the most extensive and comprehensive data on U.S. granted patents rather that
204 Jensen, Kyle and Fiona Murray (2005). Supporting Online Material for the Intellectual Property Landscape of the Human Genome. Science, Vol. 310, 14 October, pp. 239-240
121

worldwide coverage: WIPO and EPO data released to GenBank are not comprehensive
and there may be sequences from patent applications rather than granted patents.”
In the second stage, NCBI’s BLAST software was used to compare the entire database of
disclosed sequences to the complete set of mRNA transcripts from the NCBI RefSeq
database. They described three choices regarding the degree of specificity of their criteria:
“1. We extracted only those alignments with an E-value of exactly zero (i.e. a very
statistically significant match). Normally, BLAST is used to detect remote homologs;
however, here it was used to identify the precise genomic sequence from which a patented
sequence was derived. Thus, the conservative E-value prevents spurious matches to
orthologs, pseudo-genes, and such.
2. We included only those that were at least 150 nucleotides in length on the basis that this
is the average length of one human exon and yet still small enough to capture EST
sequences.
3. If a disclosed sequence could be aligned to multiple RefSeq transcripts with an E-value
of zero (for example, multiple similar spice variants of a gene or very similar orthologs)
the disclosed sequence was paired with the transcript with the highest alignment bit-score.
This prevents mislabeling of a patent on a rat gene sequence, for example, as human.”
122

This process could be best illustrated by taking the example of the well-known BRCA1 gene
in the NCBI database.205 Figure 5.1 below shows the different transcripts and products of the
gene: on left are the different mRNA transcripts that the gene can produce and on the right are
the corresponding proteins. The NCBI database also provides links to all the mRNA variants,
like NM_007294.206 In this case, there are several patents on this gene, most notably the
Myriad Genetics patents.
Figure 5.1: Transcripts and Products of BRCA1 (Breast Cancer 1) Gene
5.5 Sampling Issues
The data set consists of the entire population of gene patents assigned to both public entities
(37%), i.e. universities and research institutes and private entities (63%), i.e. for-profit
organizations and corporation. This largely mitigates the sample selection bias present in
Trajtenberg et al. (1997) where a small number of university patents (316 patents from 1975
and 482 patents from 1980) were matched to two samples of corporate patents too broadly
classified into ones from companies with more basic research – top 200 R&D performing
205 http://www.ncbi.nlm.nih.gov/entrez/query.fcgi?db=gene&cmd=Retrieve&dopt=Graphics&list_uids=672206 http://www.ncbi.nlm.nih.gov/entrez/viewer.fcgi?db=Nucleotide&dopt=GenBank&val=6552298
123

U.S. firms and ones with less – all other U.S. corporations. Universities have certain
“institutional idiosyncrasies” and their patents are not “representative” of the universe of all
U.S. patents and matching them to a small number of corporate patents broadly divided into
“top 200 R&D firms” and “all others” limit their validity. Furthermore, by no means all
research outcomes from universities eventually end up as patents. This was especially true in
the period 1975 to 1980 before the 1980 Bayh-Dole Act (Ding et al., 2006).207
This gene patent data set overcomes the sampling bias in the following ways: i) almost all
patentable inventions in private entities will be patented especially in the life sciences where
patents are critical (Scherer et al., 1959;208 Mansfield et al., 1981;209 Mansfield, 1986;210
Levin et al., 1987;211 Cohen et al., 2000212); ii) although not all research outcomes in
universities may be patentable, it only consists of about 30% of our sample. Nevertheless, we
can be certain that all the university patents in the data set are patentable inventions by
definition; iii) the application years of the patents include the entire past 15 year range from
1990 to 2004, after the passage of the 1980 Bayh-Dole Act which encourages universities
patenting and licensing by allowing the automatic appropriation of the intellectual property
rights for federally funded research, largely increasing the proportion of patentable
innovations actually being patented in the universities. This differs from the environment of
the two samples of 1975 and 1980 university patents studied by Trajtenberg et al. (1997); iv)
207 Ding, Waverly, Fiona Murray and Toby Stuart. 2006. “An Empirical Study of Gender Differences inPatenting in the Academic Life Sciences”, Forthcoming.208 Scherer, F.M., et al. (1959) Patents and the Corporation. 2nd edn. Boston, privately published.209 Mansfield, E., Schwartz, M. and Wagner, S. (1981) "Imitation Costs and Patents: An Empirical Study,"Economic Journal, 91:907-918.210 Mansfield, E. (1986) "Patents and innovation: An empirical study," Management Science, 32:173-181.211 Levin, R., Kievorick, A., Nelson, R.R., and Winter, S.G. (1987) "Appropriating the returns from industrial R&D", Brookings Papers on Economic Activity, 783-820.212 Cohen, Wesley M., Richard R. Nelson, John P. Walsh (2000) “Protecting Their Intellectual Assets: Appropriability Conditions and Why US Manufacturing Firms Patent (or Not)” NBER Working Paper 7552
124

the data is representative in the domain of life sciences as it captures, unprecedentedly the
entire “population” of genomic patents and has more statistical power because of the much
larger set of 4270 patents compared to the 316 and 482 university patents in 1975 and 1980
studied by Trajtenberg et al. (1997).
5.6 Empirical Analyses and Findings
5.6.1 Descriptive Statistics
To gain insight of the distribution of the various variables in the patent data set under study,
we first look at some descriptive statistics. Table 5.3 below illustrates the descriptive statistics
of these variables in the patent data set.
Table 5.3: Descriptive Statistics of Basic Patent Variables
Variable | Obs Mean Std. Dev. Min Max-------------+--------------------------------------------------------Pat_appl_year| 4270 1997.484 2.450467 1990 2004# inventors | 4270 3.265105 2.013767 1 24# assignees | 4270 1.131382 .4847873 1 13pat_grt_delay| 4270 3.026932 1.45035 0 11#us_pat_cited| 4270 3.069789 10.87682 0 244#other_npcite| 4270 457.6548 608.2833 0 7819#nation_class| 4270 6.348712 3.018556 1 30US_assign >=1| 4270 .830445 .3752854 0 1PublicAsgn>=1| 4270 .3501171 .4770623 0 1PrivatAsgn>=1| 4270 .6936768 .4610196 0 1
The mean patent application year is 1997, exactly in between the earliest (1990) and latest
year (2004). Figure 5.2 illustrates the number of patents by patent application year with all
three lines (all patents, public patents, private patents only) following similar trends of rise
and decline.
125

Nu
mb
er o
f P
aten
ts
199
019
91
199
219
93
199
419
95
199
619
97
199
819
99
20
00
20
01
20
02
20
03
20
04
Figure 5.2: Number of Gene Patents by Application Year
Gene Patents by Application Year
700
600
500
400
300
200
100
0
All Patents byApplication Year
Public Patents byApplication Year
Private (Only) Patents by Application Year
Application Year
The mean number of inventors and assignees are 3.3 and 1.1 respectively. The average patent
grant delay, defined as the difference between patent publication year and patent application
year, is about 3 years. The number of US patents cited by each core patent is relatively low –
about 3 on the average. As these cited patents bear legal rights of claim in which the citing
core patent builds on, they are absolutely essential patents in which these citing innovations
are constructed upon and hence the number tends to be low. The mean number of non-patent
references (i.e. scientific journal articles) cited by the core patents is 458, a much higher
figure than the patent references. The average number of national classes or 3 digit utility
classes code defined by the USPTO is 6.3 with a standard deviation of 3. 83% of the patents
in the data set have at least 1 US assignee while 35% of the patents have at least 1 public
126

Nu
mb
er o
f P
aten
ts G
ran
ted
assignee (universities or public research laboratories). Figure 5.3 shows the breakdown of
number of patent granted by assignee types: public, private or public-private mix. The
standard deviations are relatively small compared to the mean with a σ/µ ratio of less than 1 in
most cases except for “number of US patent cited” and “number of other non-patent cites”,
making the means generally accurate measures to describe the statistical distributions.
Figure 5.3: Number of Gene Patents Granted by Type of Assignees
N u mber o f P atents Gran ted b y T ype of As signee s
3000 2775
2500
2000
1500 1308
1000
500 187
0P rivate (Indus try ) P ublic P ublic -P rivate
Typ e of Assig n e e s
Since the patent grant delay is a key variable used to obtain many of the subsequent measures
and is critical in our differences-indifferences analysis in the next Chapter, we take a closer
look. Figures 5.4 shows the average patent grant delay by patent application vintage. The
average patent grant delay, defined as the difference between patent publication year and
patent application year, is about three years. As expected, the chart shows approximately a
linear, stable but slightly decreasing trend.
127

199
5
199
3
1997
199
8
199
9
20
00
20
01
20
02
Ave
rage
Pat
ent
Gra
nt
Del
ay
199
0
1991
1994
199
6199
2
Figure 5.4: Average Patent Grant Delay by Patent Application Vintage 213
Average Patent Grant Delay by Vintage
6
5
4
3
2
1
0
Patent Application Vintage
Table 5.4 shows the descriptive statistics of various basicness, technology distance and
appropriability metrics while Figure 5.5 graphically captures the six backward measures
(importb, original, science, timeb, techb, pselfb) which I will discuss individually. There are
4270 patents of which 2439 have back patent references, 1773 have forward patent citations
and 4211 have either back or forward references.
213 X-axis truncated at year 2002 because there is not sufficient time for future observations of granted patents to fully capture the actual trend beyond 2002.
128

Table 5.4: Descriptive Statistics of Basicness, Technology Distance and Appropriability
Basicness Measures:
Variable | Obs Mean Std. Dev. Min Max-------------+--------------------------------------------------------
importf | 4270 2.473302 9.693342 0 228 general(f)| 1773 .372888 .3387171 0 .94579 importb | 4270 105.8429 409.2729 0 6542
original(b)| 2439 .4218056 .3530429 0 .98492 science(b)| 4211 .9787838 .1077266 0 1
Distance Measures:
Variable | Obs Mean Std. Dev. Min Max-------------+--------------------------------------------------------timef(days) | 1773 1265.644 668.986 -1505 3976.33
techf | 1773 .4902913 .3773699 0 1timeb(days) | 2439 2007.177 1267.511 -1628 9032.07
techb | 2439 .474874 .3819819 0 1
Appropriability Measures:
Variable | Obs Mean Std. Dev. Min Max-------------+--------------------------------------------------------
pselff | 1773 .1846333 .3367957 0 1pselfb | 2439 .1473475 .3008039 0 1
IMPORTF is highly right skewed in life science innovations: the maximum is 228 while the
minimum is 0 with a mean of 2.47 which is centered close to 0 and a standard deviation of
9.7. This is consistent with previous findings (Pakes, 1986;214 Trajtenberg et al., 1997). If
IMPORTF may be interpreted as the technological “value” of patents, most patents have little
value and only a few create huge impact. IMPORTB is similarly highly right skewed with a
mean of 106, which implies few innovations have important technological predecessors as
expected.
214 Pakes, Ariel (1986) "Patents as Options: Some Estimates of the Value of Holding European Patent Stocks."
Econometrica, 54(4), pp. 755-84.
129

GENERAL and ORIGINAL are much more normally distributed with means of 0.37 and
0.42 respectively. These are substantially higher than previous findings (Trajtenberg et al.,
1997). This shows biomedical and life science innovations have greater generality than an
average technological innovation across all technological areas (Drugs and Medical,
Chemical, Electronics, Optics and Nuclear, Mechanical Arts, and Others) as described by
Trajtenberg et al. (1997), i.e. more follow-on innovations are distributed across different
technological categories. Life science innovations also demonstrates higher originality as
these innovations have broader technological roots and capitalize and integrate a more
divergent set of ideas from previous innovations. 42% of the patents have GENERAL = 0.
More than 90% (678/750) of those patents with GENERAL = 0 had one citing patents; an
additional 8% (61/750) of patents had two citing patents. This explains the large mass at zero:
patents that have resulted in only one or two follow-on technological innovations can hardly
be classified as general. 38% (932/2450) of the patents have ORIGINAL = 0. More than
95% (890/932) of those patents with ORIGINAL = 0 had cited only one patent and an
additional 3.4% (32/932) had cited two patents. These are substantially larger than previous
findings by Trajtenberg et al. (1997). If the innovation only integrates one or two previous
ideas, it can hardly be seen as an original innovation.
SCIENCE is extremely left skewed with a mean of 0.98, showing a heavy reliance on non-
patent or scientific sources cited by the core patents. This implies a much higher level of
basic research involvement in life science innovations (76% under “Drugs and Medical” and
24% under “Chemical” by USPTO classification) compared to an average technological
innovation across all technological areas as described by Trajtenberg et al. (1997). This is
130

expected and understandable as life science innovations are particularly dependent on
university science and basic research and increasingly on university licensing and
commercialization arrangements (Mowery et al., 2001).215
TIMEF and TIMEB are comparatively more normally distributed with a mean of 1266 days
or 3.5 years and 2007 days or 5.5 years respectively. Life sciences innovations have both
shorter forward and backward looking time distance in terms of lag than an average
technology innovation Trajtenberg et al. (1997). These innovations take less time to come to
fruition from predecessors and more quickly yield off-springs. This could be interpreted as
being more applied and less basic than an average technology innovation.
TECHF and TECHB seem normally distributed with the means of 0.49 (standard deviation
of 0.38) and 0.47 (standard deviation of 0.38) respectively. Interestingly, life science
innovations have roots in more remote technological fields and produce similar off-springs in
more distant technology categories, compared to an average technology innovation
(Trajtenberg et al., 1997). This could again be interpreted as the need to synthesize and
integrate knowledge from different disciplines and across longer technology distances (in
terms closeness of USPTO utility classes and subclasses) for life sciences innovations to
occur than traditional technology innovations. In doing so, these innovations have resulted in
production of off-springs with longer technology distance.
215 Mowery, David, Richard Nelson, Bhaven Sampat, and Arvids Ziedonis (2001) “The Growth of Patenting andLicensing by U.S. Universities: An Assessment of the Effects of the Bayh-Dole Act of 1980.” ResearchPolicy 30:99-119.
131

PSELFF and PSELFB are much more normally distributed with means of 0.185 and 0.147
respectively. Compared to an average technology innovation, they show a slightly higher
level of appropriability and realization of technological benefits in life science innovations
(percentage of citing/cited patents issued to the same assignee as the core patent) both in
relation to their predecessors and offsprings. This reflects both the nature of biomedical
research as well as the intent of institutions that patent and appropriate innovation to keep
technology development in-house or under tight control. This further provides some first
evidence of strategic safeguarding of a selected group of specific patents to capture the
greatest benefits and maintain competitive (even monopolistic) positions in the life sciences
sector.
Figure 5.5 below illustrates the overall trends across each patent application year for the six
backward measures: ORIGINAL, SCIENCE, TECHB, PSELFB, IMPORTB and TIMEB. As
expected of backward trends, these measures of innovation have been linear and stable over
the 13 application years (1990-2002) with the exception of the initial decline in the first one to
two years in backward time (TIMEB) and technology distance (TECHB) and appropriability
(PSELFB).
132
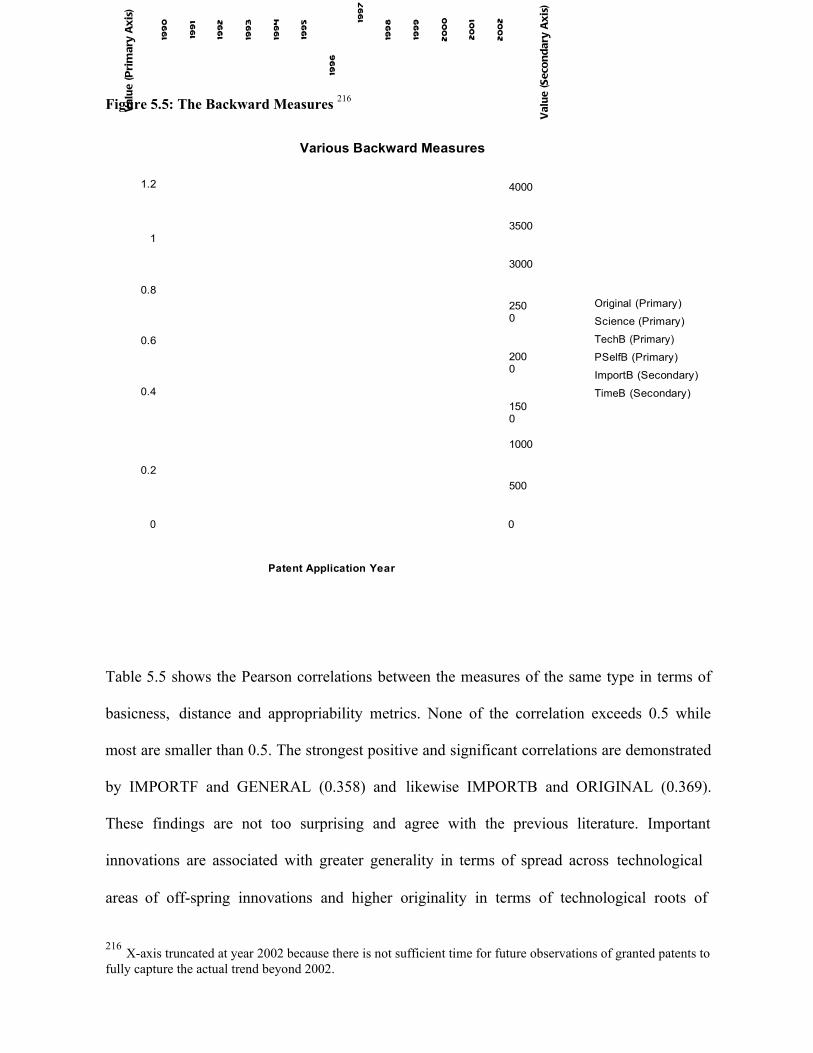
Val
ue
(Pri
mar
y A
xis
)
Val
ue
(Sec
on
dar
y A
xis
)
199
6
199
0
199
1
1992
199
3
1994
199
5
199
8
1999
20
00
20
01
20
0219
97
Figure 5.5: The Backward Measures 216
Various Backward Measures
1.2 4000
35001
3000
0.8
0.6
0.4
2500
2000
1500
Original (Primary)
Science (Primary)
TechB (Primary)
PSelfB (Primary)
ImportB (Secondary)
TimeB (Secondary)
1000
0.2
500
0 0
Patent Application Year
Table 5.5 shows the Pearson correlations between the measures of the same type in terms of
basicness, distance and appropriability metrics. None of the correlation exceeds 0.5 while
most are smaller than 0.5. The strongest positive and significant correlations are demonstrated
by IMPORTF and GENERAL (0.358) and likewise IMPORTB and ORIGINAL (0.369).
These findings are not too surprising and agree with the previous literature. Important
innovations are associated with greater generality in terms of spread across technological
areas of off-spring innovations and higher originality in terms of technological roots of
216 X-axis truncated at year 2002 because there is not sufficient time for future observations of granted patents to
fully capture the actual trend beyond 2002.

133

predecessors. The other pairs showing positive pairwise correlation includes GENERAL and
TIMEF (0.213) and likewise ORGINAL and TIMEB (0.296). This shows innovations with
greater generality are associated with longer forward time distance; innovations with greater
originality are associated with greater backward time distance. Similar to previous literature,
there is weak negative correlations demonstrated by GENERAL and PSELFF (-0.085) and
likewise ORIGINAL and PSELFB (-0.064). This provides some evidence that innovations
with a higher generality, i.e. producing more off-spring innovations distributed across
different technological categories, are associated with less appropriability. This could perhaps
be explained by either these innovations are more difficult appropriable or institutions prefer
not to appropriate these types of innovations. I find the former explanation more plausible.
This same pattern is exhibited between originality and backward appropriability. These are
potentially interesting issues that could be explored in future research.
Table 5.5: Correlations between Basicness, Distance and Appropriability Metrics
Forward Measures:
| importf general timef(days) techf pselff-------------+---------------------------------------------
importf | 1.0000||
general(f)| 0.3575 1.0000| 0.0000|
timef(days)| 0.1753 0.2131 1.0000| 0.0000 0.0000|
techf | -0.0018 -0.0052 0.0445 1.0000| 0.9411 0.8262 0.0611|
pselff | -0.0217 -0.0846 -0.1224 -0.0090 1.0000| 0.3621 0.0004 0.0000 0.7040
134

Backwards Measures:
| importb original timeb(days) techb pselfb science-------------+------------------------------------------------------
importb | 1.0000||
original(b)| 0.3692 1.0000| 0.0000|
timeb(days)| 0.3620 0.2959 1.0000| 0.0000 0.0000|
techb | 0.0520 0.1293 0.0822 1.0000| 0.0101 0.0000 0.0000|
pselfb | -0.0980 -0.0641 -0.1962 -0.0395 1.0000| 0.0000 0.0015 0.0000 0.0509|
science(b)| -0.0697 0.0400 0.0478 0.0038 -0.0634 1.0000| 0.0000 0.0480 0.0183 0.8508 0.0017
5.6.2 Patterns of Innovation Growth and Dissemination
To explore the trajectory of innovation growth and dissemination captured by forward patent
citations across each post patent grant year (defined as forward patent citation application year
minus core patent publication year), I first look at the number of core patents at risk and
number of core patent cited across all application years (Figure 5.6). The distributions are
relatively normal. The peaks center on the year the patents are published (post patent grant
year zero) and decline steadily over time. This is expected as by definition, all the patents
should be at risk at post patent grant year zero and most of the patents get cited in the year of
publication and within the subsequent one to two years. In other words, knowledge from core
life science innovations are disseminated and utilized most rapidly in the year they become
public and within the subsequent two years.
135

# o
f C
ore
Pat
ents
Figure 5.6: Number of Core Patents at Risk and Number of Core Patents Cited
# Core Patents at Risk and # Core Patents Cited
45004000
35003000
25002000
15001000
5000
-11-10-9 -8 -7 -6 -5 -4 -3 -2 -1 0 1 2 3 4 5 6 7 8 9 10 1112
Year Post (Core) Patent Grant
(Note: 0 is the year of Patent Grant)
# of Core Pat at Risk
# of Core Pat Cited (wReplacement)
To establish a fairer comparison among the year cohorts by isolating the application year
effect, I break down the cumulative trajectories of innovation growth and dissemination
(Figure 5.6) into core patent application year as depicted in Figures 5.7 and 5.8. The
distributions are relatively normal. In Figure 5.7, the peaks of citation again center on the year
the patents are published and decline rapidly over time. In general, there is growth in citations
from patent application year 1990 to 1995, peaking at 1995 followed by a slow decline from
1995 to 2004.217 In other words, the number of life sciences innovation off-springs has grown
from 1990 to 1995 followed by the gentle decline, and core innovations applied in 1995 have
been most widely disseminated and used compared to other years.
217 Again, we should be cautious about our interpretation of the decline after patent application year 2001 as not sufficient time may have been allowed to fully capture all observations.

136
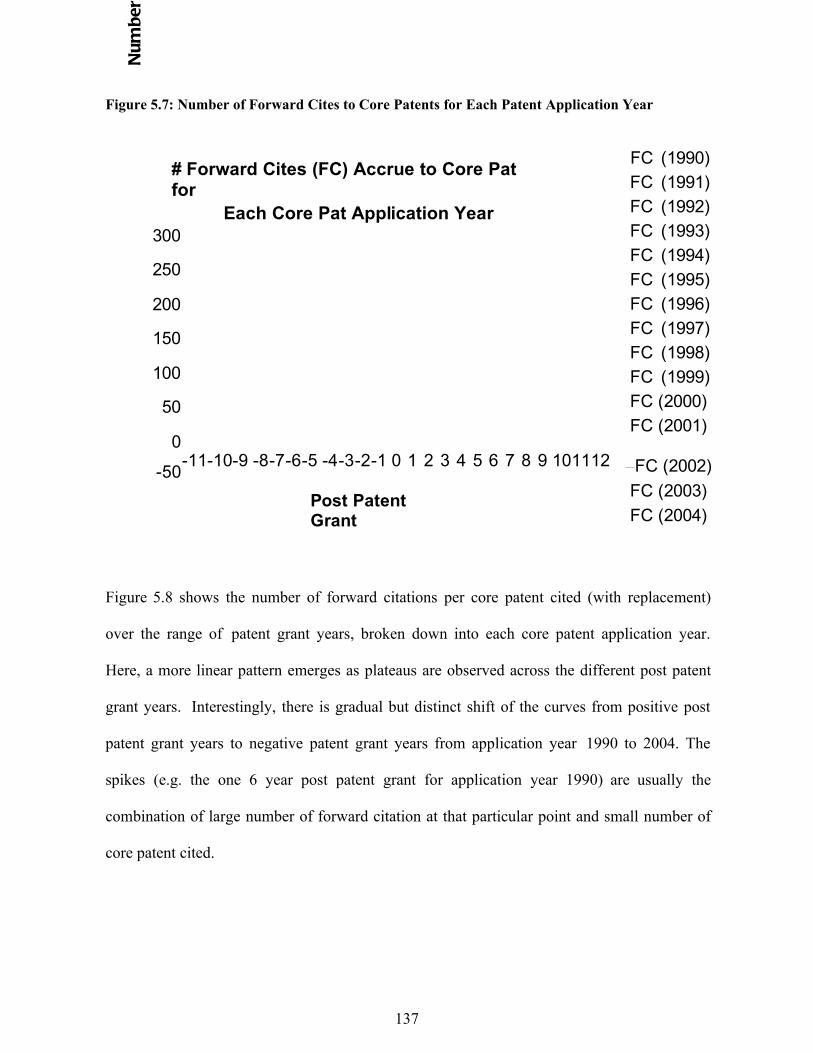
Num
ber
Figure 5.7: Number of Forward Cites to Core Patents for Each Patent Application Year
# Forward Cites (FC) Accrue to Core Pat for
Each Core Pat Application Year300
250
200
150
100
50
0
FC (1990)
FC (1991)
FC (1992)
FC (1993)
FC (1994)
FC (1995)
FC (1996)
FC (1997)
FC (1998)
FC (1999)
FC (2000)
FC (2001)
-50-11-10-9 -8-7-6-5 -4-3-2-1 0 1 2 3 4 5 6 7 8 9 101112 FC (2002)
Post Patent Grant
FC (2003)
FC (2004)
Figure 5.8 shows the number of forward citations per core patent cited (with replacement)
over the range of patent grant years, broken down into each core patent application year.
Here, a more linear pattern emerges as plateaus are observed across the different post patent
grant years. Interestingly, there is gradual but distinct shift of the curves from positive post
patent grant years to negative patent grant years from application year 1990 to 2004. The
spikes (e.g. the one 6 year post patent grant for application year 1990) are usually the
combination of large number of forward citation at that particular point and small number of
core patent cited.
137
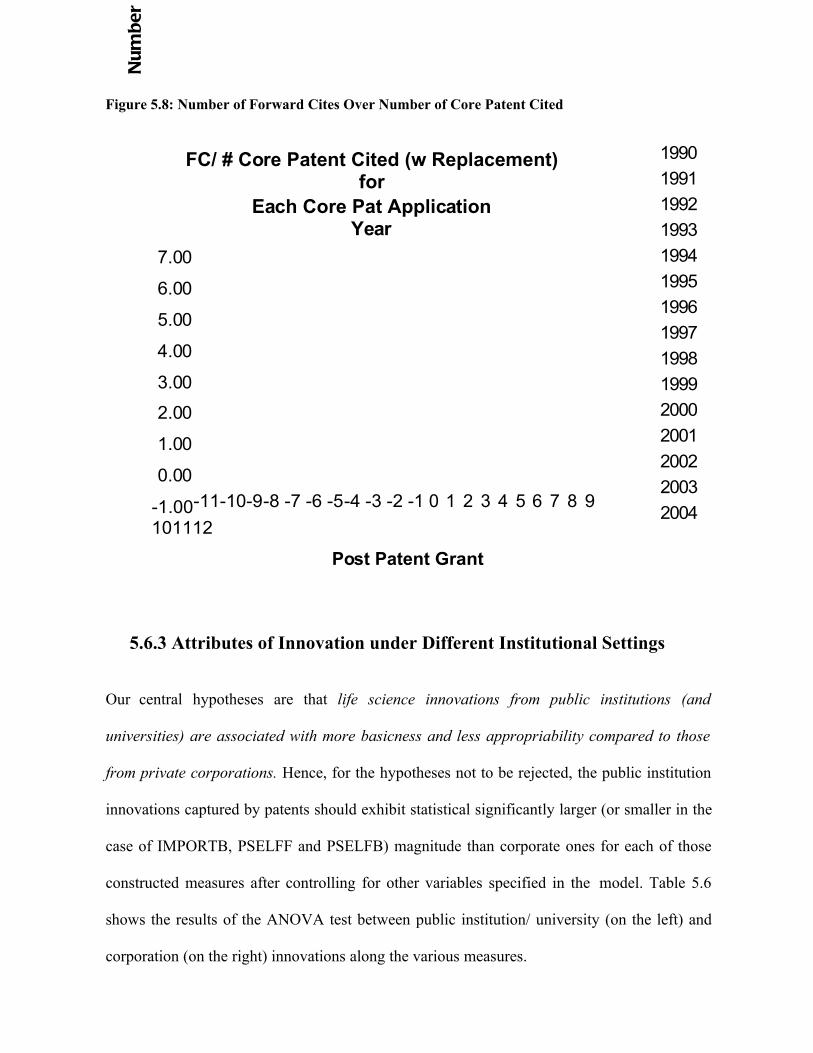
Nu
mbe
r
Figure 5.8: Number of Forward Cites Over Number of Core Patent Cited
FC/ # Core Patent Cited (w Replacement) for
Each Core Pat Application Year
7.00
6.00
5.00
4.00
3.00
2.00
1.00
0.00
-1.00-11-10-9-8 -7 -6 -5-4 -3 -2 -1 0 1 2 3 4 5 6 7 8 9
101112
Post Patent Grant
1990
1991
1992
1993
1994
1995
1996
1997
1998
1999
2000
2001
2002
2003
2004
5.6.3 Attributes of Innovation under Different Institutional Settings
Our central hypotheses are that life science innovations from public institutions (and
universities) are associated with more basicness and less appropriability compared to those
from private corporations. Hence, for the hypotheses not to be rejected, the public institution
innovations captured by patents should exhibit statistical significantly larger (or smaller in the
case of IMPORTB, PSELFF and PSELFB) magnitude than corporate ones for each of those
constructed measures after controlling for other variables specified in the model. Table 5.6
shows the results of the ANOVA test between public institution/ university (on the left) and
corporation (on the right) innovations along the various measures.

138

Table 5.6: Comparison of Means (ANOVA): Public Institutions/Universities (Left) vs.
Corporation (Right) 218
Basicness Measures:
Public Institutions/Universities CorporationsVariable | Obs Mean Obs Mean
-------------+-------------------------------------------------------- importf | 1495 3.052843 2775 2.161081**
general(f)| 699 .3815002 1074 .3672828**importb | 1495 106.9806 2775 105.2299
original(b)| 909 .3853879 1530 .4434419***ascience(b)| 1476 .9804193 2735 .9779012
Distance Measures:
Variable | Obs Mean Obs Mean-------------+-------------------------------------------------------- timef(days)| 699 1394.39 1074 1181.851 timeb(days)| 909 2050.55 1530 1981.408**
techf | 699 .4848127 1074 .493857*a techb | 909 .4706519 1530 .4773825
Appropriability Measures:
Variable | Obs Mean Obs Mean-------------+--------------------------------------------------------
pselff | 699 .190787 1074 .1806282**b pselfb | 909 .1725917 1530 .1323495***b
Note: *, **, ***: differences of the means statistically significant at 0.1, 0.05 and 0.01 level respectively.a: The difference is statistically significant but in the “wrong” direction i.e. corporation mean is larger than public institution/ university means.b: The difference is statistically significant but in the “wrong” direction i.e. corporation mean is smaller than public institution/ university means.
In terms of the basicness measures, IMPORTF supports H1a as first and second generation
forward citations are significantly higher for universities than corporations. GENERAL
supports H1b as the result indicates that the subsequent innovations derived from the core
innovations from the universities are distributed across significantly more technological areas
than corporations. IMPORTB does not support H1c. Although it shows that innovations
218 To get the p-value of the one tailed test of the independent variable, divide the p-value (two-tailed) fromANOVA by two.
139

from corporations stem from more innovations and are themselves more important
innovations, this difference is not statistically significant.
ORIGINAL does not support H1d. Although it is statistically significant it is in the
“wrong” direction. It shows that corporation innovations are derived and synthesized from a
larger number technological roots than the universities. ORIGINAL could be interpreted a
measure of originality as reflected by the synthesis of divergent ideas (Trajtenberg et al.,
1997) but in this case, I propose it could also reflect the increasingly interdisciplinary nature
of life science innovation and how well (or not) the universities and corporations are coping
with it. Technological innovations in the life sciences have increasingly involved the
integration of more disciplines such as computer science, mathematics, chemistry, chemical
engineering and mechanical engineering, just to name a few and that the corporations have
historically been much more problem-driven than universities and have long devised ways to
integrate different disciplines into project teams or functional groups rather than disciplinary
academic departments in universities. The long existence of the project organization in the
corporations (Allen, 2002) is an illuminating evidence. The university “system works very
well, primarily because until very recently universities have not been called upon to do very
much cross-disciplinary research.” (Allen, 2002). Allen further goes on to elegantly state
“cross-disciplinary work is the norm in industry. Products are seldom based upon single
disciplines or specialties. It normally requires a blending or integration of knowledge from
different specialties to develop even relatively simple products.” Though further vindication is
necessary, this is a likely explanation of the “reverse” sign observed in this study and by
Trajtenberg et al. (1997). SCIENCE does not support H1e as the difference is not
140

statistically significant. This could again reflect the unique aspect of life science innovation
which requires a heavy input of non-patent publications in both university and industry
settings.
TIMEF does not support H2a as the difference is not statistically significant. However,
average backward citation lag, TIMEB supports H2c as university innovations take longer
than those of corporations. This is a reflection of basicness as more basic innovations
presumably take longer to produce. In terms of technology distances, while TECHF is
marginally significant at the 10% level but in the wrong direction and therefore does not
supports H2b, TECHB does not support H2d as it is not significantly different. This
reflects the applied nature of life science and genomic innovations done even in universities
and public institutions compared to an average technology innovation. Again this evidence
strongly hints at the positioning of these innovations in the Pasteur’s quadrant (see Figure
2.1).
The underlying presumption for the appropriability measures is that more basic innovations
are more difficult to appropriate and therefore both PSELFF and PSELFB should be higher
for corporations. However, public institutions (and universities) show higher PSELFF and
PSELFB than corporations and both are statistically significant. Therefore, H3a and H3b are
not supported. This may again be a reflection of the unique nature of life science innovations
that more basic innovations are not more difficult to appropriate or a more plausible
explanation is that the public institution (and universities) innovations are not much more
basic than industry ones.
141

5.6.4 Technological Trajectories and “Production Function”
I venture one step beyond testing the differences to explore the potential existence of
technological trajectories and a “production function” in life science innovations. Table 5.7
below shows that the correlations across forward and backward measures are not strong as all
are below 0.3. Most of them are not statistically significant at the 5% level with the exception
of a few, the most notable being the positive correlation between the pairs GENERAL and
ORIGINAL, TECHF and TECHB, PSELFF and PSELFB and at the 7% significance level,
IMPORTF and IMPORTB. This suggests originality breeds generality, coming from more
remote technological roots produces off-springs that have further technology distance, more
appropriable predecessors result in more appropriable off-springs, and to a lesser degree,
importance breeds importance. These significant correlations between corresponding metrics
across the forward and backward measures constitute evidence for “technological trajectories”
consistent with the findings by Trajtenberg et al. (1997). These systematic linkages in life
science innovations between the forward and backward measures provide further evidence of
“technological trajectories” along which technology improvements occur, and display
coherence across the key dimensions of these innovations that take place along these
trajectories and persistence (Dosi, 1982; Dosi, 1988; Freeman, 1990).219
219 Dosi, C. (1982) "Technological Paradigms and Technological Trajectories: A Suggested Interpretation of the
Determinants and Directions of Technological Change." Research Policy, 11(5), pp. 147-62.Dosi, C. (1988) "Sources, Procedures, and Microeconomic Effects of Innovation." Journal of EconomicLiterature, 56(5), pp.1120- 1171.Freeman, C. (1990) "Schumpeter's Business Cycles Revisited", in Evolving Technology and Market Structure, Studies in Schumpeterian Economics, Heertje and Perlman (eds.), Ann Arbor: The University of Michigan Press.
142

Table 5.7: Correlations across F/B Measures
| importf general timef techf pselff-------------+----------------------------------------------
|importb | 0.0278 0.0394 0.0347 0.0111 0.0049
original(b)
|||
0.0689
0.0235
0.0969
0.1112
0.1443
0.0579
0.6414
0.0016
0.8372
0.0748
timeb(days)
|||
0.2453
0.0123
0.0004
0.0822
0.0681
0.0197
0.9586
-0.0012
0.0184
0.0094
techb
|||
0.5432
-0.0010
0.0095
-0.0002
0.5349
0.0101
0.9687
0.2597
0.7681
-0.0184
pselfb
|||
0.9614
-0.0144
0.9957
-0.0138
0.7515
-0.0312
0.0000
0.0567
0.5627
0.1185
science
|||
0.4759
-0.0203
0.6648
-0.0208
0.3258
0.0446
0.0738
-0.0122
0.0002
-0.0478| 0.1880 0.3833 0.0618 0.6110 0.0455
To further explore these potential linkages, the two forward measures of basicness, IMPORTF
and GENERAL, were regressed on the backward measures using ordinary least squares
regression (OLS), holding the technological fields and types of institutions constant. This
would serve to give a first estimate of some form of “production function”, if it exists, where
patented innovations serve as output and underlying research characteristics as input. For the
regression of IMPORTF on the backward measures, the evidence is weak and inconclusive as
all of the explanatory and control variables, except SCIENCE and application year (1.2%
level) and IMPORTB (5.3% level), are not statistically significant (Table 5.8). For the
regression of GENERAL, the evidence is again inconclusive, with the exception of the
variables, ORIGINAL, SCIENCE and application year (Table 5.9). Similar results were
obtained if I perform separate regression for each patent application year. This result partly
conforms with the correlation finding to suggest that more original research leads to
innovation of greater technological applicability. Continued investigation of such linkages in
life science innovations may be an interesting future study.
143

Table 5.8: Regression of IMPORTF on B/Variables (Controlling for Characteristics of Research,
Technological Fields and Application Year)
Source | SS df MS Number of obs = 2439-------------+------------------------------ F( 10, 2428) = 24.98
Model | 27551.2325 10 2755.12325 Prob > F = 0.0000Residual | 267784.363 2428 110.2901 R-squared = 0.0933
-------------+------------------------------ Adj R-squared = 0.0896Total | 295335.596 2438 121.138472 Root MSE = 10.502
------------------------------------------------------------------------------ importf | Coef. Std. Err. t P>|t| [95% Conf. Interval]
-------------+---------------------------------------------------------------- importb | .0008796 .0004543 1.94 0.053 -.0000112 .0017704 original | .5677436 .668723 0.85 0.396 -.743583 1.87907 timeb(days) | .0002549 .0001848 1.380.168 -.0001074 .0006172
techb | .2629846 .6529932 0.40 0.687 -1.017497 1.543466 science | -3.896916 1.553182 -2.51 0.012 -6.942614 -.8512175
chem | 3.117151 10.52355 0.30 0.767 -17.51892 23.75323 drugs_medi~l | 3.655549 10.52477 0.35 0.728 -16.9829 24.294 public_only | -.9698782 1.034217 -0.94 0.348 -2.997918 1.058162 private_only | -.2398892 1.003801 -0.24 0.811 -2.208283 1.728505 applicatn_yr | -1.362425 .0879082 -15.50 0.000 -1.534808 -1.190042
cons | 2723.757 175.7468 15.50 0.000 2379.128 3068.387------------------------------------------------------------------------------
Table 5.9: Regression of GENERAL on B/Variables (Controlling for Characteristics of
Research, Technological Fields and Application Year)
Source | SS df MS Number of obs = 994-------------+------------------------------ F( 10, 983) = 20.45
Model | 19.8657214 10 1.98657214 Prob > F = 0.0000Residual | 95.4834655 983 .097134756 R-squared = 0.1722
-------------+------------------------------ Adj R-squared = 0.1638Total | 115.349187 993 .116162323 Root MSE = .31166
------------------------------------------------------------------------------ general | Coef. Std. Err. t P>|t| [95% Conf. Interval]
-------------+----------------------------------------------------------------importb | -8.90e-07 .0000257 -0.03 0.972 -.0000513 .0000496
original | .095374 .0314699 3.03 0.003 .033618 .1571299 timeb(days) | .0000154 8.81e-06 1.75 0.080 -1.84e-06 .0000327
techb | -.0127838 .0299453 -0.43 0.670 -.0715478 .0459802 science | -.1739112 .0754461 -2.31 0.021 -.3219652 -.0258573
chem | .0343818 .3132438 0.11 0.913 -.5803216 .6490852 drugs_medical| .0514584 .3130888 0.16 0.869 -.5629409 .6658577 public_only | -.0473436 .0450075 -1.05 0.293 -.1356654 .0409783 private_only | -.0279605 .044027 -0.64 0.526 -.1143583 .0584372 applicant_yr | -.0631731 .0047105 -13.41 0.000 -.0724168 -.0539294
cons | 126.5593 9.408999 13.45 0.000 108.0952 145.0233------------------------------------------------------------------------------
144

5.7 Conclusion
In this Chapter, I use the entire 4270 genomic patent data set to systematically quantify and
analyze the important attributes of life science innovations. I have characterized the important
dimensions of innovations associated with different institutional settings and compared them
to the innovations across broad technology fields in previous studies (Trajtenberg et al., 1997;
Hall et al., 2001). After constructing the set of validated measures, I find evidence of growing
convergence of public and industry innovations in terms of “basicness” and appropriability as
life science innovations from public institutions (and universities) are not associated with
more “basicness” for IMPORTB, ORIGINAL, SCIENCE, TIMEF, TECHF and TECHB
measures but with more appropriability (PSELFF and PSELFB) compared to those from
private corporations. These findings differ from previous study on innovations across broad
technology fields (Trajtenberg et al., 1997). These depictions are particularly interesting in the
life sciences and are characteristic of the innovations in the Pasteur’s quadrant (Stokes, 1997).
In addition, I find evidence of “technological trajectories” through the systematic linkages in
life science innovations between the forward and backward measures: originality breeds
generality, coming from more remote technological roots produces off-springs that have
further technology distance, more appropriable predecessors lead to more appropriable off-
springs, and to a lesser degree, importance breeds importance, as well as coherence and
persistence across the various dimensions of these innovations.
145

CHAPTER 6:
IMPACT OF PATENTING IN THE LIFE SCIENCES
This Chapter turns our attention to the temporal trend of the impact of patenting on
knowledge diffusion and utilization for gene-based publications. This is complementary to the
micro-level study discussed in Chapter 4 which focused on the impact of institutional
patenting policy more broadly on knowledge dissemination.
This study is based on the use of a large data set of patent-paper pairs220 that center
specifically on the gene patents described in Chapter 5. I construct a novel data set of 1279
unique patent-paper pairs, which is much larger than previous study that used less than 200
(Murray and Stern, 2005). For the first time in the life science patenting debate, it provides
conclusive evidence of the anti-commons effect in patenting. In addition to the publication
characteristics, the model also takes into account of a myriad IP related characteristics
previously unexamined. To the my knowledge, it is the first study of its kind to directly test
the “patent thicket” conceptualization (for a related example outside the life sciences, see
Ziedonis, 2004)221 and to ascertain whether patenting of disease genes causes a more (or less)
severe depression in knowledge dissemination and use than say genes of unknown functions.
This study hopes to serve as a catalyst for informing intellectual property policies that focus
on the relationship between knowledge traditionally generated in academia and academic
patents.
220 Recall from Chapter 2 that a “patent-paper pair” refers to scientific knowledge receiving formal IP often also appears in the form of scientific research article. Such pair represents instance in which an experimental result or scientific discovery manifests in two observables – a patent and a publication. It follows that one form closely captures the concepts and contents contained in the other and vice versa.221 Ziedonis, R.H. (2004) “Don’t Fence Me In: Fragmented Markets for Technology and the Patent AcquisitionStrategies of Firms,” Management Science, 50(6): 804-820.
146
I find genomic patents impede knowledge dissemination and use and cause a decline in
forward citation of their corresponding paired papers once they have been granted and
become visible to the public, as predicted by the anti-commons effect. I also find patenting
hinders knowledge diffusion and use to a greater degree on private sector authored
publications than on public sector authored publications, and for U.S. authored publications
than non-U.S. authored publications, and that patenting by private corporations has a greater
negative impact than patenting by public institutions. This study, for the first time, has
conclusively determined the adverse effect of “patent thickets” and patenting of disease and
cancer genes.
The next section outlines the empirical test strategy for the “anti-commons” effect. Section
6.2 develops the hypotheses while Section 6.3 specifies the statistical models. Section 6.4
describes the patent-paper pair data set collection and validation. Section 6.5 presents
statistical analyses and findings followed by a discussion in Section 6.6. Section 6.7
concludes the study.
6.1 Empirical Test Strategy for the “Anti-Commons” Effect
The empirical “anti-commons” test would leverage on three key characteristics of “open
science”, IP protection and diffusion of scientific knowledge:
i) Scientific knowledge receiving formal IP often appears in the form of “matching”
scientific research articles.
147

ii) A substantial lag between initial knowledge disclosure through paper publication and
patent grant – while publication in scientific literature often takes place within about
six months after initial journal submission, there is a delay of two to five years (3.2
years in our data set) between the initial application and receipt of a patent, often
resulting in a two to four year time lag between the paper-patent pair. The knowledge
therefore disseminates through two distinct intellectual periods – before and after the
grant of formal IPR protections. Note that patent rights actually only start when a
patent is granted. Before that, researchers attempting to build upon knowledge
published previously in scientific literature are unobstructed and often unaware of
pending patent publications.
iii) The institutional norm that research which builds on journal articles results in citations
and citations are good estimator of knowledge dissemination and intellectual influence
(Cole, 2000, p.293).222 Prominent sociologist of science, Robert Merton (1988, p.620)
argued that citations were part of the formal “intellectual property” regime governing
scientists’ behaviors, particularly “in science, one’s private property is established by
giving its substance away… only when scientists have published their work… does it
become legitimately established or more or less securely theirs.” He further asserted
that citations are part of the “intellectual property system of science”, providing “the
peer recognition required for the effective working of science as a social activity”
222 Cole, Jonathan (2000). "A Short History of the use of Citations as a Measure of the Impact of Scientific and Scholarly Work." The Web of Knowledge : A Festschrift in Honor of Eugene Garfield. Ed. Eugene Garfield, Blaise Cronin, and Helen Barsky Atkins. Medford, N.J.: Information Today, 281-300.
148

(p.621).223 Elsewhere, Zuckerman and Merton (1971) discussed the roles of the peer
review and refereeing process in enforcing the norm that scientists must cite the
articles on which they build.224
Taken together, if the granting of IPR such as patents (in this case, gene patents) restricts the
dissemination and the ability of researchers to build upon a particular piece of knowledge, the
forward citation rate to the scientific publication disclosing that knowledge would decrease
after formal IP right over that knowledge is granted. Stated differently, this “anti-commons”
test measures how the citation rate for a scientific publication alters before and after patent
grant, taking into consideration the fixed differences in citation rate across articles and
differences in patterns of citation rates for articles with similar characteristics.
6.2 Hypotheses
Based on the “anti-commons” argument, anecdotal evidences and other empirical studies of
the anti-commons effect by previous work described in the literature review in Chapter 2.2, I
hypothesize:
H1: Gene patents impede knowledge dissemination and use and cause a decrease in
forward citation of their paired publications once granted and become “visible” to
the public, as predicted by the anti-commons effect.
223 Merton, Robert K. (1988). "The Matthew Effect in Science, II: Cumulative Advantage and the Symbolism ofIntellectual Property." Isis 79.4: 606-623.224 Zuckerman, Harriet, and Robert K. Merton (1971). "Patterns of Evaluation in Science: Institutionalization, Structure, and Functions of the Referee System." Minerva, 9: 66-100.
149

Much debate presented in Chapter 2 has hinged on the critical roles played by institutional
affiliations and locations of the authors of the publication on the dissemination and utilization
of knowledge, as well as the nature of IP ownership. The second set of three hypotheses (H2a,
H2b and H2c) are developed to ascertain the impact of the relationship and interaction
between patent grant and private versus public author affiliation, U.S. versus non-U.S. author
location, and public versus private ownership of patent rights on knowledge diffusion and use.
Private authors are affiliated with for-profit corporations which often pay particular attention
to patent acquisition and enforcement (Ziedonis, 2004). Private sector author publications
tend to be associated with corporations which have greater reputation for patent enforcement
and litigation, compared to public research institutions. Thus, I hypothesize:
H2a: Patenting will hinder scientific knowledge dissemination and use to a greater
degree on private sector authored publications than on public sector authored
publications, ceteris paribus.
By the same token, U.S. based authors may be associated with greater awareness and stricter
enforcement of IP rights compared to authors based in foreign countries as U.S. based
institutions are often perceived to place a high emphasis on IP and are active in litigation for
patent infringements especially in pharmaceuticals and the life sciences. Thus, I hypothesize:
150

H2b: Patenting will hinder scientific knowledge dissemination and use to a greater
degree for U.S. authored publications than non-U.S. authored publications, ceteris
paribus.
Based on the same reasoning for H2a, I hypothesize:
H2c: Patenting by private corporations will hinder scientific knowledge dissemination
and use to a greater degree than patenting by public institutions, ceteris paribus.
Policymakers, academic leaders such as Eric Lander and Craig Venter (2002)225 and
innovation and legal scholars (Heller and Eisenberg, 1998; Merz, 1999; Henry et al., 2002;
Cho et al., 2003) have long cited anecdotal evidence of “patent thickets” especially in terms of
their adverse effect on hindering clinical testing, medicine and practice, as well as
downstream biomedical and genomic disease research, use and innovations (see Section 2.2).
H3, H4a and H4b are developed based on these observations:
H3: Paired publication associated with genes claimed in more patents will experience
more severely stifled knowledge dissemination post patent grant than publication
associated with genes claimed in less patents, ceteris paribus.
225 Forbes Magazine (2002) “Genome Scientists: Gene Patents Are Bad.” An interview of Craig Venter and EricLander by Matthew Herper, June, 26.
151

H4a: Patenting of OMIM disease genes will hinder scientific knowledge dissemination
and use to a greater degree than patenting of non-OMIM disease genes, ceteris
paribus.
H4b: Patenting of cancer genes will hinder scientific knowledge dissemination and use to
a greater degree than patenting of non-cancer genes, ceteris paribus.
6.3 Model Specifications
The empirical statistical analyses focus on the differential impact of post patent grant and
various interaction effects with patent and publication characteristics on forward citation of
matched publication as a proxy for scientific knowledge diffusion and use.
Since yearly citation rate of scientific publications, which is heavily right-skewed, serves as a
good estimator for knowledge dissemination, accumulation and utilization, the count model –
the negative binomial regression model (NBRM) (Hausman et al., 1984) could be employed
to accommodate such underlying probability distribution (also described in Section 4.4.2).
The model is modified to incorporate a different (differences-in-differences) estimator from
the earlier work by Murray and Stern (2005) with new explanatory variables and model
specifications.
Depending on the various model specifications, the key dependent (response) variable is the
annual forward citation of each matched publication, which is highly right-skewed and typical
152

Freq
uen
cy
of citation counts as shown in Figure 6.1. The independent (explanatory) variables include
“window” (year of patent grant/hit which coincides with the year of forward citations receipt)
and post patent grant (year of forward citations is greater than patent grant year); publication
characteristics (journal impact factor, number of collaborating centers, publication year);
author characteristics (number of authors, public or private institution affiliations, location –
US or not), controlling for citation age (year in which forward citation is received minus
paper publication year), FC year (year in which forward citations are received) and article (to
hold the unobserved heterogeneity of each publication constant) in full regression models not
specifying other publication characteristics.
Figure 6.1: Distribution of Annual Forward Citations
Distribution of Annual Forward Citations
14000
12000
10000
8000
6000
4000
2000
0
1 16 31 46 61 76 91 106 121 136 151 166 181 196 211
N umber of C itations
153

Taken together, the empirical test for the hypothesis, the fixed-effect negative binomial
regression model, with robust standard error estimate, is therefore:
FCi = f (εi; αWINDOWi,t + βPOST_PAT_GRANTi,t + µJOURNAL_IFi +
φCENTER_COUNTi + δPUB_YEARi + ηAUTHOR_CHARACTERISTICSi
+ χCITATION_AGE Fixed Effectsi + ψFC_YEAR Fixed Effectsi)
,where WINDOW is a nominal variable that equals 1 if year of patent grant/hit coincides with
the year of forward citations receipt and 0 otherwise; POST_PAT_GRANT is a nominal
variable that equals 1 if year of forward citations is greater than patent grant year and 0
otherwise; JOURNAL_IF is a continuous variable that measures the impact factor of the
journal; CENTER_COUNT controls for the number of collaborating centers/institutions;
PUB_YEAR controls for the publication “vintage” or year of paper publication;
AUTHOR_CHARACTERISTICS include such variables as the number of authors and their
institutional affiliations and locations; CITATION_AGE controls for the citation age or the
age of the forward citation with reference to the paper publication year; and FC_YEAR
controls for the forward citation receipt years.
Additional models may include specifications such as PAT_THICKET_INTERACTN, the
interaction with post patent grant of patents claiming genes that are covered by multiple other
patents; PAT_DISEASE_INTERACTN or patented OMIM disease gene entries and patented
cancer genes interactions with post patent grant, with the same fixed effects as the full model
154

such as ARTICLE (in models not specifying other publication characteristics),
CITATION_AGE and FC_YEAR.
For example, the full model with interaction effects could have the following specification:
FCi = f (εi; αWINDOWi,t + βPOST_PAT_GRANTi,t +
λPAT_THICKET_INTERACTNi + τPAT_DISEASE_INTERACTNi +
ςARTICLE Fixed Effectsi + χCITATION_AGE Fixed Effectsi +
ψFC_YEAR Fixed Effectsi)
6.4 Patent-Paper Pair Data Set and Sample Validation
The patent-paper pair data set used to test the hypotheses builds on the patent data set
described in Section 5.4. To ensure a high level of closeness and accuracy of the pairs, I
started the pairing using a conservative matching condition whereby all inventors (mean of 3)
in a given patent appear as authors in the corresponding paired publication. Based on this
criterion, I used an author search in ISI Web of Science (WOS), the primary source of
publication information and obtained potential publication pair matching sets for 2093 patents
out of the population of 4270 gene patents (close to 50%). Each of these 2093 potential
matching sets was then meticulously examined based on their abstracts and contents, dates of
publication in relation to patent application and grant dates, author names and sequence of
appearance to establish the closest fit to identify the pairs, with contents being the primary
consideration.
155

To guard against selection bias, the various attributes of the 2093 patents with potential
matching sets were compared with the entire population of 4270 patents. Their summary
statistics presented in Tables 6.1 and 6.2 respectively showed that all the corresponding
parameters and variables of the 2093 patents have very similar means and standard deviations
to their counterparts in the population of 4270 patents, with the population means falling well
within one standard deviation of their respective sample means. These demonstrated similar
underlying statistical distributions. In addition, comparisons of means tests are performed on
each key variable to establish if any of the attributes in the sample differ significantly from
their counterparts in the population. The variables under comparison include patent
application year; number of inventors; total number of assignees; patent grant delay; number
of US patent referenced (NCITED); number of forward references (NCITING); number of
non-patent references (i.e. journal articles and reports/ NPCITES); number of national classes;
national class; various computed patent characteristics described in Chapter 5 – GENERAL;
ORIGINAL; IMPORTF; IMPORTB; SCIENCE; TECHF; TECHB; TIMEF; TIMEB;
PSELFF; PSELFB. All except number of inventors (p=0.00), TIMEF (p=0.016) and TIMEB
(p=0.049) are not statistically different from their population counterparts at the 5%
significance level. If I calculate TIMEF and TIMEB in terms of years instead of days, this
difference goes away. By the same reasoning, when comparing the 2093 patents with the set
of 2177 patents without potential publication pair matching, only the number of inventors,
number of non-patent cited and number of national class are statistically different. Taken
together, this shows minimal or no selection bias present in the selected sample.226 I further
226 I further compared the means between the same variables for the sample of 1498 versus the population of4270 patents. As expected, three additional variables, number of national class, number of forward references and number of non-patent cited become significantly different. This is still a fairly good result after applying the
156

control for these important variables in the various regression models to be presented in
Section 6.5.
After careful examination, no paper pairs could be found for 595 of the 2093 patents while the
remaining 1498 patents have matching paper pairs. For three paired publications, no detailed
information was available from WOS and so these were eliminated, leaving 1495 pairs. As a
final precaution to ensure no duplication of impact of multiple patents “hitting” on a single
publication, later granted patents matched to the same publication are removed, leaving 1279
unique patent-paper pair observations in the data set.
Table 6.1: Sample of Patents with Potential Matching Paper Set (2093 Observations)
Variable | Obs Mean Std. Dev. Min Max-------------+--------------------------------------------------------pat_apply_yr | 2093 1997 2.46929 1990 2003no_inventors | 2093 2.4 1.363445 1 14no_assignees | 2093 1.10989 .3740669 1 4pat_grt_delay| 2093 3.2 1.498453 0 11no_us_pat_ref| 2093 3.267559 13.7287 0 244-------------+--------------------------------------------------------no_forwrd_ref| 2093 1.67463 3.674587 0 44non_pat_cited| 2093 487.5327 631.162 0 6623no_nat_class | 2093 6.232203 2.976417 1 25nationalclass| 2093 463.172 48.73144 324 800-------------+--------------------------------------------------------
science | 2075 .9810275 .0977462 0 1original | 1218 .4045467 .3528435 0 .98492importb | 2093 100.8462 435.7733 0 6542
timeb (days) | 1218 1920.45 1227.661 -607 8132.5-------------+--------------------------------------------------------
techb | 1218 .4800443 .3902578 0 1pselfb | 1218 .14078 .2971531 0 1general | 907 .3865157 .3409648 0 .93698importf | 2093 2.623029 9.180852 0 223
-------------+--------------------------------------------------------timef (days) | 907 1331.318 665.5053 -616 3633
techf | 907 .4946682 .3752627 0 1pselff | 907 .1820216 .3280271 0 1
strictest criteria on a smaller sample which still remains representative of the population in the sense that most of the corresponding variables are not significantly different.
157

Table 6.2: Population of Patent Data Set (4270 Observations)
Variable | Obs Mean Std. Dev. Min Max-------------+--------------------------------------------------------pat_apply_yr | 4270 1997 2.450467 1990 2004no_inventors | 4270 3.3 2.013767 1 24no_assignees | 4270 1.131382 .4847873 1 13pat_grt_delay| 4270 3.0 1.45035 0 11-------------+--------------------------------------------------------no_us_pat_ref| 4270 3.069789 10.87682 0 244no_forwrd_ref| 4270 1.569321 3.864142 0 81non_pat_cited| 4270 457.6548 608.2833 0 7819no_nat_class | 4270 6.348712 3.018556 1 30nationalclass| 4270 461.737 48.4578 324 935-------------+--------------------------------------------------------
science | 4211 .9787838 .1077266 0 1original | 2439 .4218056 .3530429 0 .98492importb | 4270 105.8429 409.2729 0 6542
-------------+--------------------------------------------------------timeb (days) | 2439 2007.177 1267.511 -1628 9032.07
techb | 2439 .474874 .3819819 0 1pselfb | 2439 .1473475 .3008039 0 1general | 1773 .372888 .3387171 0 .94579importf | 4270 2.473302 9.693342 0 228
-------------+--------------------------------------------------------timef (days) | 1773 1265.644 668.986 -1505 3976.33
techf | 1773 .4902913 .3773699 0 1pselff | 1773 .1846333 .3367957 0 1
The paired publications, like the patents, are fairly uniform in the sense that almost all of them
describe genotypes: genes, gene sequences, expressions and phenotypes: functions and
genetic mechanisms and diseases. The publications are homogeneous in nature and the
general publication quality is high. Table 6.3 below shows the list of the top ten journals in
which these paired publications most frequently appear, ranked by frequency of appearance.
158

Table 6.3: List of Top Ten Most Frequently Appearing Journals
Journal Name Frequency of Appearance Percentage (%)
Journal of Biological Chemistry 202 15.78
The Proceedings of the National
Academy of Sciences USA
137 10.70
Genomics 61 4.77
Science 47 3.67
Nature 46 3.59
Cell 34 2.66
Nature Genetics 34 2.66
Cancer Research 31 2.42
Biochemical and Biophysical
Research Communications
28 2.19
Molecular and Cellular Biology 27 2.11
Table 6.4 below summarizes the descriptive statistics of publication and citation-year
characteristics, patent and patent-gene characteristics and additional patent attributes. The
publication data, primarily obtained from ISI WOS complemented by NCBI PubMed, include
such fields as ISI number; title; author names; year published; information on forward
citation; assignee address; document type; journal source. Additional fields that are collected,
computed and coded include author addresses (us_author_al1); public or private author
(public_autal1, privat_autal1); author count (no_of_author); journal name; journal impact
factor 2005 (impact_factor); and center count (center_count). Based on these, I constructed
the citation-year characteristics such as forward citation by year (fc); total number of forward
citations (total_no_fc); year in which forward citations are received (fcyear); and year of
forward citations receipt minus paper publication year (citation_age). In addition to the
patent fields described in Section 5.6, a set of important patent characteristics are constructed:
159

post-patent grant (pat_inforce), year of patent grant which coincides with the year of forward
citations receipt (window), patent lag or forward citation year minus patent grant year
(pat_lag), patent grant year (pat_grant_yr), patent application year (pat_apply_yr), number
of inventors (no_inventors), number of assignees or institutions (no_assignees), number of
private assignees, i.e. corporations and companies (no_private), number of public assignees,
i.e. universities, non-profit or government research institutions (no_public), assignee
locations, i.e. based in U.S. or not (us_assign_al1), number of forward (no_forwrd_ref) and
backward references (no_us_pat_ref).
To disentangle the impact of patenting on specific types of genes, especially disease and
cancer genes, a suite of patent-gene characteristics was obtained: the number of genes legally
claimed (numclaimedgen); if the patent claims a gene that has been patented 1 to 5 times
(pat_1to5) or 6 to 10 times (pat_6to10) using information on the number of times a gene has
been patented; if there is at least one OMIM listed gene expressing phenotypes covered by
this patent (al1_omimentry);227
number of OMIM entries per patent captured by unique
OMIM numbers to represent the intensity of relation to disease of patented genes
(omim_ent_apat); most number of other patents that "cross-covered" any "disease” gene (or
OMIM entries) that is claimed by each core patent (most_pat_omim); at least one cancer
gene covered by this patent (al1_cancergen);228 if the cancer gene covered by this patent is
227 Online Mendelian Inheritance in Man, OMIM (TM). McKusick-Nathans Institute for Genetic Medicine, Johns Hopkins University (Baltimore, MD) and National Center for Biotechnology Information, National Library of Medicine (Bethesda, MD), July 2006. http://www.ncbi.nlm.nih.gov/omim/228 First published in Futreal, P.A. et al. (2004) “A Census of Human Cancer Genes.” Nature Reviews Cancer, 4,177-183 (2004) which summarizes more than two decades of searching. The Cancer Gene Census is updated onWellcome Trust Sanger Institute: http://www.sanger.ac.uk/genetics/CGP/Census/
160

pat_1to5 |1279.9069586
.29060410
1pat_6to10 |
1279.0875684
.28277680
1pat_11to15 |1279.0101642
.10034320
1pat_16to20 |1279.0078186.088111
01
al1_omimentry|1279.2486317
.43238890
1omim_ent_apat|
1279.6716185
6.4042290
201most_pat_omim|
1279.8154808
2.0806230
20omim_othr_pat|
1279.1774824
.38222590
1al1_cancergen|
1279.0758405
.26484630
1oncogen_apat |
1279.129007
1.3605540
45onco_otherpat|
1279.0555121
.22906670
1
also covered in other patent (onco_otherpat); the most number of patents that "cross-
covered" any cancer gene that is covered by each core patent (oncogen_apat).
Table 6.4: Summary Statistics of Publications and Patents in Data Set
n = 1279 unique patent-paper pairs
CITATION-YEAR CHARACTERISTICS
Variable | Obs Mean Std. Dev. Min Max-------------+-----------------------------------------------------
fc | 12830 14.17319 25.98571 0 316 total_no_fc | 12830 157.9051 263.0284 1 2405
fcyear | 12830 2001.1 3.479408 1988 2006 citationage | 12830 4.900312 3.479408 0 18
PUBLICATION CHARACTERISTICS
Variable | Obs Mean Std. Dev. Min Max-------------+-----------------------------------------------------unique_pp_id | 1279 640 369.3598 1 1279cited_pmid | 1279 9058109 2209852 1281201 1.61e+07
paper_pubyear| 1279 1996.969 2.779135 1988 2005center_count | 1279 2.716966 1.998736 1 16no_of_author | 1279 7.279124 4.569011 1 63us_author_al1| 1279 .7959343 .4031749 0 1public_autal1| 1279 .8420641 .3648235 0 1privat_autal1| 1279 .3479281 .4764994 0 1impact_factor| 1279 9.747669 8.594953 0 33.456
PATENT CHARACTERISTICS
Variable | Obs Mean Std. Dev. Min Max-------------+-----------------------------------------------------pat_inforce | 12830 .5763835 .4941504 0 1
window | 12830 .0980514 .2973958 0 1pat_lag | 12830 1.424552 3.768337 -16 13
pat_grant_yr | 1279 2000.213 2.66346 1993 2005pat_apply_yr | 1279 1996.916 2.571672 1990 2003no_inventors | 1279 2.555903 1.401919 1 14no_assignees | 1279 1.132916 .4181001 1 4no_private | 1279 .5003909 .5892555 0 4no_public | 1279 .6325254 .587618 0 4
only_aca_asgn| 1279 .5379203 .498755 0 1only_ind_asgn| 1279 .4151681 .4929437 0 1ind_aca_asgn | 1279 .0469116 .2115323 0 1us_assign_al1| 1279 .7873339 .4093535 0 1no_forwrd_ref| 1279 1.889758 3.887045 0 39no_us_pat_ref| 1279 3.047694 13.42865 0 244
161

pat_1to5 |1279.9069586
.29060410
1pat_6to10 |
1279.0875684
.28277680
1pat_11to15 |1279.0101642
.10034320
1pat_16to20 |1279.0078186.088111
01
al1_omimentry|1279.2486317
.43238890
1omim_ent_apat|
1279.6716185
6.4042290
201most_pat_omim|
1279.8154808
2.0806230
20omim_othr_pat|
1279.1774824
.38222590
1al1_cancergen|
1279.0758405
.26484630
1oncogen_apat |
1279.129007
1.3605540
45onco_otherpat|
1279.0555121
.22906670
1
PATENT-GENE CHARACTERISTICS
Variable | Obs Mean Std. Dev. Min Max-------------+----------------------------------------------------- numclaimedgen| 1279 3.023456 35.53256 1 1124
ADDITIONAL PATENT ATTRIBUTES
Variable | Obs Mean Std. Dev. Min Max-------------+-----------------------------------------------------
importf | 1279 3.080532 10.48953 0 223general | 592 .4113861 .338538 0 .93698importb | 1279 99.43471 432.5352 0 6542original | 715 .398601 .3527141 0 .98492science | 1265 .9832195 .0913727 0 1techf | 592 .4839542 .3717689 0 1
timef days | 592 1406.442 671.723 -616 3633pselff | 592 .1730757 .3175259 0 1techb | 715 .4785024 .3905413 0 1
timeb days | 715 1987.284 1250.02 -607 8132.5pselfb | 715 .1262158 .2823103 0 1
DEFINITIONS:
citationage = year in which forward citations are received - paper publication year paper_pubyear = year in which paper is publishedfcyear = year in which forward citations are received pat_lag = fcyear - pat_grant_yearpat_inforce = 1 if pat_lag >= 0window = year of patent grant/hit which coincides with the year of forward citations receipt(i.e. pat_grant_year = fcyear)
162

6.5 Statistical Analyses and Results
6.5.1 The Impact of Patenting
The empirical analysis proceeds in several stages to test the four sets of important hypotheses
(H1; H2a, H2b, H2c; H3; H4a, H4b). It first focuses on the main effects of post patent grant
on annual forward citation through the various model specifications to test H1 before turning
to compare the Institutional and National Affiliations of paper authors and patent assignees to
test H2a, H2b and H2c. Lastly, to test H3, H4a and H4b, it examines the differential impact of
patents claiming varying numbers of genes and interactions with OMIM listed disease genes
and cancer genes IPR from the Cancer Gene Census.
To test for H1, I start with the ordinary least squares regression model 6.5-0 shown in Table
6.5. The dependent variable is the natural log of forward citations + 1 and the key explanatory
variables are patent grant WINDOW and POST PATENT GRANT. Although the OLS model
(R2 = 0.834) does not consider the nature of citation as right-skewed count data, it includes the
full set of the article fixed effects, citation age fixed effects and forward citation year fixed
effects and suggests a statistically significant 9.5% decline (p = 0.000) in the forward citation
rate after patent grant. The other three models revert to negative binomial regression. Model
6.5-1 is the baseline model controlling for the number of authors, journal impact factor and
publication year while including the citation age and forward citation year fixed effects.
Model 6.5-2 includes additional variables (compared with Model 6.5-1) to control for location
of authors (US or not), author affiliation (public or not) and number of centers (or
institutions). Finally, the full model 6.5-3 is the most constrained and takes into account of the
article fixed effects, in addition to the citation age and forward citation year fixed effects
163

included in the previous models. The coefficients of the NBRMs are reported as incidence
rate ratios (IRR) (see a discussion of IRR in Section 4.6).
The results across all three NBRMs are consistent and robust. Patent grant impedes
knowledge dissemination and use and causes a statistically significant (p = 0.000) decrease of
18%, 17% and 5% in the forward citation rate of Models 6.5-1, 6.5-2 and 6.5-3 respectively,
all else equal, as predicted by the anti-commons effect. H1 is therefore supported. It is
interesting to note from Model 6.5-2 that a unit increase in the number of authors produces a
marginal increase as expected by a factor of 1.03 in the FC. The presence of at least one
author from the United States reduces FC by 6.2%. Surprisingly, the presence of public author
also reduces FC by 6.1%. I will further explore this notion of institutional affiliations in the
models presented in Table 6.6. As expected, a unit increase in the number of collaborating
centers marginally increases the FC by a factor of 1.03 while a higher the journal impact
factor which is a proxy for journal quality (and sometimes prestige) also increases the FC by
8%. An increase in the publication year decreases the FC (in Models 6.5-1 and 6.5-2) as we
expect the longer the publication has been out, the more citation it should receive.
164

Table 6.5: Impact of Post Patent Grant 229
[6.5-0] OLS (I):DV = ln(FC+1)
NBRM: DV = FCCoefficients reported as incidence rate ratios, IRR
[6.5-1]Baseline
[6.5-2] Marginal Effects
[6.5-3]Full
Independent Variables
Post Patent Grant EffectsPatent Grant Window(window)
[-.0197] (N) (.018)
.925 (3) (.043)
.930 (N) (.043)
.986 (N) (.016)
Post Patent Grant(pat_inforce)
[-.0946] (.021)
.821 (.037)
.827 (.037)
.954 (2) (.018)
Control VariablesAuthor Count 1.04
(.0026)1.03 (.0033)
US Author(Location)
.938 (3) (.033)
Public Author(Institution Affiliation)
.939 (2) (.029)
Center Count 1.03 (.0082)
Journal IF 2005 (Journal Quality)
1.08 (.0012)
1.08 (.0012)
Publication Year .913 (.0040)
.917 (.0044)
Parametric RestrictionsArticle FE # Restrict 1277
F 68.38p-value 0.000
# Restrict 1277χ2 103364p-value 0.000
Citation Age FE # Restrict 18F 253.92p-value 0.000
# Restrict 17χ2 1727p-value 0.000
# Restrict 17χ2 1543p-value 0.000
# Restrict 18χ2 3267p-value 0.000
FC Year FE # Restrict 18F 79.11p-value 0.000
# Restrict 18χ2 392p-value 0.000
# Restrict 18χ2 421p-value 0.000
# Restrict 18χ2 1850p-value 0.000
Regression StatisticsLog-likelihood -41791 -41775 -32939P-value of Wald χ2 0.000 0.000 0.000R-Squared 0.834# of Observations 12830 12830 12830 12830All with p-value = 0.000 unless otherwise specified below:(1) < 0.01; (2) < 0.05; (3) < 0.10; (N) > 0.10 (not stat. sig.) Robust standard errors are shown in parentheses.Lighter shade: statistically significant. Darker shade: not statistically significant
229 As before, I employed NBRM with dispersion as a function of the expected mean of the counts for the i-th observation, which yields a higher likelihood ratio (better goodness-of-fit) than dispersion as a constant.
165

6.5.2 Institutional Affiliation, Location and IP Ownership
In next stage of the empirical analyses, the important roles of author institutional affiliation
and locations as well as the nature of patent assignees are examined to test for H2a, H2b and
H2c. Table 6.6 below presents five models with patent grant window and interaction effects
between post patent grant and author affiliation, location and patent assignees respectively.
Each model includes the article fixed effects, citation age fixed effects and forward citation
year fixed effects. Models 6.6-1 to 6.6-3 investigate the interaction between patent grant and
author affiliation, specifically the impact of patenting on articles with any public author, any
private author or purely public or private author. Model 6.6-1 suggests that patent grant
depresses the forward citation of articles with no public (purely private) author more than
those with at least one public author by about 8% as one may expect. This difference is
statistically significant. Model 6.6-2 suggests a significantly greater decline after patent grant
by more than 10% in forward citation of articles with at least one private author than those
with no private (purely public) author. Model 6.6-3 is able to isolate and compare the impact
on purely private versus purely public author and finds a significantly greater decline in
articles with purely private author versus purely public author (since the coefficient for purely
public author is not significant at 5%). Taken together, these results are consistent in
indicating that patenting hinders scientific knowledge dissemination and use to a greater
degree on private sector authored publications than on public sector authored publications.
Thus, H2a is supported. A likely explanation is that private for-profit corporations, which
private authors are affiliated with, often pay more emphasis on patent acquisition and
enforcement. Thus, private sector author publications tend to be associated with corporations
166

which have greater reputation for patent enforcement and litigation compared to public
research institutions, deterring knowledge diffusion and use to a greater extent.
Model 6.6-4 explores the impact of patenting on articles with authors from U.S. or otherwise.
It shows that patent grant deters knowledge dissemination and usage in both U.S. and non-
U.S. authored article forward citations but by nearly 5% more in articles with U.S. authors
than those without. As the latter turns out to be not significant, H2b is supported. This could
be due to the greater reputation for awareness of patent infringement and enforcement of IPR
by U.S. based authors (and institutions) compared to articles and knowledge generated by
overseas authors (and institutions).
The last model 6.6-5 in Table 6.6 shows a greater depression of nearly 6% on forward
citations by purely private (no public) corporation patenting compared to public institution
patenting. The latter turns out to be not statistically significant. Thus, H2c is supported. This
perhaps can be explained by similar reasoning given for H2a. The controls – article fixed
effects, citation age fixed effects and forward citation year fixed effects all behave similarly
and as expected compared to previous models, giving further validation to the robustness and
consistency of the models.
167

Table 6.6: NBRM Results by Institutional or National Affiliations
NBRM: DV = FCCoefficients reported as incidence rate ratios, IRR
[6.6-1]No Public Author vs. Public Author
[6.6-2]No Private Author vs. Private Author
[6.6-3] Purely Private vs. Purely Public Author
[6.6-4] No US Author vs. US Author
[6.6-5]No Public Sector Patent Assignee vs. Public Sector PatentAssignee
Independent Variables
Article or Patent Characteristics/ InteractionsPatent Grant Window(window)
.985 (N) (.016)
.983 (N) (.016)
1.01 (N) (.015)
.985 (N) (.016)
.986 (N) (.016)
Post Patent Grant* No Public Author
.885 (1) (.031)
Post Patent Grant* Public Author
.964 (3) (.018)
Post Patent Grant* No Private Author
.986 (N) (.019)
Post Patent Grant* Private Author
.885 (.023)
Post Patent Grant* (No Public) Purely Private Author
.927 (2) (.031)
Post Patent Grant* (No Private)Purely Public Author
1.03 (3) (.019)
Post Patent Grant* No US Author
.990 (N) (.027)
Post Patent Grant* US Author
.944 (1) (.019)
Post Patent Grant* No Public Assignee
.920 (.022)
Post Patent Grant* Public Assignee
.975 (N) (.020)
Control VariablesArticle FE # Restrict 1277
χ2 103195p-value 0.000
#Restrict1277χ2 101747p-value 0.000
#Restrict1277χ2 103644p-value 0.000
#Restrict1277χ2 103334p-value 0.000
# Restrict 1277χ2 103039p-value 0.000
Citation Age FE # Restrict 18χ2 3276p-value 0.000
# Restrict 18χ2 3306p-value 0.000
# Restrict 18χ2 3272p-value 0.000
# Restrict 18χ2 3276p-value 0.000
# Restrict 18χ2 3259p-value 0.000
FC Year FE # Restrict 18χ2 1846p-value 0.000
# Restrict 18χ2 1842p-value 0.000
# Restrict 18χ2 1880p-value 0.000
# Restrict 18χ2 1853p-value 0.000
# Restrict 18χ2 1842p-value 0.000
168

Regression StatisticsLog-likelihood -32935 -32926 -32934 -32937 -32935
P-value of Wald Chi2 0.000 0.000 0.000 0.000 0.000
# of Observations 12830 12830 12830 12830 12830All with p-value = 0.000 unless otherwise specified below:(1) < 0.01; (2) < 0.05; (3) < 0.10; (N) > 0.10 (not stat. sig.) Robust standard errors are shown in parentheses.Lighter shade: statistically significant. Darker shade: not statistically significant
6.5.3 Patent Thickets and Patenting of Disease and Cancer Genes
The phenomenon of the “patent thicket” especially in biomedical sciences and applications
has been the source of much heated debates. To test for H3, the hypothesis on the adverse
impact of a patent “thicket” and to answer the question on the existence of patent thickets and
to what extent, I constructed two independent variables on the maximum number of times a
gene covered by a given patent has been claimed by other patents – pat_1to5 and pat_6to10. I
further computed their interaction effects with post patent grant: pat_genepat_1to5 and
pat_genepat_6to10. Model 6.7-1 in Table 6.7 shows, consistent with the patent “thicket”
conception, granting of patents of genes claimed in more patents indeed causes a significantly
greater decline in annual forward citation of their publication pairs. Patenting of gene(s)
which were patented 1 to 5 times depresses the FC by 5.6% while patenting of gene(s)
patented 6 to 10 times depresses FC by about 10%, an additional 4.4% over the former
because of denser patent thickets. This 4.4% difference is marginally significant. Thus, H3 is
supported.
The last stage of the empirical analyses examines the question of central concern among
policy makers and corporation decision makers, research scientists and the general public.
169

Does patenting of disease genes (as catalogued by OMIM) and cancer genes have a more
pronounced effect in deterring subsequent knowledge dissemination and utilization compared
to other genomic patents and if so, to what extent?
This unique data set has been constructed to investigate these questions. The data set
distinguishes OMIM disease (phenotype) genes and cancer genes provided by the Cancer
Gene Census from other gene patents. Figure 6.2 shows that from the universe of 1279
patents, 250 unique patents claim only OMIM catalogued phenotype genes. 68 patents claim
both OMIM disease genes and cancer genes while 29 patents cover cancer gene only.230
Figure 6.2: Vein Diagram of Patents on OMIM Disease Genes and Cancer Genes in Data Set
OMIM Listed GenesCancer Genes
OMIM Listed BOTH OMIMCancerGenes
Genes ONLY(250 Patents)
Genes ANDCancer Genes
ONLY (29
(68 Patents) Patents)
ε: Universe of Patented Genes (1279 Patents)
Model 6.7-2 shows that when granted, OMIM disease (phenotype) gene patents causes a
decline of 8.4% in FC compared to a 2.9% decline for non-OMIM (or genotype only) genes, a
230 Almost all of the cancer genes covered by these 29 patents are listed in OMIM as genes with known sequence but not phenotype, and are therefore not included under OMIM.
170

nearly 6% more depression. As the latter is not statistically significant, patenting of disease
genes catalogued by OMIM does hinder scientific knowledge dissemination and use to a
greater degree compared with non- OMIM disease genes. H4a is supported.
Model 6.7-3 shows that cancer gene patent grant causes a decline of 11.4% in FC while non-
cancer gene (including OMIM genes) patent grant causes a decline of 3.9%. The difference is
statistically significant. This result is what we expect based on the hypothesis. Thus, patenting
of cancer genes hinders scientific knowledge dissemination and use to a greater degree than
non-cancer genes, ceteris paribus. H4b is supported.
Models 6.7-4 and 6.7-5 eliminate the effect of non-OMIM disease and non-cancer genes by
restricting the sample space to OMIM disease or cancer gene only, as illustrated by the area
within the two overlapping circles in Figure 6.2. This is done to establish a fair comparison of
the joint and differential impact of patenting of OMIM disease genes versus cancer genes. As
expected, Model 6.7-4 shows the joint impact of patenting both OMIM and cancer genes
(shown by the overlap between the two circles in Figure 6.2) does produce a greater
depression in FC (14%) versus patenting of purely OMIM or purely cancer genes and the
difference is statistically significant. Model 6.7-5 attempts to ascertain the differential impact
of patenting OMIM versus cancer genes. The results show that patenting of both OMIM and
cancer genes produces a significant 18.7% decline in FC compared to a 1% decline caused by
patenting of OMIM disease genes alone (i.e. OMIM but not cancer). The latter turns out to be
not statistically significant. This indicates the adverse impact of patenting of cancer genes is
much stronger than that of OMIM genes.
171

Table 6.7: NBRM Results by OMIM Disease Gene or Cancer Gene IPR
NBRM: DV = FCCoefficients reported as incidence rate ratios, IRR[6.7-1]Patent Thicket: Genes Claimed by Multiple Patents
[6.7-2]No OMIM Disease Gene vs. OMIMDisease Gene
[6.7-3]No Cancer Gene vs. Cancer Gene
[6.7-4]Not OMIM & Cancer Gene vs. OMIM & Cancer Gene (OMIM or Cancer Only)
[6.7-5] OMIM & Cancer Gene vs. OMIM not Cancer Gene (OMIM or Cancer Only)
Independent Variables
Patent Characteristics/ InteractionsPatent Grant Window(window)
.979 (N) (.016)
.988 (N) (.016)
.987 (N) (.016)
1.01 (N) (.029)
.978 (N) (.026)
Post Patent Grant* Gene Claimed/ Patented 1-5 Times
.944 (1) (.018)
Post Patent Grant* Gene Claimed/Patented 6-10 Times
.901 (1) (.030)
Post Patent Grant*No OMIM Entry/Gene
.971 (N) (.019)
Post Patent Grant* OMIM Entry/Gene
.916 (.023)
Post Patent Grant* No Cancer Gene
.961 (2) (.018)
Post Patent Grant* Cancer Gene
.886 (1) (.033)
Post Patent Grant*Not (OMIM & CancerGene)
1.07 (2) (.035)
Post Patent Grant* OMIM & Cancer Gene
.860 (1) (.043)
Post Patent Grant* OMIM & CancerGene
.813 (.040)
Post Patent Grant* OMIM but not Cancer Gene
.991 (N) (.032)
Control VariablesArticle FE # Restrict1277
χ2 101480p-value 0.000
#Restrict1277χ2 101833p-value 0.000
#Restrict1277χ2 100396p-value 0.000
# Restrict346χ2 36207p-value 0.000
# Restrict346χ2 36478p-value 0.000
Citation Age FE # Restrict 18χ2 3290p-value 0.000
# Restrict 18χ2 3678p-value 0.000
# Restrict 18χ2 3324p-value 0.000
# Restrict 18χ2 1260p-value 0.000
# Restrict 18χ2 1293p-value 0.000
172

FC Year FE # Restrict 18χ2 1847p-value 0.000
# Restrict 18χ2 2278p-value 0.000
# Restrict 17χ2 1851p-value 0.000
# Restrict 17χ2 837p-value 0.000
# Restrict 17χ2 827p-value 0.000
Regression StatisticsLog-likelihood -32935 -32935 -32936 -9445 -9447
P-value of Wald Chi2 0.000 0.000 0.000 0.000 0.000
# of Observations 12830 12830 12830 3601 3601All with p-value = 0.000 unless otherwise specified below:(1) < 0.01; (2) < 0.05; (3) < 0.10; (N) > 0.10 (not stat. sig.) Robust standard errors are shown in parentheses.Lighter shade: statistically significant. Darker shade: not statistically significant
6.6 Discussion
This study has provided conclusive and statistically significant determination of the presence
of the anti-commons effect. On a temporal basis, patenting in genomics and biomedical
sciences does impede knowledge dissemination and use by reducing the forward citation rate
of corresponding paper pairs by up to 18%. This decline appears once the patents have been
granted and become visible to the public. In other words, almost one in five follow-on
research projects building on previous work stops because of this effect.
This study also ascertains the impact of institutional affiliations and locations of authors as
well as the nature of patent ownership on knowledge diffusion and use. Patenting does hinder
knowledge dissemination and use to a greater degree on private sector authored publications
than public sector authored ones. This may be explained by the notion that private for-profit
corporations, which private authors are affiliated with, often pay more emphasis on patent
acquisition and enforcement, and thus have greater reputation for patent enforcement and
litigation compared to public research institutions, deterring knowledge diffusion and use.
Patenting by private corporations also impede knowledge use and diffusion to a greater extent
173

than patenting by public institutions for similar reasons. Patenting hinders scientific
knowledge dissemination and use to a greater degree for U.S. authored publications than non-
U.S. authored publications likely due to the reputation and awareness of patent infringement
and enforcement of IPR by U.S. based authors and thus institutions compared to foreign ones.
The study is the first of its kind to directly establish the adverse effect of “patent thickets”
through large-scale empirical analysis, which until now was cited only as anecdotal evidences
by policymakers, innovation scholars and scientists. Patenting of genes claimed by
incrementally more patents exerts greater impedance on knowledge dissemination and use.
This is shown by a greater decline in forward citation (from 5.6% to 10%) as the maximum
number of times patented increases. The most heavily patented genes include, among others,
ones with obvious commercial applications: CDKN2A (20 times) in which a mutation can
cause malignant melanoma and pancreatic cancer; BRCA1 (14 times) which is responsible for
early onset of breast cancer; and LEPR (12 times), a leptin receptor through which leptin, an
important circulating signal for the regulation of body weight, acts (see Appendices A and B).
A novel and important finding of the study is the assessment of the extent of adverse
patenting effect on disease and cancer genes which often causes the greatest concern. The
study establishes the more negative impact of patenting on OMIM disease genes compared to
non-OMIM genes (about 8.4% drop versus 2.9%). Patenting of cancer genes has a
significantly greater adverse impact than patenting of non-cancer genes (11.4% decline versus
3.9%). Finally, the most severe stifling effect is observed from the patenting of both OMIM
and cancer genes as shown by a statistically significant decline of 14% compared to patenting
174

of purely OMIM or purely cancer genes. On the other hand, the patenting of cancer genes
produces much more adverse impact than that of OMIM disease genes.
Although patents are key to life sciences & biotechnology development & exploitation, we
need to be cautious of the anti-commons effect and “patent thickets”, especially in patenting
of disease and cancer genes, which has broad implication for follow-on research and
innovation. These findings will hopefully act as a catalyst to inform IP policies in terms of
potentially rethinking patent standards, especially on criteria of novelty and utility, patent
scope or length to mitigate these adverse effects on knowledge diffusion, use and
accumulation. Another important consideration is the possible reshaping of rules governing
licensing of patents and access to patented research, particularly in academic sector.
6.7 Conclusion
This study has helped to resolve the central questions in life science patenting debates. I find
genomic patents do impede knowledge dissemination and use and cause a decline in forward
citation of their corresponding paired papers once they have been granted and become visible
to the public, as predicted by the anti-commons effect. In terms of institutional affiliations and
locations, patenting hinders scientific knowledge dissemination and use to a greater degree on
private sector authored publications than on public sector authored publications, and similarly
for U.S. authored publications than non-U.S. authored publications. Regarding the nature of
IP ownership, patenting by private corporations does have a more adverse effect on scientific
knowledge dissemination and use than patenting by public institutions.
175

I find, for the first time, direct evidence of the adverse effects of “patent thickets” in the life
sciences. That is, if an organization patents a gene that is claimed in more patents, there will
be more serious impedance on knowledge diffusion and use of the paired publication.
This is reinforced by the finding that patenting of OMIM disease genes hinders scientific
knowledge dissemination and use to a greater degree compared to non-OMIM disease genes
and similarly, patenting of cancer genes produces a more adverse effect than patenting of non-
cancer genes.
176

CHAPTER 7:
CONCLUSION AND FUTURE WORK
This chapter summarizes the work presented in this dissertation and discusses its implications
for public policy. I also highlight the contribution of this research for scholars in the field. The
thesis concludes by acknowledging some of the more salient research limitations and
proposing areas for future study.
7.1 Review of Dissertation and Policy Implications
Patents are particularly critical in the life sciences (Scherer et al., 1959;231 Mansfield et al.,
1981;232 Mansfield, 1986;233 Levin et al., 1987;234 Cohen et al., 2000235) for reasons of
appropriability of R&D returns (monopoly of the inventions over a limited period of time)
and peculiar nature of life science innovations. Life science innovations captured by patents
demonstrate varying degrees of importance, generalizability, originality, technology distance,
time lag and appropriability. As I show in Chapter 5, the variation in institutional conditions
has most impact on forward looking importance, generality, originality, backward time lag
and appropriability. Moreover, for industry and academic patents there exist systematic
linkages in these innovations between the forward and backward measures thus providing
further evidence of “technological trajectories” along which technology improvements occur,
231 Scherer, F.M., et al. (1959) Patents and the Corporation. 2nd edn. Boston, privately published.232 Mansfield, E., Schwartz, M. and Wagner, S. (1981) "Imitation Costs and Patents: An Empirical Study."Economic Journal, 91:907-918.233 Mansfield, E. (1986) "Patents and innovation: An empirical study." Management Science, 32:173-181.234 Levin, R., Kievorick, A., Nelson, R.R., and Winter, S.G. (1987) "Appropriating the returns from industrialR&D." Brookings Papers on Economic Activity, 783-820.235 Cohen, Wesley M., Richard R. Nelson, John P. Walsh (2000) “Protecting Their Intellectual Assets: Appropriability Conditions and Why US Manufacturing Firms Patent (or Not)” NBER Working Paper 7552
177

and display coherence in the characteristics of such innovations and persistence. This is
consistent with previous findings. However, unlike other technology fields, what is most
interesting and distinct about life science innovation is its evolving nature – the growing
convergence of public/ academic and industry innovations especially in terms of basicness
and appropriability. This phenomenon has been predicted and characterized by Stokes (1997)
as innovations falling into the Pasteur’s quadrant, or “use-inspired basic research” displaying
both basic and applied values.
At the same time, an important consequence of the Pasteur’s quadrant is the duality of
knowledge – its value as both an input into future scientific research and an input into future
commercialization. This duality often leads such scientific knowledge to be subject to formal
IP rights but also to it being disclosed in the form of scientific research publications. This is
an instance in which an experimental result or scientific discovery manifests in two
observables – a patent and a publication or a “patent-paper pair” such that one captures the
intellectual substance and ideas described in the other and vice versa. It is through the
exploitation of such pairs and other patenting and publication characteristics that scholars can
gain insight into the trajectories of scientific knowledge dissemination and use and its
accumulation and the impact of intellectual property rights on their cumulative and temporal
trends to inform public policy.
The study in Chapter 4 finds that an institutional policy resulting in patents does not have an
adverse cumulative effect on the diffusion and utilization of scientific knowledge and that
publications associated with paired patents could be perceived as more “important”
178

publications in terms of their cumulative forward citations (and indeed are seemingly
associated with such publications).
However, the results of Chapter 6 complement this finding by providing an actual
counterfactual (i.e. effect of patenting on the same publication which is invisible before patent
grant and visible after) and an examination of the temporal citation trajectories. It is only
through this identification strategy, first proposed by Murray and Stern (2005) that it is
possible to discern what the citation trajectory might have been in the absence of the patent
policy. As predicted by the anti-commons effect (Heller and Eisenberg, 1998), my analysis of
1279 patent-paper pairs (the largest data set of this type to be gathered, to my knowledge)
reveals patenting does negatively impact the temporal trend of knowledge dissemination and
use by follow-on scientists building on prior research in the sense that patent grant has
generated a decrease in amount of knowledge dissemination and use. In fact, patenting
hinders knowledge diffusion and use to a greater degree for private sector authored
publications relative to public ones and U.S. authored compared to non-U.S. authored
publications, and corporate patenting does have a more adverse impact than patenting by
public institutions. For the first time, it provides direct evidence of the adverse effect of
“patent thickets”, i.e. overlapping upstream patents stifling downstream research and
innovation, rather than a single patent in the life sciences, and points to the fact that the
patenting of disease and cancer genes generates differential and significant negative impact on
knowledge dissemination and utilization. These findings have illuminated the life sciences
patenting debates and have important policy implications.
179

Patents provide important incentives for innovation and disclosure in the life sciences
(Mansfield, 1986;236 Levin et al., 1987237) and play a key role in licensing and
commercialization activities across the university-industry boundary (see Chapter 4).
However, this distinct proof of the tragedy of the anti-commons in life sciences should inform
public policy makers about potential intellectual property reforms, for example, raising the
bar for patent standard, especially on criteria of utility and novelty, narrowing certain patent
scope or length to mitigate these adverse impacts; or perhaps in shaping the rules governing
the enforcement and licensing of patents and access to patented research, particularly in the
academic sector.
7.2 Contributions of this Dissertation
This dissertation has made significant contribution to scholarship in technology innovation
and management, as well as contributed to policy and practice. It has systematically
constructed, quantified and characterized some of the unique attributes of life science
innovations (specifically gene-based innovations) under different institutional regimes and
identified a growing convergence typical of innovations in the Pasteur’s quadrant.
Through a methodological and thorough review of the literature and history of the Human
Genome Project and detailed examination of all public genomic institutions involved, this
236 Mansfield, E. (1986) "Patents and innovation: An empirical study." Management Science, 32:173-181.237 Levin, R., Kievorick, A., Nelson, R.R., and Winter, S.G. (1987) "Appropriating the returns from industrialR&D." Brookings Papers on Economic Activity, 783-820.
180

dissertation has provided insight to the key institutional drivers and characteristics affecting
scientific knowledge dissemination and utilization.
In addition, through a comprehensive, large-scale empirical investigation of the interaction
between patents and their paired publications using novel data sets, this research work has
resolved the intellectual property debates on the anti-commons effect in the life sciences.
I anticipate that this research will contribute to the deliberations of policy makers, scholars,
scientists, technologists, venture capitalists and industry experts as they try and better
appreciate and understand the differential impacts of patenting – how it affects scientific
knowledge diffusion, accumulation and utilization. Thus, it may inform discussions regarding
intellectual property policies and processes for both public institutions and private
corporations to enhance the dissemination and accumulation of knowledge and promote the
potential for downstream utilization and commercialization.
Finally, this dissertation has provided a useful framework and built a foundation for future
intellectual property, technology policy and innovation research across different industry
sectors and countries.
181
7.3 Limitations and Future Work
As mentioned in Section 5.3, there are limitations in the use of patent data: i) not all
inventions are patented and not all inventions meet the patentability criteria by USPTO
(novelty, utility and non-obviousness); ii) patenting is a strategic decision made by the
institution and/or individual inventor as other forms of appropriability like secrecy could often
be relied on. In this respect, scholars are uncertain about how representative patents are of the
wider universe of inventions since there is no systematic data about inventions that are not
patented. This is a potentially interesting area for future research.
This work is primarily a coherent set of large-scale quantitative empirical studies
supplemented by qualitative evidence from MIT Technology Licensing Office, primary and
secondary documentary materials, phone interviews and various other sources. Consequently,
it does not capture as much of the nuance as a comparative qualitative study involving
extensive field work and interviews. This is perhaps another limitation of this study and a
potential area for future work.
In addition to building on the work from Chapter 5 to understand more about life science
innovations, I would be most interested to extend this line of IP research into emerging
economies like China and India, an area of research that is garnering much scholarly interest
and excitement but not yet well understood. Very interesting comparisons could be made
between the nature and dynamics of characteristics and citation linkages of Chinese and
Indian patents versus ones from a mature economy like the United States, which we already
know much about. What impacts do different national and geographic boundaries, types of
182

organizations and institutional arrangements have on patenting and patent citations? What
impacts do differing national (and regional) IP policies involving university research have on
technology innovation and commercialization activities at the university-industry boundary?
What can be done to inform and improve these technology policies in both emerging and
mature economies?
These are fascinating questions of great importance as technological innovation becomes an
increasingly critical driver of today’s knowledge-based economy, an economy in which
intellectual property plays a critical strategy role but one that is fraught with tension and
tradeoffs.
183

ADDITIONAL REFERENCES
[1] Allen, Thomas J. (1977), Managing the Flow of Technology, Cambridge, MA: MIT Press, reprinted 1993, Chapters 5-7.
[2] Bresnahan, T. and M. Trajtenberg (1995), "General Purpose Technologies: Engines ofGrowth?", Journal of Econometrics, Vol. 65, pp. 83-108.
[3] Henderson, Rebecca and Ian Cockburn (1994), "Measuring Competence? Exploring Firm Effects in Pharmaceutical Research", Strategic Management Journal, Vol. 15 (Special Issue: Competitive Organizational Behavior; winter), pp. 63-84.
[4] Nelson, R. (1959), "The Simple Economics of Basic Scientific Research", Journal ofPolitical Economy, Vol. 67, No. 3, pp. 297-306.
[5] Smelser, Neil J. (1994), Sociology, Cambridge, MA: Blackwell Publishers, Chapters 1, 2 and 3
[6] Smelser, Neil J. eds. (1988), “The Sociology of Science”, Handbook of Sociology, London, UK: Sage Publications, second printing 1989, Chapter 16
[7] Teece, David J. (1987), "Profiting from Technological Innovation: Implications for Integration, Collaboration, Licensing and Public Policy", The Competitive Challenge: Strategies for Industrial Innovation and Renewal. ed. David J Teece, Cambridge (MA): Ballinger, pp. 185-219 (chap. 9).
[8] Thursby, J. G. and M. C. Thursby (2002). “Who is selling the Ivory Tower? Sources of growth in university licensing.” Management Science 48(1): 90-104.
[9] Utterback, James M. (1974), "The Innovation Process", Science, Vol 183 (Feb 15th), pp.658-662, reprinted in Readings in the Management of Technological Innovation, eds. Tushman and Moore (1988), New York: Harper Collins.
184

APPENDICES
Appendix A: The 50 Most Patented Genes in the Human Genome
GeneNumber
TimesPatented Gene Name Location Gene Function
655 20 BMP7 20q13 bone morphogenetic protein 71029 20 CDKN2A 9p21 cyclin-dependent kinase inhibitor 2A
672 14 BRCA1 17q21 breast cancer 1, early onset768 14 CA9 9p13-p12 carbonic anhydrase IX
3084 13 NRG1 8p21-p12 neuregulin 16469 13 SHH 7q36 sonic hedgehog homolog3953 12 LEPR 1p31 leptin receptor6004 11 RGS16 1q25-q31 regulator of G-protein signalling 16
959 10 CD40LG Xq26 CD40 ligand3549 10 IHH 2q33-q35 Indian hedgehog homolog3557 10 IL1RN 2q14.2 interleukin 1 receptor antagonist7424 10 VEGFC 4q34.1-q34.3 vascular endothelial growth factor C
781 9 CACNA2D1 7q21-q22calcium channel, voltage-dependent, alpha 2/delta subunit1
3551 9 IKBKB 8p11.2inhibitor of kappa light polypeptide gene enhancer in B-cells, kinase beta
4057 9 LTF 3q21-q23 lactotransferrin5732 9 PTGER2 14q22 prostaglandin E receptor 2 , 53kDa7012 9 TERC 3q26 telomerase RNA component7941 9 PLA2G7 6p21.2-p12 phospholipase A2, group VII9622 9 KLK4 19q13.41 kallikrein 4
23533 9 PIK3R5 17p13.1 phosphoinositide-3-kinase, regulatory subunit 5, p10191074 9 ANKRD30A 10p11.21 ankyrin repeat domain 30A
182 8 JAG1 20p12.1-p11.23 jagged 1330 8 BIRC3 11q22 baculoviral IAP repeat-containing 3650 8 BMP2 20p12 bone morphogenetic protein 2656 8 BMP8B 1p35-p32 bone morphogenetic protein 8b
1234 8 CCR5 3p21 chemokine receptor 53600 8 IL15 4q31 interleukin 153603 8 IL16 15q26.3 interleukin 16
4772 8 NFATC1 18q23nuclear factor of activated T-cells, cytoplasmic,calcineurin-dependent 1
5663 8 PSEN1 14q24.3 presenilin 15664 8 PSEN2 1q31-q42 presenilin 27015 8 TERT 5p15.33 telomerase reverse transcriptase
10855 8 HPSE 4q21.3 heparanase10912 8 GADD45G 9q22.1-q22.2 growth arrest and DNA-damage-inducible, gamma
799 7 CALCR 7q21.3 calcitonin receptor836 7 CASP3 4q34 caspase 3, apoptosis-related cysteine protease839 7 CASP6 4q25 caspase 6, apoptosis-related cysteine protease941 7 CD80 3q13.3-q21 CD80 antigen
1485 7 CTAG1B Xq28 cancer/testis antigen 1B2896 7 GRN 17q21.32 granulin2912 7 GRM2 3p21.2 glutamate receptor, metabotropic 22913 7 GRM3 7q21.1-q21.2 glutamate receptor, metabotropic 33621 7 ING1 13q34 inhibitor of growth family, member 1
4308 7 TRPM1 15q13-q14transient receptor potential cation channel, subfamily M,member 1
4363 7 ABCC1 16p13.1 ATP-binding cassette, sub-family C , member 1
4653 7 MYOC 1q23-q24myocilin, trabecular meshwork inducible glucocorticoidresponse
4889 7 NPY5R 4q31-q32 neuropeptide Y receptor Y55156 7 PDGFRA 4q11-q13 platelet-derived growth factor receptor, alpha polypeptide6304 7 SATB1 3p23 special AT-rich sequence binding protein 17133 7 TNFRSF1B 1p36.3-p36.2 tumor necrosis factor receptor superfamily, member 1B
185

Tim
es P
aten
ted
Appendix B: Number of Times Patented by Chromosome
Times Patented by Chromosome
3500
3000
2500
2000
1500
1000
500
0
1 2 3 4 5 6 7 8 9 10 11 12 13 14 15 16 17 18 19 20 21 22 X Y
Chromosome Number
186