Embed Size (px)
Citation preview
INNOVATING LEARNING,
SOCIAL PROGRESS and
HUMANITY’S FUTURE
Dirk Van Damme
OECD/EDU/IMEP
SETTING THE SCENE
2

• Relentless expansion of education systems
Setting the scene – the big picture
3

• Relentless expansion of education systems
Setting the scene – the big picture
-10
0
10
20
30
40
50
60
70
-10
0
10
20
30
40
50
60
70
Isra
el
Un
ited
Sta
tes
Ger
man
y
Bra
zil
Esto
nia
Au
stri
a
Ru
ssia
n F
eder
atio
n
Fin
lan
d
Ch
ile
Turk
ey
Ital
y
Den
mar
k
Mex
ico
Swit
zerl
and
New
Ze
alan
d
Can
ada
Slo
vak
Rep
ub
lic
Icel
and
Au
stra
lia
Gre
ece
Swed
en
EU 2
1 a
vera
ge
OEC
D a
vera
ge
No
rway
Hu
nga
ry
Net
her
lan
ds
Cze
ch R
epu
blic
Un
ited
Kin
gdo
m
Po
rtu
gal
Bel
giu
m
Slo
ven
ia
Spai
n
Fran
ce
Luxe
mb
ou
rg
Irel
and
Jap
an
Po
lan
d
Ko
rea
Difference between the 25-34 and 55-64 year-old population with tertiary education (right axis)
Proportion of the 25-34 year-old population with tertiary education (left axis)
Proportion of the 55-64 year-old population with tertiary education (left axis)%
Percentage points
4

• Relentless expansion of education systems
• Growing impact of education on various social
and economic outcomes
Setting the scene – the big picture
An individual with a higher level of education is more
likely to believe they have a say in government
5

• Relentless expansion of education systems
• Growing impact of education on various social
and economic outcomes
Setting the scene – the big picture
0
10
20
30
40
50
60
70
80
Cze
ch R
epu
blic
Ital
y
Spai
n
Esto
nia
Ger
man
y
Jap
an
Slo
vak
Rep
ub
lic
Irel
and
Can
ada
Ko
rea
Engl
and
/N. I
rela
nd
(UK
)Au
stri
a
Ave
rage
Flan
de
rs (
Bel
giu
m)
Au
stra
lia
Un
ited
Sta
tes
Net
her
lan
ds
Swed
en
Den
mar
k
Fin
lan
d
No
rway
%
Below upper secondary education Upper secondary or post-secondary non-tertiary education Tertiary Education
An individual with a higher level of education is more
likely to believe they have a say in government
6

• Relentless expansion of education systems
• Growing impact of education on various social
and economic outcomes
• But challenges remain and magnify
– The equity and social mobility challenge
– The quality challenge
– The efficiency challenge
Setting the scene – the big picture
7
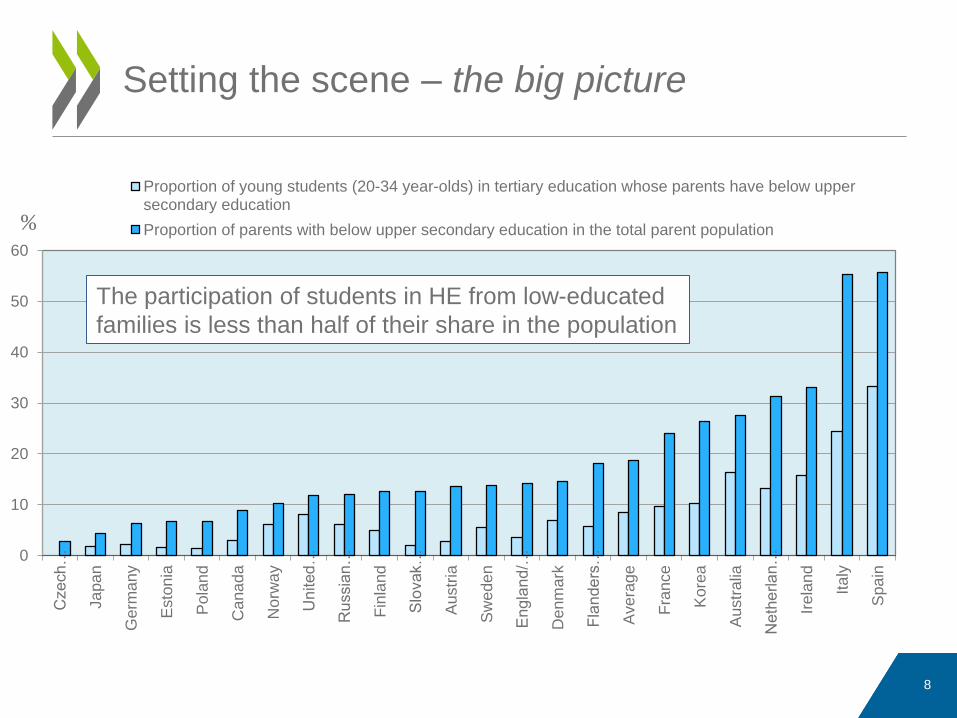
Setting the scene – the big picture
0
10
20
30
40
50
60
Czech…
Ja
pa
n
Germ
any
Esto
nia
Pola
nd
Cana
da
Norw
ay
United
…
Russia
n…
Fin
land
Slo
vak…
Austr
ia
Sw
ede
n
Eng
land
/…
Denm
ark
Fla
nde
rs…
Avera
ge
Fra
nce
Kore
a
Austr
alia
Neth
erla
n…
Irela
nd
Italy
Spa
in
Proportion of young students (20-34 year-olds) in tertiary education whose parents have below uppersecondary education
Proportion of parents with below upper secondary education in the total parent population%
The participation of students in HE from low-educated
families is less than half of their share in the population
8
Setting the scene – the big picture
0
10
20
30
40
Ho
ng
Ko
ng-
Ch
ina
Ko
rea
+
Liec
hte
nst
ein
Mac
ao-C
hin
a +
Jap
an
Swit
zerl
and
Bel
giu
m -
Ne
ther
lan
ds
-
Ge
rman
y
Po
lan
d +
Can
ada
-
Fin
lan
d -
Ne
w Z
eal
and
-
Au
stra
lia -
Au
stri
a
OEC
D a
vera
ge 2
003
-
Fran
ce
Cze
ch R
ep
ub
lic -
Luxe
mb
ou
rg
Ice
lan
d -
Slo
vak
Re
pu
blic
Ire
lan
d
Po
rtu
gal
+
Den
mar
k -
Ital
y +
No
rway
-
Hu
nga
ry
Un
ite
d S
tate
s
Swe
de
n -
Spai
n
Latv
ia
Ru
ssia
n F
ed
era
tio
n
Turk
ey
Gre
ece
Thai
lan
d
Uru
guay
-
Tun
isia
Bra
zil
Me
xico
Ind
on
esi
a
% 2012 2003
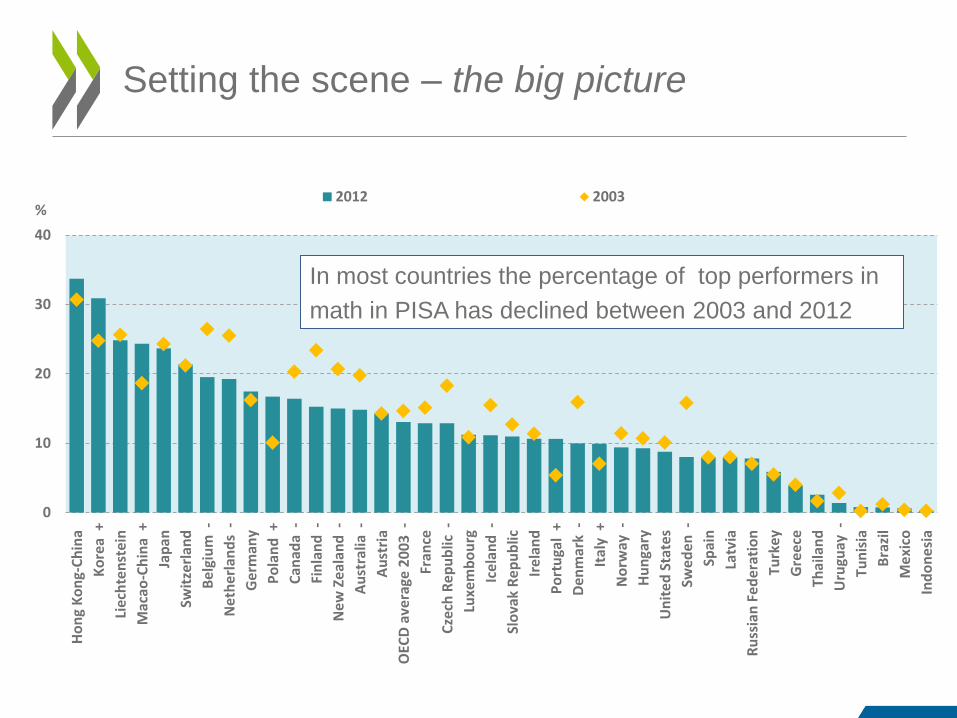
In most countries the percentage of top performers in
math in PISA has declined between 2003 and 2012
9

Setting the scene – the big picture
80
90
100
110
120
130
140
Bra
zil
Chile
Slo
vak R
epu
blic
Kore
a
Pola
nd
Cze
ch R
ep
ub
lic
Cana
da
Austr
alia
Isra
el
Germ
any
Sw
itze
rla
nd
Port
ug
al
Me
xic
o
Un
ited
Kin
gd
om
Fin
land
Sw
ede
n
EU
21 a
vera
ge
OE
CD
ave
rag
e
Ne
the
rla
nds
Austr
ia
Ja
pa
n
Norw
ay
Un
ited
Sta
tes
Irela
nd
Belg
ium
Slo
ven
ia
Fra
nce
Russia
n F
ede
ratio
n
Spa
in
Esto
nia
Icela
nd
De
nm
ark
Italy
Hung
ary
Index of change (2008=100)
Change in expenditure Change in the number of students (in full-time equivalents) Change in expenditure per student
Primary, secondary and post-secondary non-tertiary education
In most countries the per student expenditure
has continued to increase
10

• Can we continue
– Expanding our systems quantitatively?
– Exporting our model to emerging and developing
countries?
– Pretending that nothing is changing in the outside
world, impacting on the
• Why
• What
• How we are educating?
Setting the scene – more of the same?
11

THE DRAMA
12
• Challenges for education policy makers increase
– Supporting the expansion of the system
– Ensuring quality
– Securing equitable access and opportunities
– Meeting ever growing expectations
• But in very difficult times
– Deepening social problems
– Doing more with less
– Intensifying political and ideological differences
Challenges may seduce policy-makers to
sustain the current model
13

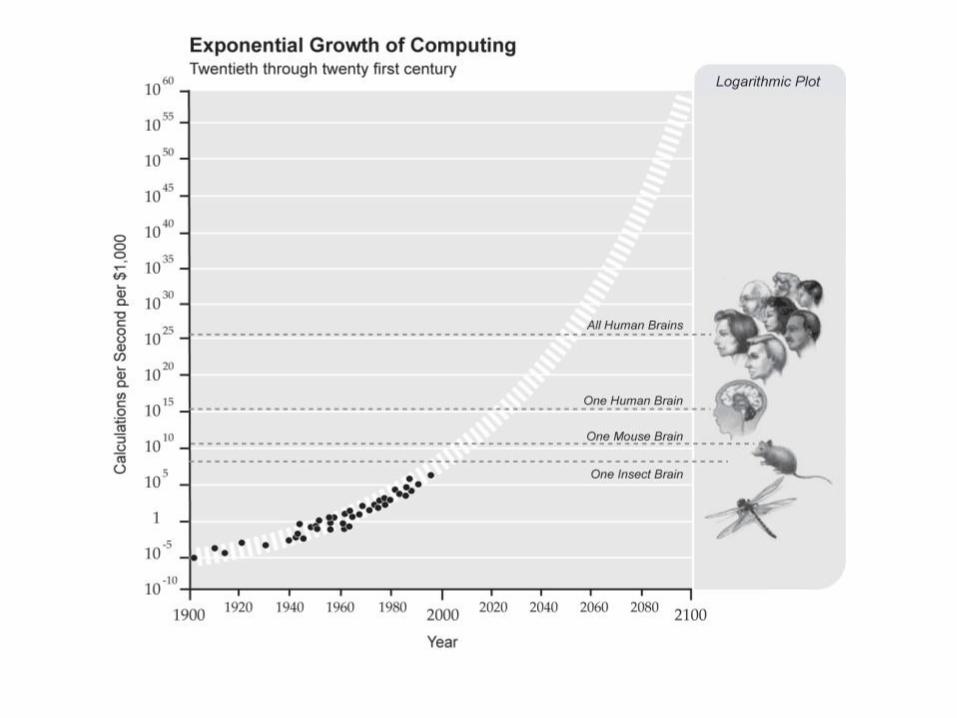
• The race with technology
• The nature of the skills demand, employability,
skills mismatch
Where is education getting out of tune?
14
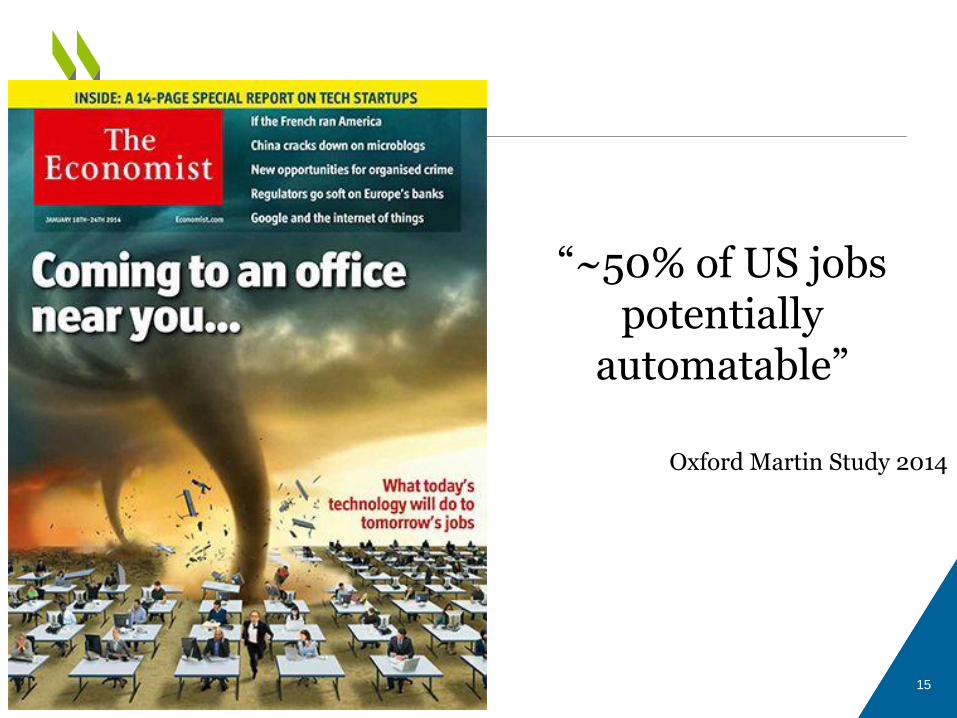
“~50% of US jobs potentially
automatable”
Oxford Martin Study 2014
15

16
17

18
Changing skills demand
35
40
45
50
55
60
65
70
1960 1970 1980 1990 2000 2006 2009
Routine manual Nonroutine manual Routine cognitive
Nonroutine analytic Nonroutine interpersonal
Mean task input in percentiles of 1960 task distribution
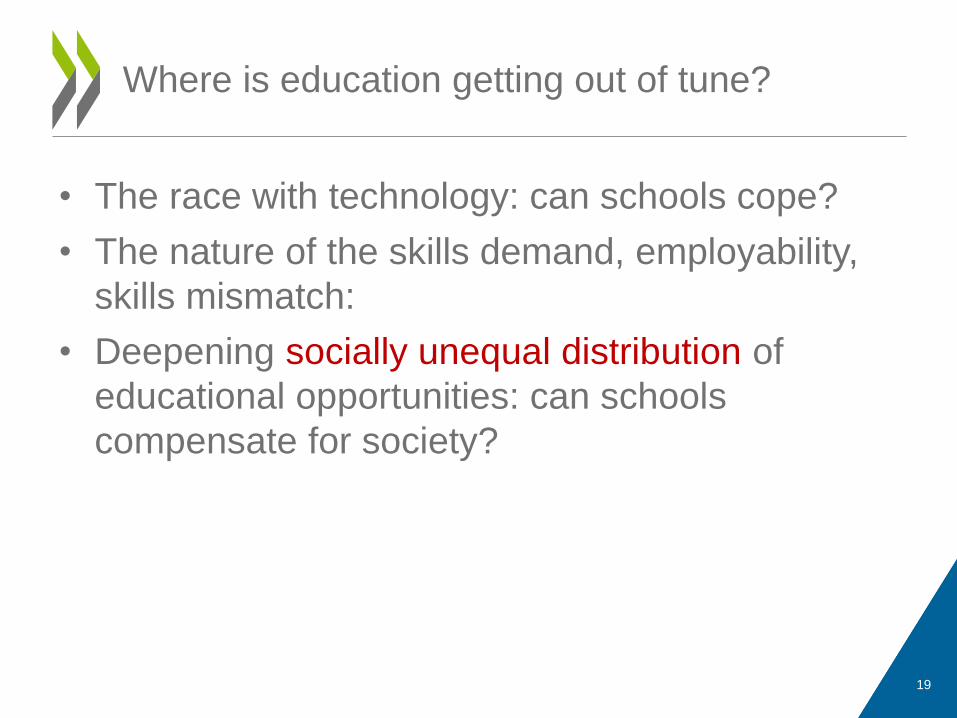
• The race with technology: can schools cope?
• The nature of the skills demand, employability,
skills mismatch:
• Deepening socially unequal distribution of
educational opportunities: can schools
compensate for society?
Where is education getting out of tune?
19
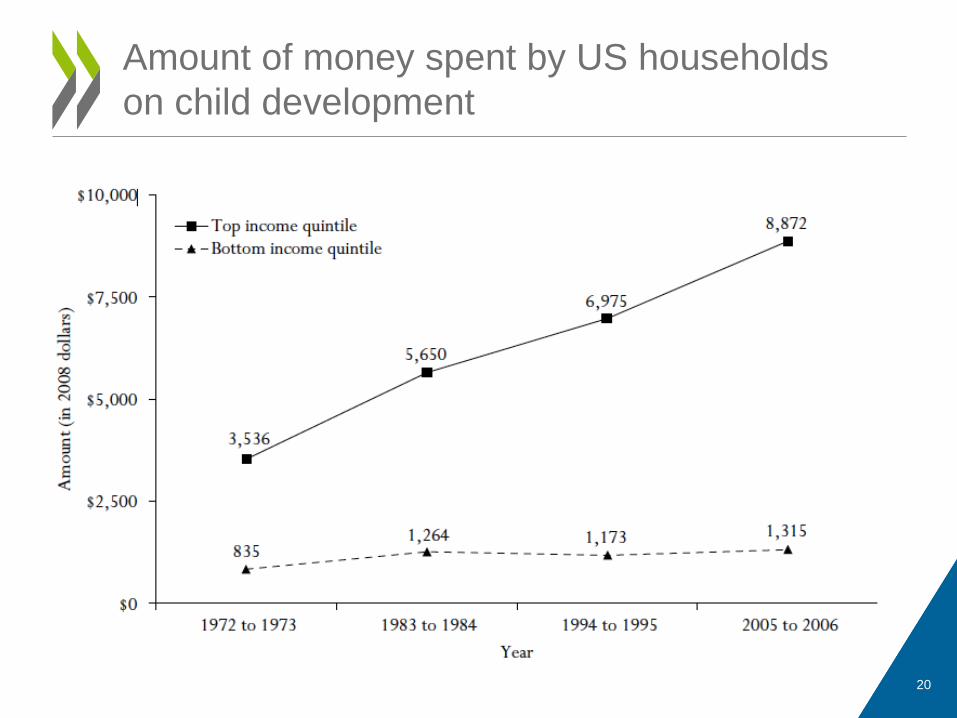
Amount of money spent by US households
on child development
20
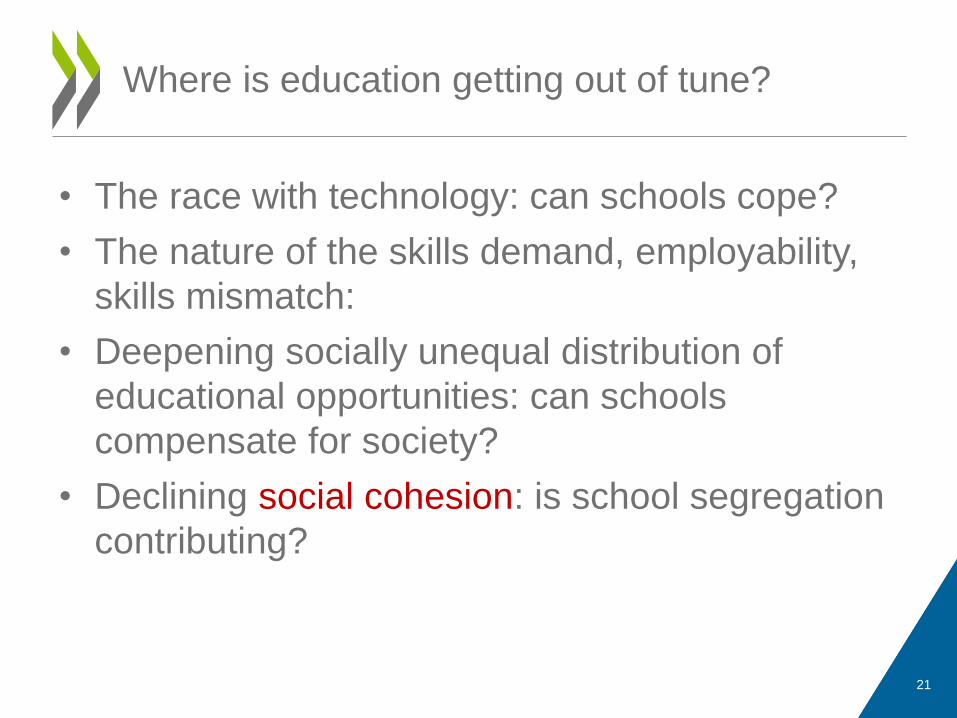
• The race with technology: can schools cope?
• The nature of the skills demand, employability,
skills mismatch:
• Deepening socially unequal distribution of
educational opportunities: can schools
compensate for society?
• Declining social cohesion: is school segregation
contributing?
Where is education getting out of tune?
21

• Less well functioning democratic systems
Where is education getting out of tune?
22
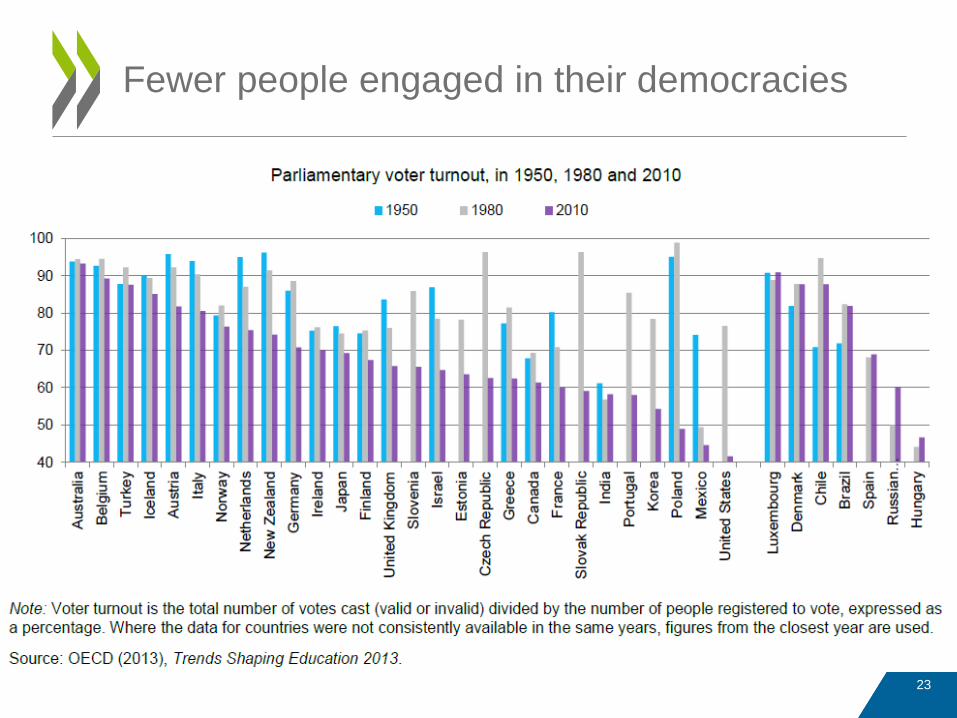
Fewer people engaged in their democracies
23

• Less well functioning democratic systems
• Are social protection systems paying the price of
less functional education systems?
Where is education getting out of tune?
24

Increasing social expenditure
25

• Less well functioning democratic systems
• Are social protection systems paying the price of
dysfunctional education systems?
• What kind of values do we need to address
humanity’s imminent challenges?
Where is education getting out of tune?
26
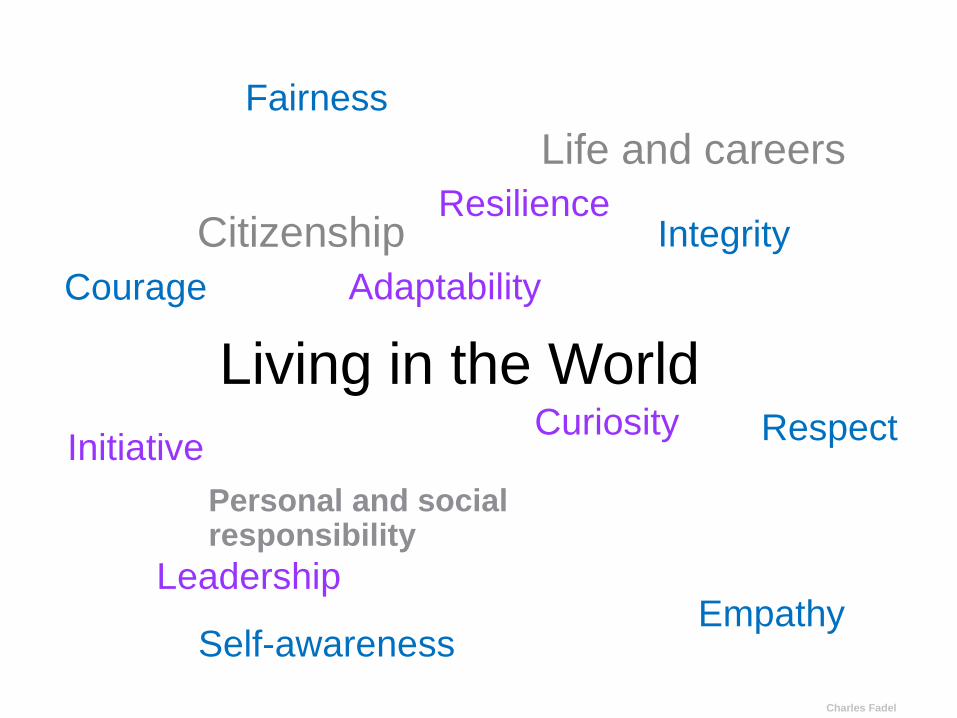
Charles Fadel
Living in the world
Personal and social responsibility
Life and careers
Citizenship
Fairness
Integrity
Respect
Self-awareness
Courage
Empathy
Resilience
Adaptability
Curiosity Initiative
Leadership
Living in the World

• But, most importantly, are our education systems
really tuned to
– Support learning?
– Foster social learning?
– Creating learning societies?
• Or are we merely maintaining credentialism, systems of selecting,
screening and signalling people?
Where is education getting out of tune?
28
THE PLOT
29
• Widely shared perception of slowness of reform and ‘resistance to innovation’ among policy makers and external stakeholders
• Many examples of ill-conceived and badly implemented top-down innovation
• Yet, CERI evidence points at many examples of meaningful change
• And, evidence in CERI’s Innovative Learning Environments present a rich reservoir of innovative energy
Innovating learning
30
• The 7 principles of learning (ILE):
– Learners at the centre
– The social nature of learning
– Emotions are integral to learning
– Recognising individual differences
– Stretching all students
– Assessment for learning
– Building horizontal connections
• We know which road to follow!
The roadmap of innovating learning
31

• Learning is the key to creating learning societies
that can address challenges and to liberating
humanity’s problem-solving potential
• Innovative environments and conditions will be
necessary for individuals and societies to
succeed in higher, better, deeper learning
• How can we create ecosystems to make that
happen?
Innovating learning
32

THE STAGE
33
• We can learn a lot from experimentation and
pioneering
• Too often incapable of transcending the
pioneering stage
• How to move towards
– Systemic change
– Transformative change
• Crucial challenge: implementation or the
‘political economy of reform’
Towards systemic transformation
34
• It’s not about education having to become more
‘responsive’ to society’s needs
• It’s about education taking a leadership role in
defining humanity’s future
Finally
35
36