Embed Size (px)
Citation preview
Inverse Heat Transfer Analysis of QC-
10 Mold Block for Plastic Injection
Molding Operations
1
Inverse Heat Transfer Analysis of QC 10 Mold Block for
Production Injection Molding Operations
By Mike Kraemer
November-18-2010
QC-10 Validation Project
Objective:
Conduct Interfacial Heat Flux Study (Heat Flow Rate Intensity)
Develop a method by which a stable melt temperature solidification prediction using QC 10 and the plastic melt is investigated.
Investigate the interfacial thermal resistance of the solidifying plastic melt and the QC 10 or steel mold surfaces.
Investigate the notion that QC 10 aluminum alloy decreases the thermal resistance between the plastic melt and the mold surface.
Two molds were manufactured with identical part geometries and exact same Thermocouple locations. One was made out of NAK 80 (an Asian tool steel, enhanced verions of P20) and QC 10 Aluminum Alloy.
2
QC-10 Validation Project
3
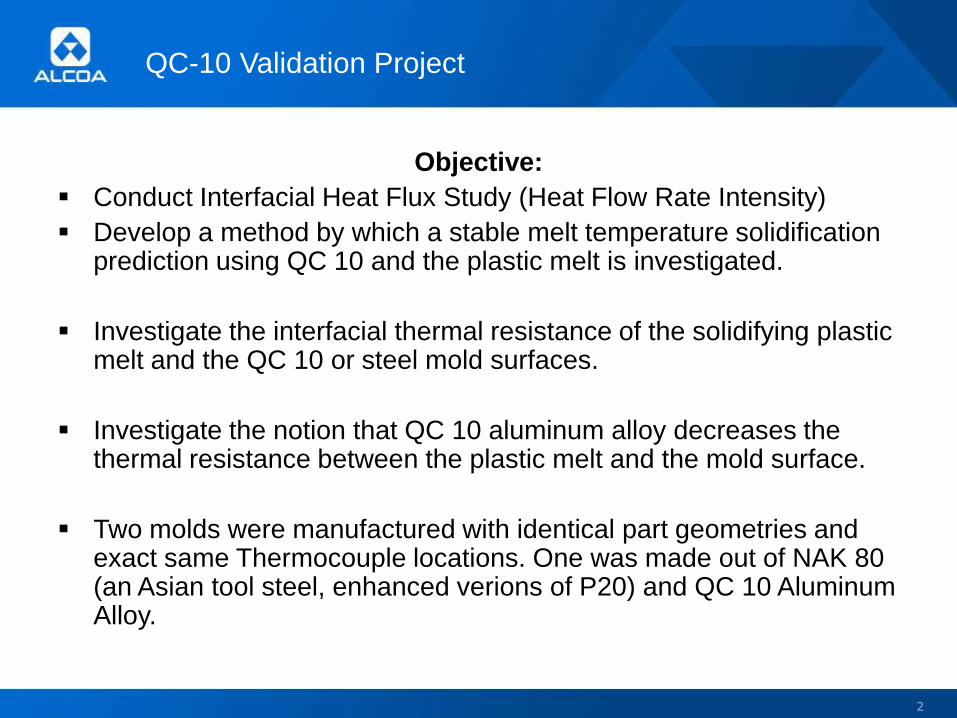
Test Mold Drawing
TC1
TC2
TC3, TC4
TC3, TC4TC1 TC2
Thermocouple Locations:
TC 1: Direct Contact with Plastic Melt (Closest to gate)TC 2: Direct Contact with Plastic Melt (Farthest from gate)TC 3: 0.5mm behind QC 10 Mold surfaceTC 4: 2.00mm behind QC 10 Mold surface
4
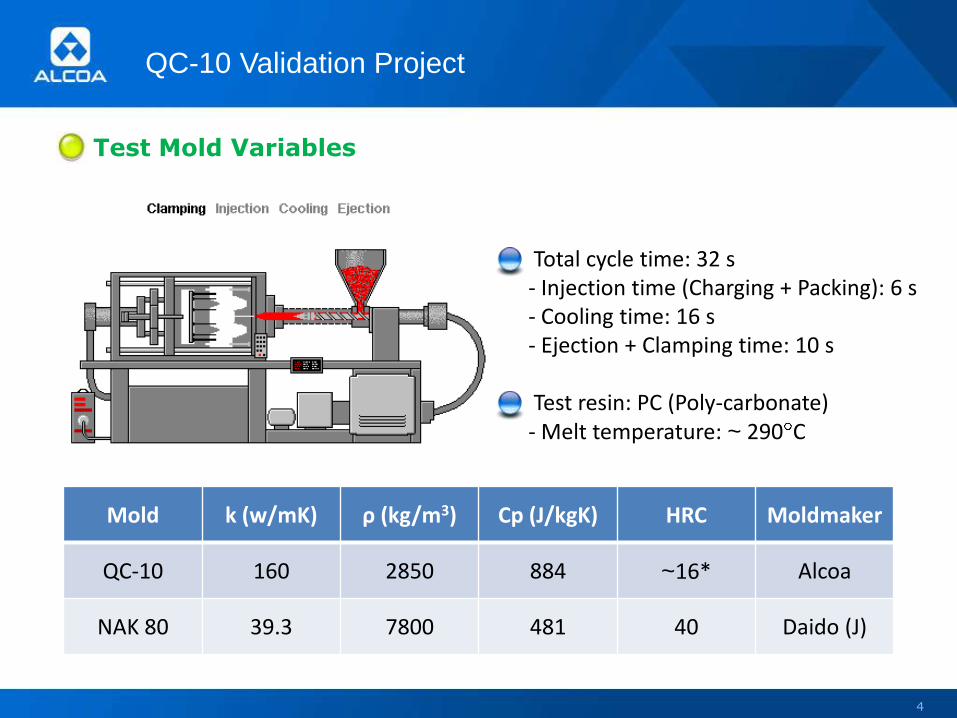
Test Mold Variables
QC-10 Validation Project
Mold k (w/mK) ρ (kg/m3) Cp (J/kgK) HRC Moldmaker
QC-10 160 2850 884 ~16* Alcoa
NAK 80 39.3 7800 481 40 Daido (J)
Total cycle time: 32 s- Injection time (Charging + Packing): 6 s- Cooling time: 16 s- Ejection + Clamping time: 10 s
Test resin: PC (Poly-carbonate)- Melt temperature: ~ 290 C
Heat Transfer Analysis
5
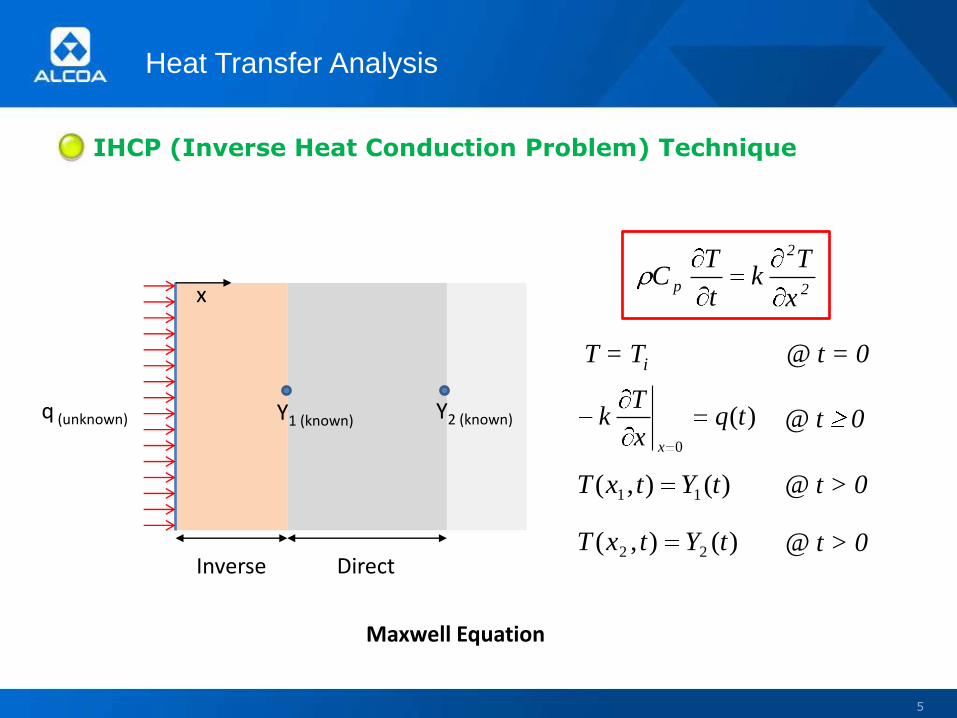
IHCP (Inverse Heat Conduction Problem) Technique
Y1 (known) Y2 (known)
Inverse Direct
q (unknown)
x 2
2
px
Tk
t
TC
)(0
tqx
Tk
x
)(),( 11 tYtxT
)(),( 22 tYtxT
T = Ti @ t = 0
@ t 0
@ t > 0
@ t > 0
Maxwell Equation
Heat Transfer Analysis
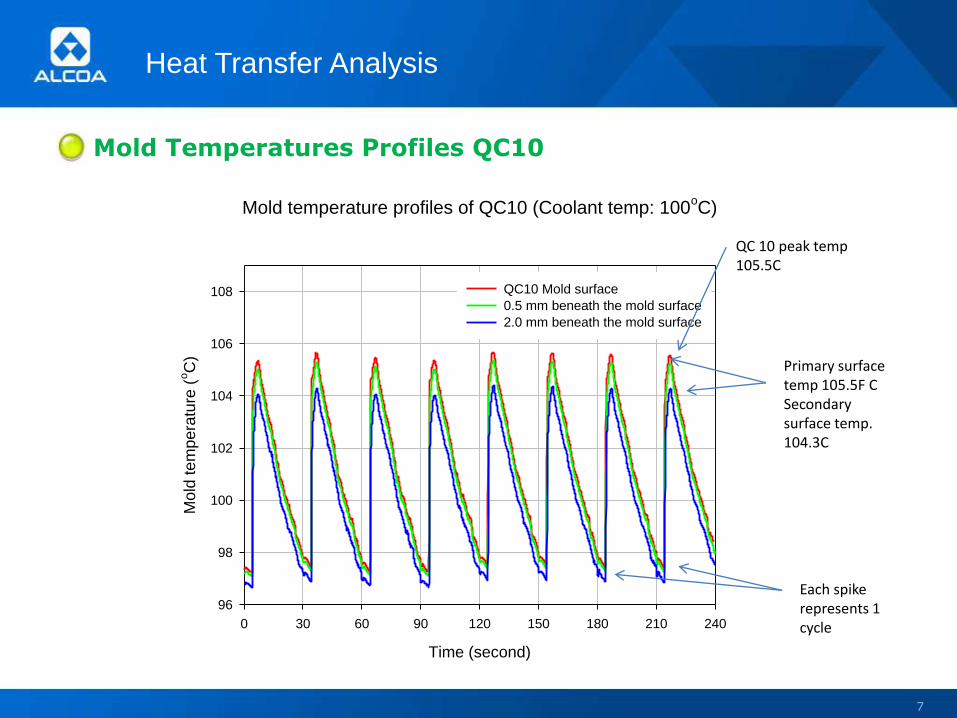
Mold Temperatures Profiles QC 10 (Next Slide)
Mold Coolant Temperature set at 100C
Primary Surface Temp (TC 1, exposed to the plastic melt)
105.5C, RED Graph
Secondary Surface Temp (TC 4, 2 mm distance from the cavity
surface) 104.3C, BLUE Graph
Temperature difference of 1.2 C
6
Heat Transfer Analysis
7
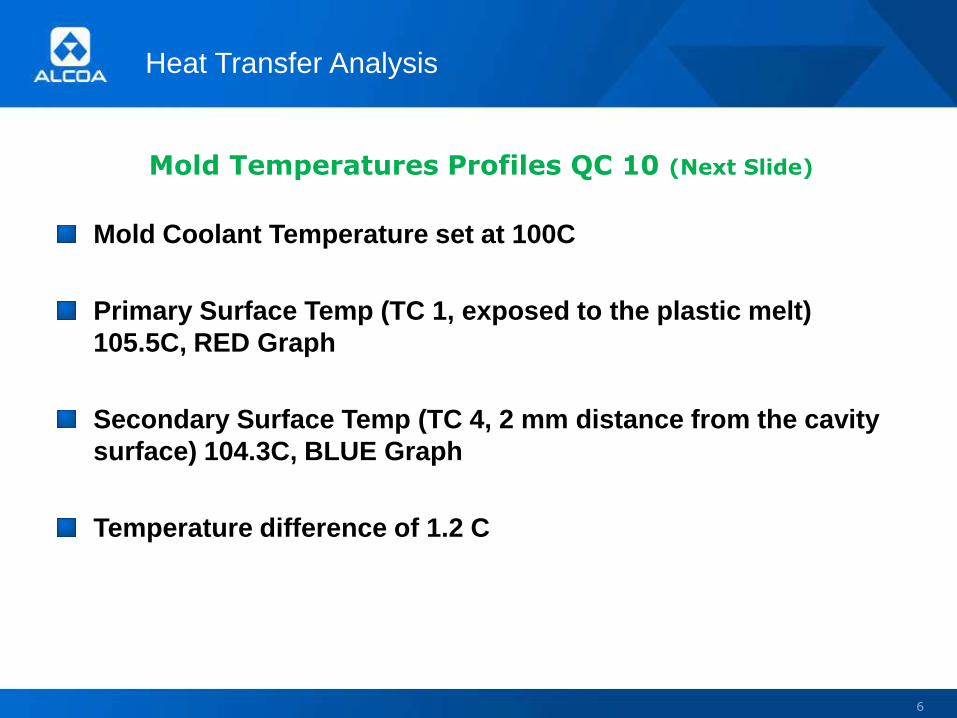
Mold Temperatures Profiles QC10
Mold temperature profiles of QC10 (Coolant temp: 100oC)
Time (second)
0 30 60 90 120 150 180 210 240
Mold
tem
pera
ture
(oC
)
96
98
100
102
104
106
108 QC10 Mold surface
0.5 mm beneath the mold surface
2.0 mm beneath the mold surface
QC 10 peak temp 105.5C
Primary surface temp 105.5F C Secondary surface temp. 104.3C
Each spike represents 1 cycle
Heat Transfer Analysis
Please Note to previous Slide (NAK 80)
Mold Coolant Temperature set at 100C
Primary Surface Temp (TC exposed to the plastic melt)
105.5C, RED
Secondary Surface Temp (TC 4, 2 mm away from the cavity surface)
104.3C, BLUE
Temperature difference of 1.2 C
Scenario proves:
LOW THERMAL RESISTANCE of QC 10
SUPERB HEAT DISSIPATION
ABILITY TO TRANSFER “VAST” HEAT OF INTERFACIAL
SURFACES
8
Heat Transfer Analysis
9
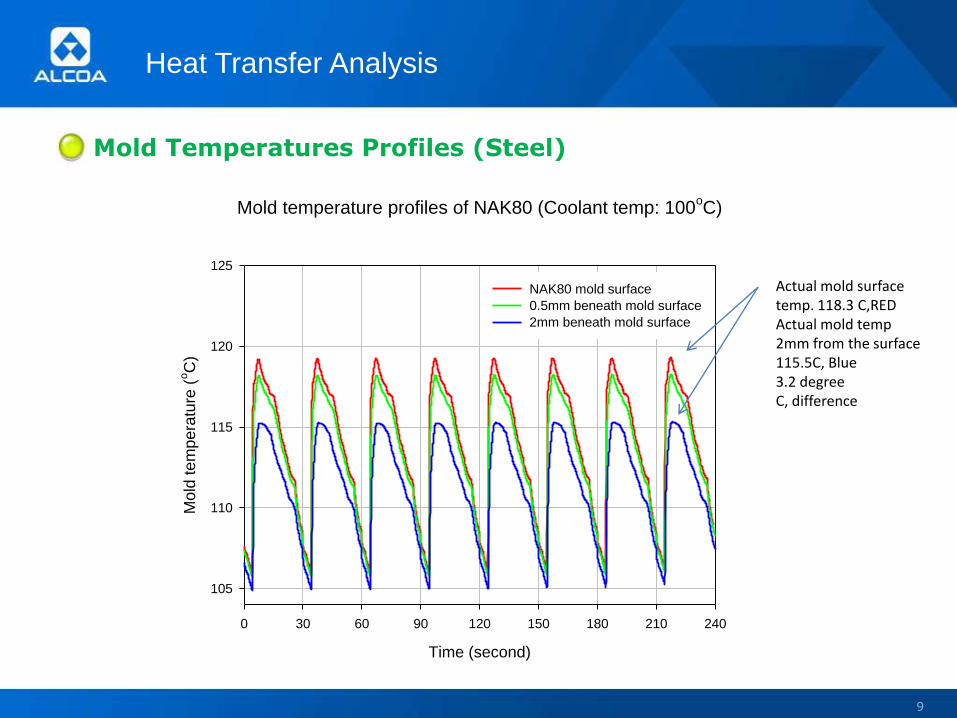
Mold Temperatures Profiles (Steel)
Mold temperature profiles of NAK80 (Coolant temp: 100oC)
Time (second)
0 30 60 90 120 150 180 210 240
Mold
tem
pera
ture
(oC
)
105
110
115
120
125
NAK80 mold surface
0.5mm beneath mold surface
2mm beneath mold surface
Actual mold surface temp. 118.3 C,REDActual mold temp 2mm from the surface115.5C, Blue3.2 degree C, difference
Heat Transfer Analysis
Please Note to previous Slide
Mold temperature is adjusted to 100C. Actual Mold Surface Temp is
at 118.3 C
Mold temperature 2mm beneath the surface is 115.5 C
This is proof that the a Steel mold (Cavity Surface) will run app. 12.8
degrees C hotter than the QC 10 Mold.
10
Heat Transfer Analysis
11
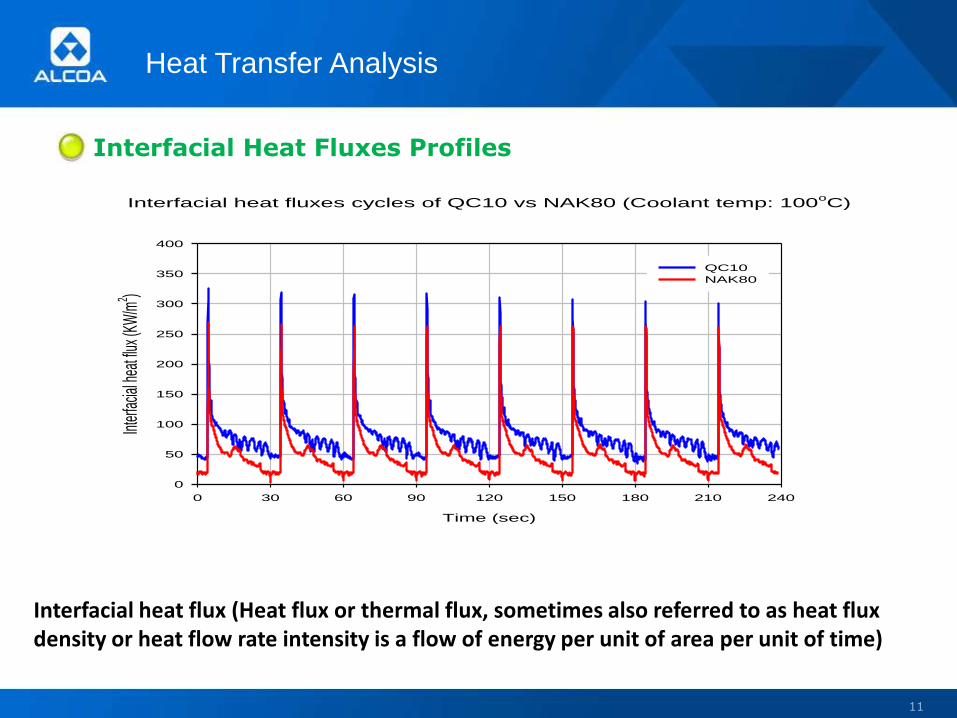
Interfacial Heat Fluxes Profiles
Interfacial heat fluxes cycles of QC10 vs NAK80 (Coolant temp: 100oC)
Time (sec)
0 30 60 90 120 150 180 210 240
Inte
rfacia
l hea
t flux
(KW
/m2 )
0
50
100
150
200
250
300
350
400
QC10
NAK80
Interfacial heat flux (Heat flux or thermal flux, sometimes also referred to as heat flux density or heat flow rate intensity is a flow of energy per unit of area per unit of time)
Heat Transfer Analysis
Note to Previous Slide:
Interfacial heat flux (Heat flux or thermal flux, sometimes also referred
to as heat flux density or heat flow rate intensity is a flow of energy per
unit of area per unit of time)
As indicated, at the beginning of Cycling the mold/machine the Blue QC
10 spike is at 325 KW/m/2) and after 7 cycles the heat flux indicates
300 KW/m/2.
Fact is that QC 10 removes heat faster during a startup of the
mold/machine resulting in quality parts much sooner then Steel Molds.
Max heat flux Steel mold is 275 KW/m/2.
12
Heat Transfer Analysis
13
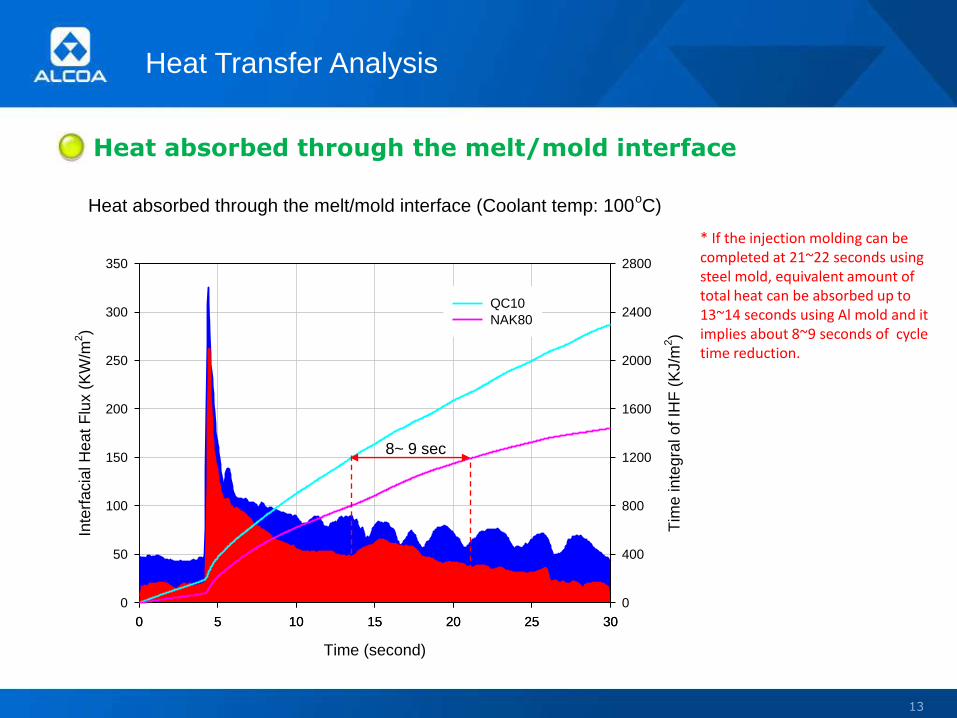
Heat absorbed through the melt/mold interface
Heat absorbed through the melt/mold interface (Coolant temp: 100oC)
Time (second)
0 5 10 15 20 25 30
Inte
rfa
cia
l H
ea
t F
lux (
KW
/m2)
0
50
100
150
200
250
300
350
0 5 10 15 20 25 30
Tim
e in
teg
ral o
f IH
F (
KJ/m
2)
0
400
800
1200
1600
2000
2400
2800
QC10
NAK80
* If the injection molding can be completed at 21~22 seconds using steel mold, equivalent amount of total heat can be absorbed up to 13~14 seconds using Al mold and it implies about 8~9 seconds of cycle time reduction.
8~ 9 sec
Heat Transfer Analysis
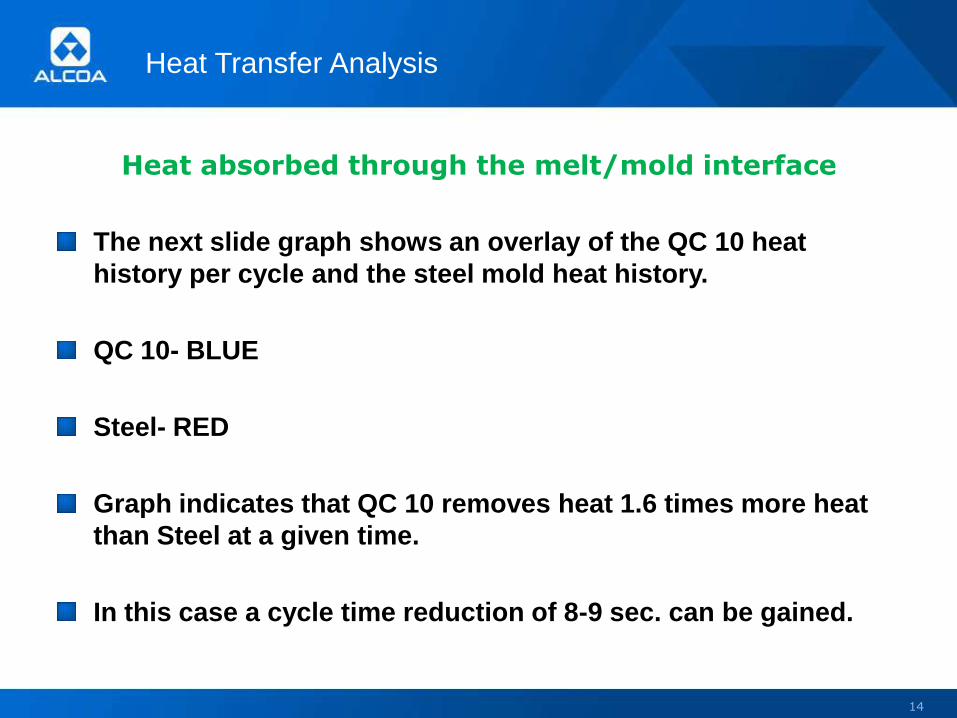
Heat absorbed through the melt/mold interface
The next slide graph shows an overlay of the QC 10 heat
history per cycle and the steel mold heat history.
QC 10- BLUE
Steel- RED
Graph indicates that QC 10 removes heat 1.6 times more heat
than Steel at a given time.
In this case a cycle time reduction of 8-9 sec. can be gained.
14
Heat Transfer Analysis
15
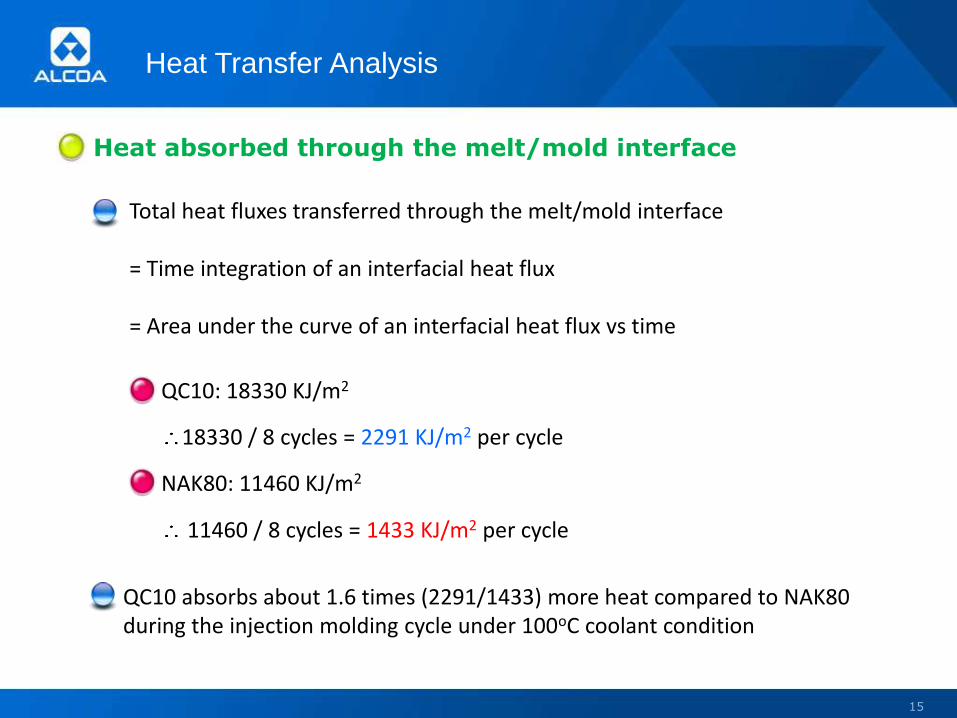
Heat absorbed through the melt/mold interface
Total heat fluxes transferred through the melt/mold interface
= Time integration of an interfacial heat flux
= Area under the curve of an interfacial heat flux vs time
QC10: 18330 KJ/m2
18330 / 8 cycles = 2291 KJ/m2 per cycle
NAK80: 11460 KJ/m2
11460 / 8 cycles = 1433 KJ/m2 per cycle
QC10 absorbs about 1.6 times (2291/1433) more heat compared to NAK80 during the injection molding cycle under 100oC coolant condition
Heat Transfer Analysis
16
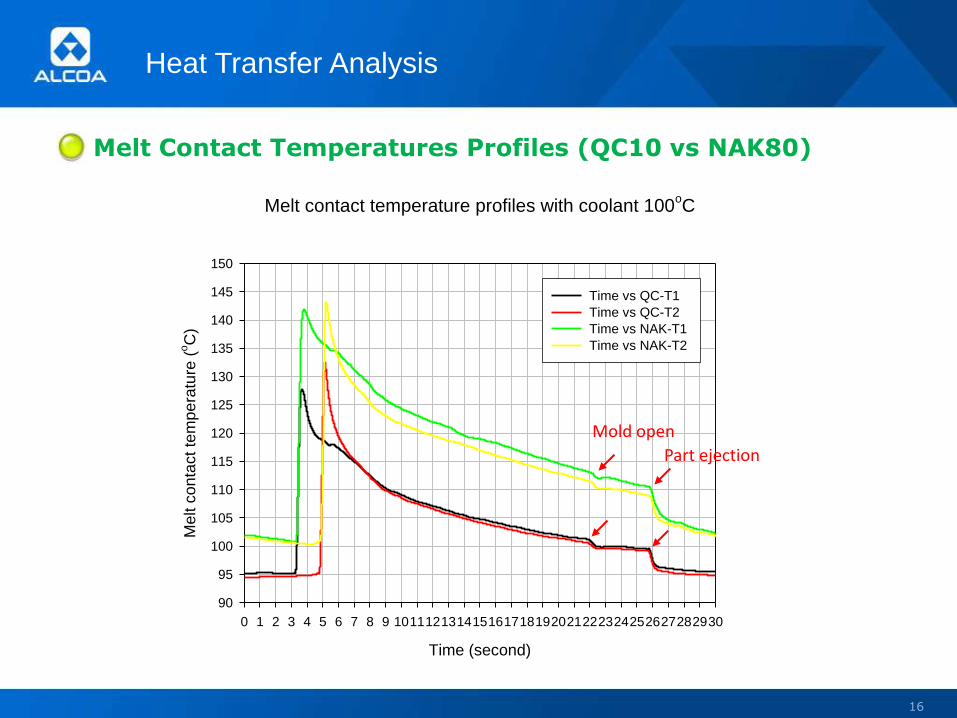
Melt Contact Temperatures Profiles (QC10 vs NAK80)
Melt contact temperature profiles with coolant 100oC
Time (second)
0 1 2 3 4 5 6 7 8 9 101112131415161718192021222324252627282930
Me
lt c
on
tact te
mp
era
ture
(oC
)
90
95
100
105
110
115
120
125
130
135
140
145
150
Time vs QC-T1
Time vs QC-T2
Time vs NAK-T1
Time vs NAK-T2
Mold open
Part ejection
Heat Transfer Analysis
The next Power point slide clearly demonstrates on how the melt-front temperature will decline faster during injection into QC 10 molds. Upon inject the plastic melt will be in contact with the T1 Thermocouple after 3.2 sec. at 128 C. The steel mold Graph (Green) T1 Thermocouple shows 140C after 3.2 sec of inject time.
Considering that the total fill time of this part is 5.5 sec is rather slow and under normal circumstances the fill speed would be faster also resulting in faster fill time.
Fact is that the QC 10 LOW Interfacial heat resistance (High Conductivity) will remove heat from the plastic melt even during Injecting and NOT only during the Cooling time of the part.
It is important to counter act this fast cooling phenomena of QC 10 by using slightly faster fill speeds and slightly elevated mold temperatures to counteract surface blemishes caused by fast Injection/melt/solidification.
However, even with slightly higher mold set temperatures (app. 10 degrees) the plastics solidification will occur at a faster rate then with steel molds, therefore result is faster melt solidification and shorter cooling/ cycle times.
17
Heat Transfer Analysis
18
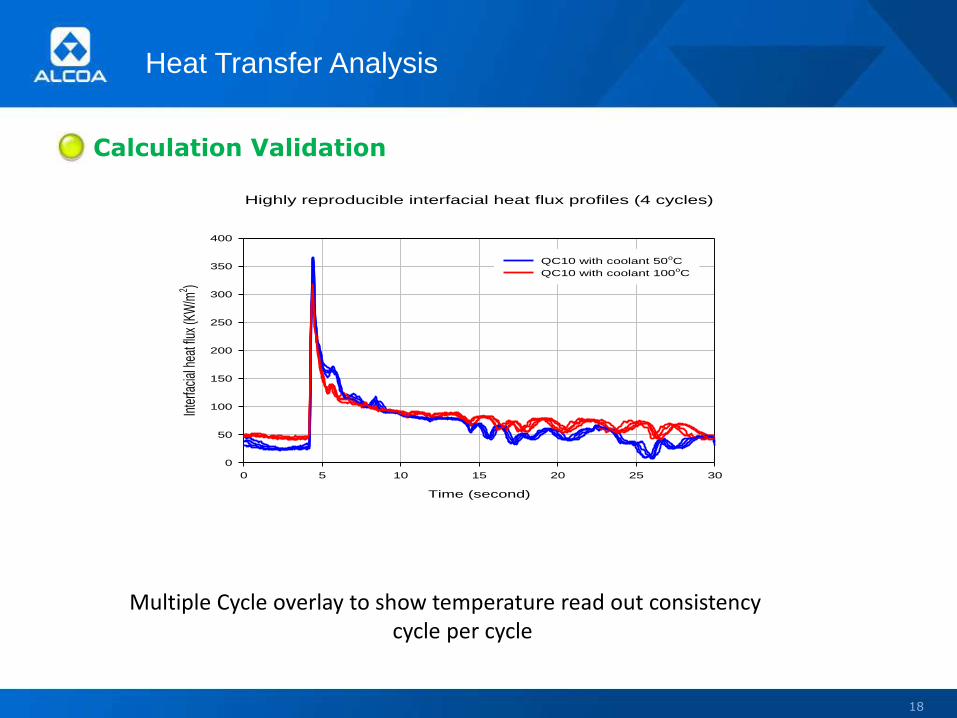
Calculation Validation
Highly reproducible interfacial heat flux profiles (4 cycles)
Time (second)
0 5 10 15 20 25 30
Inte
rfaci
al h
eat f
lux
(KW
/m2 )
0
50
100
150
200
250
300
350
400
QC10 with coolant 50oC
QC10 with coolant 100oC
Multiple Cycle overlay to show temperature read out consistency cycle per cycle
Conclusion
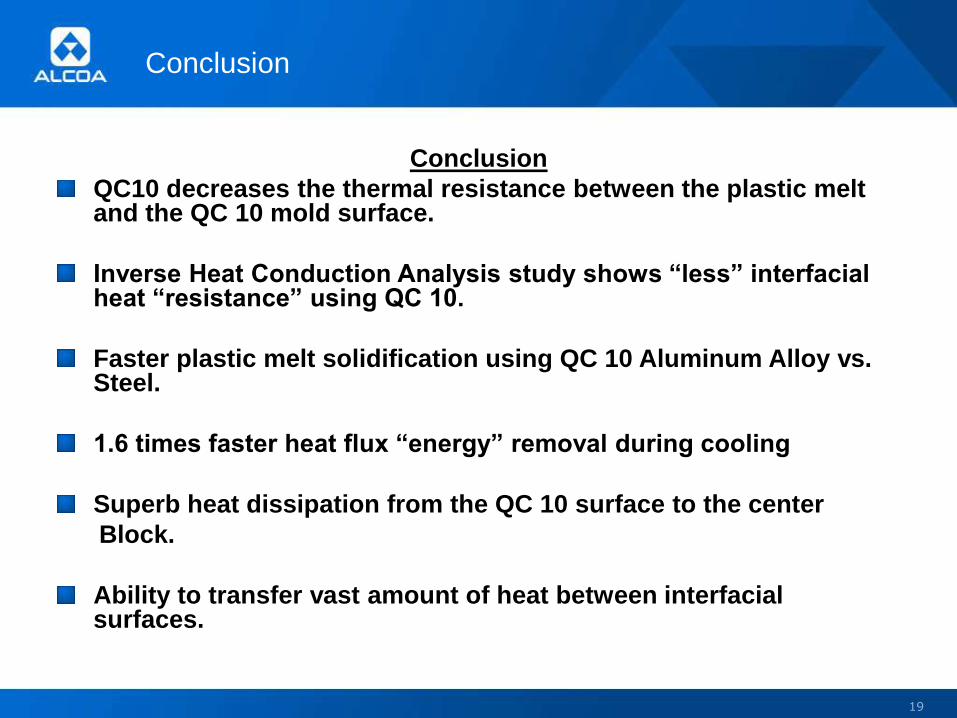
Conclusion
QC10 decreases the thermal resistance between the plastic melt and the QC 10 mold surface.
Inverse Heat Conduction Analysis study shows “less” interfacial heat “resistance” using QC 10.
Faster plastic melt solidification using QC 10 Aluminum Alloy vs. Steel.
1.6 times faster heat flux “energy” removal during cooling
Superb heat dissipation from the QC 10 surface to the center
Block.
Ability to transfer vast amount of heat between interfacial surfaces.
19

Thank you.
Mike Kraemer
Application Engineer (Mold Block)
1600 Harvard Ave.
Cleveland, OH. 44105
Phone: 216 641 5521
Mobile: 216 406 2630
E mail: [email protected]
20