Embed Size (px)
DESCRIPTION
IELTS Academic Task 1 is describing a graph, table or process. In this tutorial from www.ieltspodcast.com, I describe an easy 3 step process to help in your preparation.
Citation preview
FOR IELTS
HOW TO DESCRIBE A
PIE CHART


CONTENTS
1. LANGUAGE 2. TIPS3. EASY TEMPLATE
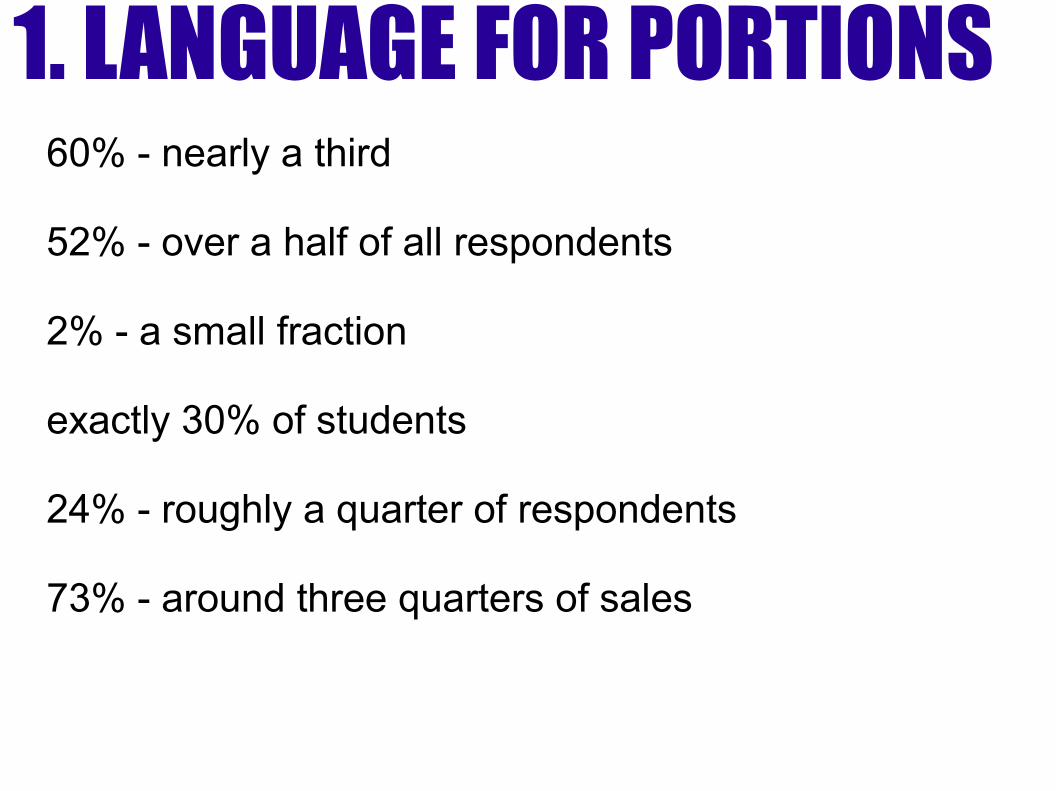
1. LANGUAGE FOR PORTIONS60% - nearly a third
52% - over a half of all respondents
2% - a small fraction
exactly 30% of students
24% - roughly a quarter of respondents
73% - around three quarters of sales
1. UNIVERSAL LANGUAGE
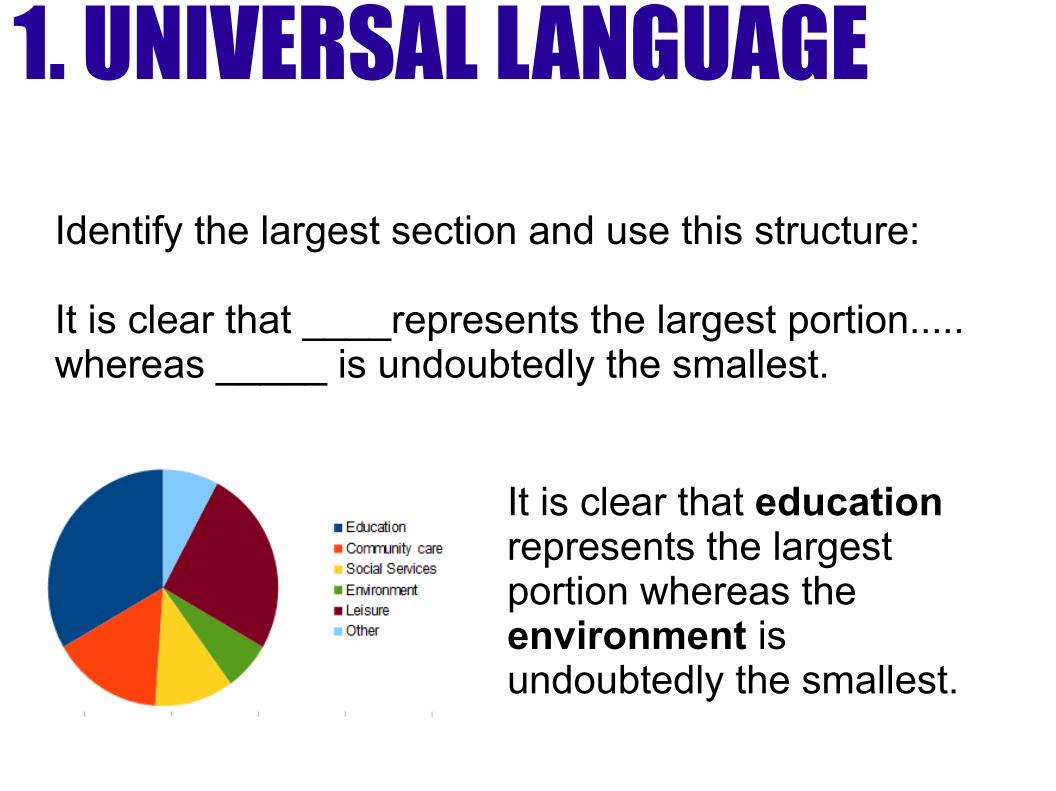
Identify the largest section and use this structure:
It is clear that ____represents the largest portion..... whereas _____ is undoubtedly the smallest.
It is clear that education represents the largest portion whereas the environment is undoubtedly the smallest.
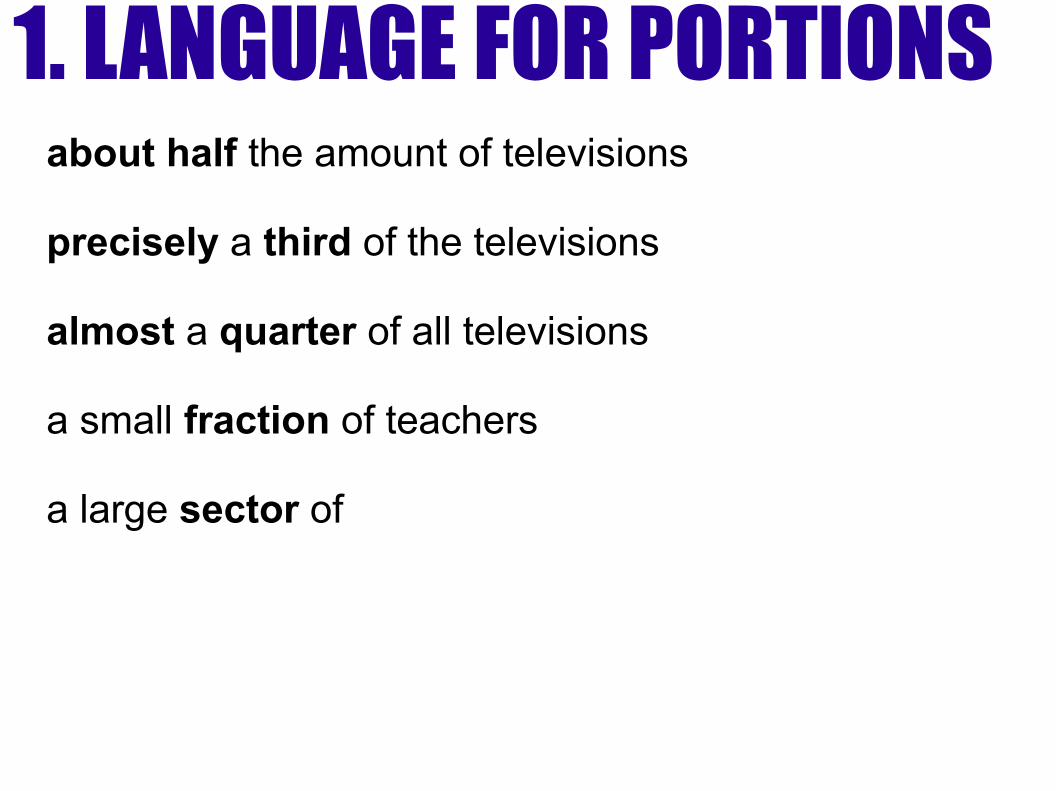
1. LANGUAGE FOR PORTIONSabout half the amount of televisions
precisely a third of the televisions
almost a quarter of all televisions
a small fraction of teachers
a large sector of
1. LANGUAGE FOR COMPARISONS
...twice as many people prefer...
...nearly four times as many people...
...whereas sales for X were just 10%
In 1955 approximately three quarters were male.... whereas in 1960 this had fallen to just under a fifth.
1. LANGUAGE FOR SUMMARISING
Overall amongst the six regions, ____ make up the largest expenses, followed by ____ representing the lowest.
To summarise the most marked change is...
Overall it is clear the amount of...
Overall the majority of the countries experienced
In all countries observed,

2. TIPS
2. TIPS-Sometimes you cannot compare the info, in this case a summary of each picture is fine.
-Avoid stating opinions, if the graph shows rising prices and you know it's because of a war in the middle east, it doesn't matter. FORGET IT.
-Check the time frame and use the appropriate tense, past, present or future?
-If possible use a passive construction.
-Focus on getting the appropriate data from the graph into your writing.
2. TIPS: PARAPHRASEParagraph 1 = One sentence: Explain what the graph shows. Paraphrase the title.
PIE CHART TITLE:
Holiday destinations chosen by Welsh people 1955-2005
YOUR FIRST SENTENCE:
The pie chart shows the vacation preferences of Welsh people over a fifty year period starting in 1955 and finishing in 2005.
2. TIPS: THREE STEP PREPStep 1 PREPARE:
Look for the biggest and smallest sections.
Quick analysis, times, dates, tenses, measurements.
See the big picture: avoid getting lost in the details – it is a summarising task
Select and report the main features.
2. TIPS: THREE STEP PREPStep 2. ORGANISE INTO 2 PARAGRAHS
-Major trends-Major groups-Exceptions -Group information -Group similar ideas together
2. TIPS: THREE STEP PREPStep 3. WRITE ESSAY USING TEMPLATE AND PLAN
-Remember to check for errors.
-Follow your essay plan -DO NOT DEVIATE (deviation =loosing time, panic, etc.)

3. EASY TEMPLATE
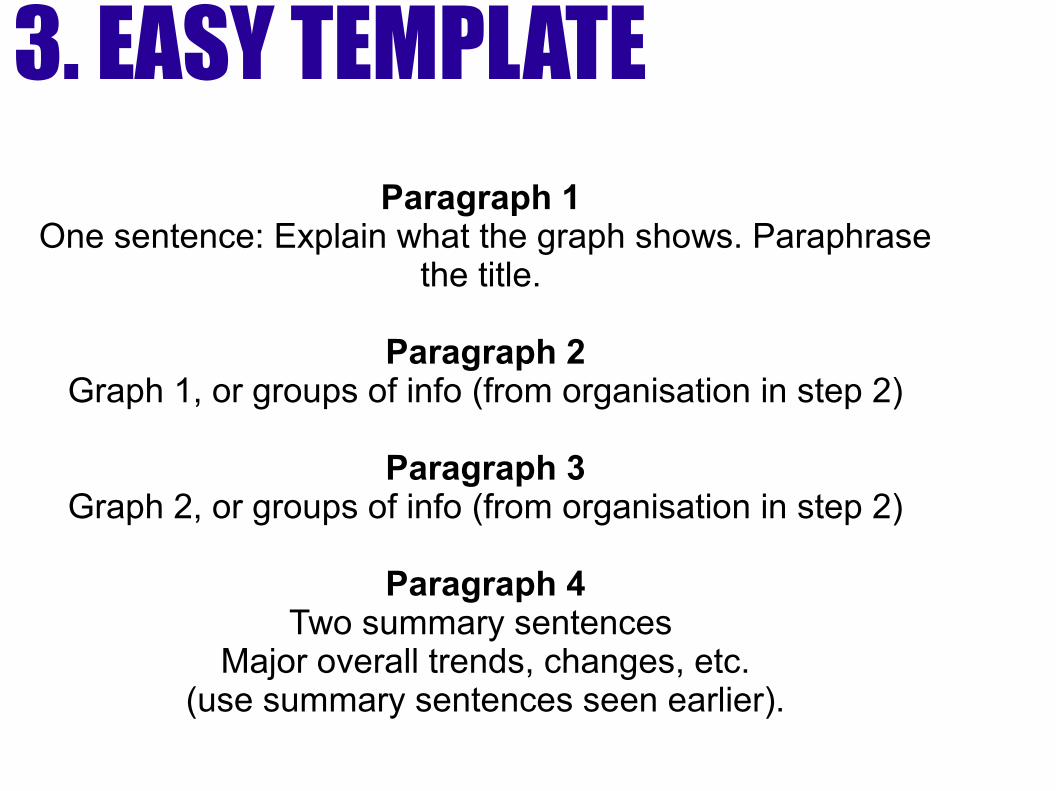
3. EASY TEMPLATEParagraph 1
One sentence: Explain what the graph shows. Paraphrase the title.
Paragraph 2Graph 1, or groups of info (from organisation in step 2)
Paragraph 3Graph 2, or groups of info (from organisation in step 2)
Paragraph 4Two summary sentences
Major overall trends, changes, etc.(use summary sentences seen earlier).

PASS IELTS WITH A HIGH SCORE
This guide is adapted from dcielts.com (clickable link). Dominic Cole has one of the best IELTS sites on the net, so go check it out.
Also, to pass the IELTS with a high score I strongly recommend visiting IELTSPodcast.com and signing up to the weekly newsletter.
You will be sent valuable resources that will improve your writing.
You will also get my personal email so you can send me any IELTS question you want.