Embed Size (px)
Citation preview

1
How to Leverage Technology to Exceed Compliance and Make Breakthrough Impact
Rob Buelow, Vice President of Prevention Education
Lisa Haubenstock, Vice President of Customer Success
2
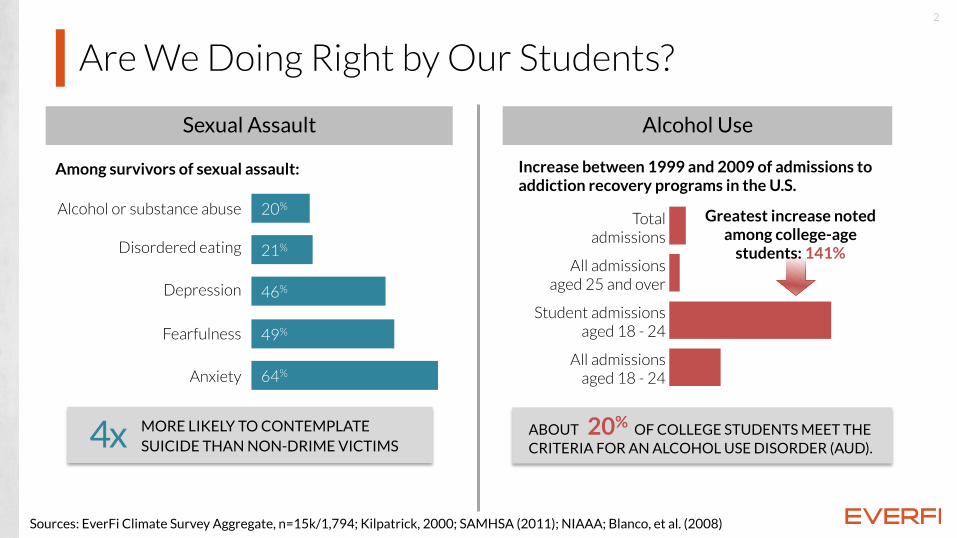
Sources: EverFi Climate Survey Aggregate, n=15k/1,794; Kilpatrick, 2000; SAMHSA (2011); NIAAA; Blanco, et al. (2008)
Are We Doing Right by Our Students?
20%
21%
46%
49%
64%
Alcohol or substance abuse
Disordered eating
Depression
Fearfulness
Anxiety
Sexual Assault
MORE LIKELY TO CONTEMPLATE SUICIDE THAN NON-DRIME VICTIMS4x
Alcohol Use
All admissions aged 18 - 24
Student admissions aged 18 - 24
All admissions aged 25 and over
Total admissions
Increase between 1999 and 2009 of admissions to addiction recovery programs in the U.S.
Greatest increase noted among college-age
students: 141%
ABOUT 20% OF COLLEGE STUDENTS MEET THE CRITERIA FOR AN ALCOHOL USE DISORDER (AUD).
Among survivors of sexual assault:
3
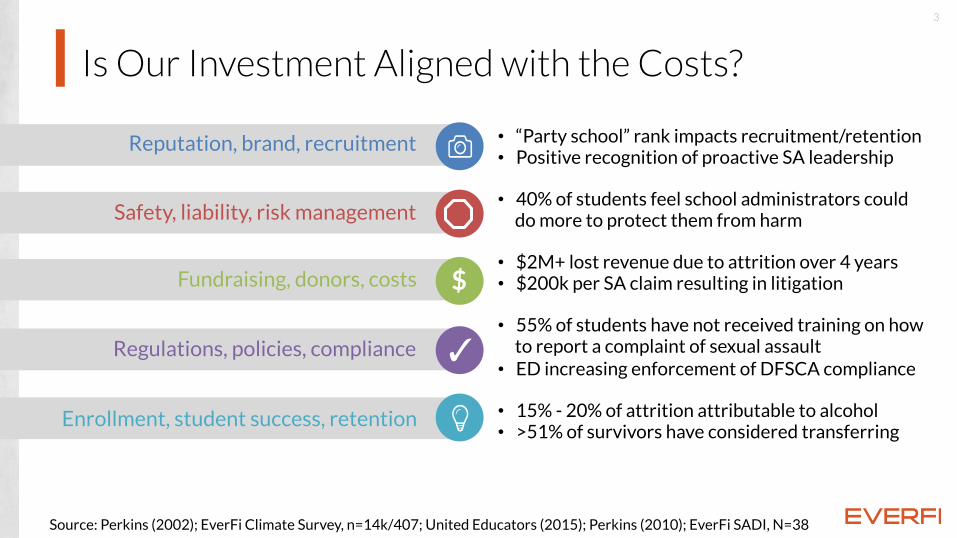
Is Our Investment Aligned with the Costs?
Reputation, brand, recruitment
Safety, liability, risk management
$Fundraising, donors, costs
✓Regulations, policies, compliance
Enrollment, student success, retention
Source: Perkins (2002); EverFi Climate Survey, n=14k/407; United Educators (2015); Perkins (2010); EverFi SADI, N=38
• “Party school” rank impacts recruitment/retention• Positive recognition of proactive SA leadership
• 40% of students feel school administrators could do more to protect them from harm
• $2M+ lost revenue due to attrition over 4 years• $200k per SA claim resulting in litigation
• 55% of students have not received training on how to report a complaint of sexual assault
• ED increasing enforcement of DFSCA compliance
• 15% - 20% of attrition attributable to alcohol• >51% of survivors have considered transferring
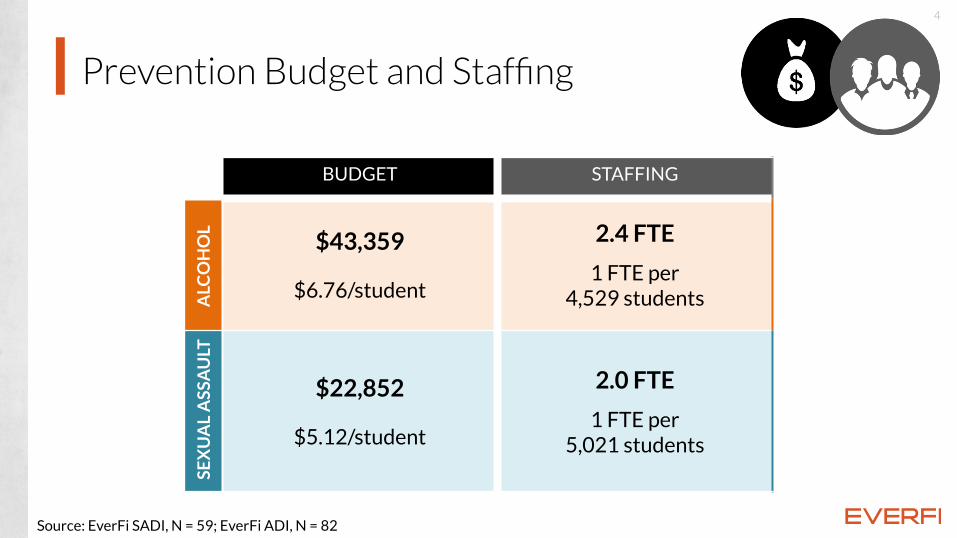
Prevention Budget and Staffing
4
BUDGET STAFFING
$43,359
$6.76/student
2.4 FTE
1 FTE per4,529 students
$22,852
$5.12/student
2.0 FTE
1 FTE per5,021 students
ALC
OH
OL
SEX
UA
L A
SSA
ULT
$$
Source: EverFi SADI, N = 59; EverFi ADI, N = 82

5
CLOSE LAPTOPS, TURN OFF PHONES
6
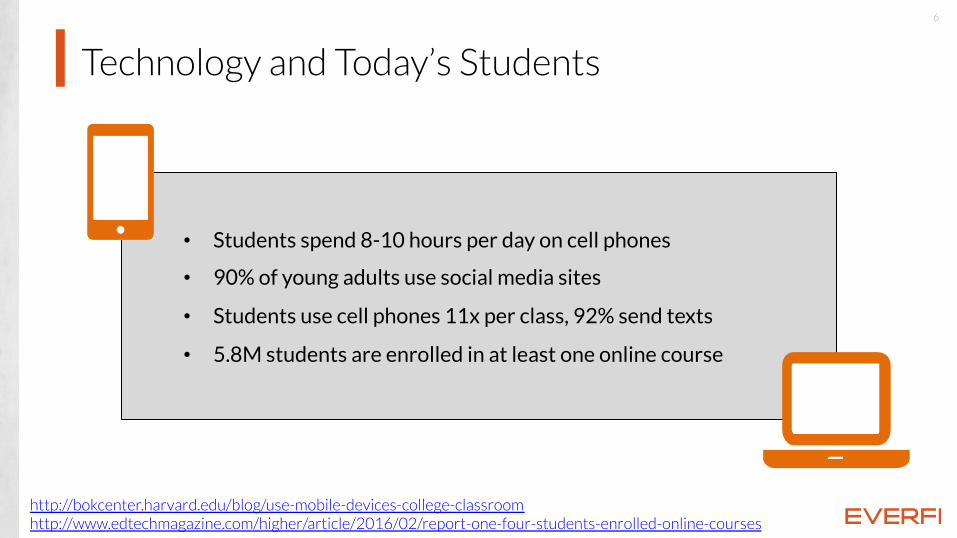
Technology and Today’s Students
http://bokcenter.harvard.edu/blog/use-mobile-devices-college-classroomhttp://www.edtechmagazine.com/higher/article/2016/02/report-one-four-students-enrolled-online-courses
• Students spend 8-10 hours per day on cell phones
• 90% of young adults use social media sites
• Students use cell phones 11x per class, 92% send texts
• 5.8M students are enrolled in at least one online course
7
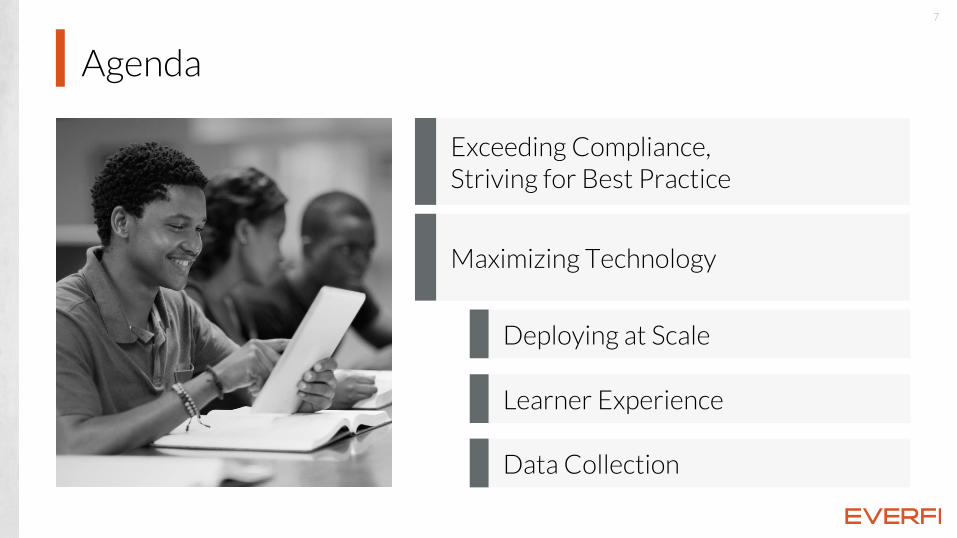
Agenda
Exceeding Compliance, Striving for Best Practice
Maximizing Technology
Deploying at Scale
Learner Experience
Data Collection
8
EXCEEDING COMPLIANCE, STRIVING FOR BEST PRACTICE
9
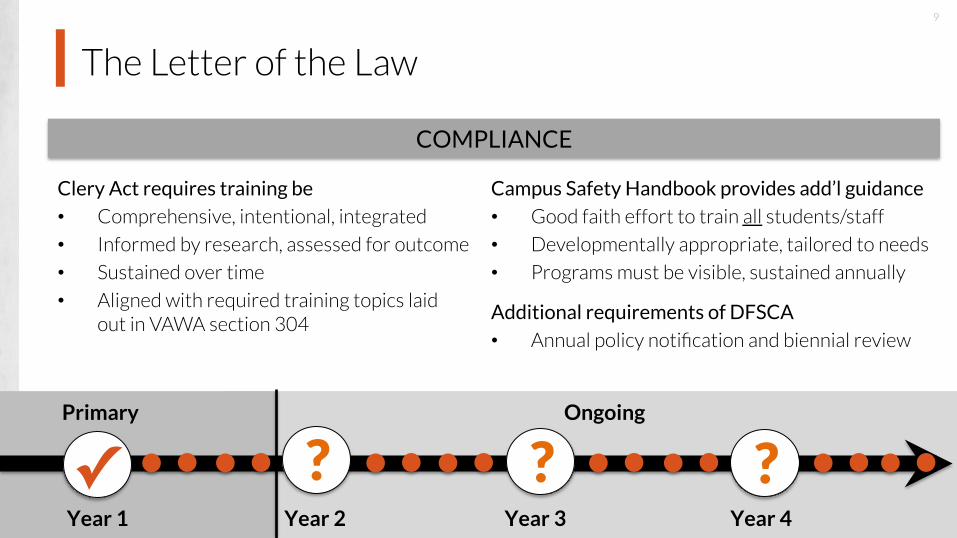
The Letter of the Law
Clery Act requires training be
• Comprehensive, intentional, integrated
• Informed by research, assessed for outcome
• Sustained over time
• Aligned with required training topics laid out in VAWA section 304
Campus Safety Handbook provides add’l guidance
• Good faith effort to train all students/staff
• Developmentally appropriate, tailored to needs
• Programs must be visible, sustained annually
Additional requirements of DFSCA
• Annual policy notification and biennial review
COMPLIANCE
Primary
Year 1 Year 4
Ongoing
✓ Year 2
?Year 3
? ?
10
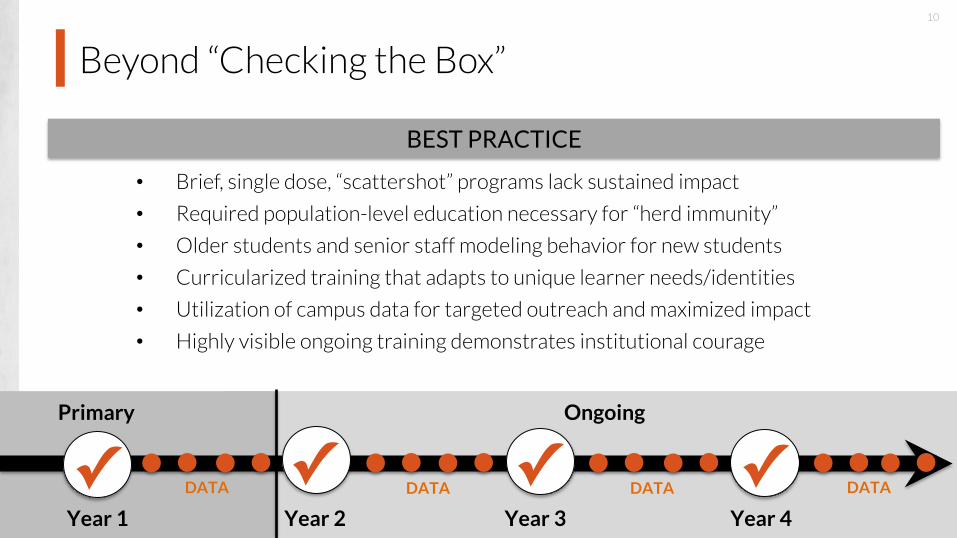
Beyond “Checking the Box”
• Brief, single dose, “scattershot” programs lack sustained impact
• Required population-level education necessary for “herd immunity”
• Older students and senior staff modeling behavior for new students
• Curricularized training that adapts to unique learner needs/identities
• Utilization of campus data for targeted outreach and maximized impact
• Highly visible ongoing training demonstrates institutional courage
Primary
DATA
Year 1 Year 2 Year 3 Year 4
DATA DATA DATA
Ongoing
✓ ✓ ✓ ✓
BEST PRACTICE
11
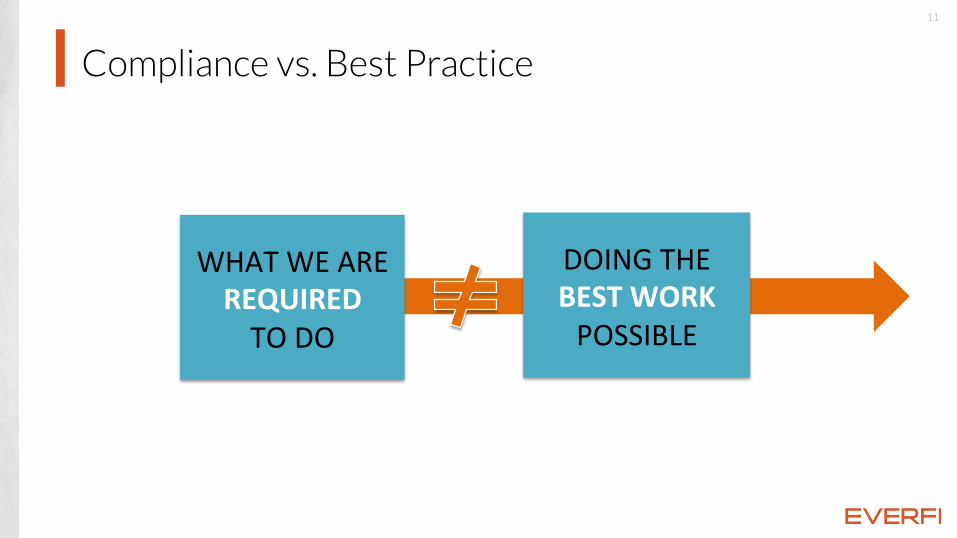
Compliance vs. Best Practice
WHAT WE ARE REQUIRED TO DO
DOING THE BEST WORK POSSIBLE
12
THE CHALLENGES WE FACE
13
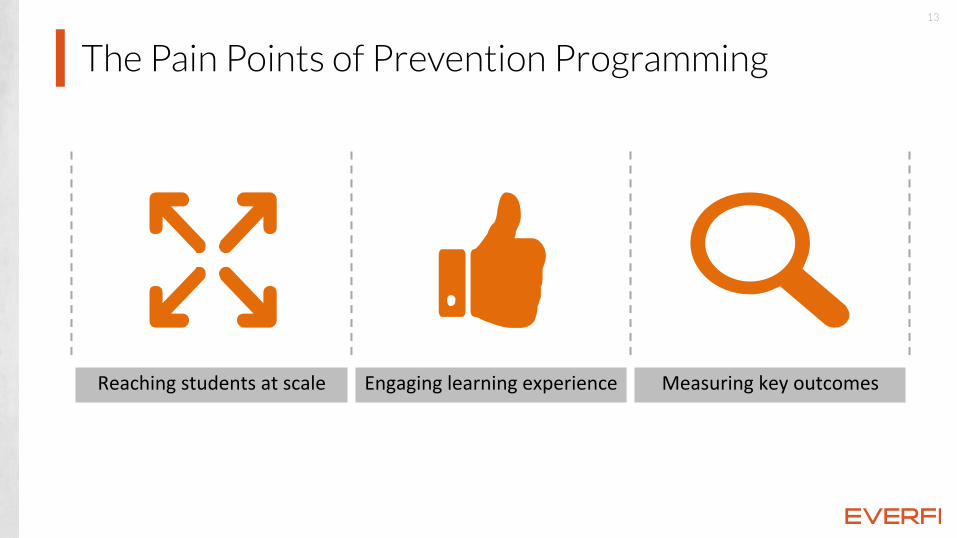
The Pain Points of Prevention Programming
Reaching students at scale Engaging learning experience Measuring key outcomes
14
MAXIMIZING TECHNOLOGY TO DEPLOY TRAININGS AT SCALE
15
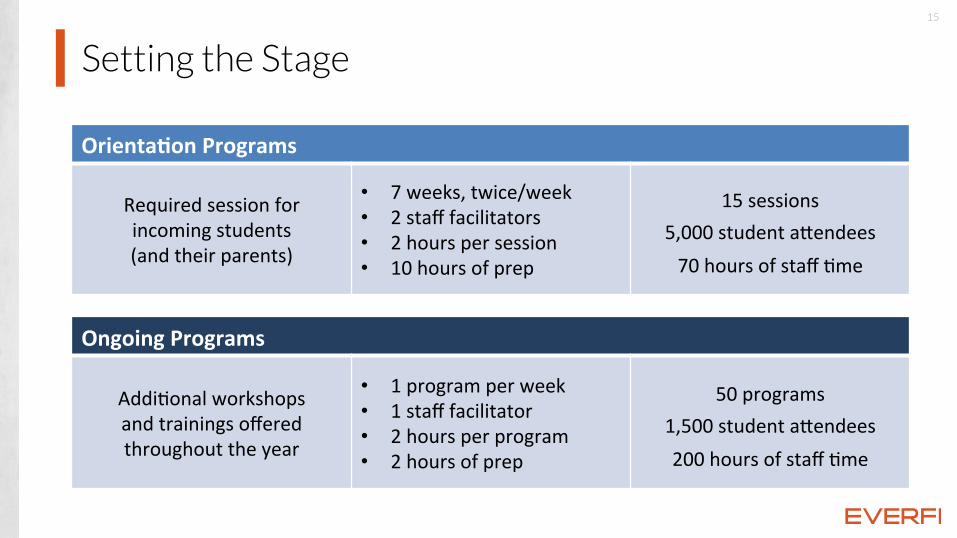
Setting the Stage
Orienta4on Programs
Required session for incoming students (and their parents)
• 7 weeks, twice/week • 2 staff facilitators • 2 hours per session • 10 hours of prep
15 sessions 5,000 student aRendees 70 hours of staff Sme
Ongoing Programs
AddiSonal workshops and trainings offered throughout the year
• 1 program per week • 1 staff facilitator • 2 hours per program • 2 hours of prep
50 programs 1,500 student aRendees 200 hours of staff Sme
16
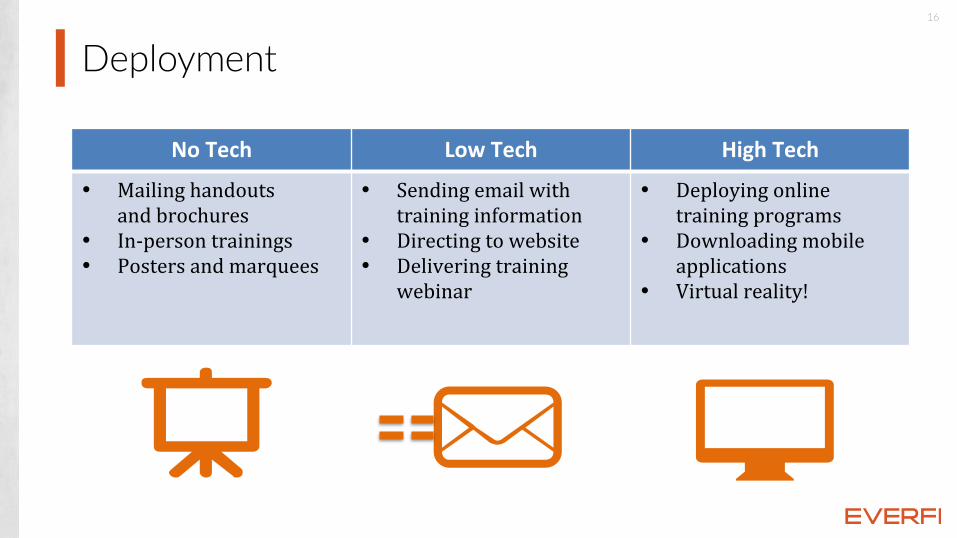
Deployment
No Tech Low Tech High Tech
• Mailing handouts and brochures
• In-‐person trainings • Posters and marquees
• Sending email with training information
• Directing to website • Delivering training
webinar
• Deploying online training programs
• Downloading mobile applications
• Virtual reality!
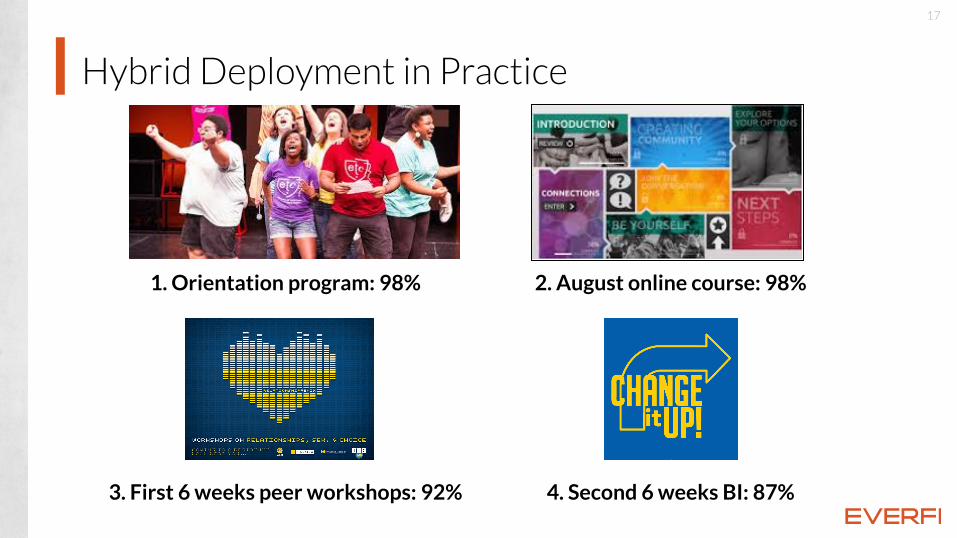
1. Orientation program: 98% 2. August online course: 98%
3. First 6 weeks peer workshops: 92% 4. Second 6 weeks BI: 87%
Hybrid Deployment in Practice
17
18
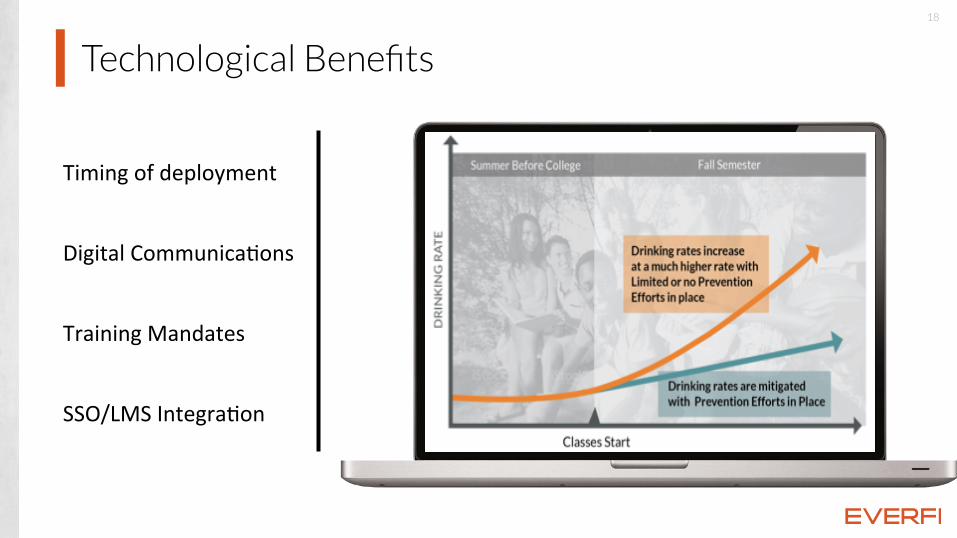
Technological Benefits
Timing of deployment
Digital CommunicaSons
Training Mandates
SSO/LMS IntegraSon
19
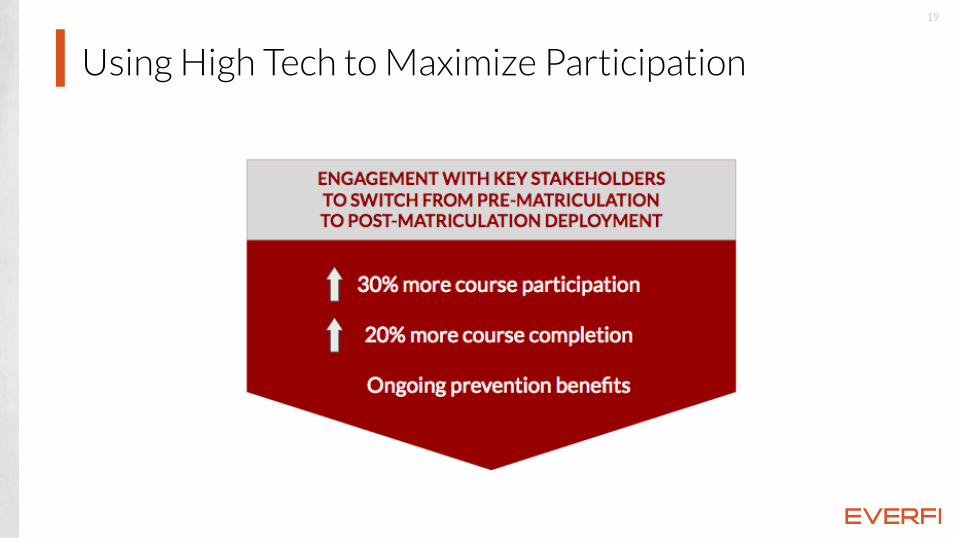
Using High Tech to Maximize Participation
20
MAXIMIZING TECHNOLOGY TO ENHANCE THE LEARNER EXPERIENCE
21
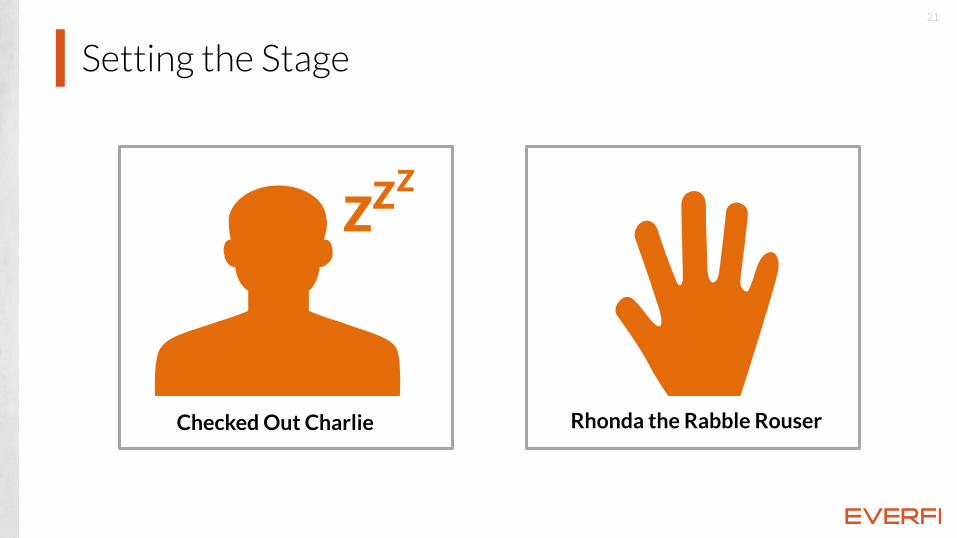
Setting the Stage
ZZZ
Checked Out Charlie Rhonda the Rabble Rouser
22
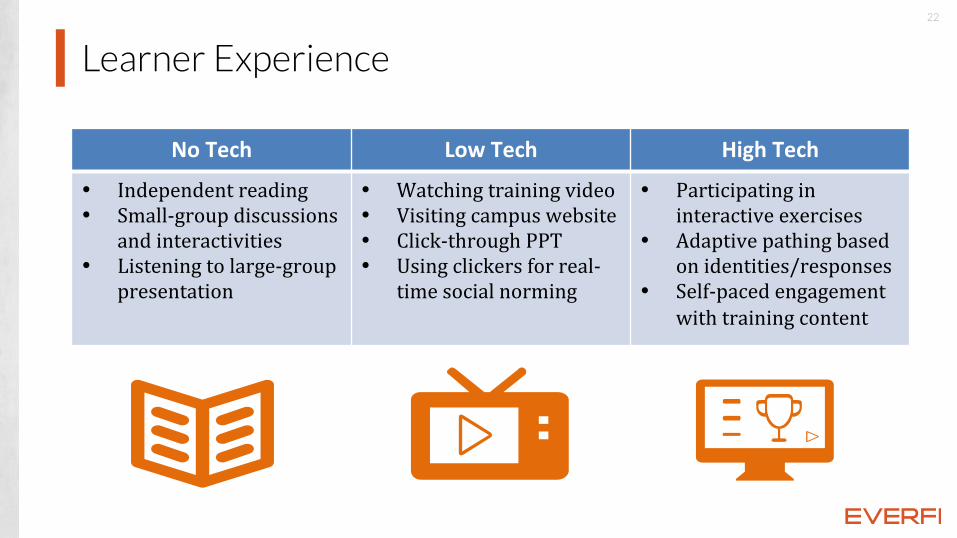
Learner Experience
No Tech Low Tech High Tech
• Independent reading • Small-‐group discussions
and interactivities • Listening to large-‐group
presentation
• Watching training video • Visiting campus website • Click-‐through PPT • Using clickers for real-‐
time social norming
• Participating in interactive exercises
• Adaptive pathing based on identities/responses
• Self-‐paced engagement with training content
23
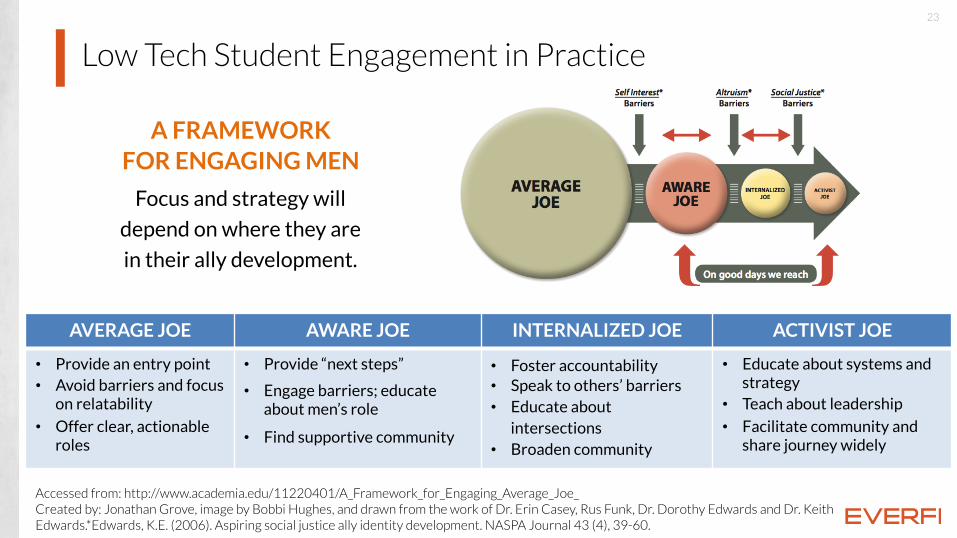
Low Tech Student Engagement in Practice
Focus and strategy will
depend on where they are
in their ally development.
A FRAMEWORK FOR ENGAGING MEN
AVERAGE JOE AWARE JOE INTERNALIZED JOE ACTIVIST JOE
• Provide an entry point• Avoid barriers and focus
on relatability
• Offer clear, actionable roles
• Provide “next steps”
• Engage barriers; educate about men’s role
• Find supportive community
• Foster accountability• Speak to others’ barriers• Educate about
intersections• Broaden community
• Educate about systems and strategy
• Teach about leadership
• Facilitate community and share journey widely
Accessed from: http://www.academia.edu/11220401/A_Framework_for_Engaging_Average_Joe_Created by: Jonathan Grove, image by Bobbi Hughes, and drawn from the work of Dr. Erin Casey, Rus Funk, Dr. Dorothy Edwards and Dr. Keith Edwards.*Edwards, K.E. (2006). Aspiring social justice ally identity development. NASPA Journal 43 (4), 39-60.
24
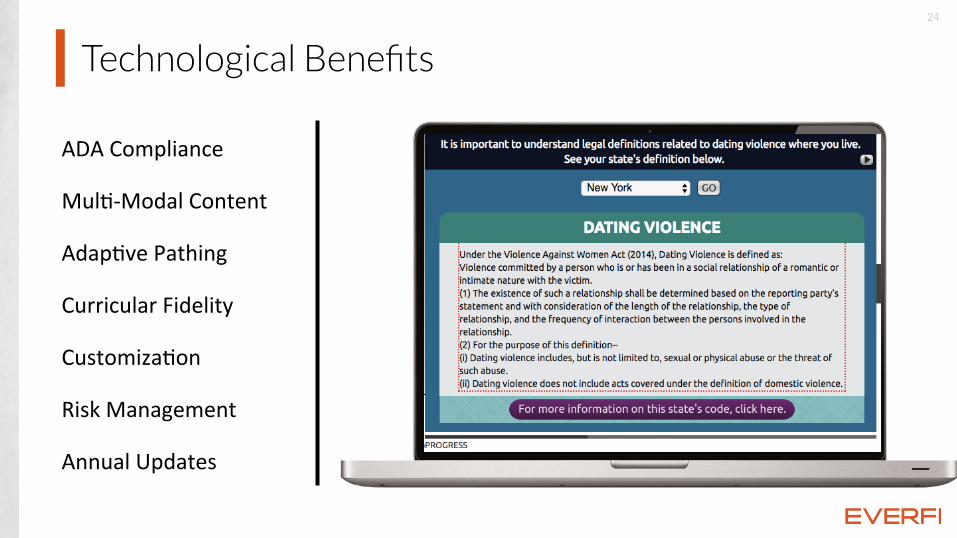
Technological Benefits
ADA Compliance
MulS-‐Modal Content
AdapSve Pathing
Curricular Fidelity
CustomizaSon
Risk Management
Annual Updates
25
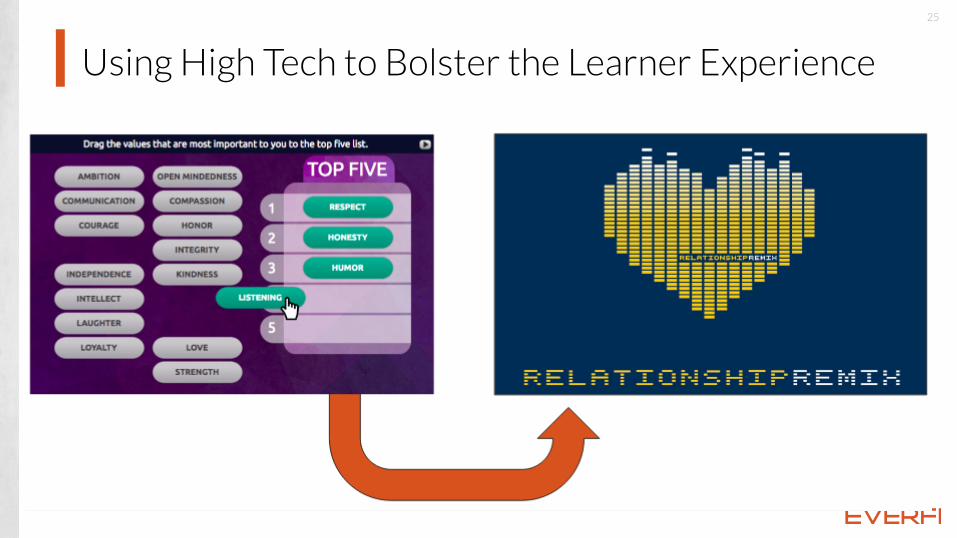
Using High Tech to Bolster the Learner Experience
26
MAXIMIZING TECHNOLOGY TO TRACK, REPORT AND EVALUATE EFFORTS
27
Setting the Stage
Thank You Word on the Street
28
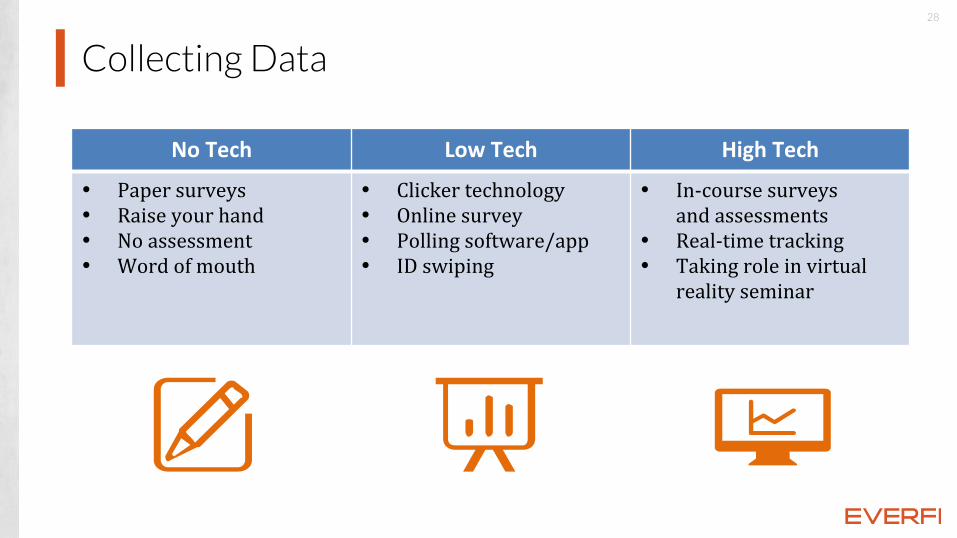
Collecting Data
No Tech Low Tech High Tech
• Paper surveys • Raise your hand • No assessment • Word of mouth
• Clicker technology • Online survey • Polling software/app • ID swiping
• In-‐course surveys and assessments
• Real-‐time tracking • Taking role in virtual
reality seminar
29
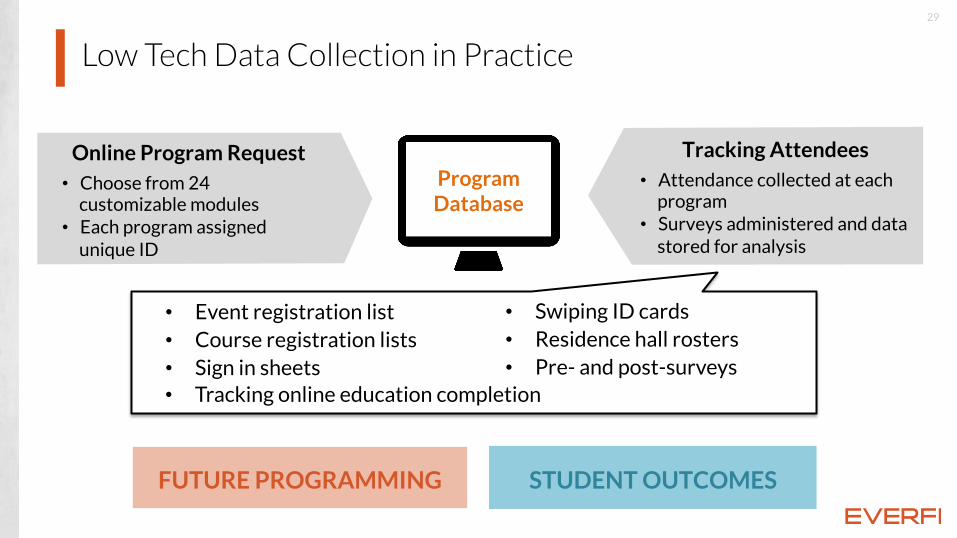
Low Tech Data Collection in Practice
Online Program Request• Choose from 24
customizable modules• Each program assigned
unique ID
Tracking Attendees• Attendance collected at each
program• Surveys administered and data
stored for analysis
FUTURE PROGRAMMING STUDENT OUTCOMES
• Event registration list • Course registration lists • Sign in sheets
• Swiping ID cards• Residence hall rosters• Pre- and post-surveys
• Tracking online education completion
ProgramDatabase
30
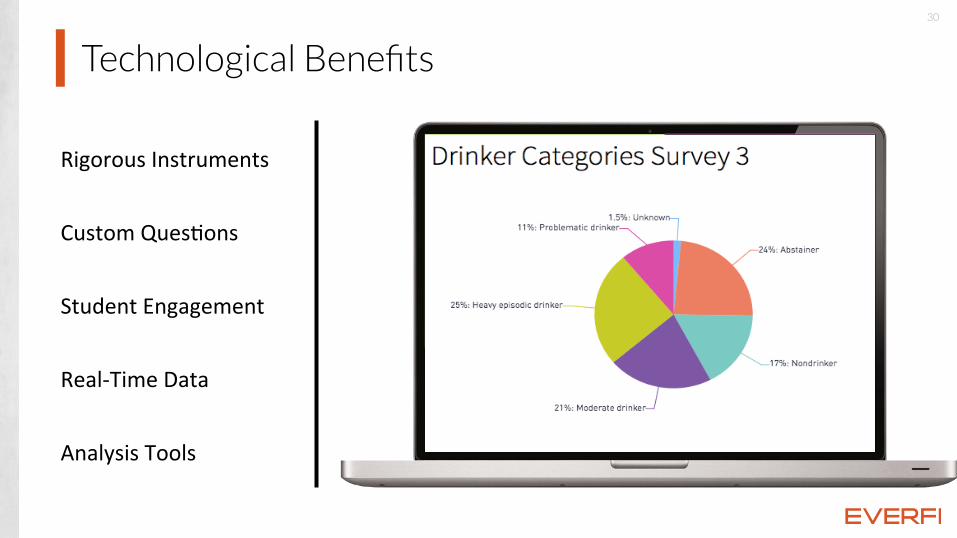
Technological Benefits
Rigorous Instruments
Custom QuesSons
Student Engagement
Real-‐Time Data
Analysis Tools
31
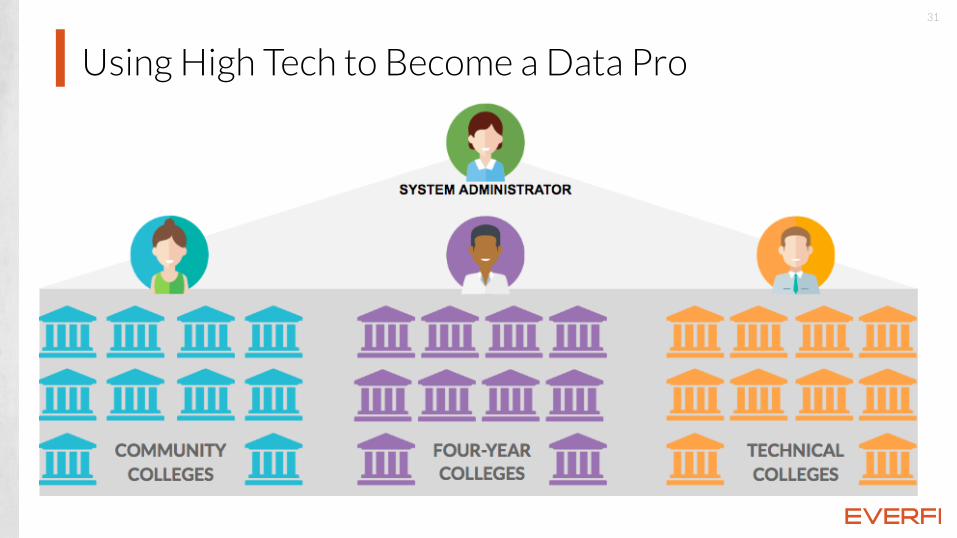
Using High Tech to Become a Data Pro

32
KEY TAKEAWAYS
33
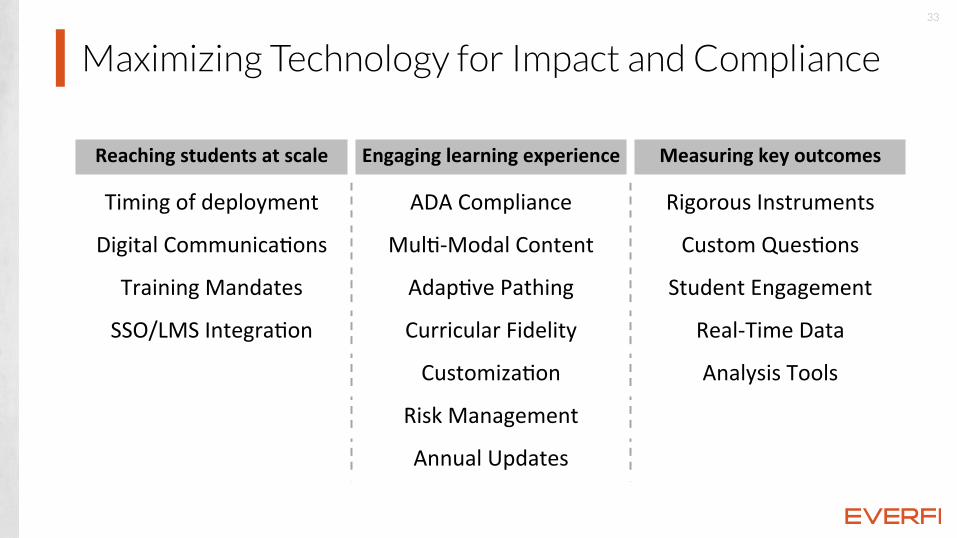
Maximizing Technology for Impact and Compliance
Reaching students at scale Engaging learning experience Measuring key outcomes
Timing of deployment ADA Compliance Rigorous Instruments
Digital CommunicaSons MulS-‐Modal Content Custom QuesSons
Training Mandates AdapSve Pathing Student Engagement
SSO/LMS IntegraSon Curricular Fidelity Real-‐Time Data
CustomizaSon Analysis Tools
Risk Management
Annual Updates
35
How to Leverage Technology to Exceed Compliance and Make Breakthrough Impact
Rob Buelow, Vice President of Prevention Education
Lisa Haubenstock, Vice President of Customer Success

![Quantum Breakthrough - viXravixra.org/pdf/1611.0135v1.pdf · 2016-11-10 · Quantum Breakthrough How the 18th-century steam engine helped physicists make a quantum breakthrough. [23]](https://img.pdfslide.us/doc/110x75/5e8d17bf14b52204465ce6c2/quantum-breakthrough-2016-11-10-quantum-breakthrough-how-the-18th-century-steam.jpg)