Embed Size (px)
Citation preview
GRAPH OF FUNCTIONS
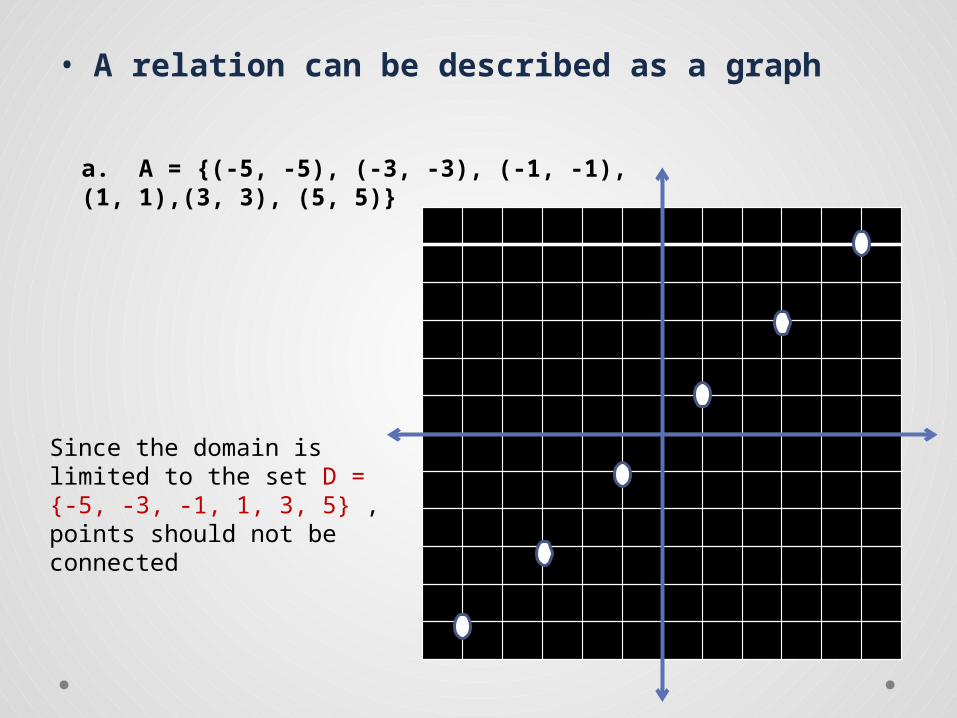
• A relation can be described as a graph
a. A = {(-5, -5), (-3, -3), (-1, -1), (1, 1),(3, 3), (5, 5)}
Since the domain is limited to the set D = {-5, -3, -1, 1, 3, 5} , points should not be connected
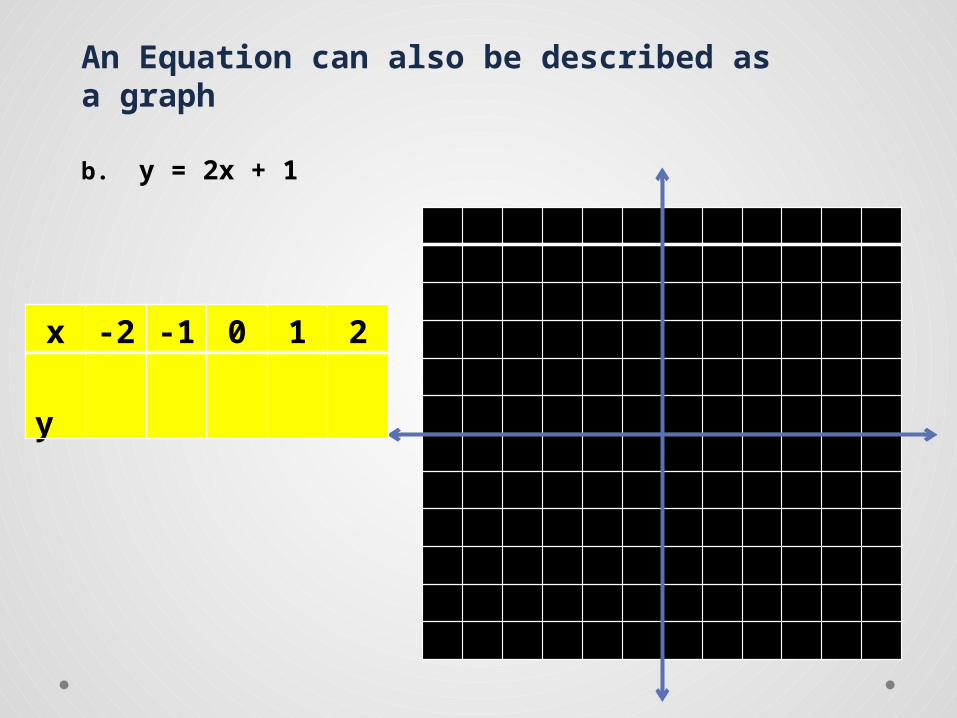
b. y = 2x + 1
x -2 -1 0 1 2
y
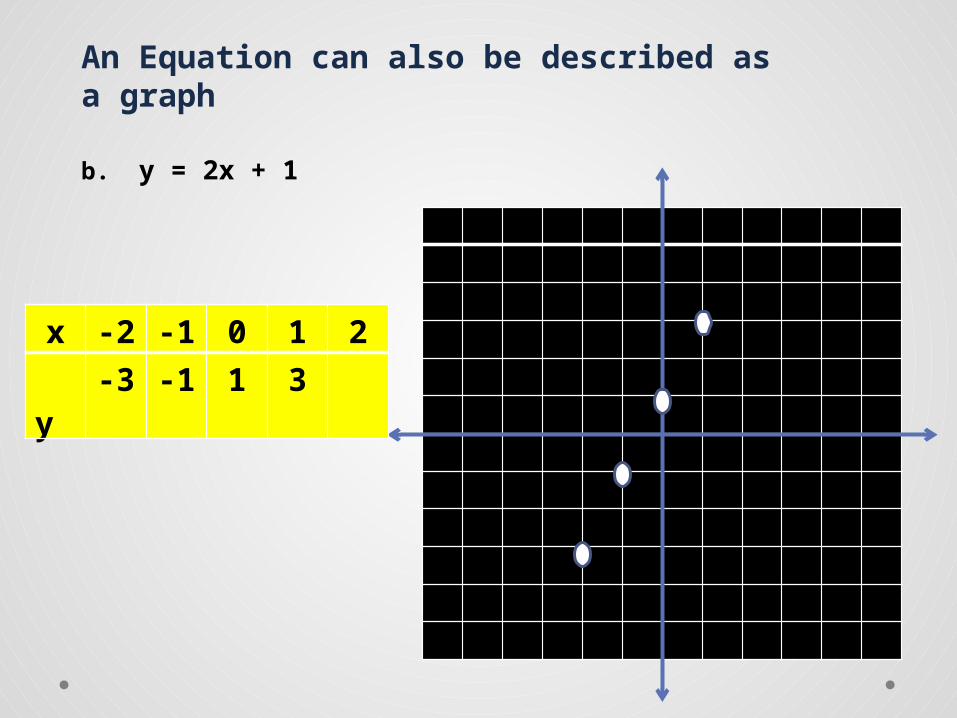
An Equation can also be described as a graph

b. y = 2x + 1
x -2 -1 0 1 2
y -3
An Equation can also be described as a graph

b. y = 2x + 1
x -2 -1 0 1 2
y -3 -1
An Equation can also be described as a graph

b. y = 2x + 1
x -2 -1 0 1 2
y -3 -1 1
An Equation can also be described as a graph
b. y = 2x + 1
x -2 -1 0 1 2
y -3 -1 1 3
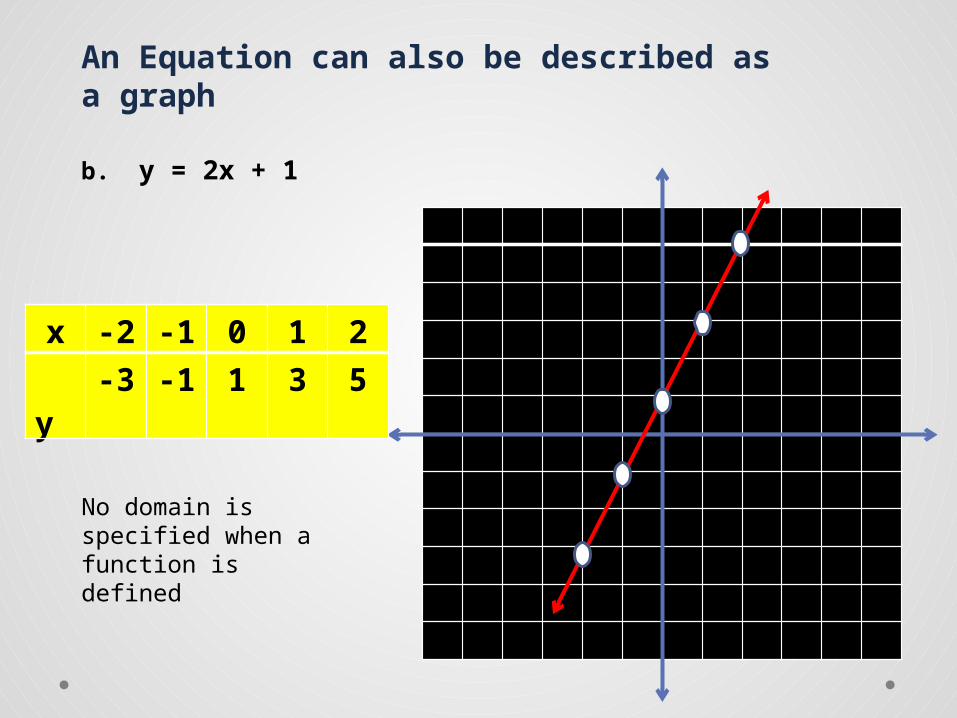
An Equation can also be described as a graph

b. y = 2x + 1
x -2 -1 0 1 2
y -3 -1 1 3 5
An Equation can also be described as a graph
b. y = 2x + 1
x -2 -1 0 1 2
y -3 -1 1 3 5
An Equation can also be described as a graph
No domain is specified when a function is defined
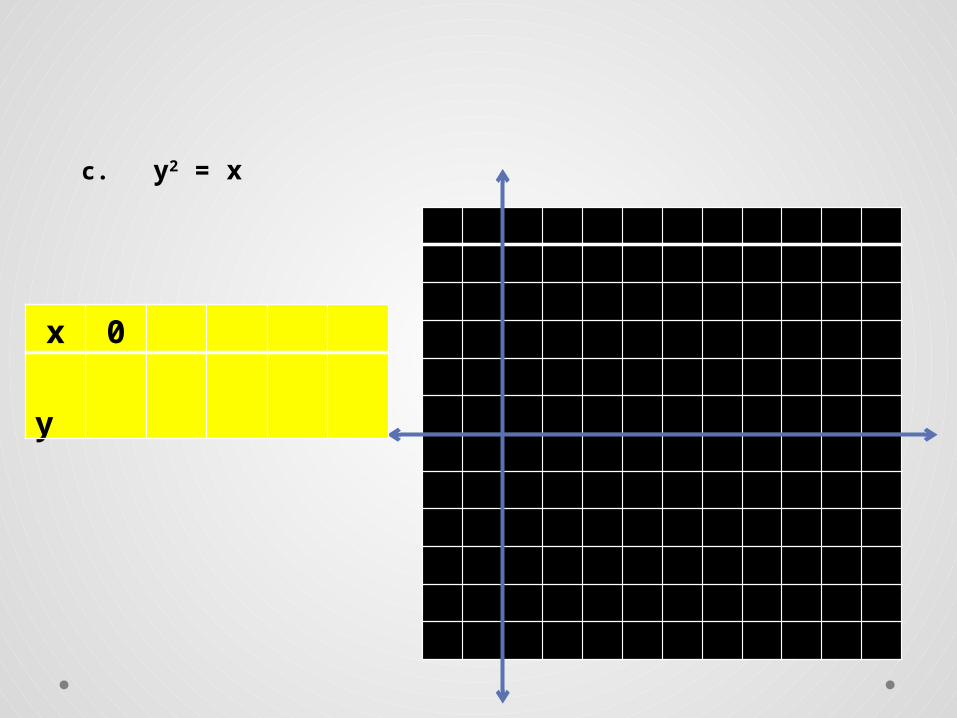
c. y2 = x
x 0
y

c. y2 = x
x 0 1
y
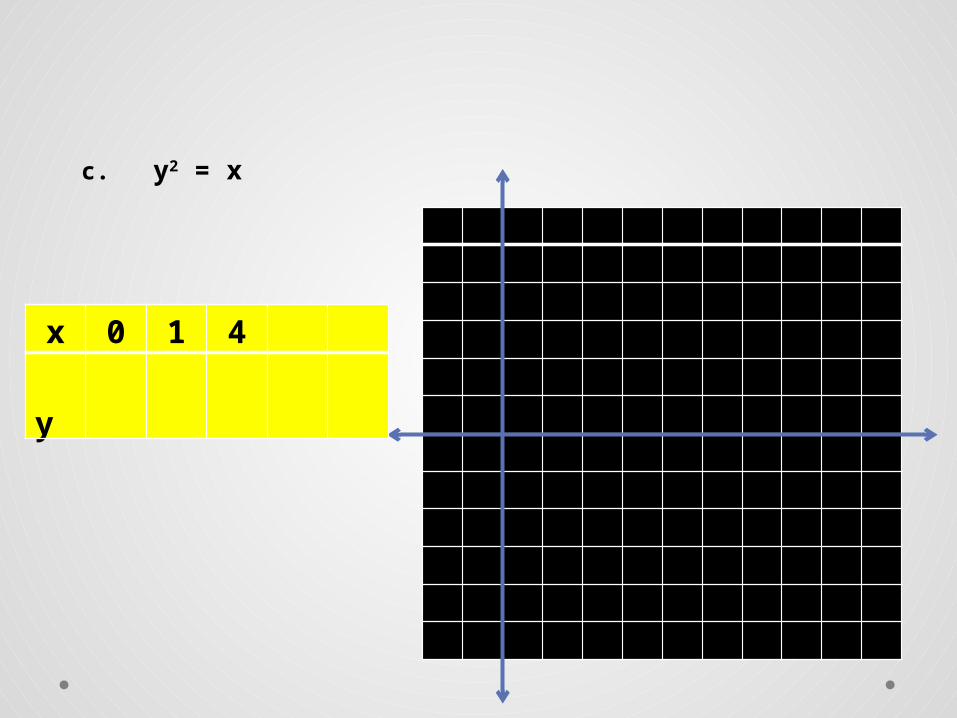
c. y2 = x
x 0 1 4
y

c. y2 = x
x 0 1 4 9
y

c. y2 = x
x 0 1 4 9 16
y 0
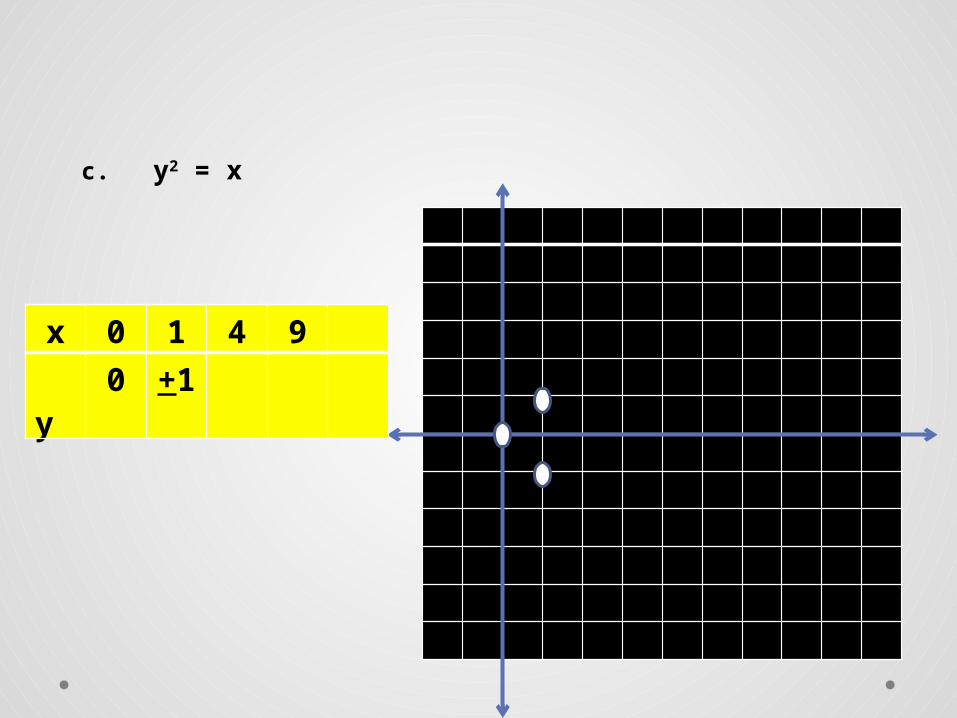
c. y2 = x
x 0 1 4 9
y 0 +1

c. y2 = x
x 0 1 4 9
y 0 +1
+2

c. y2 = x
x 0 1 4 9
y 0 +1
+2
+3
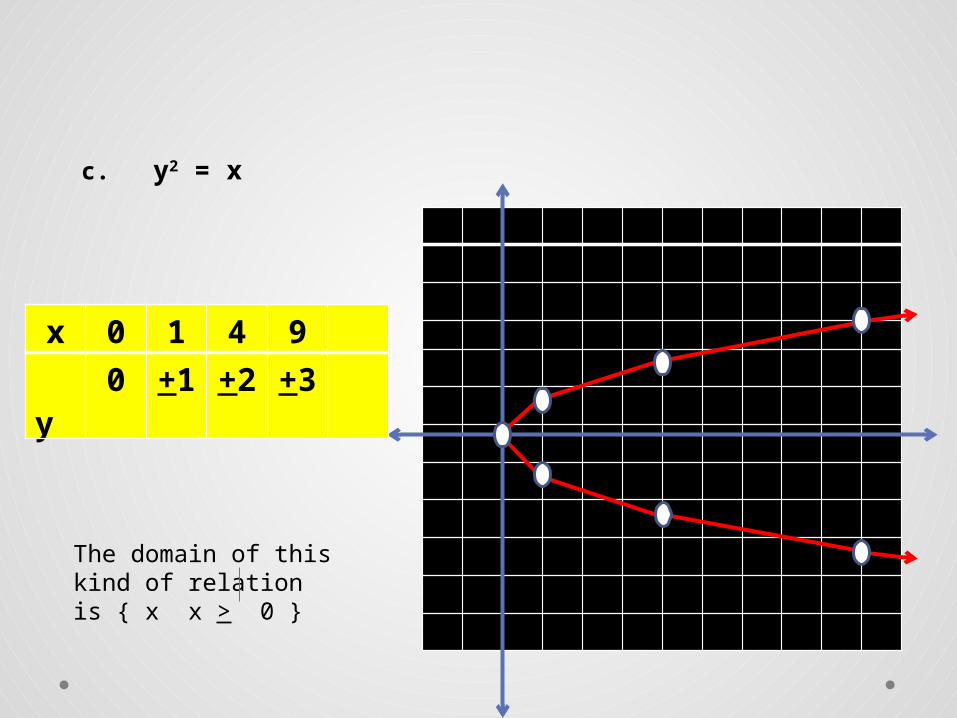
c. y2 = x
x 0 1 4 9
y 0 +1
+2
+3
The domain of this kind of relation is { x x > 0 }
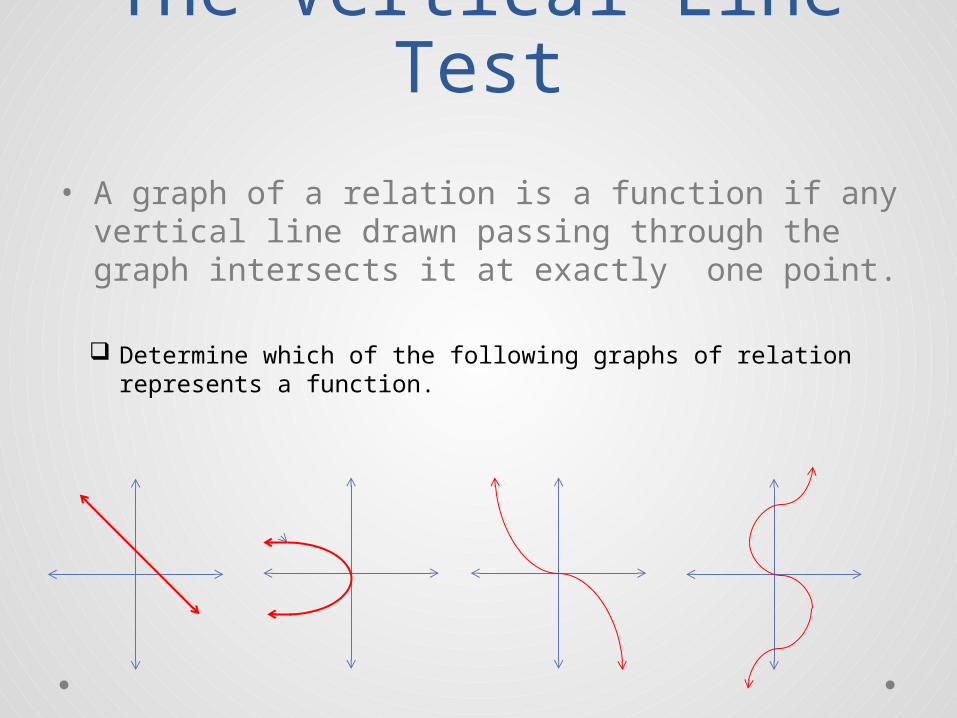
The Vertical Line Test
• A graph of a relation is a function if any vertical line drawn passing through the graph intersects it at exactly one point.
Determine which of the following graphs of relation represents a function.
• Constant Functions A constant function C consists of a single real number k in its range
for all real numbers x in its domain.
IDENTITY FUNCTION
If the domain is specified to be the set of all real numbers, the range of the identity function is also the set of all real numbers
I(x) = x
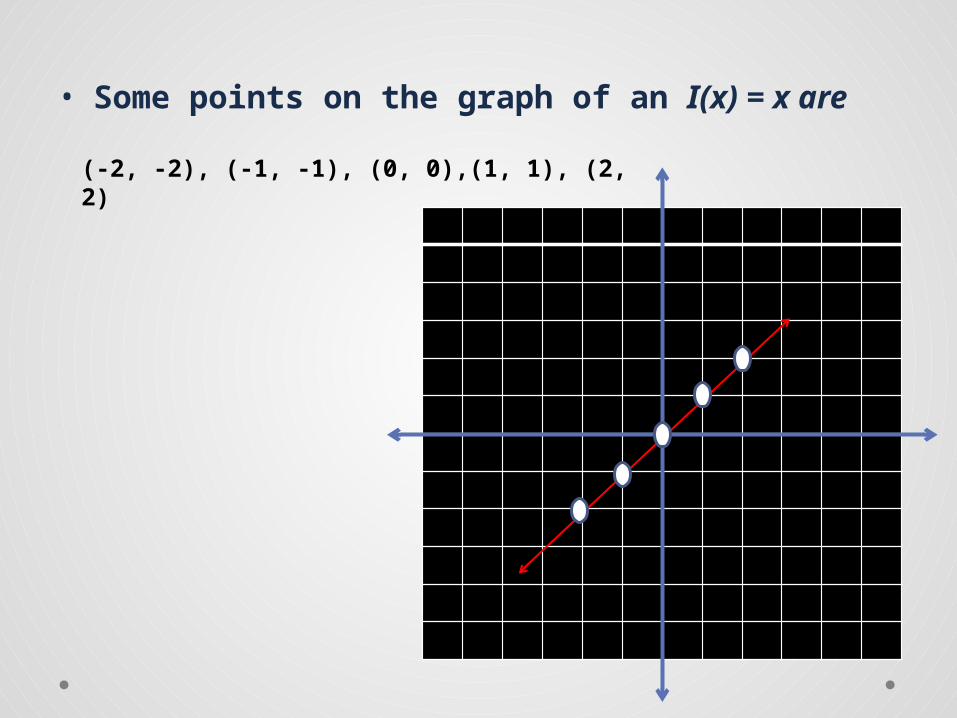
• Some points on the graph of an I(x) = x are
(-2, -2), (-1, -1), (0, 0),(1, 1), (2, 2)
POLYNOMIAL FUNCTIONS
A constant function is a polynomial function of the degree 0. If a polynomial function is of the first degree, then it is called a linear function
Polynomial Functions:Linear Function
f (x) = mx + b
Note: f(x) = y
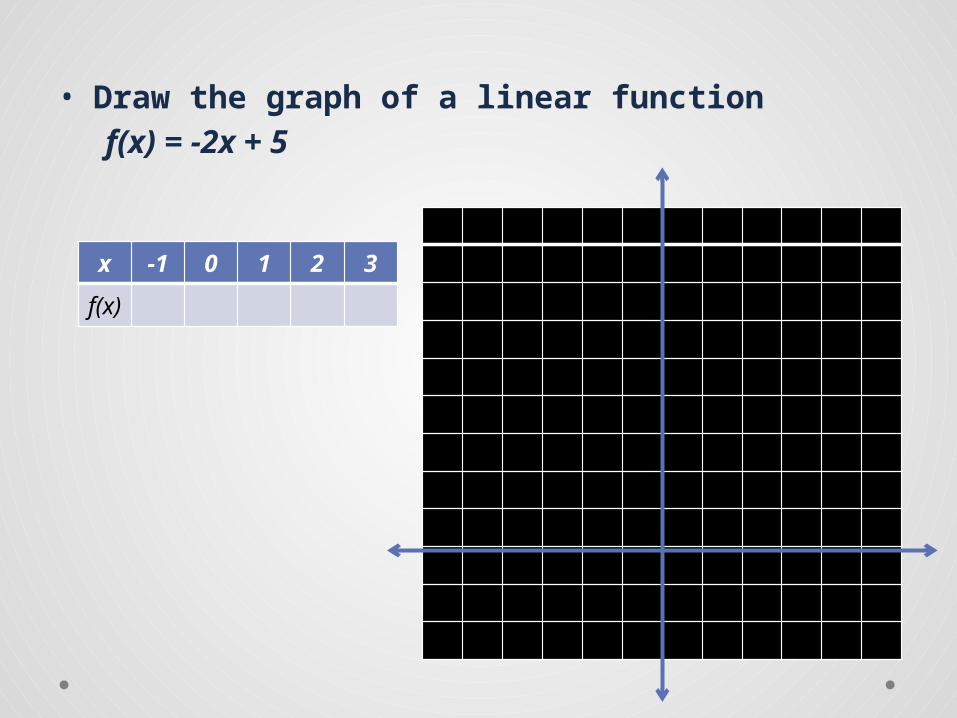
• Draw the graph of a linear function f(x) = -2x + 5
x -1 0 1 2 3
f(x)

• Draw the graph of a linear function f(x) = -2x + 5
x -1 0 1 2 3
f(x)
7

• Draw the graph of a linear function f(x) = -2x + 5
x -1 0 1 2 3
f(x)
7 5

• Draw the graph of a linear function f(x) = -2x + 5
x -1 0 1 2 3
f(x)
7 5 3

• Draw the graph of a linear function f(x) = -2x + 5
x -1 0 1 2 3
f(x)
7 5 3 1
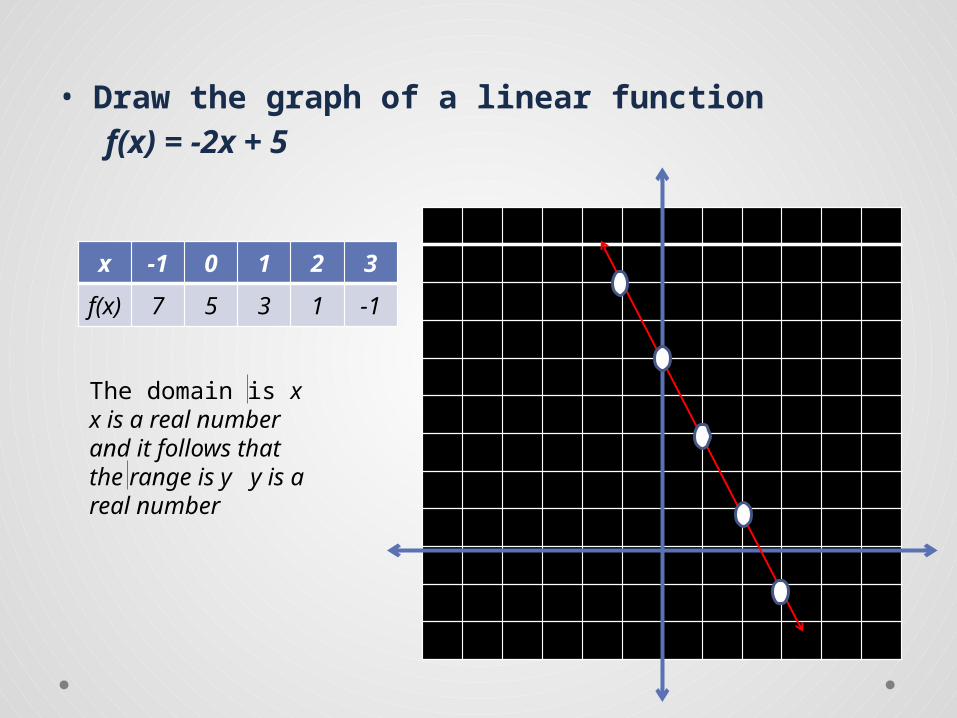
• Draw the graph of a linear function f(x) = -2x + 5
x -1 0 1 2 3
f(x)
7 5 3 1 -1
The domain is x x is a real number and it follows that the range is y y is a real number
If a polynomial function is of the second degree, then it is called a quadratic
function
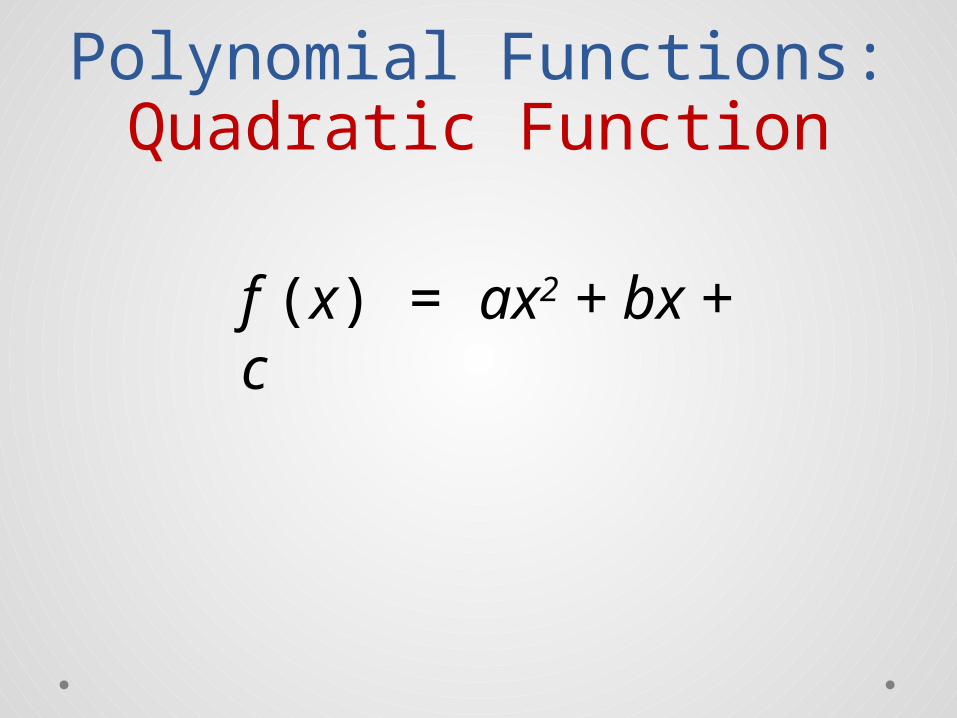
Polynomial Functions:Quadratic Function
f (x) = ax2 + bx + c

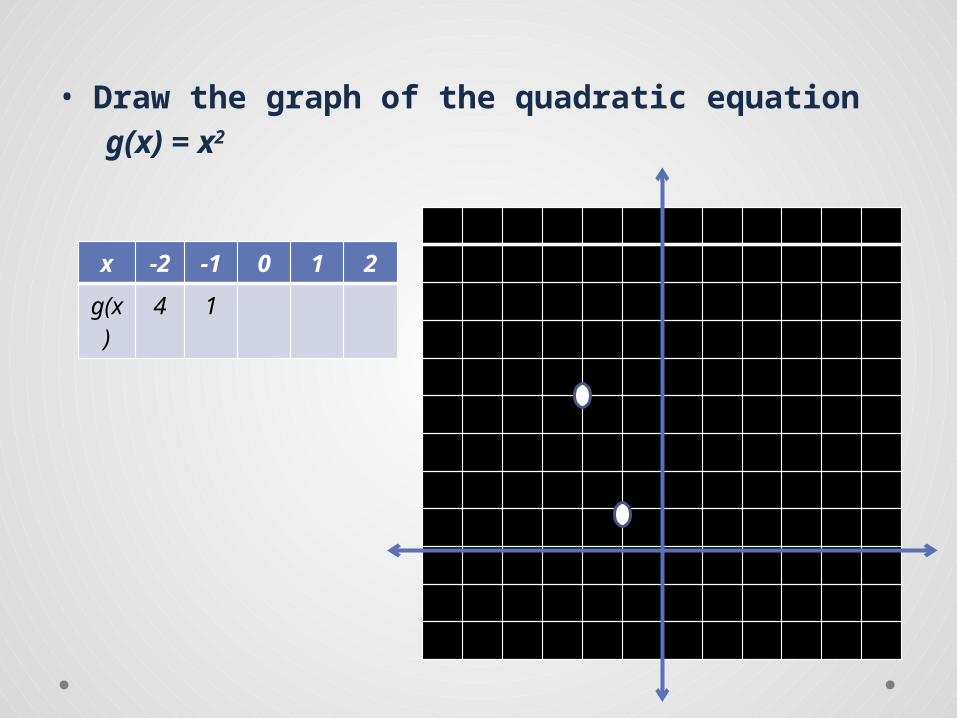
• Draw the graph of the quadratic equationg(x) = x2
x -2 -1 0 1 2
g(x)

• Draw the graph of the quadratic equationg(x) = x2
x -2 -1 0 1 2
g(x)
4
• Draw the graph of the quadratic equationg(x) = x2
x -2 -1 0 1 2
g(x)
4 1

• Draw the graph of the quadratic equationg(x) = x2
x -2 -1 0 1 2
g(x)
4 1 0

• Draw the graph of the quadratic equationg(x) = x2
x -2 -1 0 1 2
g(x)
4 1 0 1
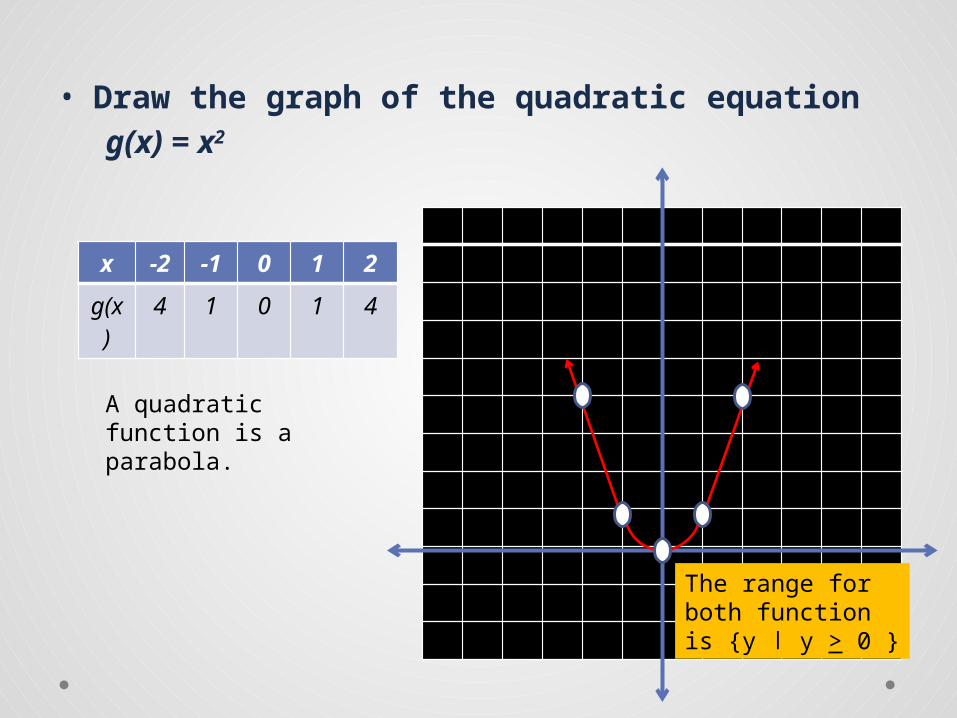
• Draw the graph of the quadratic equationg(x) = x2
x -2 -1 0 1 2
g(x)
4 1 0 1 4
A quadratic function is a parabola.
The range for both function is {y ǀ y > 0 }
Absolute Value Functions:
f (x) = x
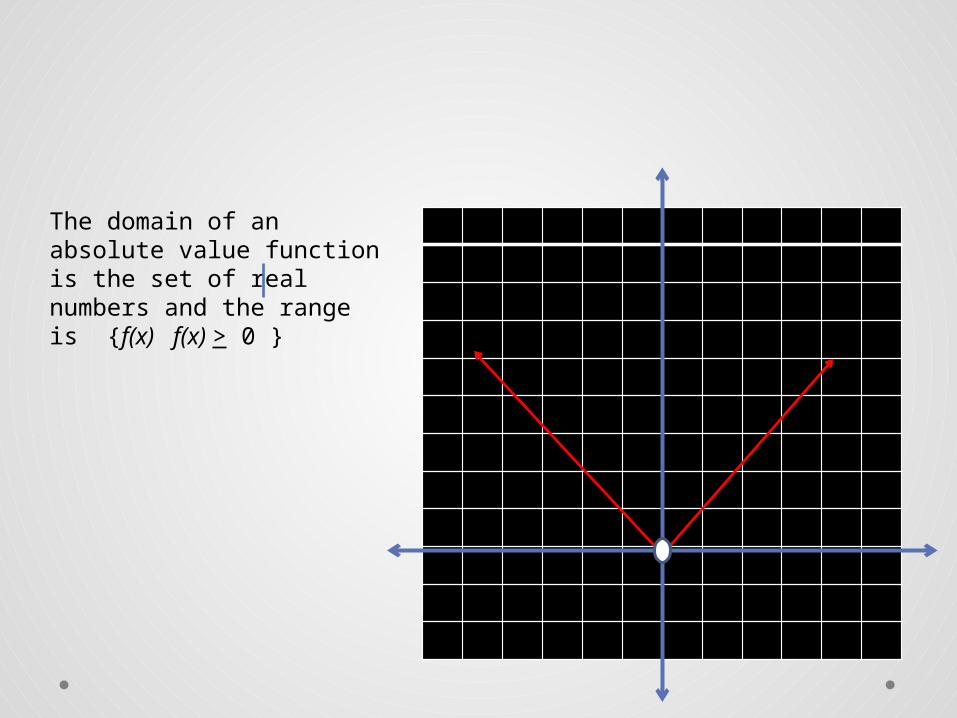
The domain of an absolute value function is the set of real numbers and the range is {f(x) f(x) > 0 }
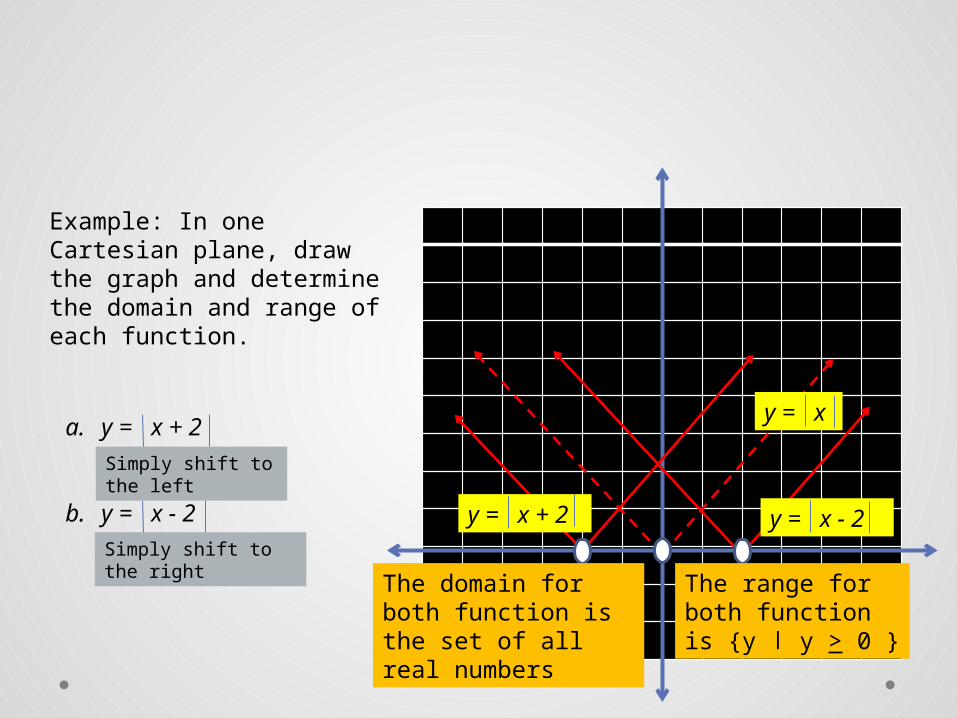
Example: In one Cartesian plane, draw the graph and determine the domain and range of each function.
a. y = x + 2
b. y = x - 2
y = x
y = x - 2y = x + 2
The domain for both function is the set of all real numbers
The range for both function is {y ǀ y > 0 }
Simply shift to the left
Simply shift to the right
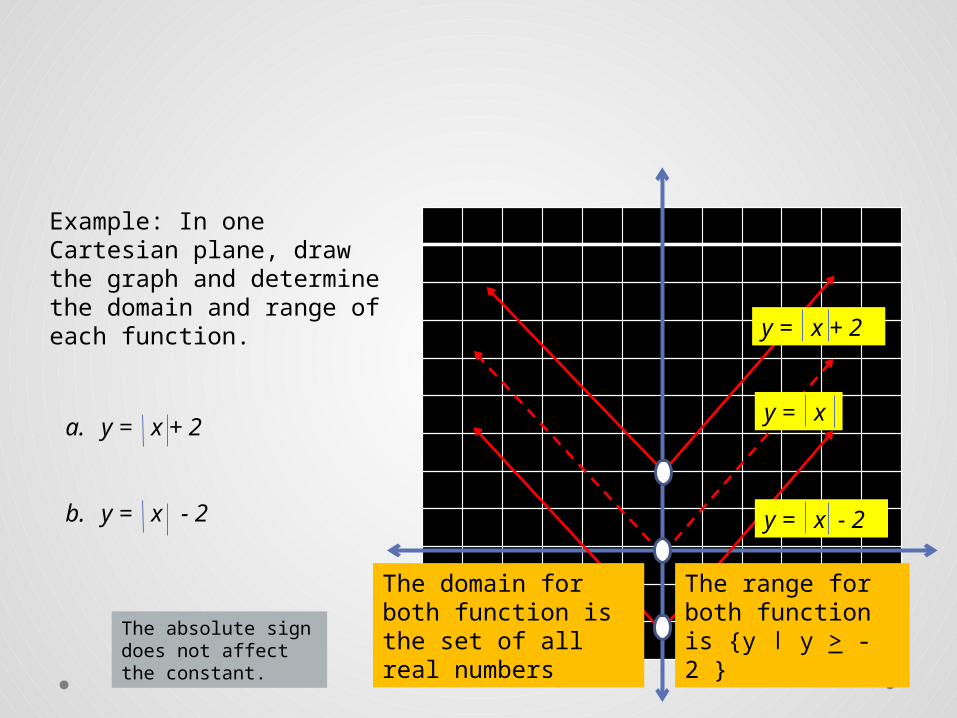
Example: In one Cartesian plane, draw the graph and determine the domain and range of each function.
a. y = x + 2
b. y = x - 2
y = x
y = x - 2
y = x + 2
The domain for both function is the set of all real numbers
The range for both function is {y ǀ y > -2 }
The absolute sign does not affect the constant.
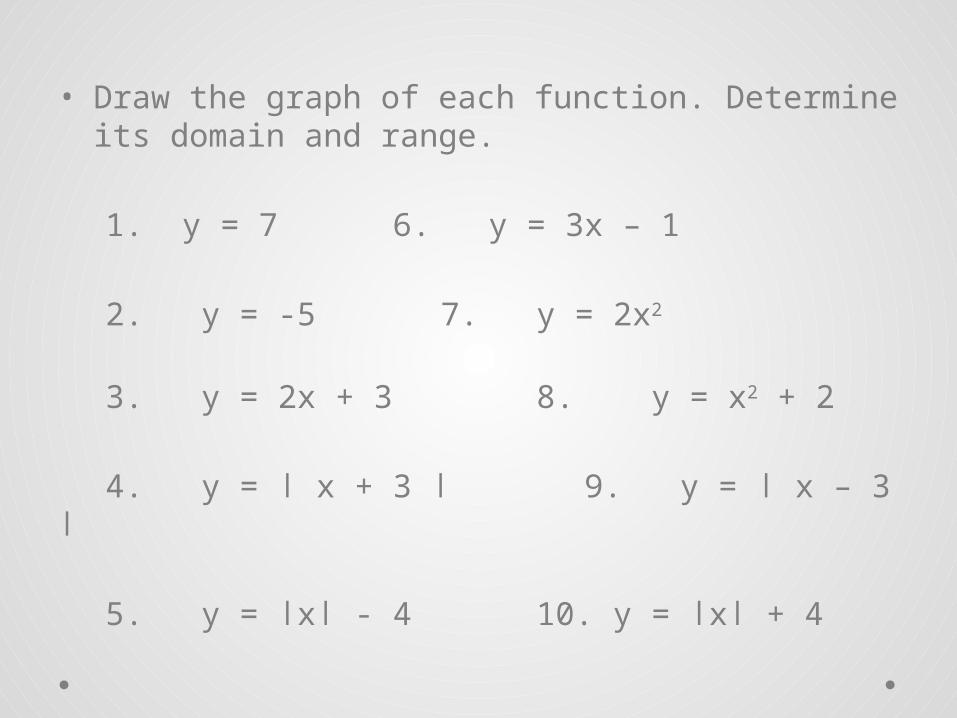
• Draw the graph of each function. Determine its domain and range.
1. y = 7 6. y = 3x – 1
2. y = -5 7. y = 2x2
3. y = 2x + 3 8. y = x2 + 2
4. y = ǀ x + 3 ǀ 9. y = ǀ x – 3 ǀ
5. y = ǀxǀ - 4 10. y = ǀxǀ + 4