Embed Size (px)
Citation preview
Fundamentals of Nutrition
MAR-ANN B. BRINGAS, MD Assistant Professor
Department of Biochemistry and Nutrition FEU-NRMF Institute of Medicine

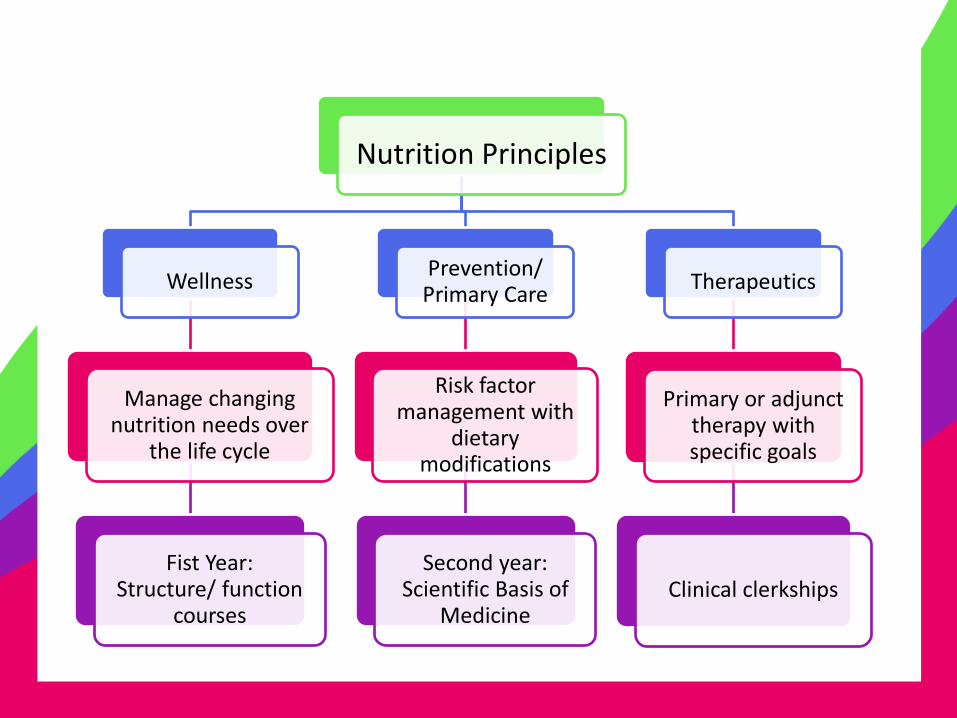
Nutrition Principles
Wellness
Manage changing nutrition needs over
the life cycle
Fist Year: Structure/ function
courses
Prevention/ Primary Care
Risk factor management with
dietary modifications
Second year: Scientific Basis of
Medicine
Therapeutics
Primary or adjunct therapy with specific goals
Clinical clerkships
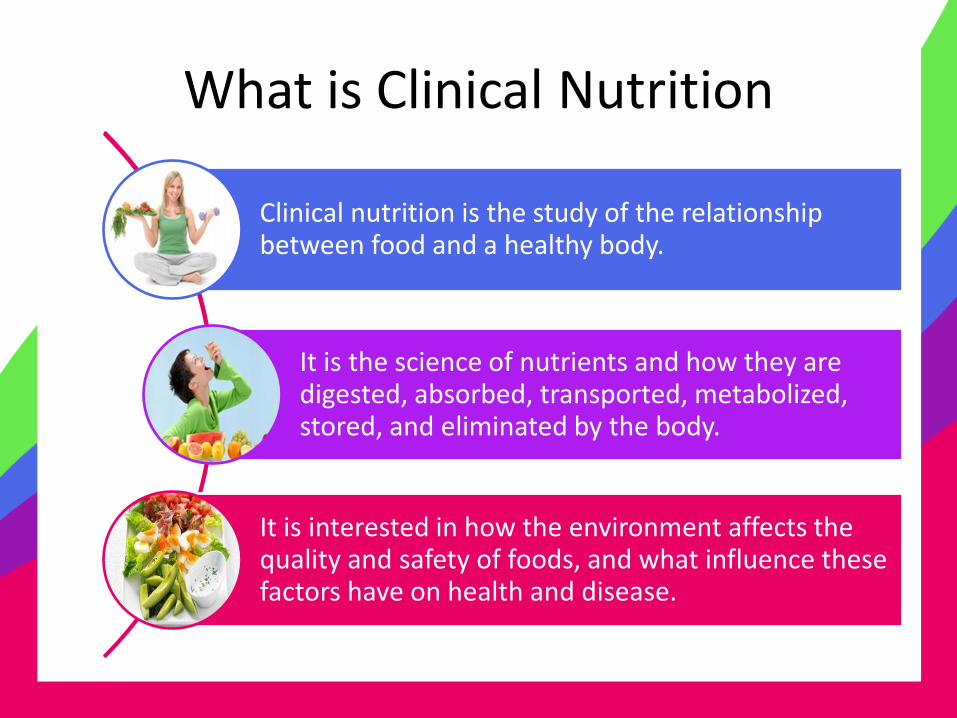
What is Clinical Nutrition
Clinical nutrition is the study of the relationship between food and a healthy body.
It is the science of nutrients and how they are digested, absorbed, transported, metabolized, stored, and eliminated by the body.
It is interested in how the environment affects the quality and safety of foods, and what influence these factors have on health and disease.
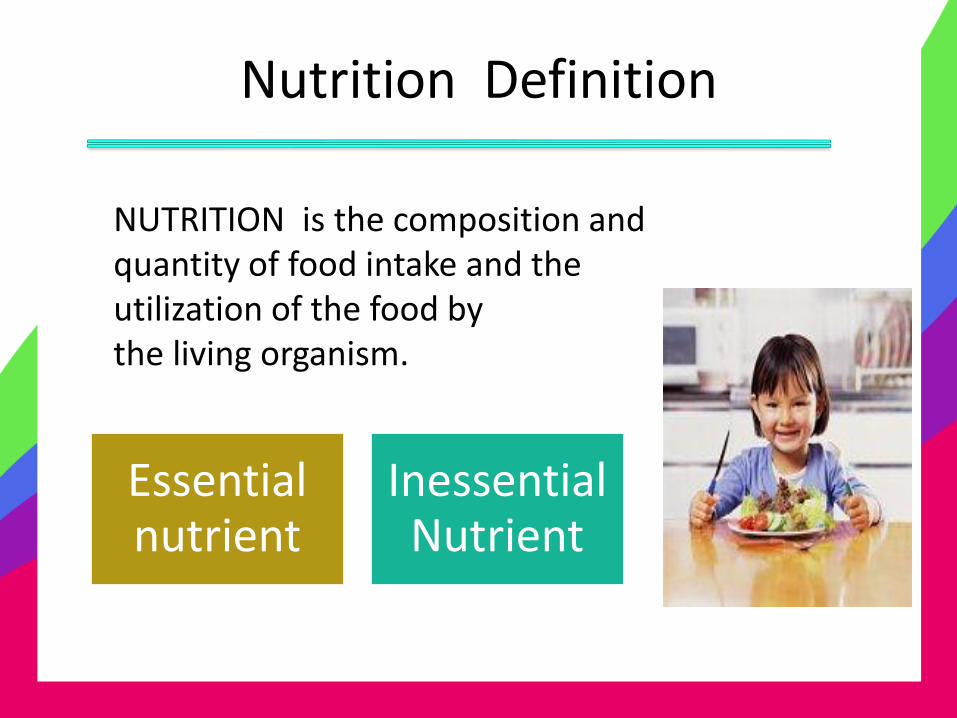
Nutrition Definition
NUTRITION is the composition and quantity of food intake and the utilization of the food by the living organism.
Essential nutrient
Inessential Nutrient
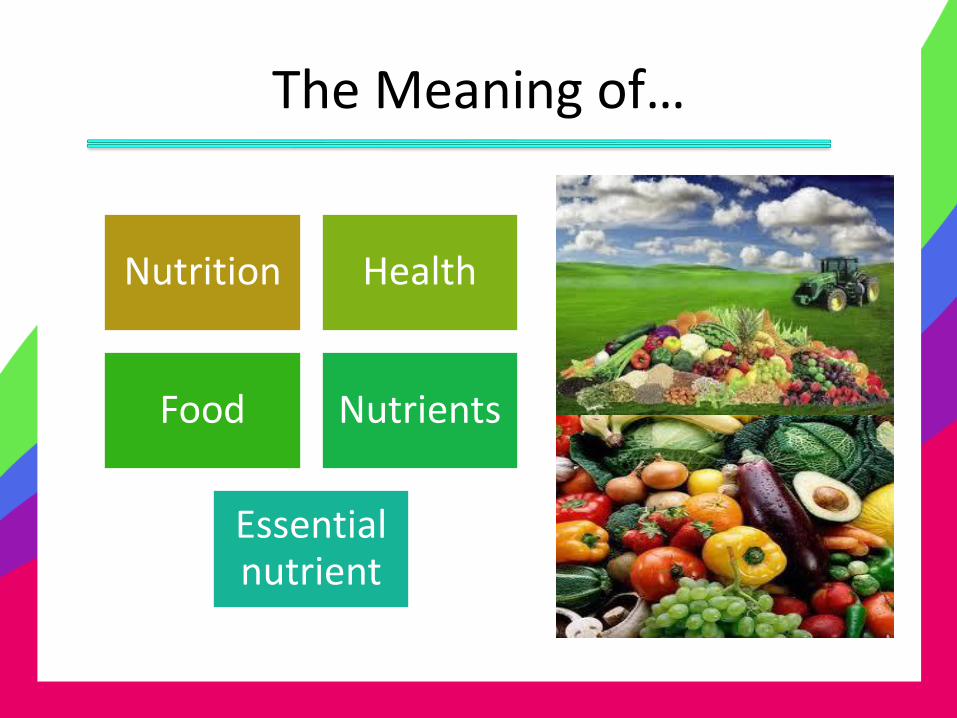
The Meaning of…
Nutrition Health
Food Nutrients
Essential nutrient
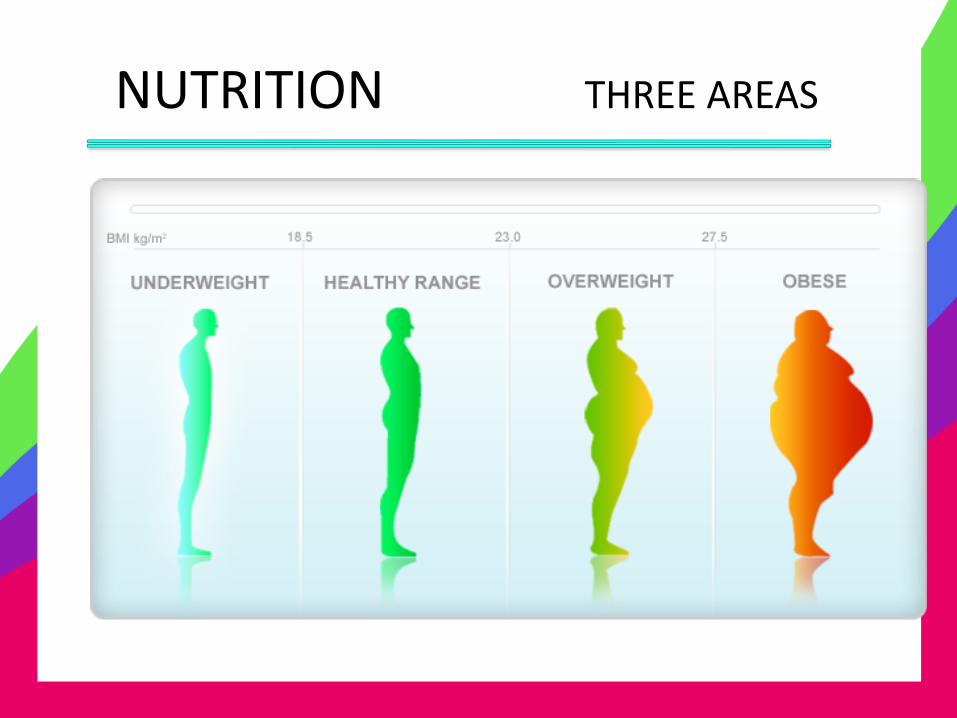
NUTRITION THREE AREAS
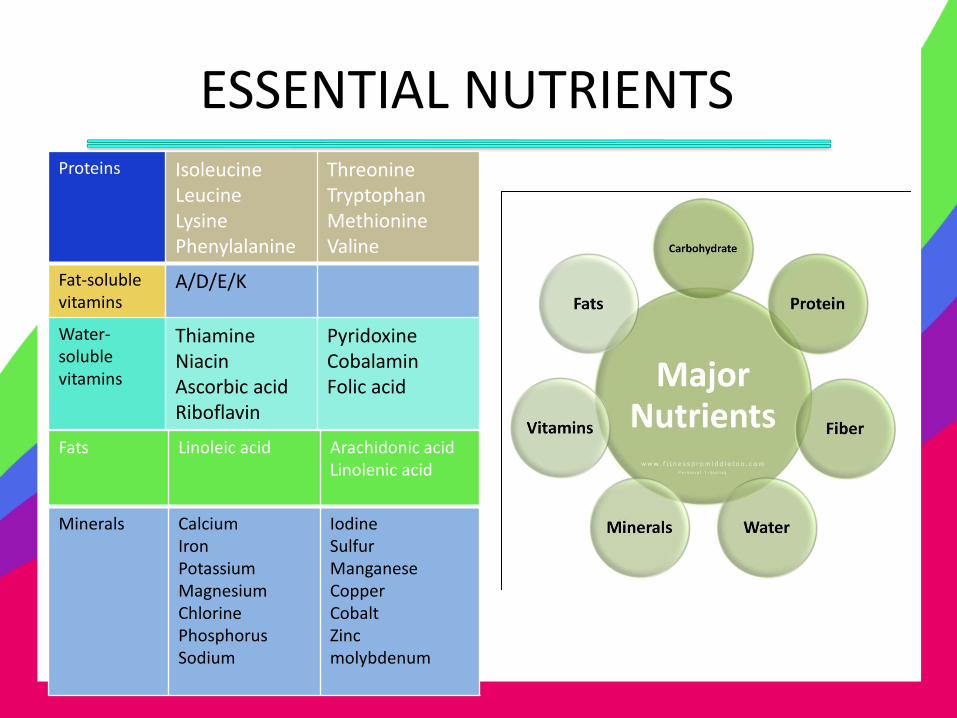
ESSENTIAL NUTRIENTS Proteins Isoleucine
Leucine Lysine Phenylalanine
Threonine Tryptophan Methionine Valine
Fat-soluble vitamins
A/D/E/K
Water-soluble vitamins
Thiamine Niacin Ascorbic acid Riboflavin
Pyridoxine Cobalamin Folic acid
Fats Linoleic acid
Arachidonic acid Linolenic acid
Minerals Calcium Iron Potassium Magnesium Chlorine Phosphorus Sodium
Iodine Sulfur Manganese Copper Cobalt Zinc molybdenum
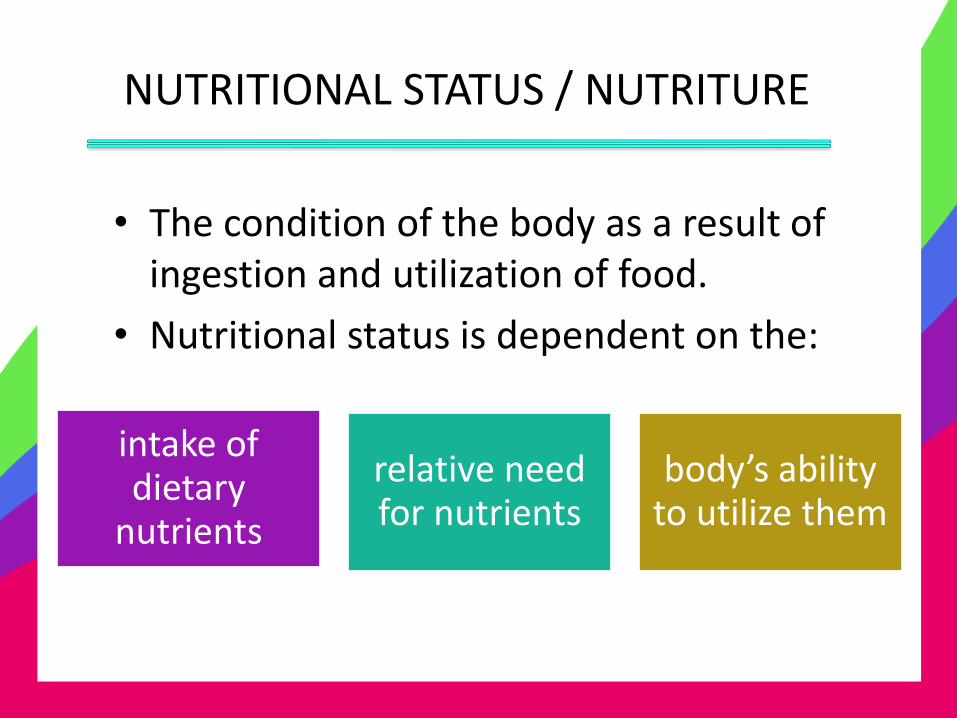
NUTRITIONAL STATUS / NUTRITURE
• The condition of the body as a result of ingestion and utilization of food.
• Nutritional status is dependent on the:
intake of dietary
nutrients
relative need for nutrients
body’s ability to utilize them
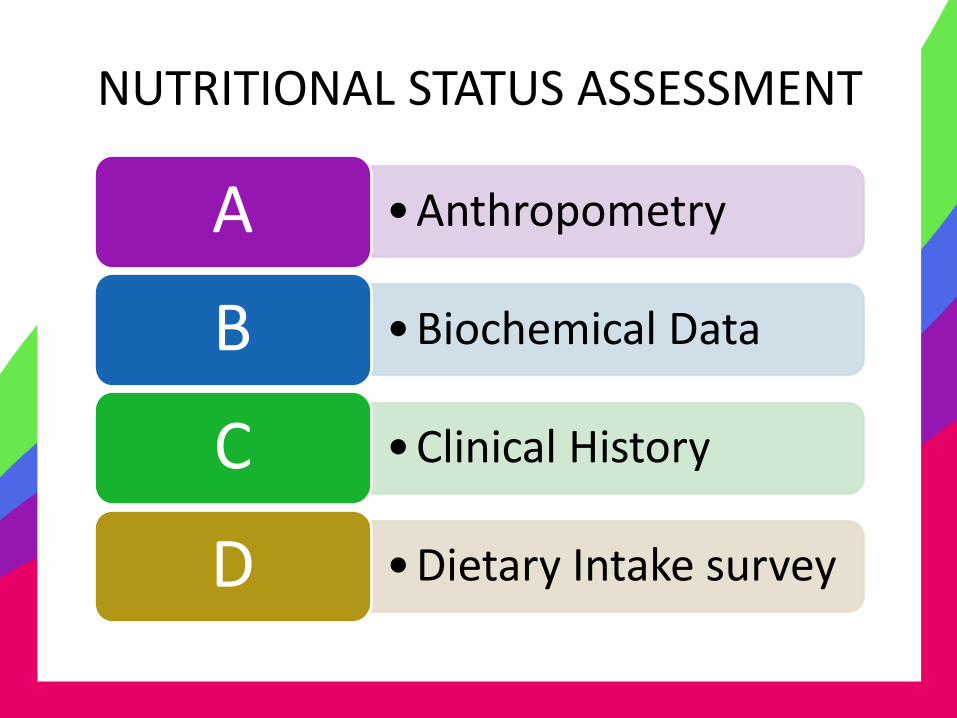
NUTRITIONAL STATUS ASSESSMENT
•Anthropometry A
•Biochemical Data B
•Clinical History C
•Dietary Intake survey D
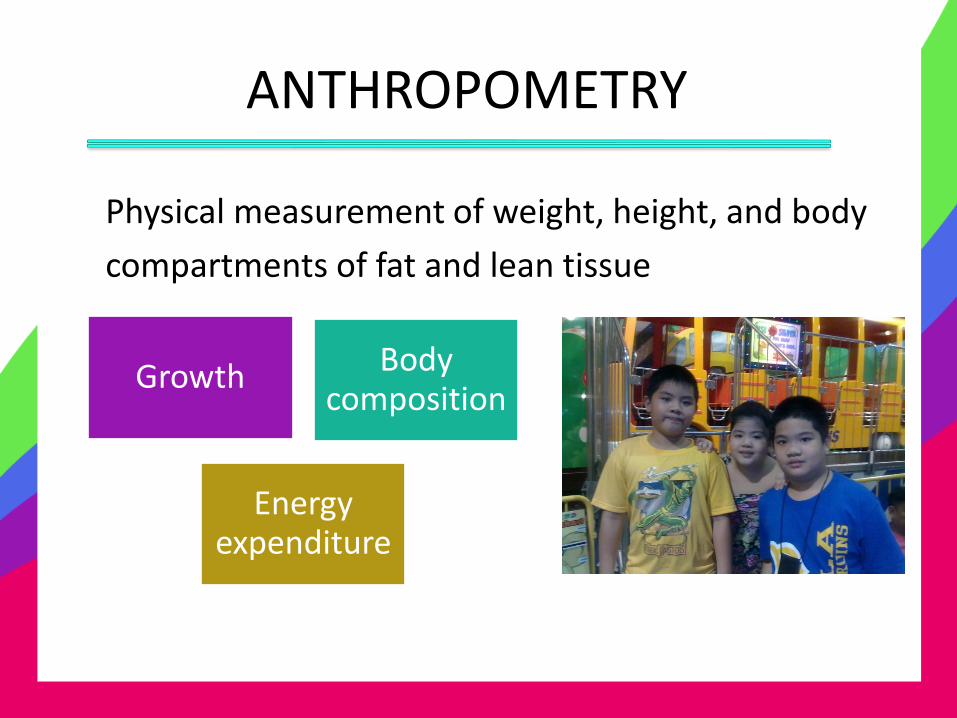
ANTHROPOMETRY
Physical measurement of weight, height, and body
compartments of fat and lean tissue
Growth Body composition
Energy expenditure
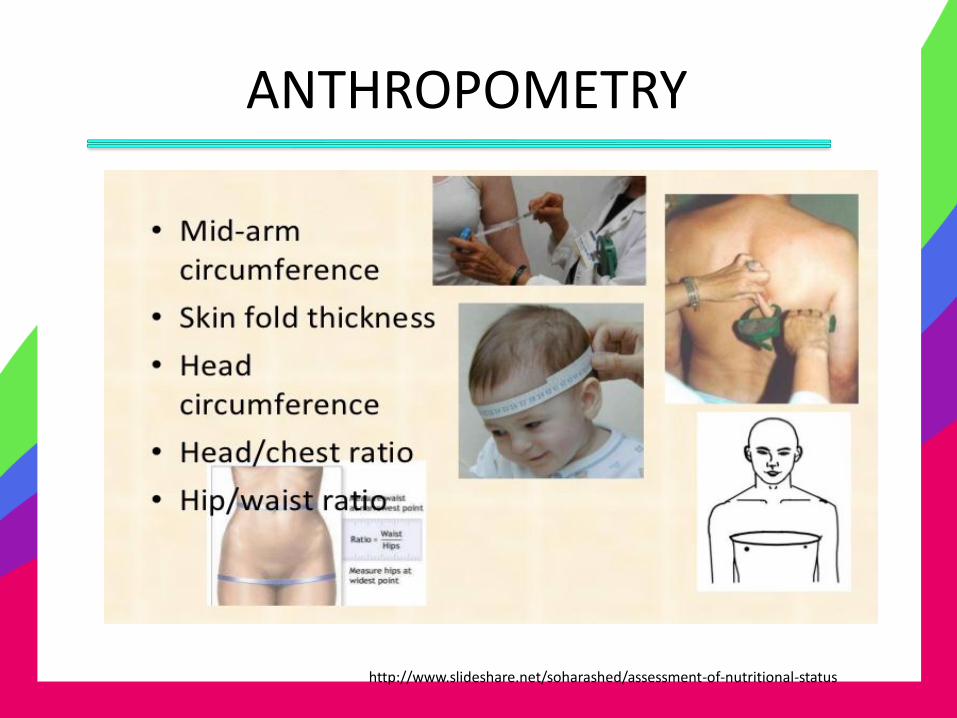
ANTHROPOMETRY
http://www.slideshare.net/soharashed/assessment-of-nutritional-status

ANTHROPOMETRY Adults
Height measurement Stand erect and barefooted
on a STADIOMETER with a movable headpiece.
The head piece is leveled with skull vault & the height is recorded to the nearest 0.5 cm.
http://www.slideshare.net/soharashed/assessment-of-nutritional-status
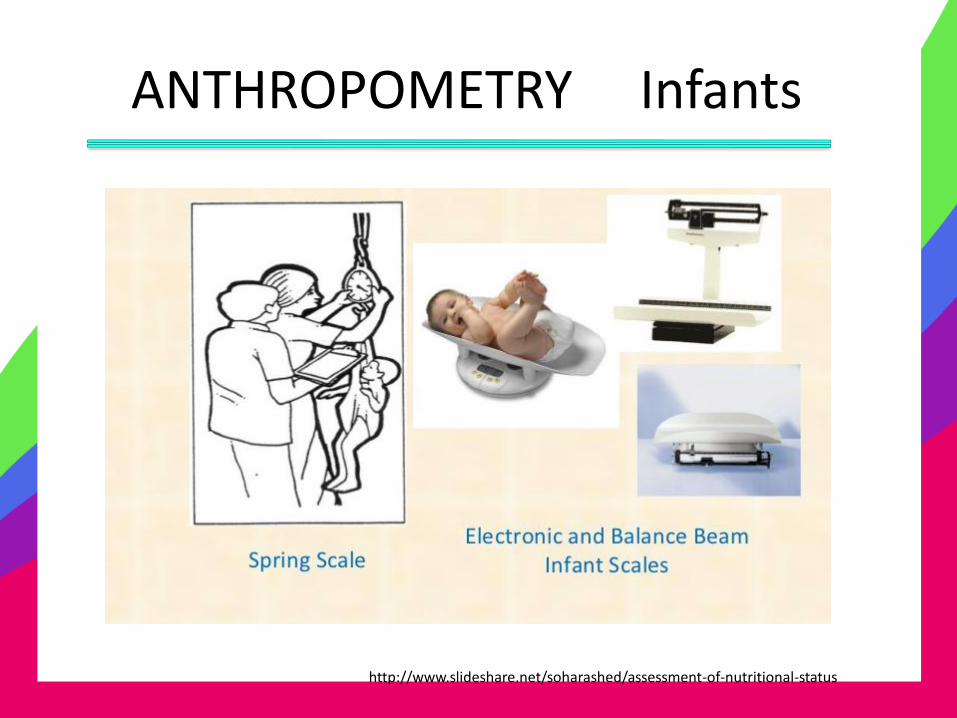
ANTHROPOMETRY Infants
http://www.slideshare.net/soharashed/assessment-of-nutritional-status
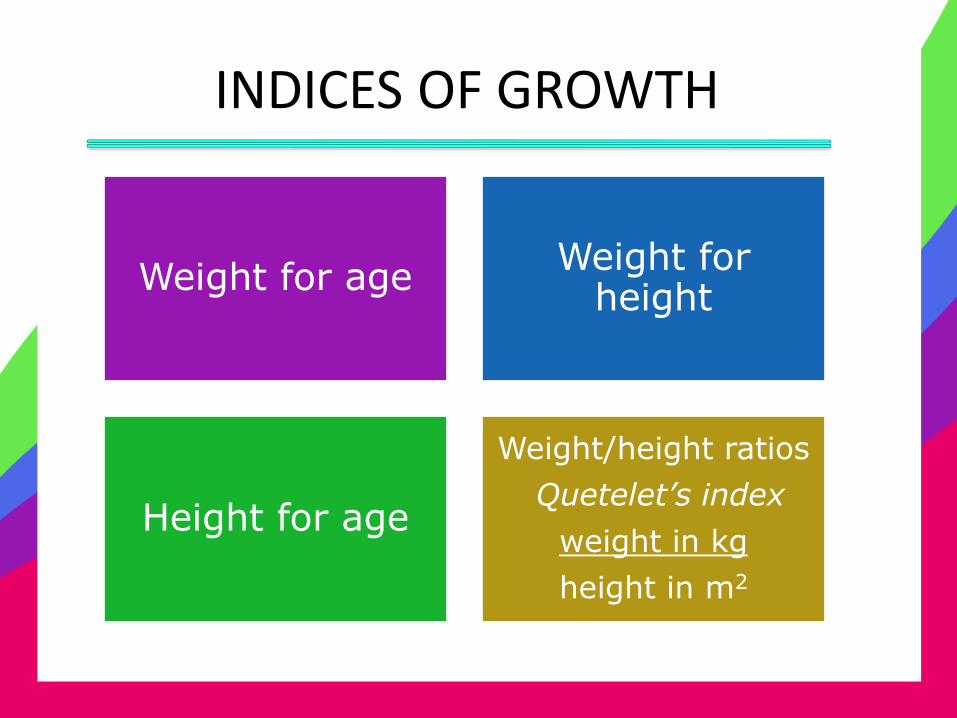
INDICES OF GROWTH
Weight for age Weight for
height
Height for age
Weight/height ratios
Quetelet’s index
weight in kg
height in m2
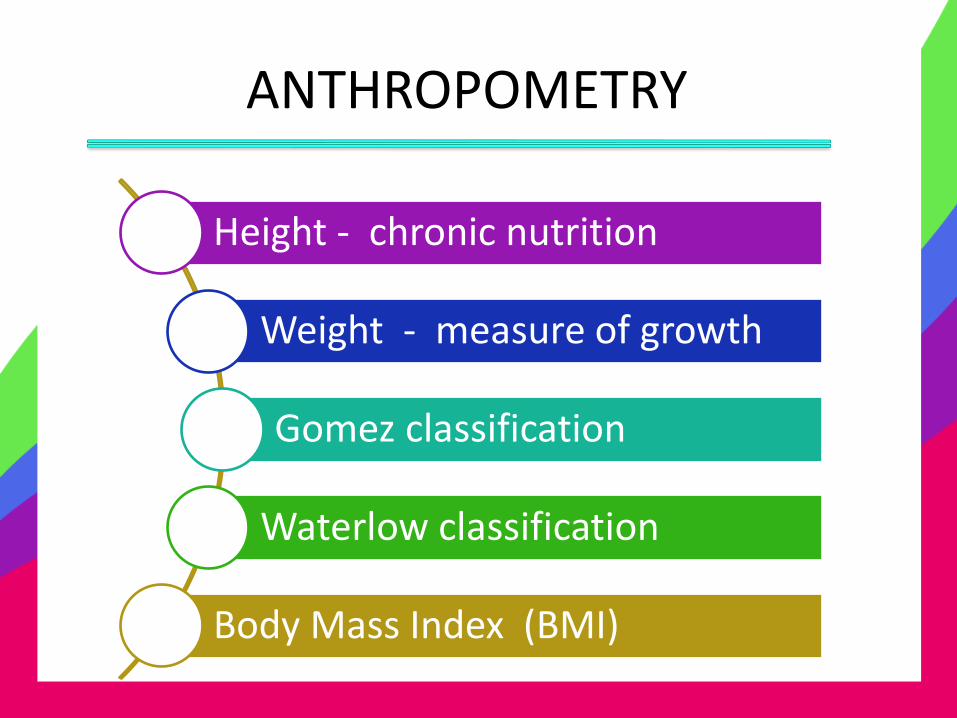
ANTHROPOMETRY
Height - chronic nutrition
Weight - measure of growth
Gomez classification
Waterlow classification
Body Mass Index (BMI)
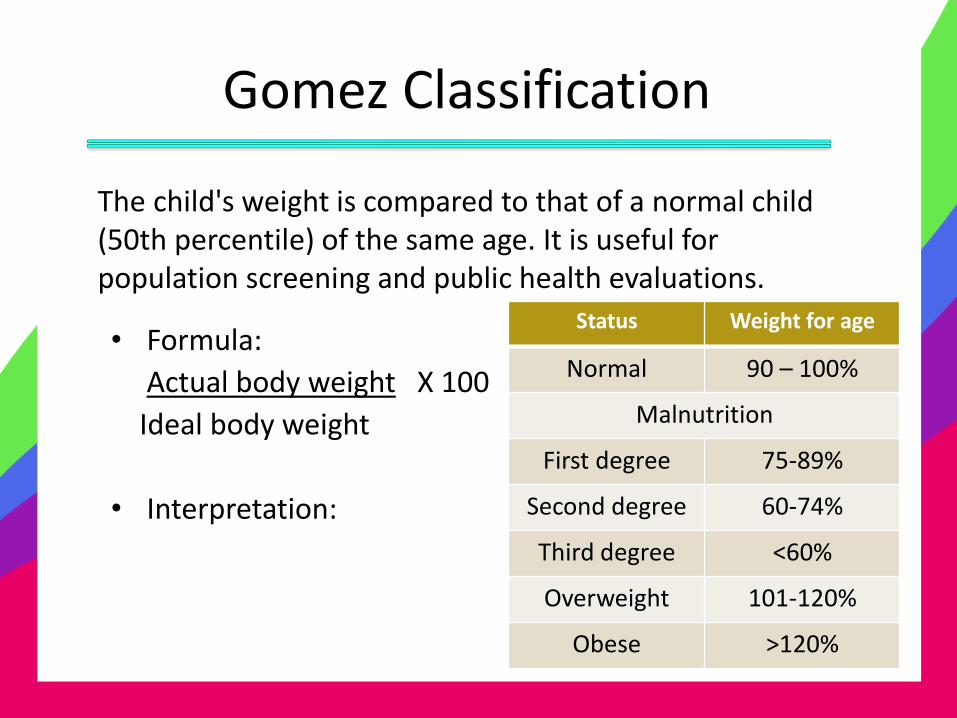
Gomez Classification
The child's weight is compared to that of a normal child (50th percentile) of the same age. It is useful for population screening and public health evaluations. • Formula:
Actual body weight X 100
Ideal body weight
• Interpretation:
Status Weight for age
Normal 90 – 100%
Malnutrition
First degree 75-89%
Second degree 60-74%
Third degree <60%
Overweight 101-120%
Obese >120%
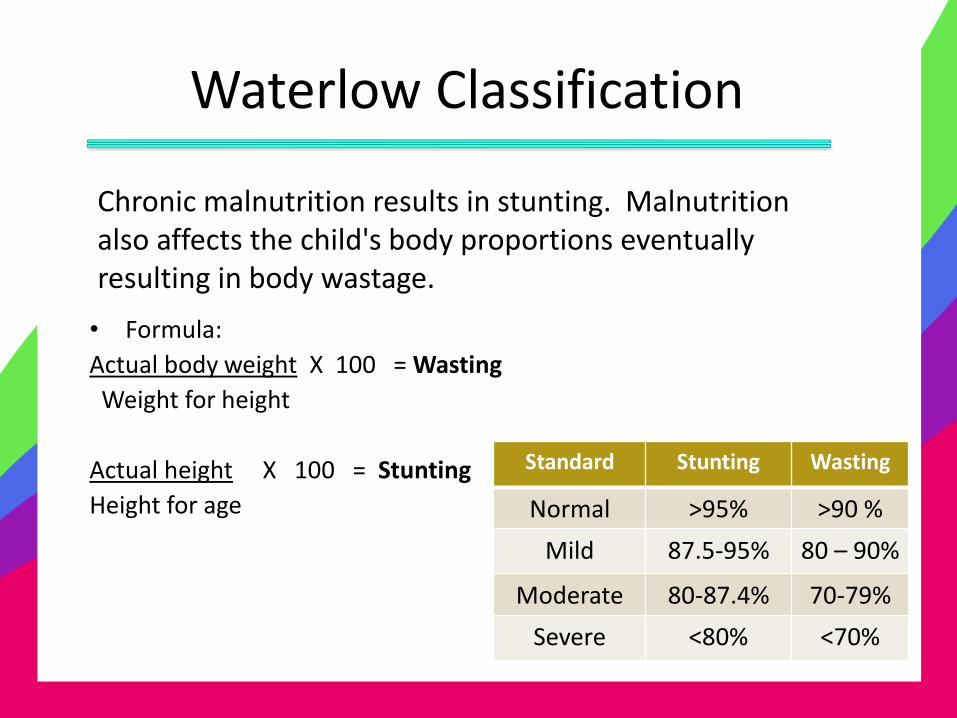
Waterlow Classification
Chronic malnutrition results in stunting. Malnutrition also affects the child's body proportions eventually resulting in body wastage. • Formula:
Actual body weight X 100 = Wasting
Weight for height
Actual height X 100 = Stunting
Height for age
Standard Stunting Wasting
Normal >95% >90 %
Mild 87.5-95% 80 – 90%
Moderate 80-87.4% 70-79%
Severe <80% <70%
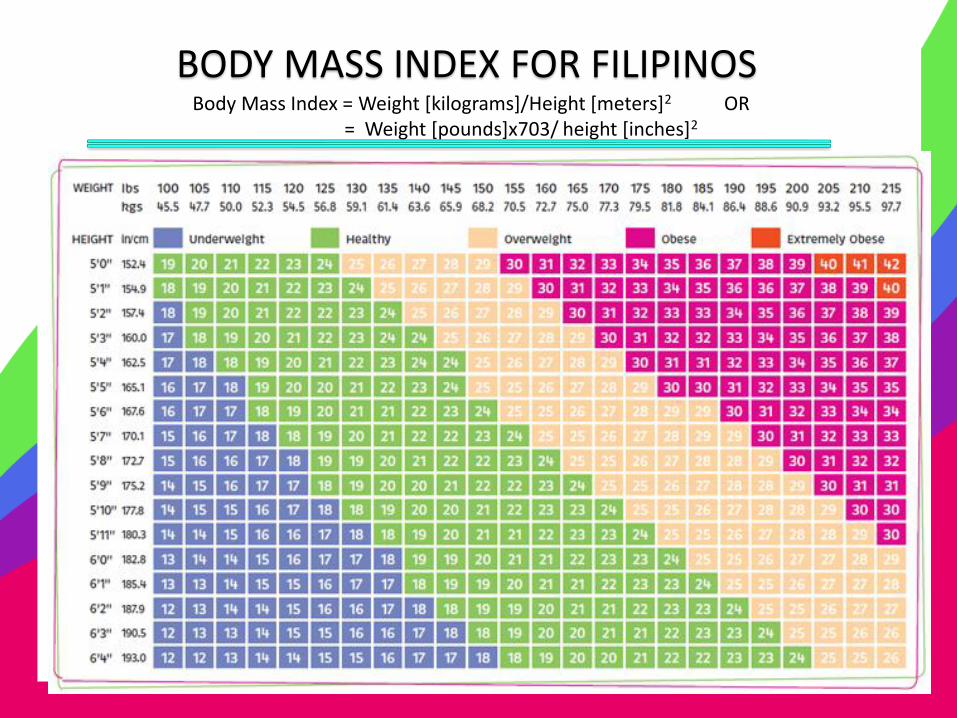
BODY MASS INDEX FOR FILIPINOS
Body Mass Index = Weight [kilograms]/Height [meters]2 OR = Weight [pounds]x703/ height [inches]2
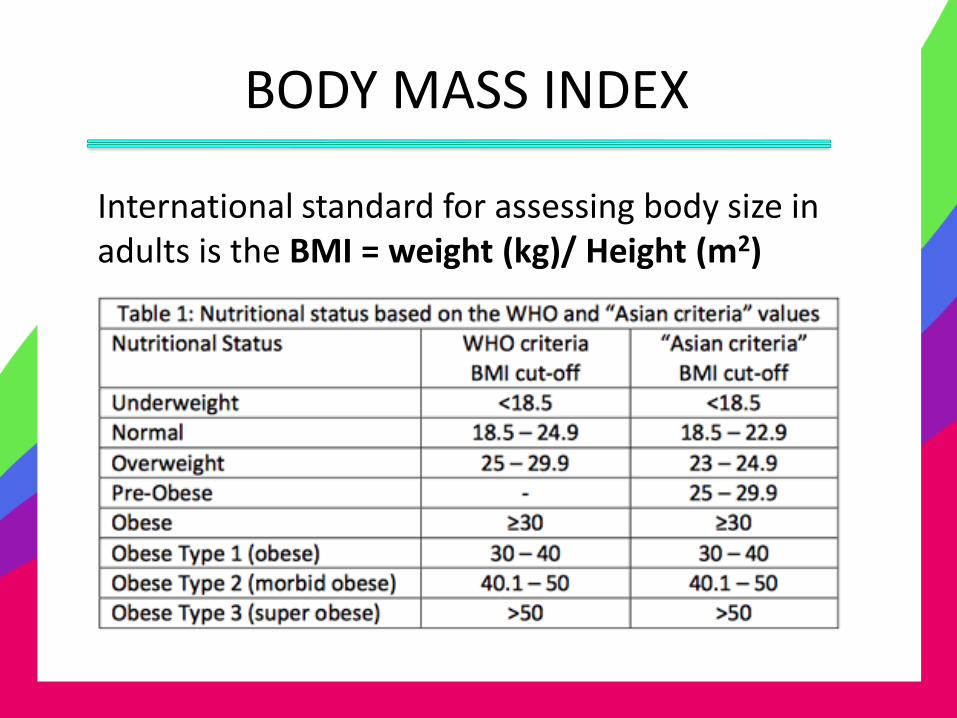
BODY MASS INDEX
International standard for assessing body size in adults is the BMI = weight (kg)/ Height (m2)
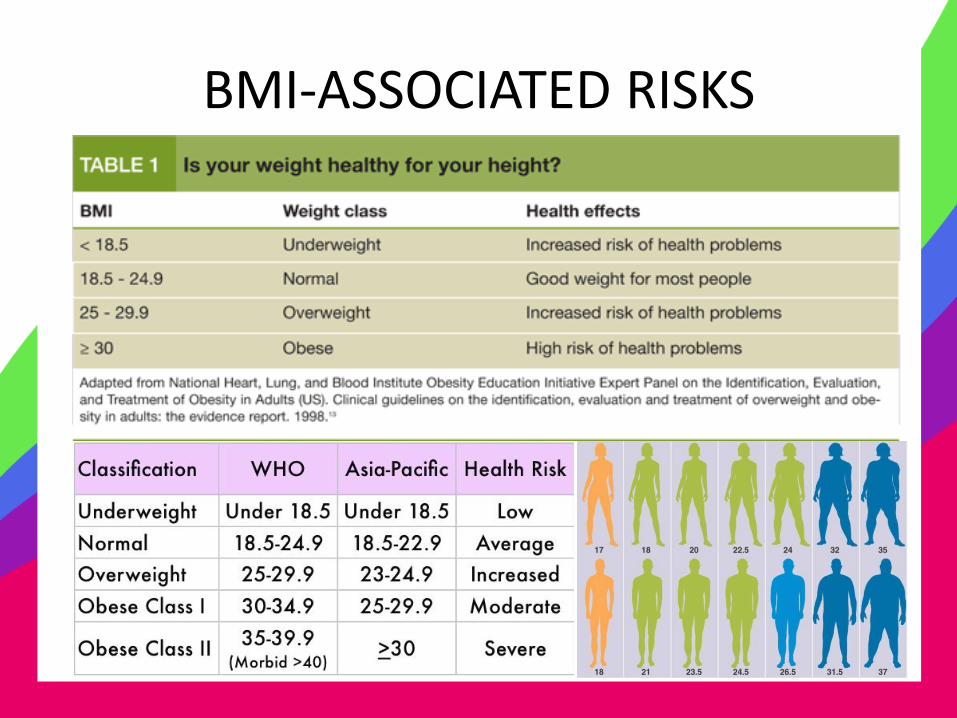
BMI-ASSOCIATED RISKS
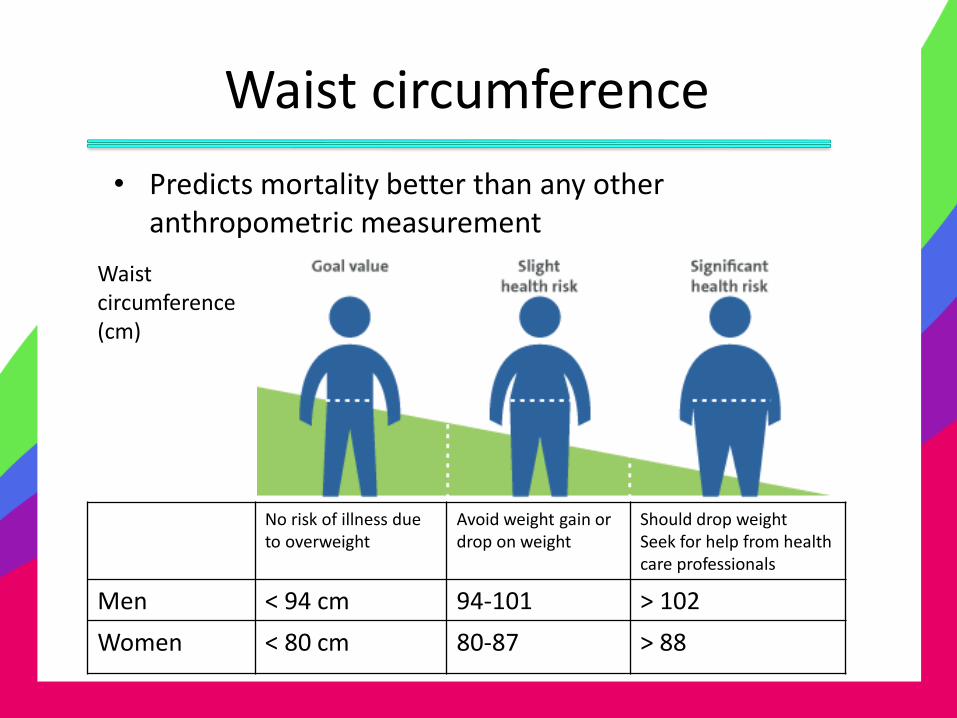
Waist circumference
• Predicts mortality better than any other anthropometric measurement
No risk of illness due to overweight
Avoid weight gain or drop on weight
Should drop weight Seek for help from health care professionals
Men < 94 cm 94-101 > 102
Women < 80 cm 80-87 > 88
Waist circumference (cm)
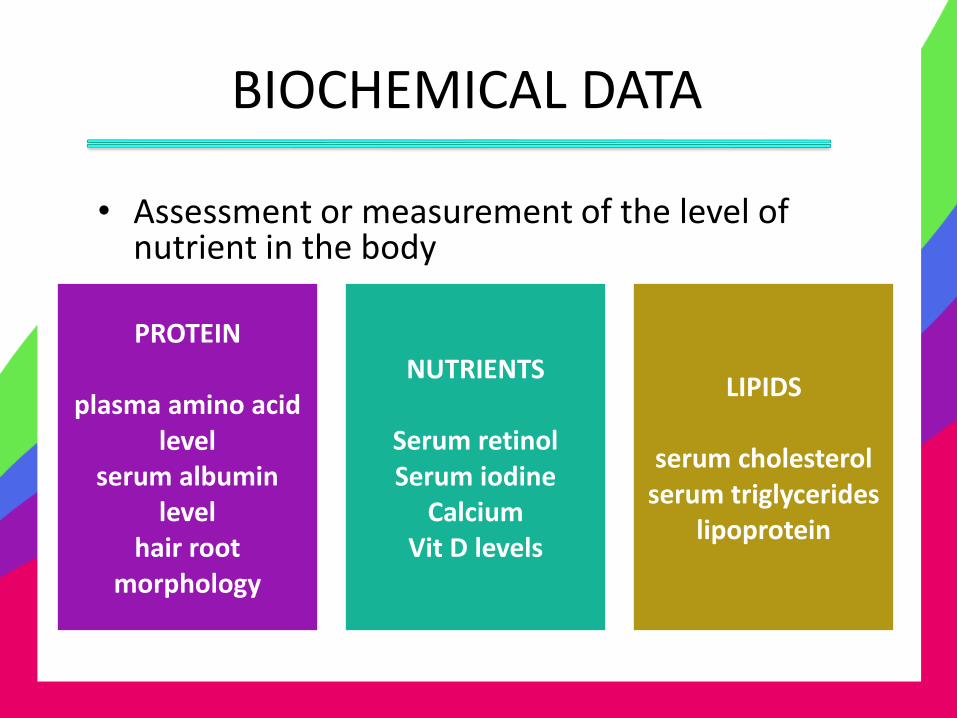
BIOCHEMICAL DATA
• Assessment or measurement of the level of nutrient in the body
PROTEIN
plasma amino acid
level serum albumin
level hair root
morphology
NUTRIENTS
Serum retinol Serum iodine
Calcium Vit D levels
LIPIDS
serum cholesterol serum triglycerides
lipoprotein
CLINICAL HISTORY AND PHYSICAL EXAMINATION
• Complete medical history
• Complete physical examination
• Signs/symptoms of nutritional deficiency
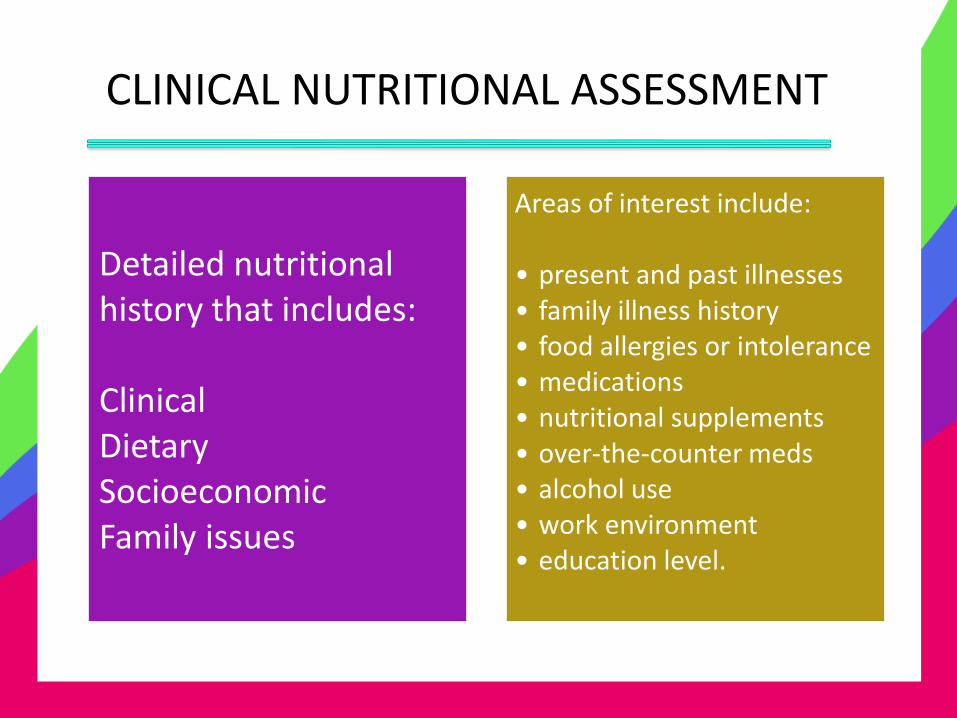
CLINICAL NUTRITIONAL ASSESSMENT
Detailed nutritional history that includes: Clinical Dietary Socioeconomic Family issues
Areas of interest include: • present and past illnesses • family illness history • food allergies or intolerance • medications • nutritional supplements • over-the-counter meds • alcohol use • work environment • education level.
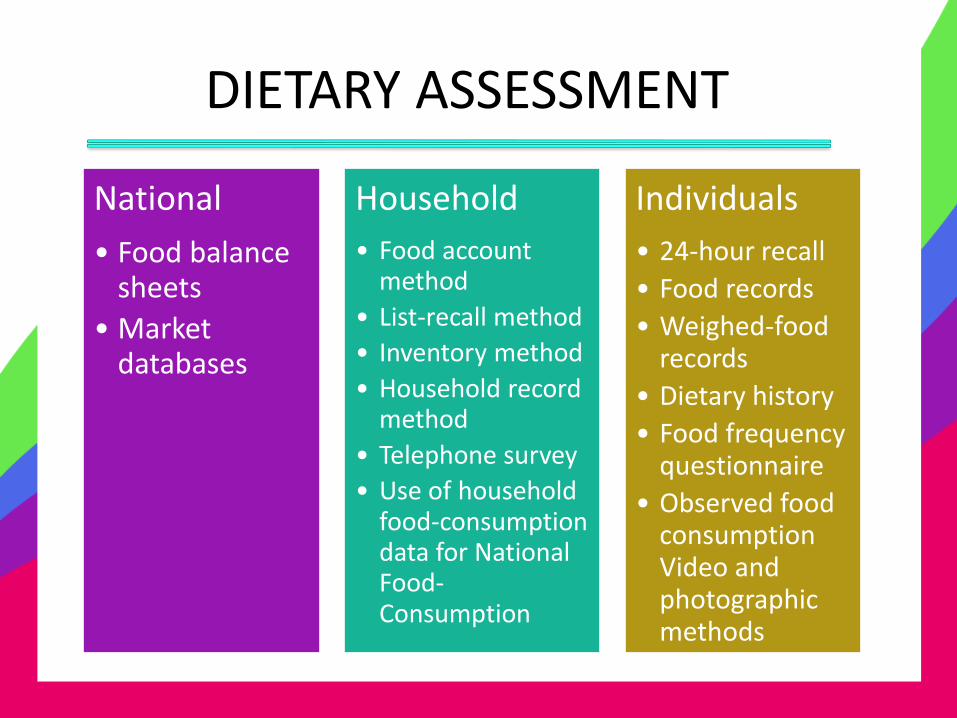
DIETARY ASSESSMENT
National
• Food balance sheets
• Market databases
Household
• Food account method
• List-recall method
• Inventory method
• Household record method
• Telephone survey
• Use of household food-consumption data for National Food-Consumption
Individuals
• 24-hour recall
• Food records
• Weighed-food records
• Dietary history
• Food frequency questionnaire
• Observed food consumption Video and photographic methods

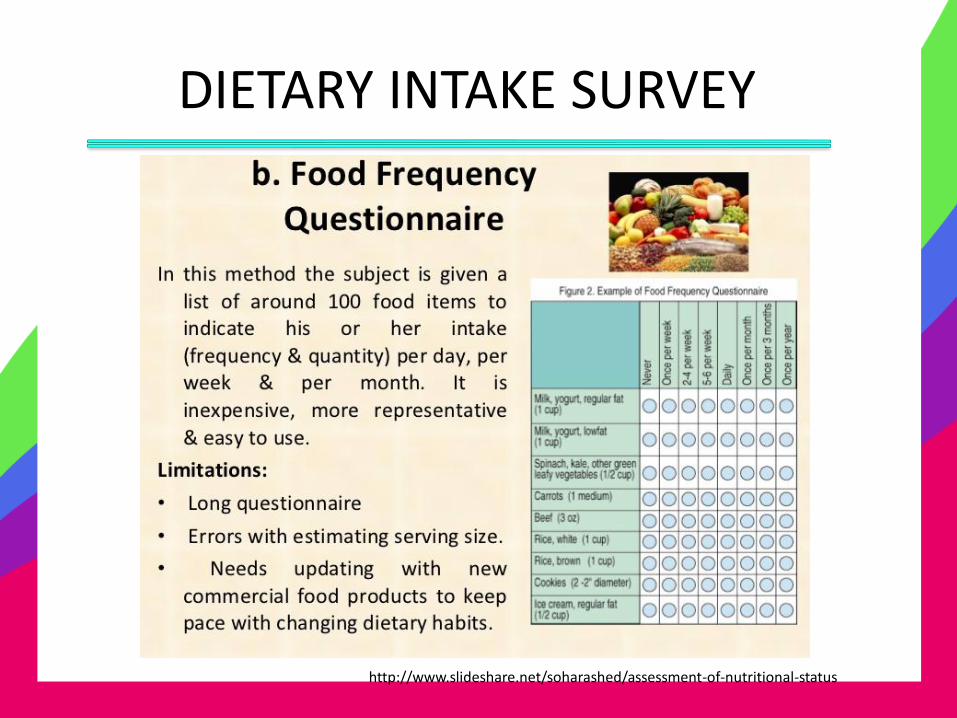
DIETARY INTAKE SURVEY
http://www.slideshare.net/soharashed/assessment-of-nutritional-status
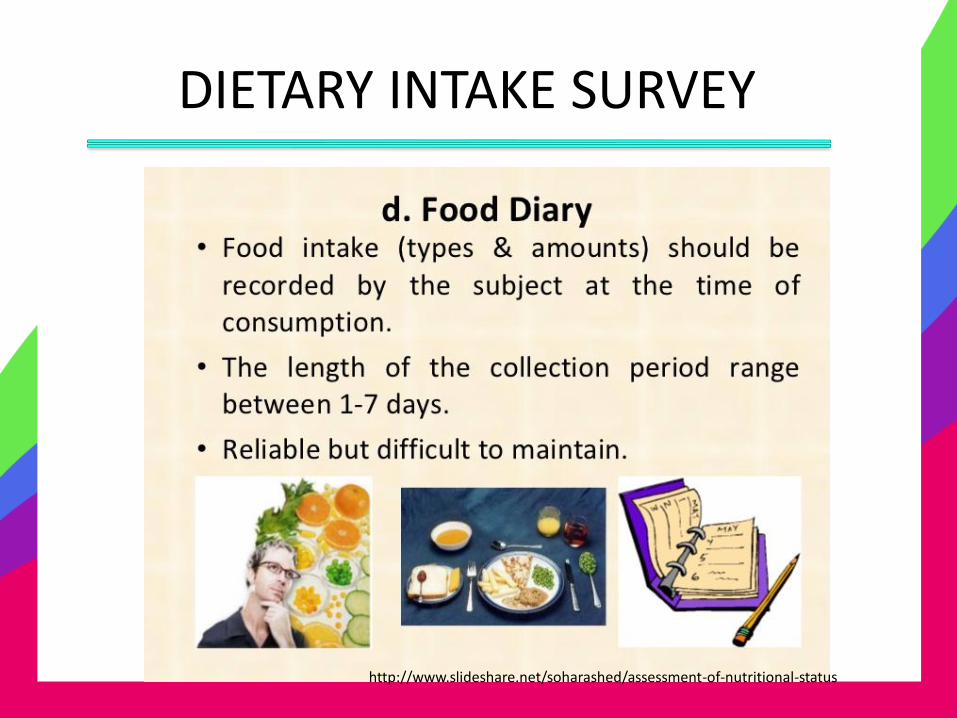
DIETARY INTAKE SURVEY
http://www.slideshare.net/soharashed/assessment-of-nutritional-status
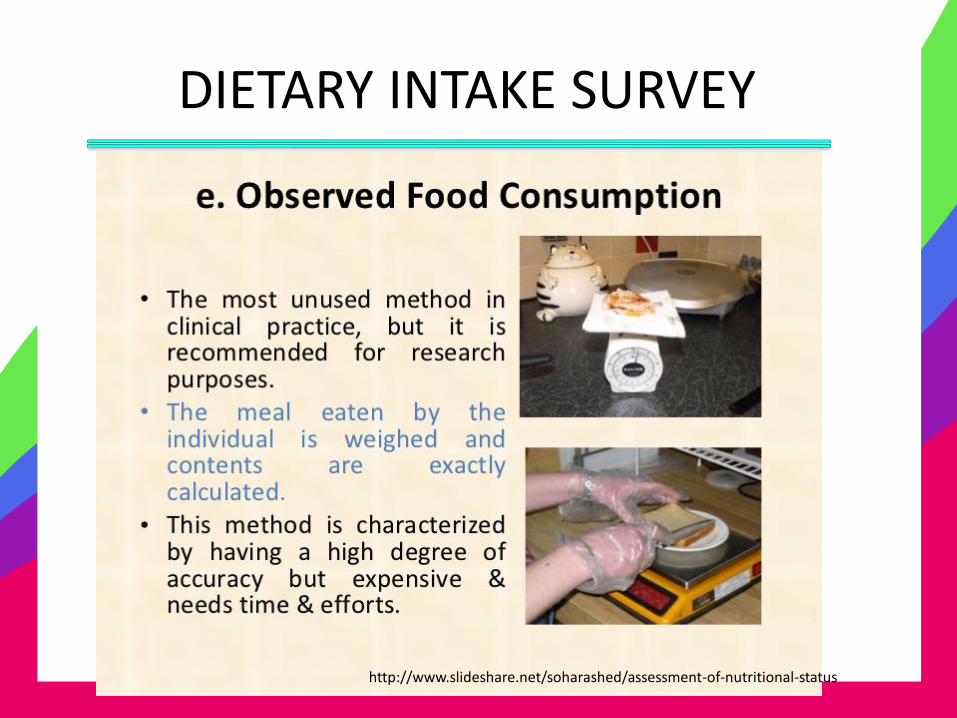
DIETARY INTAKE SURVEY
http://www.slideshare.net/soharashed/assessment-of-nutritional-status
DIETARY INTAKE SURVEY
http://www.slideshare.net/soharashed/assessment-of-nutritional-status
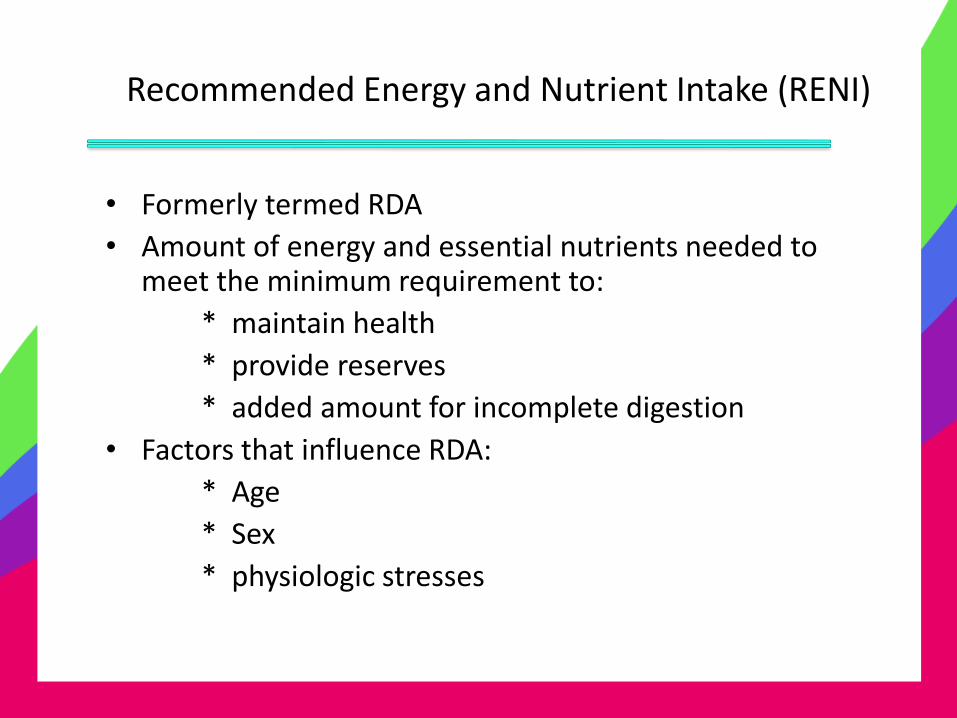
Recommended Energy and Nutrient Intake (RENI)
• Formerly termed RDA
• Amount of energy and essential nutrients needed to meet the minimum requirement to:
* maintain health
* provide reserves
* added amount for incomplete digestion
• Factors that influence RDA:
* Age
* Sex
* physiologic stresses
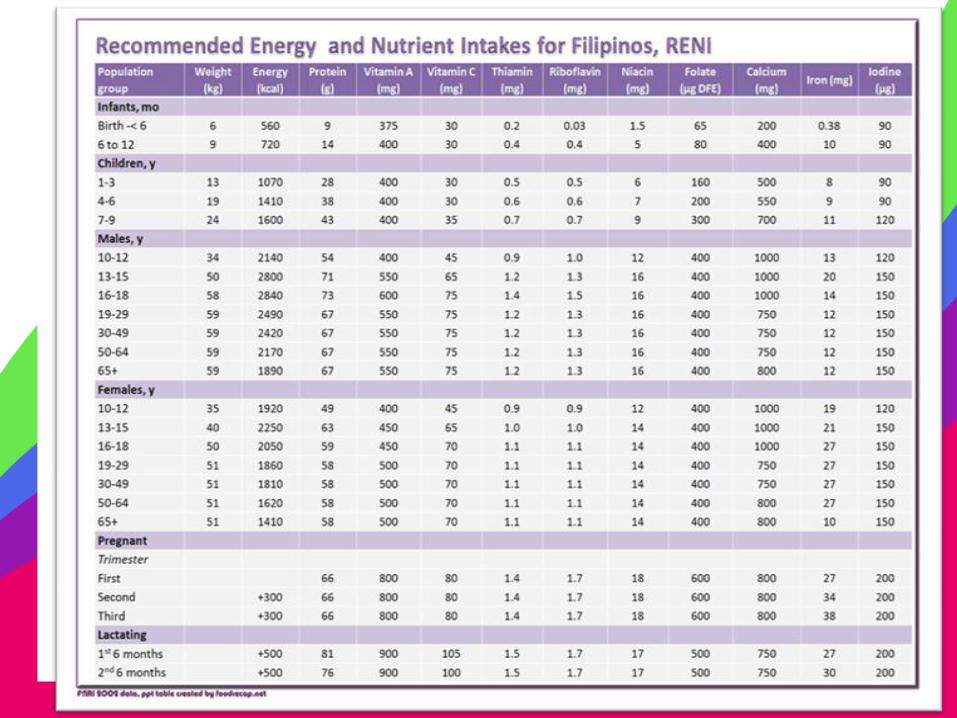
Recommended Energy and Nutrient Intake (RENI) Philippines, 2002 Edition
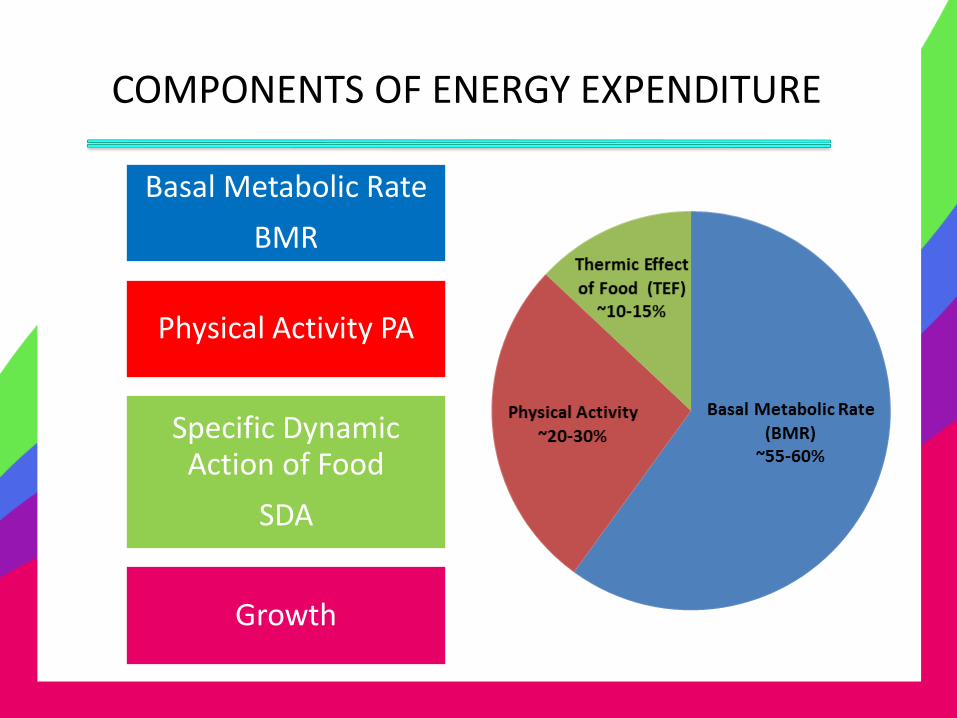
COMPONENTS OF ENERGY EXPENDITURE
Basal Metabolic Rate
BMR
Physical Activity PA
Specific Dynamic Action of Food
SDA
Growth
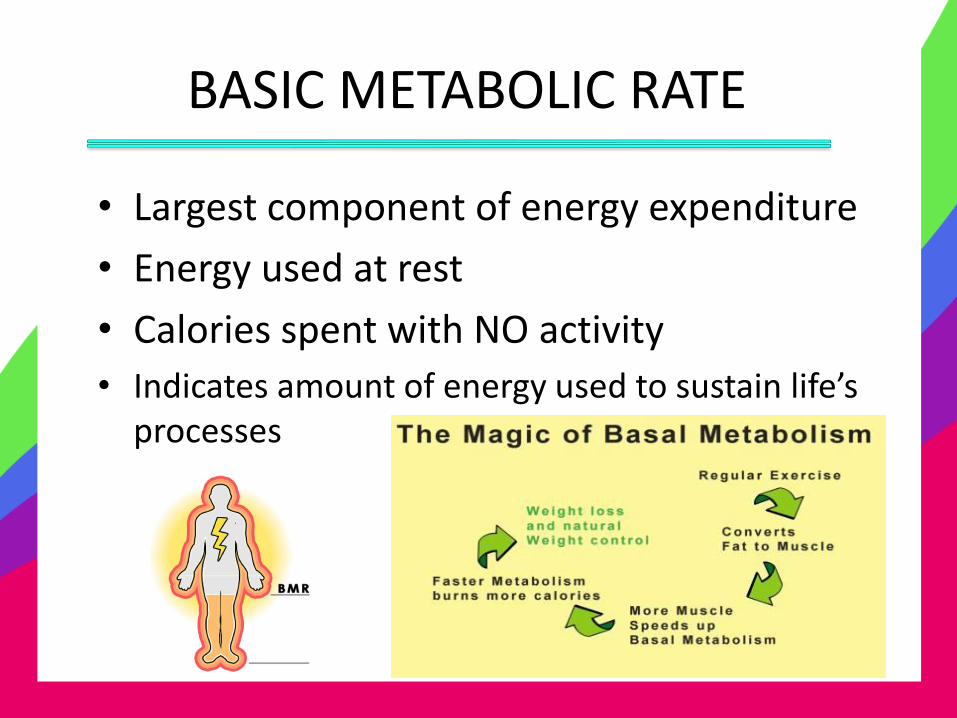
BASIC METABOLIC RATE
• Largest component of energy expenditure
• Energy used at rest
• Calories spent with NO activity
• Indicates amount of energy used to sustain life’s processes
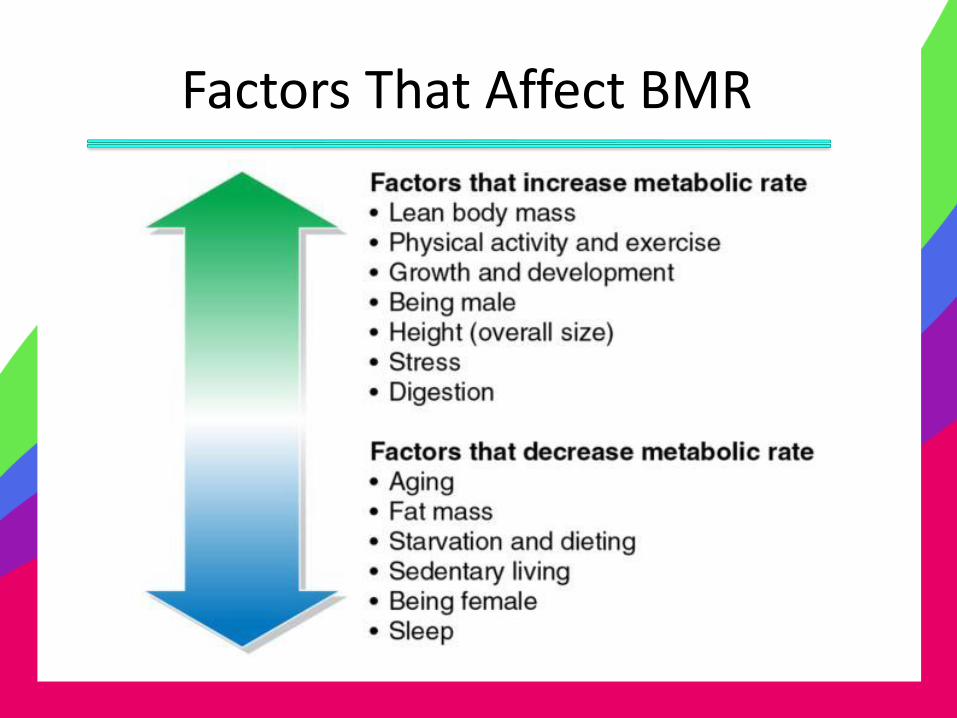
Factors That Affect BMR
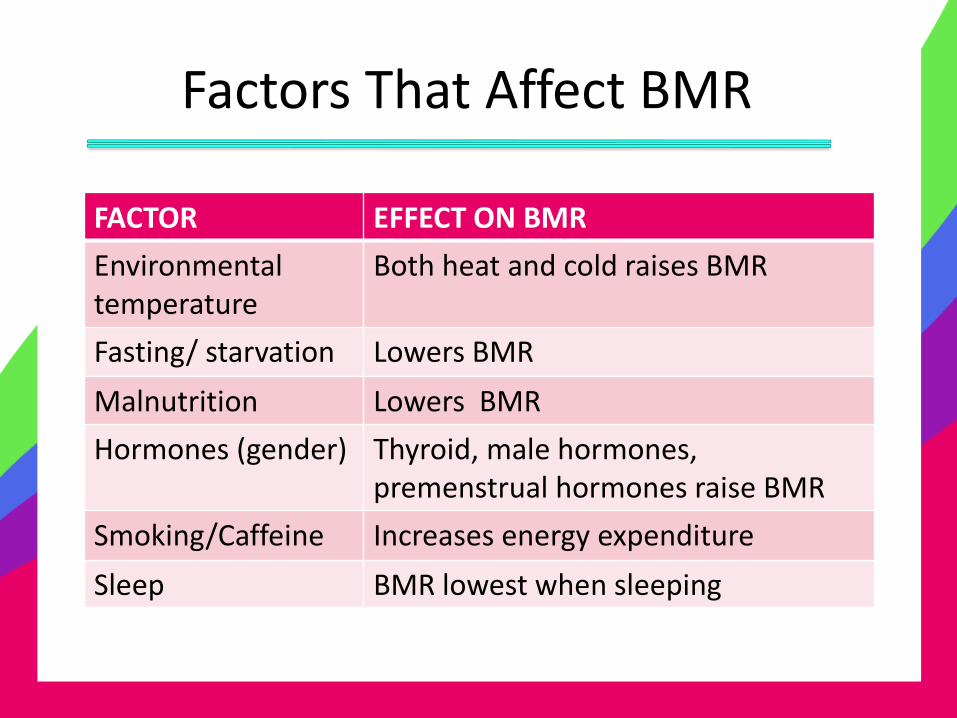
Factors That Affect BMR
FACTOR EFFECT ON BMR
Environmental temperature
Both heat and cold raises BMR
Fasting/ starvation Lowers BMR
Malnutrition Lowers BMR
Hormones (gender) Thyroid, male hormones, premenstrual hormones raise BMR
Smoking/Caffeine Increases energy expenditure
Sleep BMR lowest when sleeping
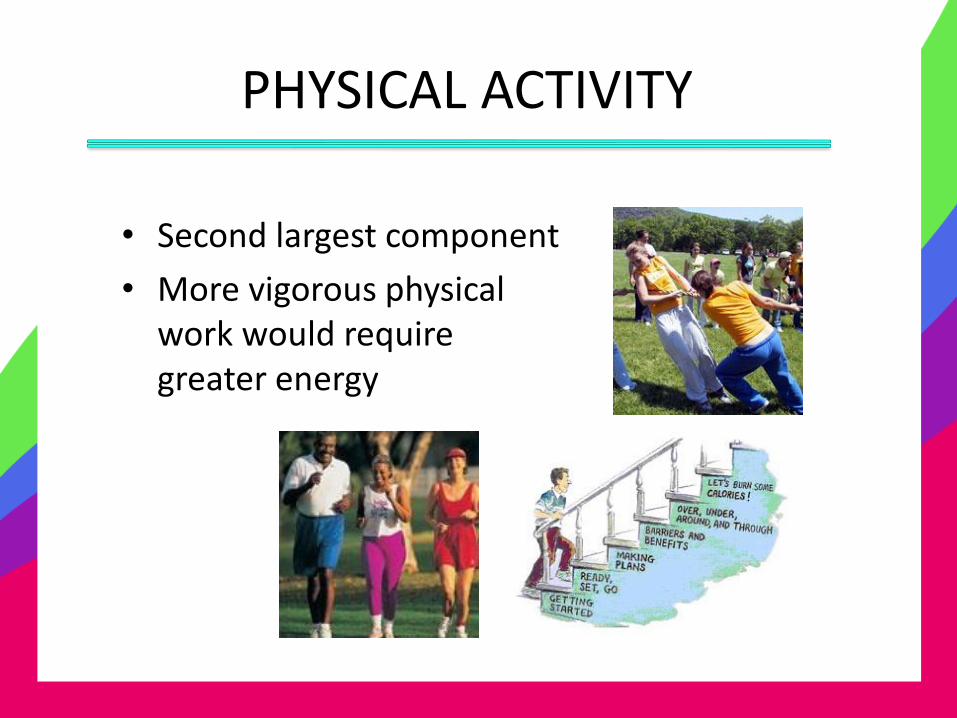
PHYSICAL ACTIVITY
• Second largest component
• More vigorous physical work would require greater energy
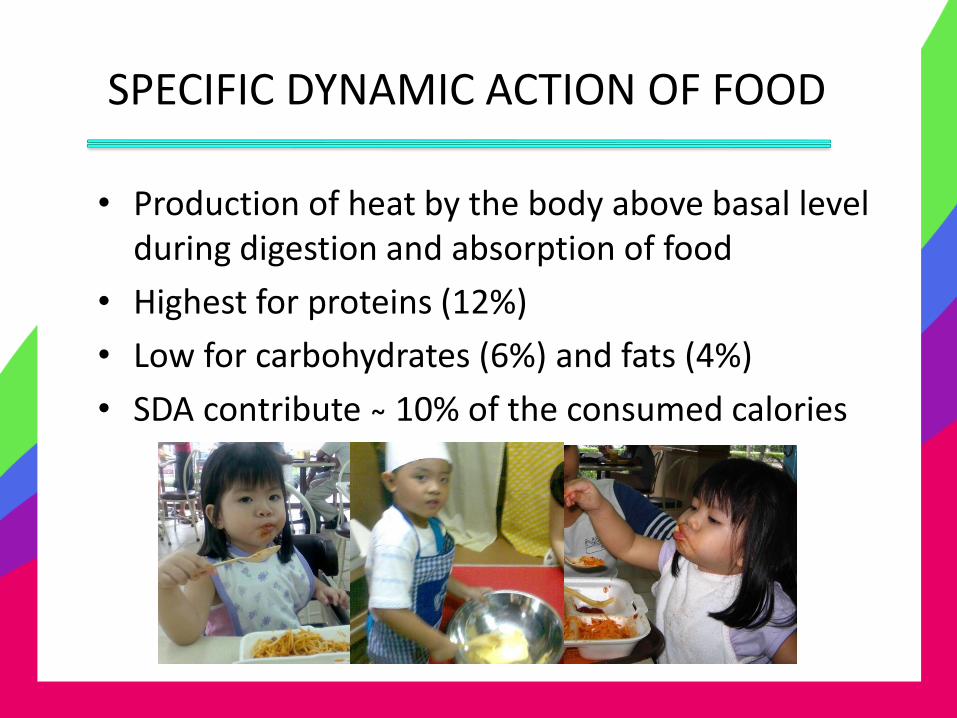
SPECIFIC DYNAMIC ACTION OF FOOD
• Production of heat by the body above basal level during digestion and absorption of food
• Highest for proteins (12%)
• Low for carbohydrates (6%) and fats (4%)
• SDA contribute ̴ 10% of the consumed calories
GROWTH
Additional energy to cover for the
cost of increasing body weight and height
ENERGY REQUIREMENT
• Most basic nutritional requirement taking precedence over all other nutritional needs
• Energy – the capacity to do work
• Measured in terms of calories
Calorie (C)
• Standard unit for measuring energy
• Amount of heat energy needed to raise the temperature of 1 ml of water by 1 degree centigrade.
• Kilocalorie (C)= 1000 cal
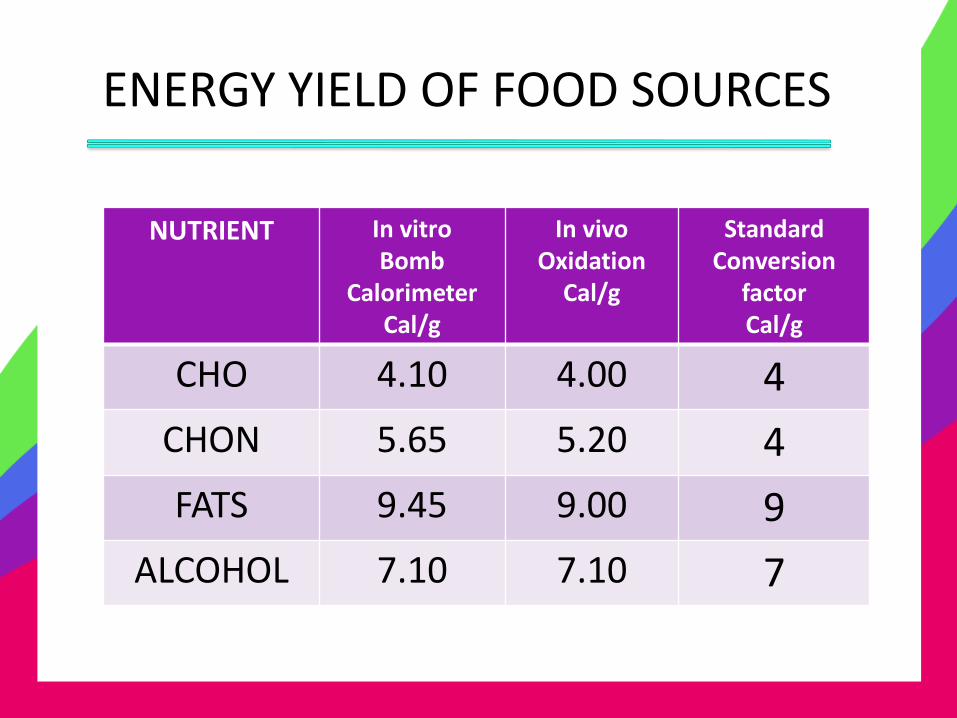
ENERGY YIELD OF FOOD SOURCES
NUTRIENT In vitro Bomb
Calorimeter Cal/g
In vivo Oxidation
Cal/g
Standard Conversion
factor Cal/g
CHO 4.10 4.00 4
CHON 5.65 5.20 4
FATS 9.45 9.00 9
ALCOHOL 7.10 7.10 7
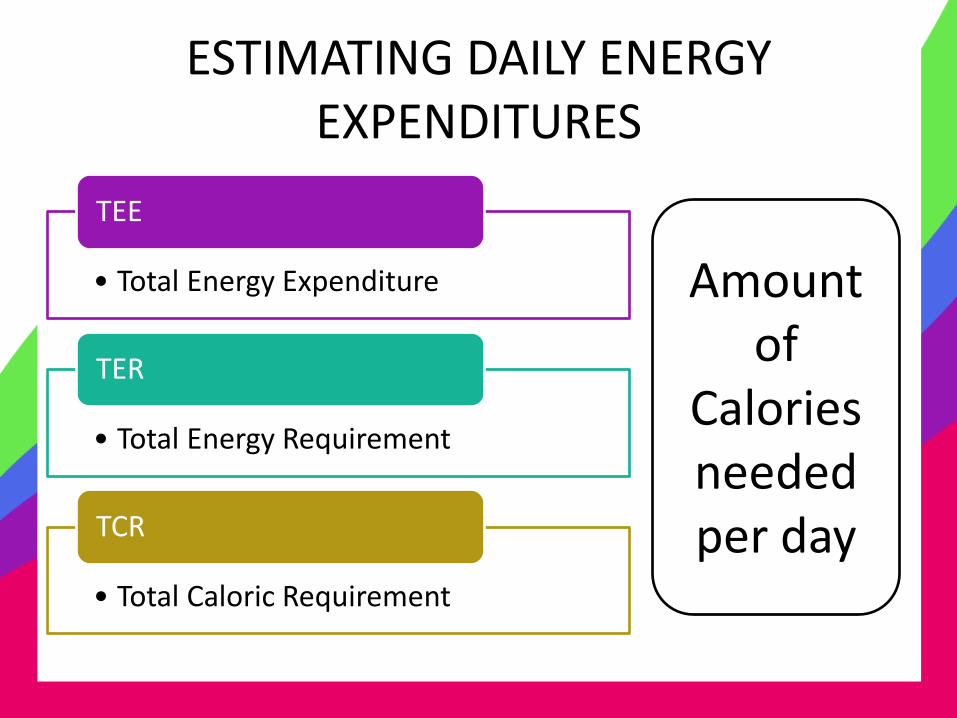
ESTIMATING DAILY ENERGY EXPENDITURES
• Total Energy Expenditure
TEE
• Total Energy Requirement
TER
• Total Caloric Requirement
TCR
Amount of
Calories needed per day
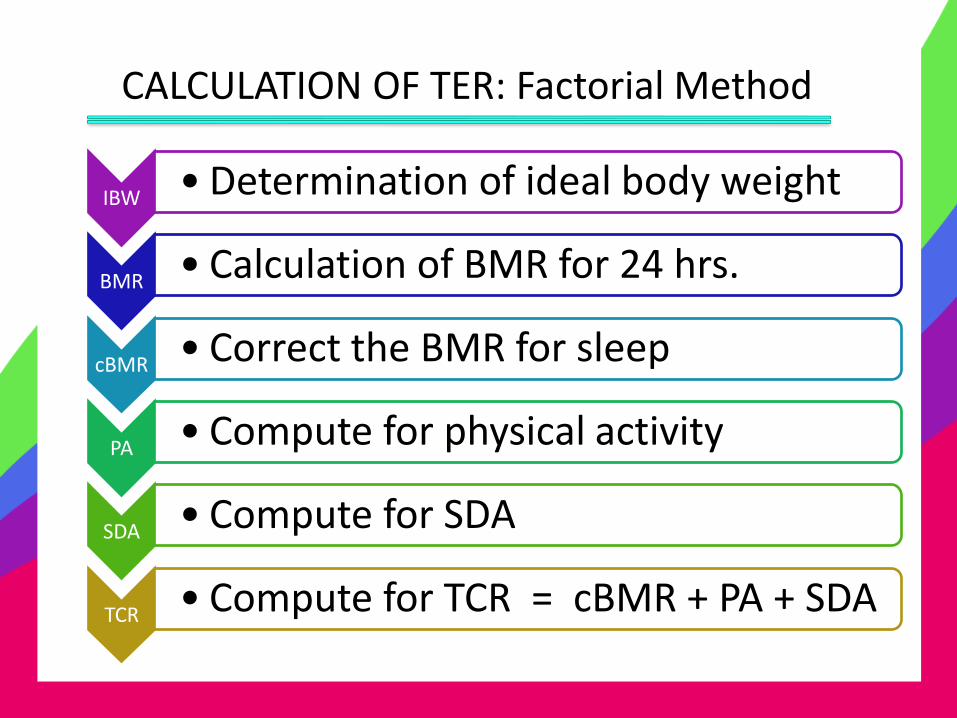
CALCULATION OF TER: Factorial Method
IBW • Determination of ideal body weight
BMR • Calculation of BMR for 24 hrs.
cBMR • Correct the BMR for sleep
PA • Compute for physical activity
SDA • Compute for SDA
TCR • Compute for TCR = cBMR + PA + SDA
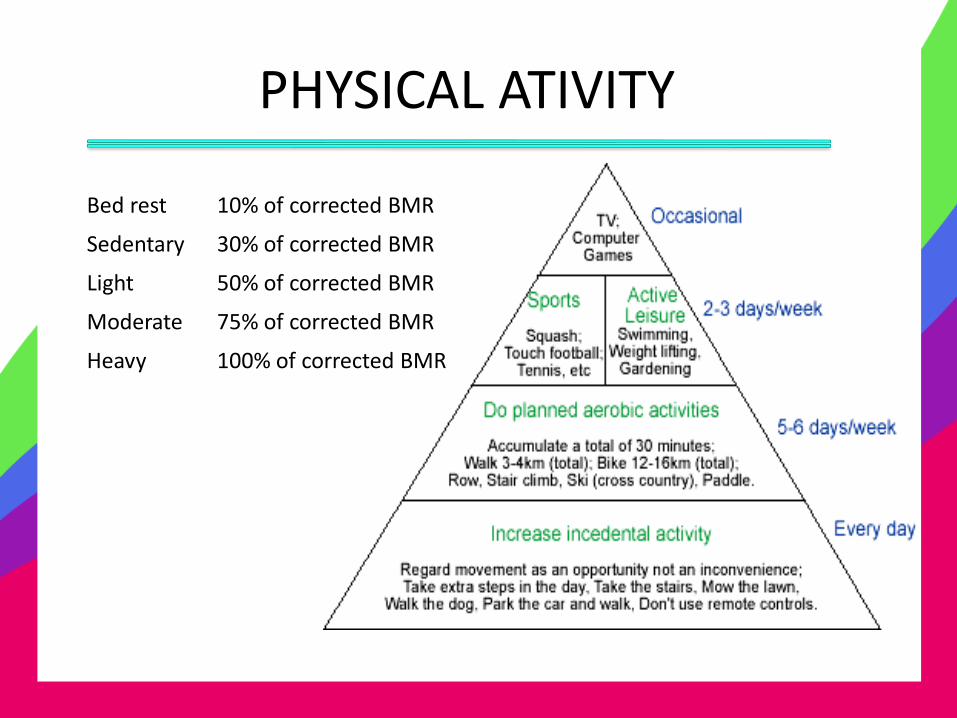
PHYSICAL ATIVITY
Bed rest 10% of corrected BMR
Sedentary 30% of corrected BMR
Light 50% of corrected BMR
Moderate 75% of corrected BMR
Heavy 100% of corrected BMR
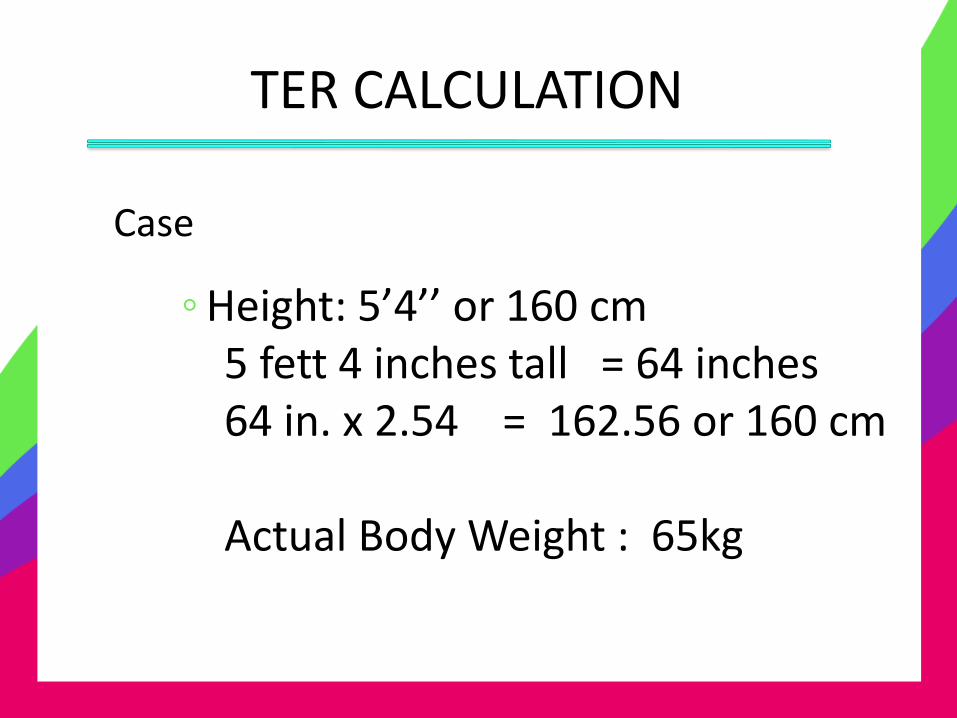
TER CALCULATION
Case
◦Height: 5’4’’ or 160 cm
5 fett 4 inches tall = 64 inches 64 in. x 2.54 = 162.56 or 160 cm Actual Body Weight : 65kg
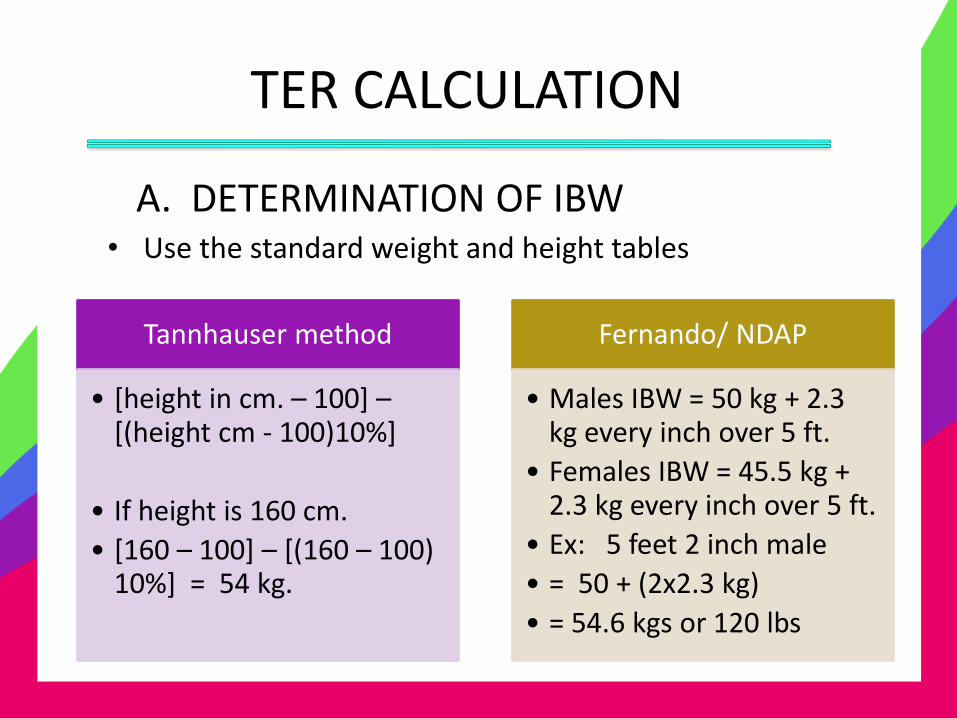
TER CALCULATION
A. DETERMINATION OF IBW • Use the standard weight and height tables
Tannhauser method
• [height in cm. – 100] – [(height cm - 100)10%]
• If height is 160 cm.
• [160 – 100] – [(160 – 100) 10%] = 54 kg.
Fernando/ NDAP
• Males IBW = 50 kg + 2.3 kg every inch over 5 ft.
• Females IBW = 45.5 kg + 2.3 kg every inch over 5 ft.
• Ex: 5 feet 2 inch male
• = 50 + (2x2.3 kg)
• = 54.6 kgs or 120 lbs
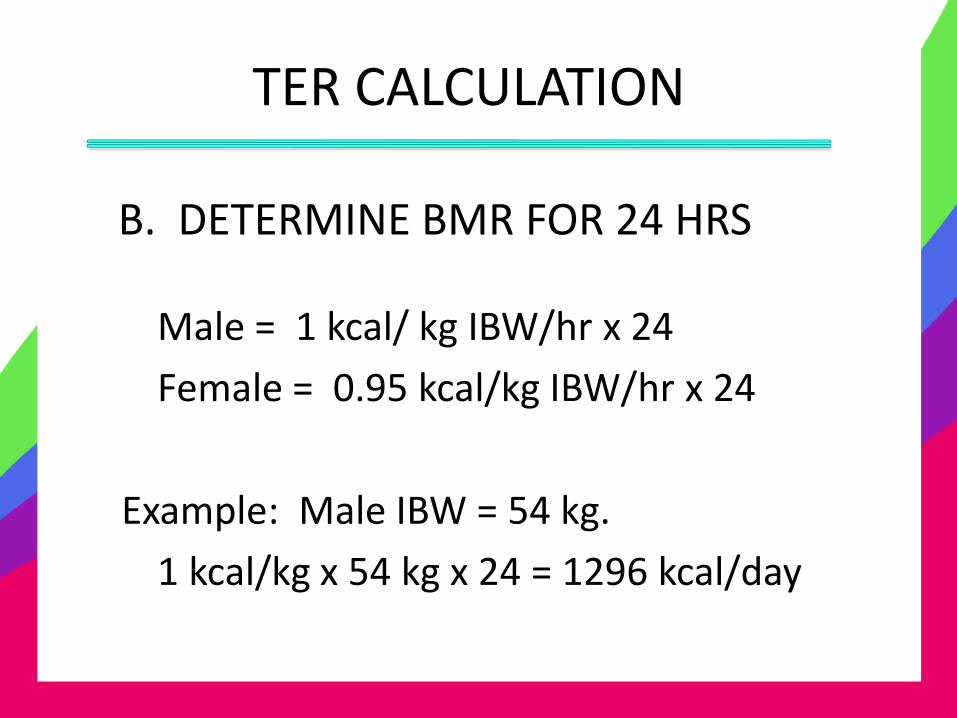
TER CALCULATION
B. DETERMINE BMR FOR 24 HRS
Male = 1 kcal/ kg IBW/hr x 24
Female = 0.95 kcal/kg IBW/hr x 24
Example: Male IBW = 54 kg.
1 kcal/kg x 54 kg x 24 = 1296 kcal/day
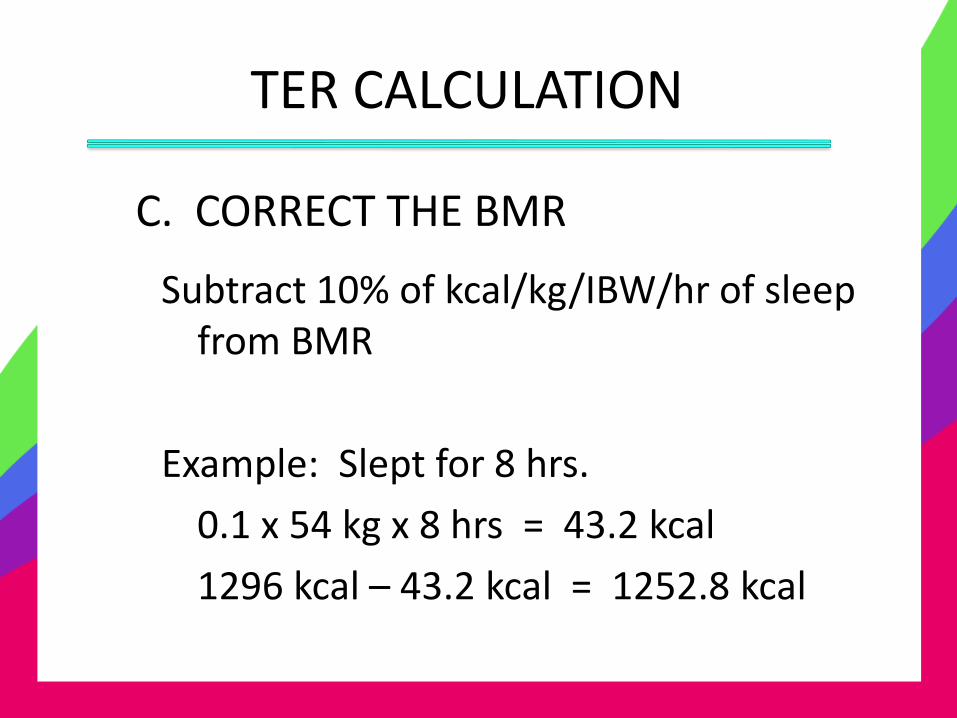
TER CALCULATION
C. CORRECT THE BMR
Subtract 10% of kcal/kg/IBW/hr of sleep from BMR
Example: Slept for 8 hrs.
0.1 x 54 kg x 8 hrs = 43.2 kcal
1296 kcal – 43.2 kcal = 1252.8 kcal
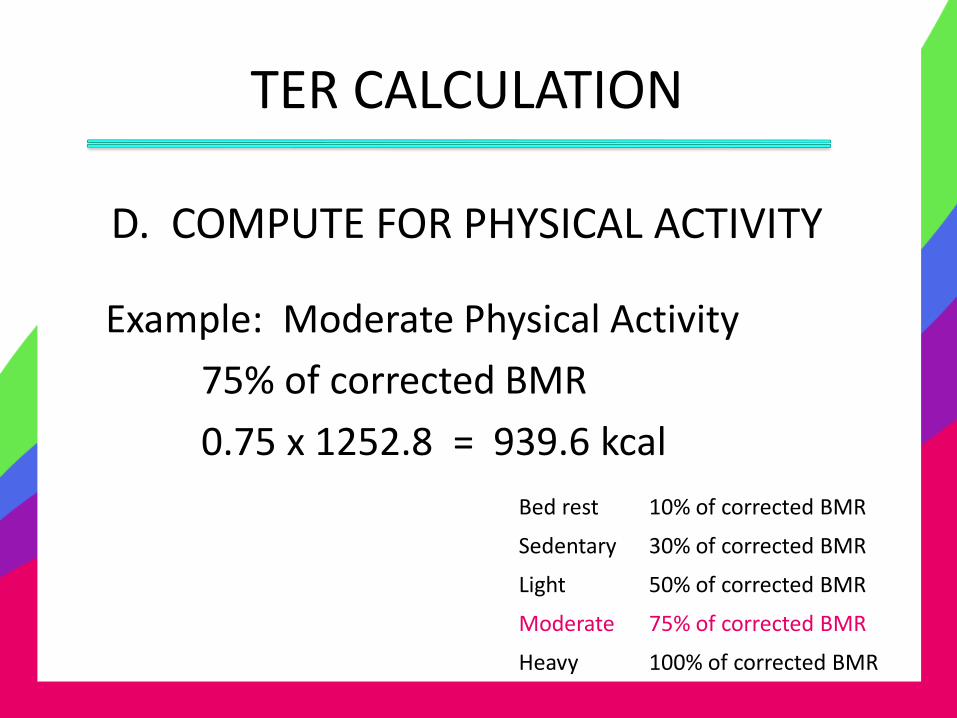
TER CALCULATION
D. COMPUTE FOR PHYSICAL ACTIVITY
Example: Moderate Physical Activity
75% of corrected BMR
0.75 x 1252.8 = 939.6 kcal
Bed rest 10% of corrected BMR
Sedentary 30% of corrected BMR
Light 50% of corrected BMR
Moderate 75% of corrected BMR
Heavy 100% of corrected BMR
TER CALCULATION
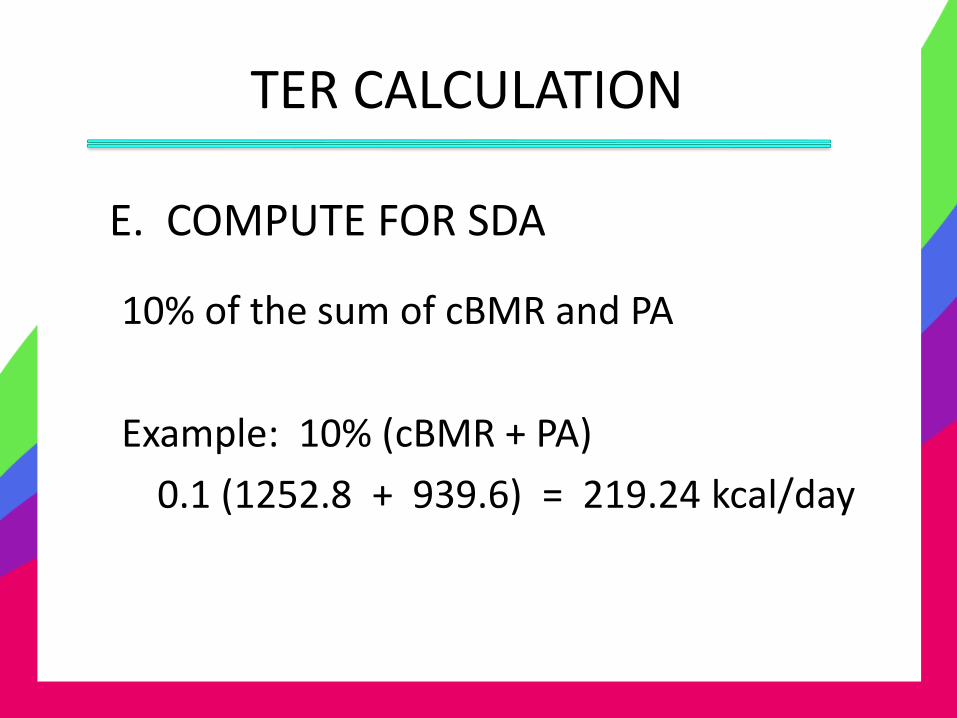
E. COMPUTE FOR SDA
10% of the sum of cBMR and PA
Example: 10% (cBMR + PA)
0.1 (1252.8 + 939.6) = 219.24 kcal/day
TER CALCULATION
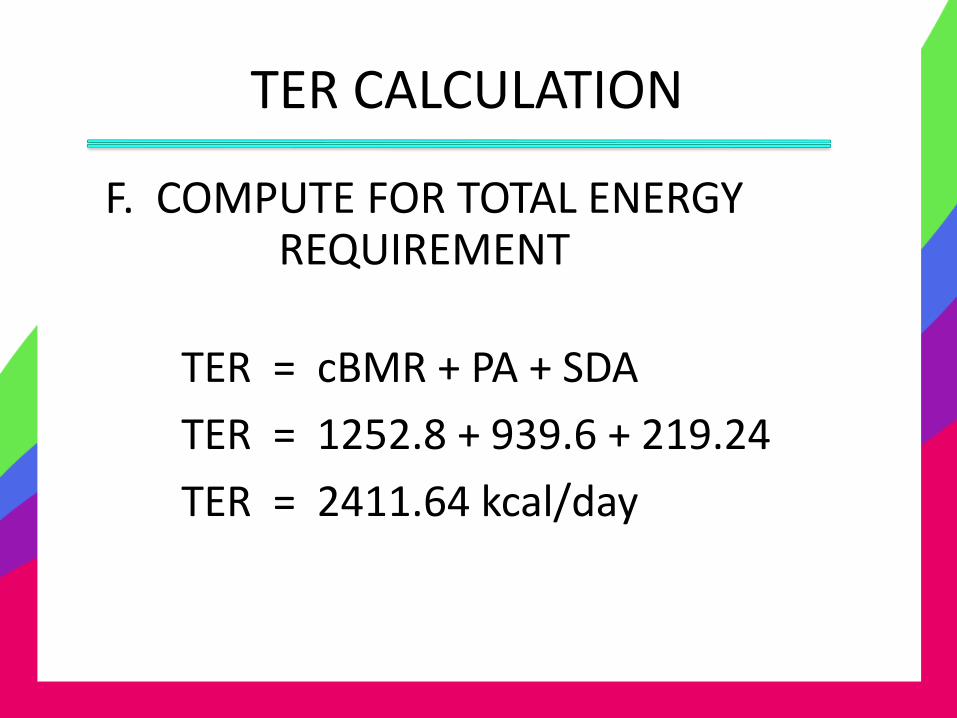
F. COMPUTE FOR TOTAL ENERGY REQUIREMENT
TER = cBMR + PA + SDA
TER = 1252.8 + 939.6 + 219.24
TER = 2411.64 kcal/day
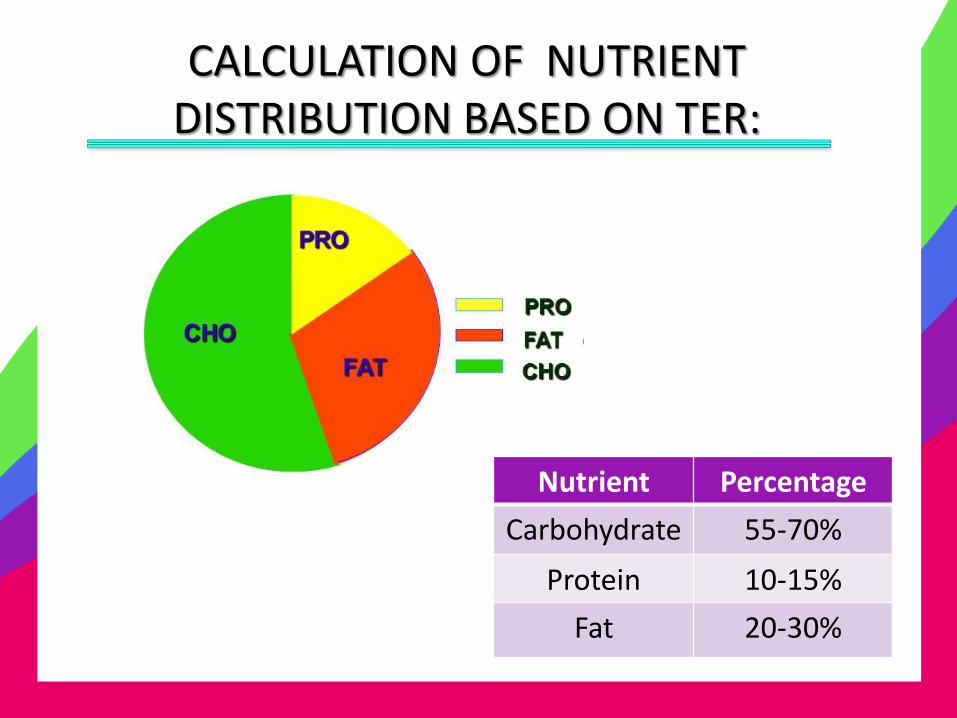
CALCULATION OF NUTRIENT DISTRIBUTION BASED ON TER:
Nutrient Percentage
Carbohydrate 55-70%
Protein 10-15%
Fat 20-30%
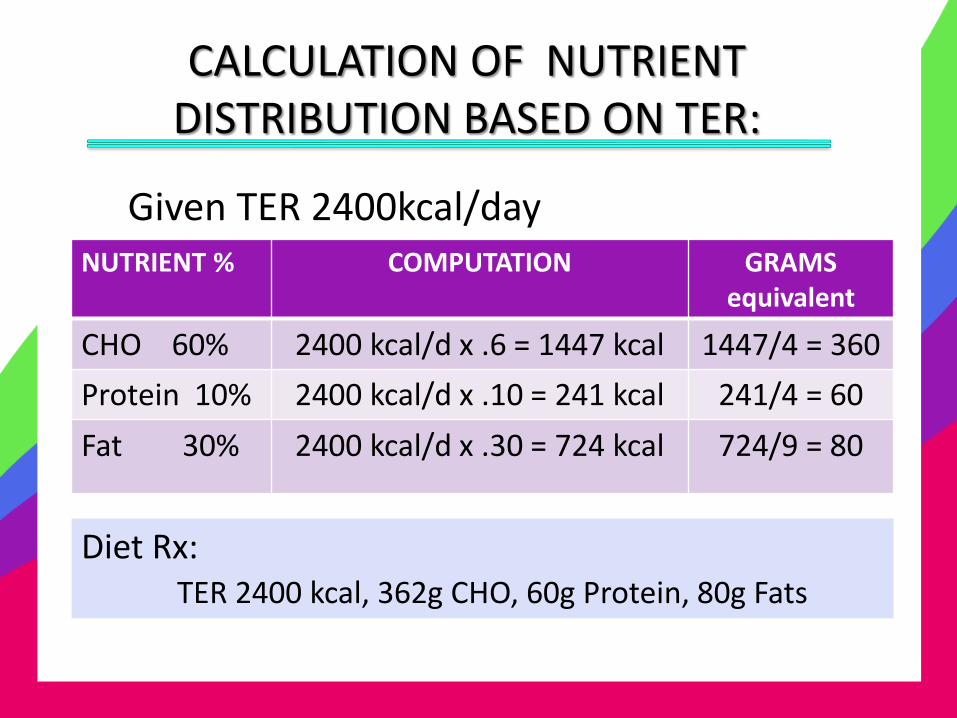
Given TER 2400kcal/day
NUTRIENT % COMPUTATION GRAMS equivalent
CHO 60% 2400 kcal/d x .6 = 1447 kcal 1447/4 = 360
Protein 10% 2400 kcal/d x .10 = 241 kcal 241/4 = 60
Fat 30% 2400 kcal/d x .30 = 724 kcal 724/9 = 80
Diet Rx: TER 2400 kcal, 362g CHO, 60g Protein, 80g Fats
CALCULATION OF NUTRIENT DISTRIBUTION BASED ON TER:
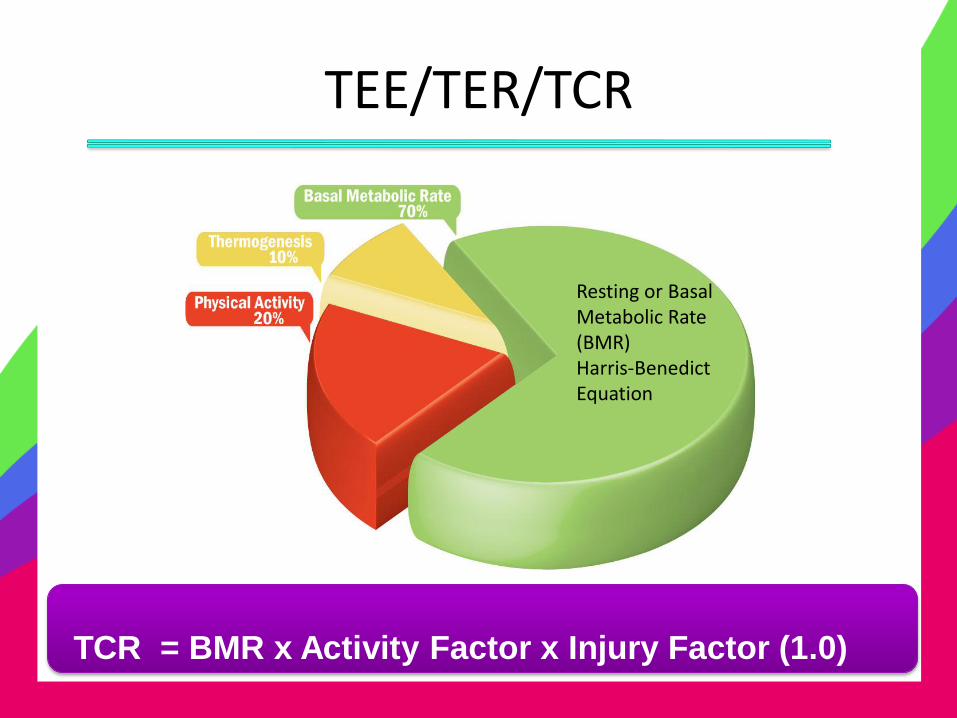
TEE/TER/TCR
TCR = BMR x Activity Factor x Injury Factor (1.0)
Resting or Basal Metabolic Rate (BMR) Harris-Benedict Equation
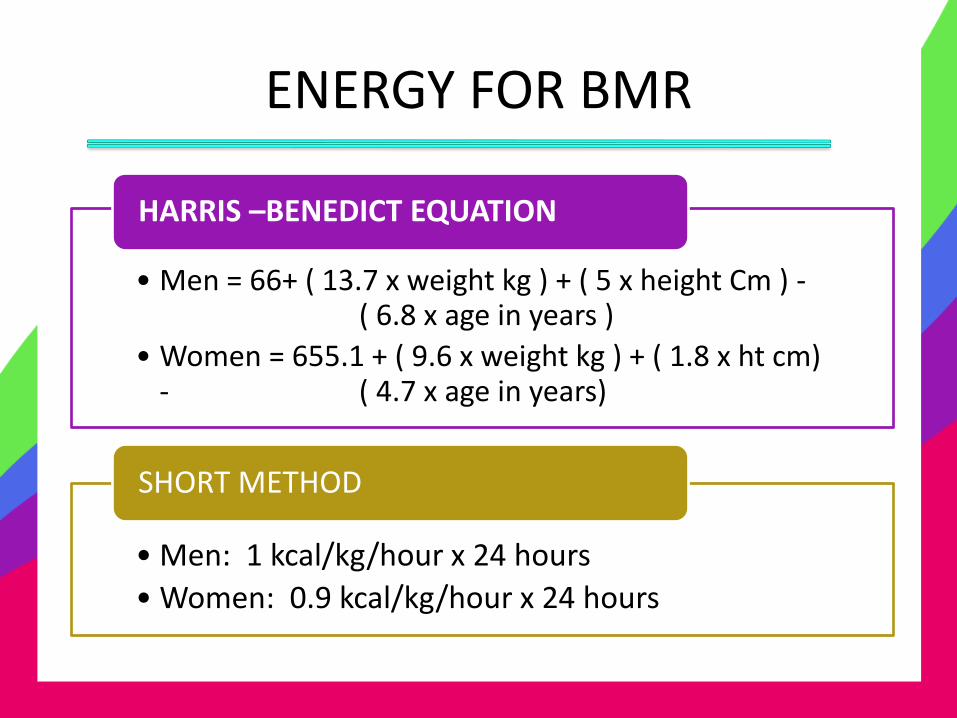
ENERGY FOR BMR
• Men = 66+ ( 13.7 x weight kg ) + ( 5 x height Cm ) - ( 6.8 x age in years )
• Women = 655.1 + ( 9.6 x weight kg ) + ( 1.8 x ht cm) - ( 4.7 x age in years)
HARRIS –BENEDICT EQUATION
• Men: 1 kcal/kg/hour x 24 hours
• Women: 0.9 kcal/kg/hour x 24 hours
SHORT METHOD
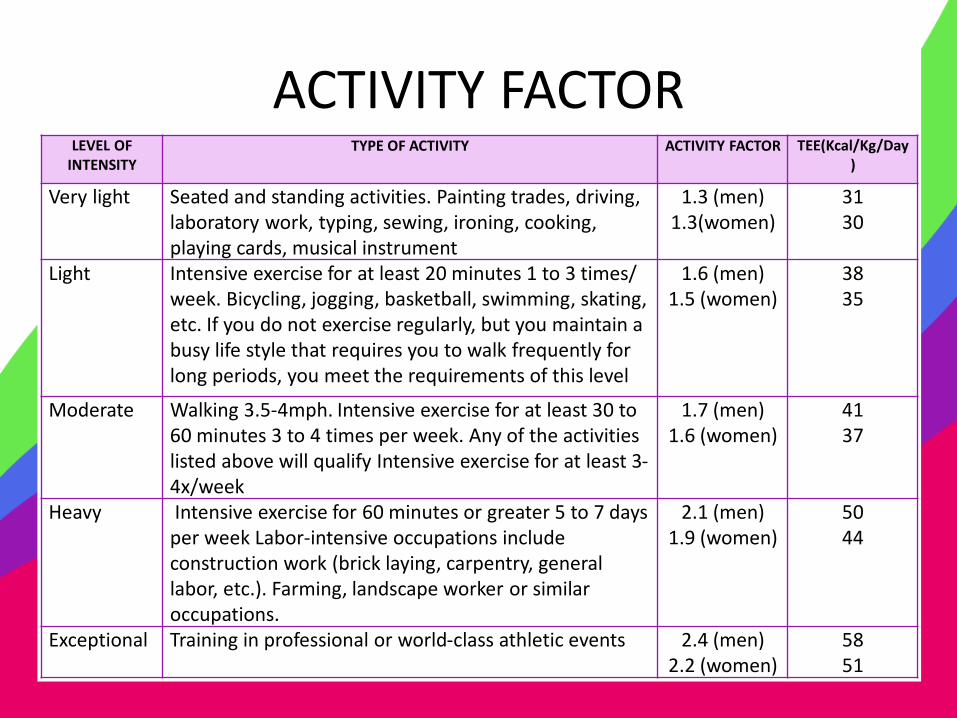
ACTIVITY FACTOR LEVEL OF
INTENSITY
TYPE OF ACTIVITY ACTIVITY FACTOR TEE(Kcal/Kg/Day)
Very light Seated and standing activities. Painting trades, driving, laboratory work, typing, sewing, ironing, cooking, playing cards, musical instrument
1.3 (men) 1.3(women)
31 30
Light Intensive exercise for at least 20 minutes 1 to 3 times/ week. Bicycling, jogging, basketball, swimming, skating, etc. If you do not exercise regularly, but you maintain a busy life style that requires you to walk frequently for long periods, you meet the requirements of this level
1.6 (men) 1.5 (women)
38 35
Moderate Walking 3.5-4mph. Intensive exercise for at least 30 to 60 minutes 3 to 4 times per week. Any of the activities listed above will qualify Intensive exercise for at least 3-4x/week
1.7 (men) 1.6 (women)
41 37
Heavy Intensive exercise for 60 minutes or greater 5 to 7 days per week Labor-intensive occupations include construction work (brick laying, carpentry, general labor, etc.). Farming, landscape worker or similar occupations.
2.1 (men) 1.9 (women)
50 44
Exceptional Training in professional or world-class athletic events 2.4 (men) 2.2 (women)
58 51
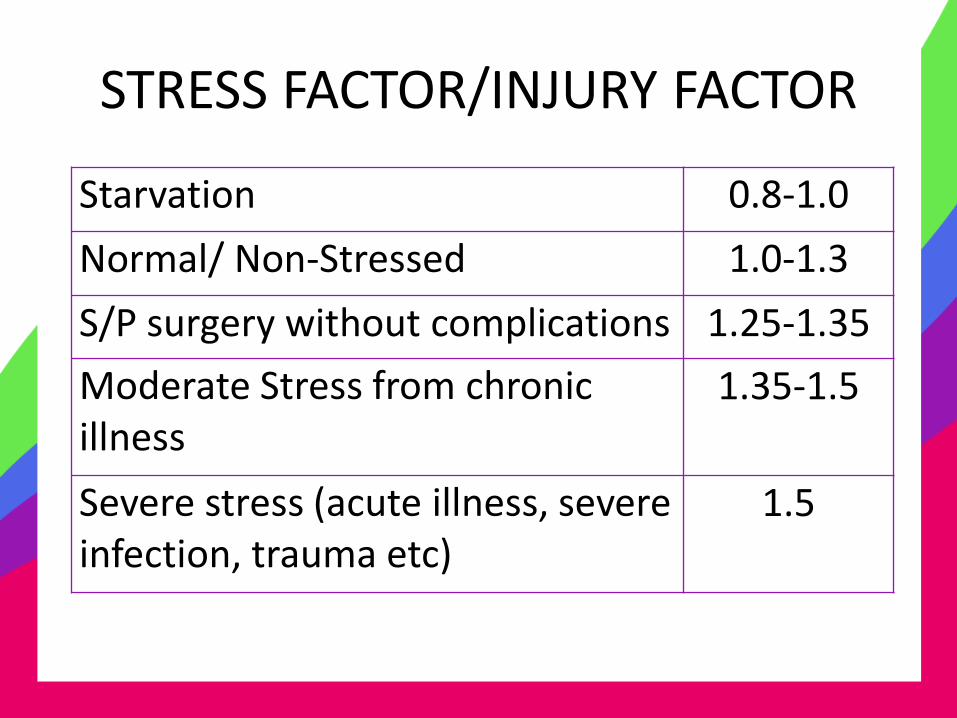
STRESS FACTOR/INJURY FACTOR
Starvation 0.8-1.0
Normal/ Non-Stressed 1.0-1.3
S/P surgery without complications 1.25-1.35
Moderate Stress from chronic illness
1.35-1.5
Severe stress (acute illness, severe infection, trauma etc)
1.5
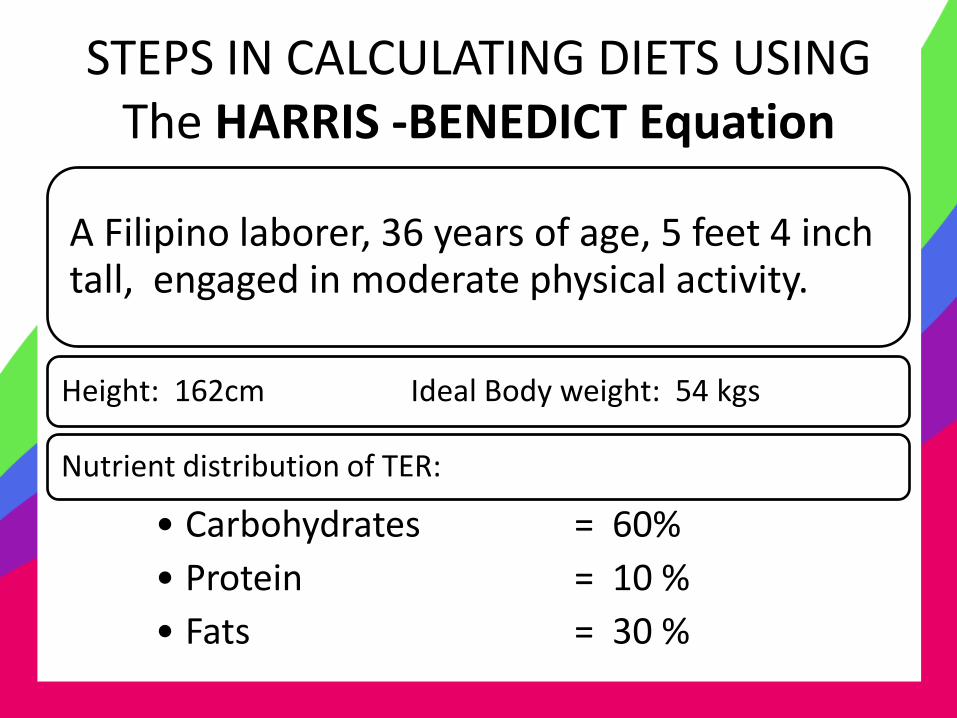
STEPS IN CALCULATING DIETS USING The HARRIS -BENEDICT Equation
A Filipino laborer, 36 years of age, 5 feet 4 inch tall, engaged in moderate physical activity.
Height: 162cm Ideal Body weight: 54 kgs
Nutrient distribution of TER:
• Carbohydrates = 60%
• Protein = 10 %
• Fats = 30 %
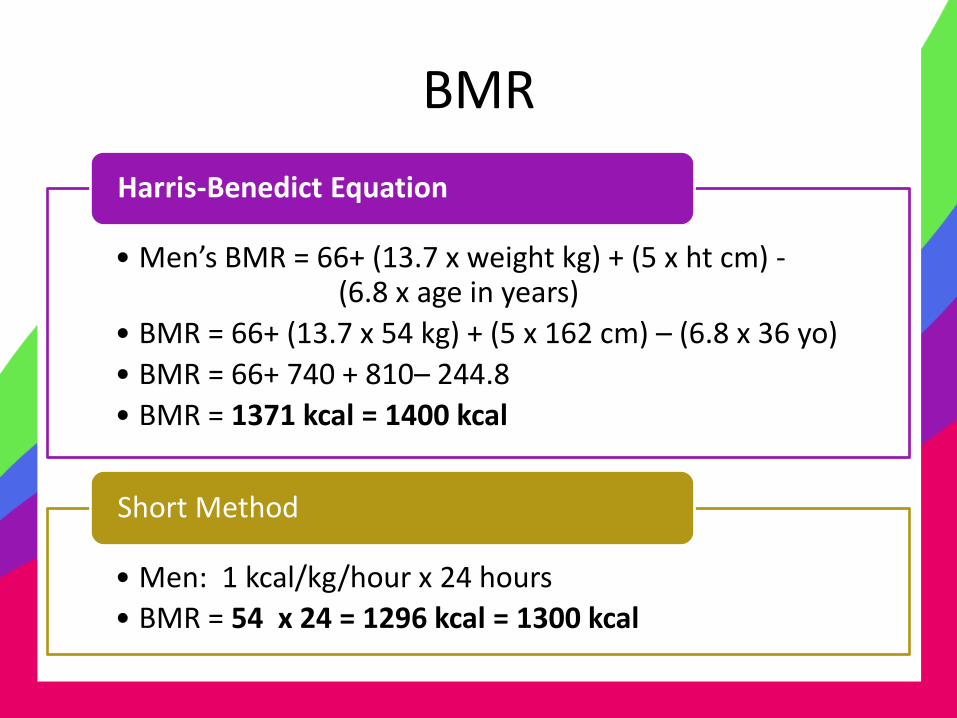
BMR
• Men’s BMR = 66+ (13.7 x weight kg) + (5 x ht cm) - (6.8 x age in years)
• BMR = 66+ (13.7 x 54 kg) + (5 x 162 cm) – (6.8 x 36 yo)
• BMR = 66+ 740 + 810– 244.8
• BMR = 1371 kcal = 1400 kcal
Harris-Benedict Equation
• Men: 1 kcal/kg/hour x 24 hours
• BMR = 54 x 24 = 1296 kcal = 1300 kcal
Short Method

TOTAL CALORIC REQUIREMENT
TCR = BMR x Activity Factor x Injury Factor (1.0)
TCR = 1400 x 1.7 x 1 = 2380 kcal or 2400 kcal (round to nearest 50)
TCR = 30-58 kcal/kg/day (refer to table)
= 41 x 54 = 2200 kcal

ACTIVITY FACTOR LEVEL OF
INTENSITY
TYPE OF ACTIVITY ACTIVITY FACTOR TEE(Kcal/Kg/Day)
Very light Seated and standing activities. Painting trades, driving, laboratory work, typing, sewing, ironing, cooking, playing cards, musical instrument
1.3 (men) 1.3(women)
31 30
Light Intensive exercise for at least 20 minutes 1 to 3 times/ week. Bicycling, jogging, basketball, swimming, skating, etc. If you do not exercise regularly, but you maintain a busy life style that requires you to walk frequently for long periods, you meet the requirements of this level
1.6 (men) 1.5 (women)
38 35
Moderate Walking 3.5-4mph. Intensive exercise for at least 30 to 60 minutes 3 to 4 times per week. Any of the activities listed above will qualify Intensive exercise for at least 3-4x/week
1.7 (men) 1.6 (women)
41 37
Heavy Intensive exercise for 60 minutes or greater 5 to 7 days per week Labor-intensive occupations include construction work (brick laying, carpentry, general labor, etc.). Farming, landscape worker or similar occupations.
2.1 (men) 1.9 (women)
50 44
Exceptional Training in professional or world-class athletic events 2.4 (men) 2.2 (women)
58 51
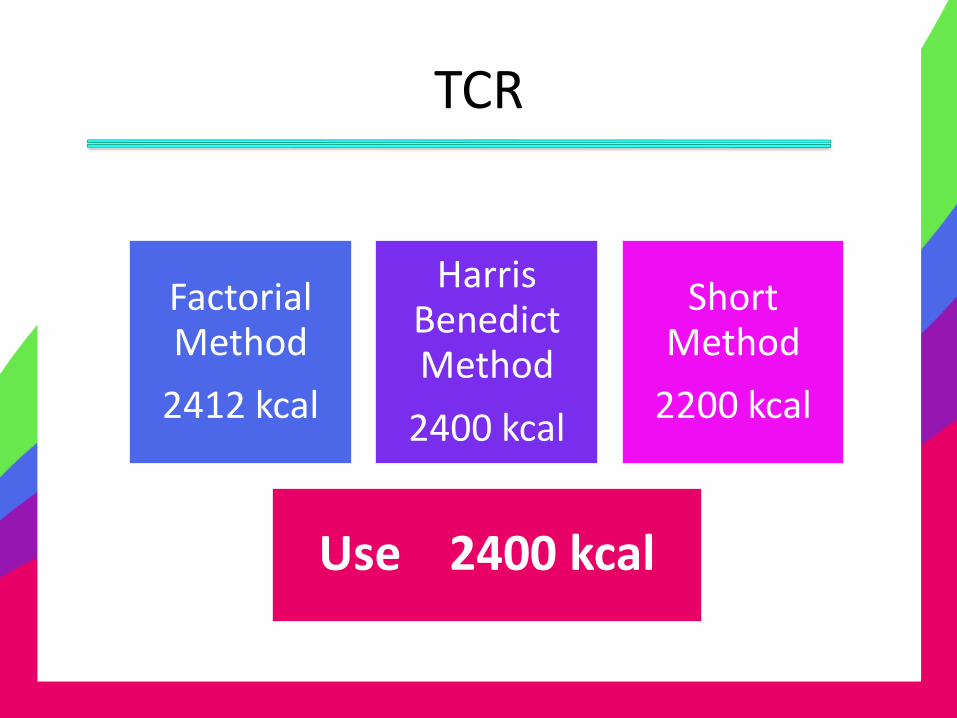
TCR
Factorial Method
2412 kcal
Harris Benedict Method
2400 kcal
Short Method
2200 kcal
Use 2400 kcal
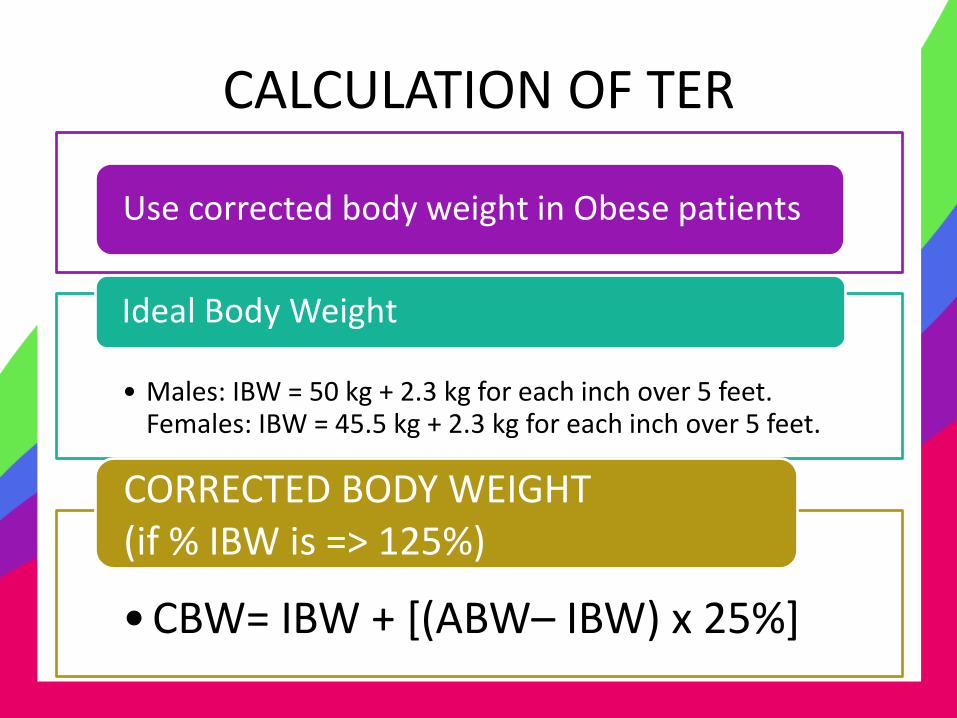
CALCULATION OF TER
Use corrected body weight in Obese patients
• Males: IBW = 50 kg + 2.3 kg for each inch over 5 feet. Females: IBW = 45.5 kg + 2.3 kg for each inch over 5 feet.
Ideal Body Weight
• CBW= IBW + [(ABW– IBW) x 25%]
CORRECTED BODY WEIGHT (if % IBW is => 125%)
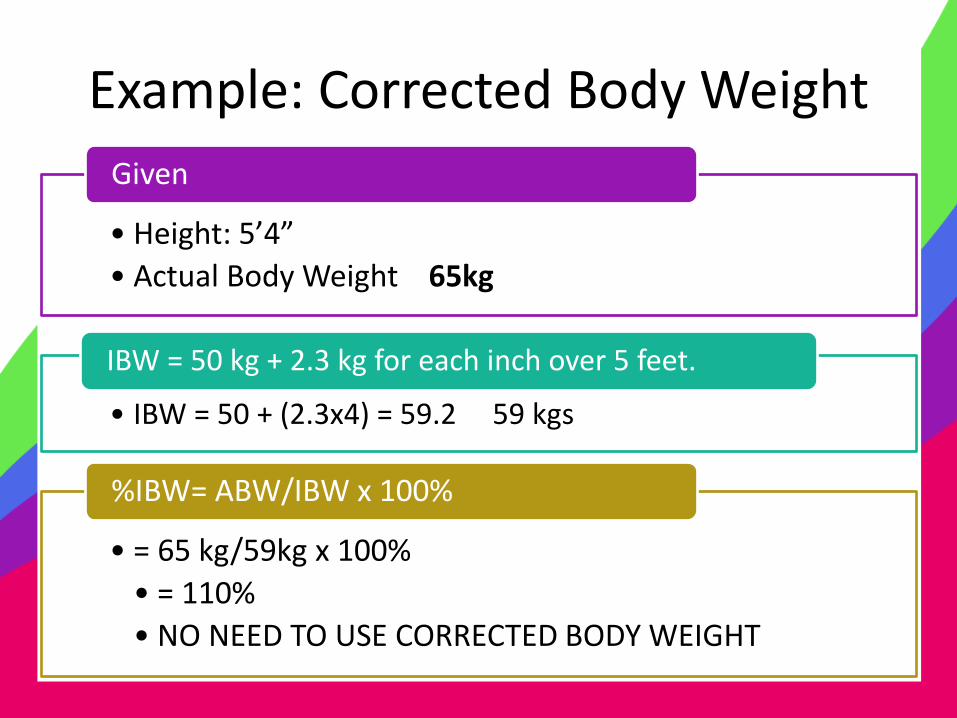
Example: Corrected Body Weight
• Height: 5’4”
• Actual Body Weight 65kg
Given
• IBW = 50 + (2.3x4) = 59.2 59 kgs
IBW = 50 kg + 2.3 kg for each inch over 5 feet.
• = 65 kg/59kg x 100%
• = 110%
• NO NEED TO USE CORRECTED BODY WEIGHT
%IBW= ABW/IBW x 100%
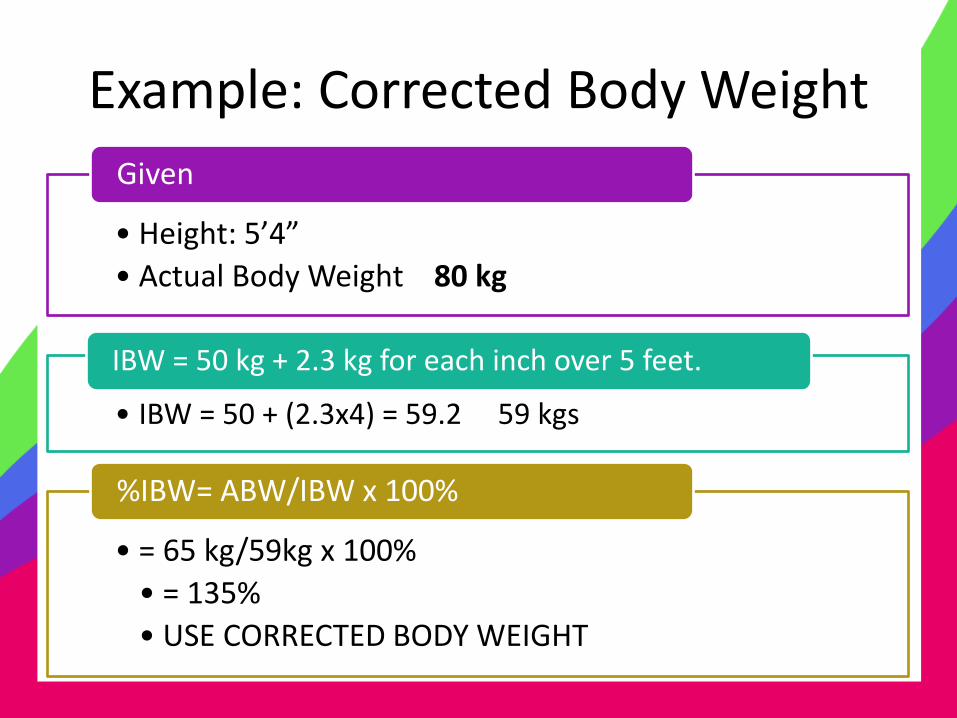
Example: Corrected Body Weight
• Height: 5’4”
• Actual Body Weight 80 kg
Given
• IBW = 50 + (2.3x4) = 59.2 59 kgs
IBW = 50 kg + 2.3 kg for each inch over 5 feet.
• = 65 kg/59kg x 100%
• = 135%
• USE CORRECTED BODY WEIGHT
%IBW= ABW/IBW x 100%
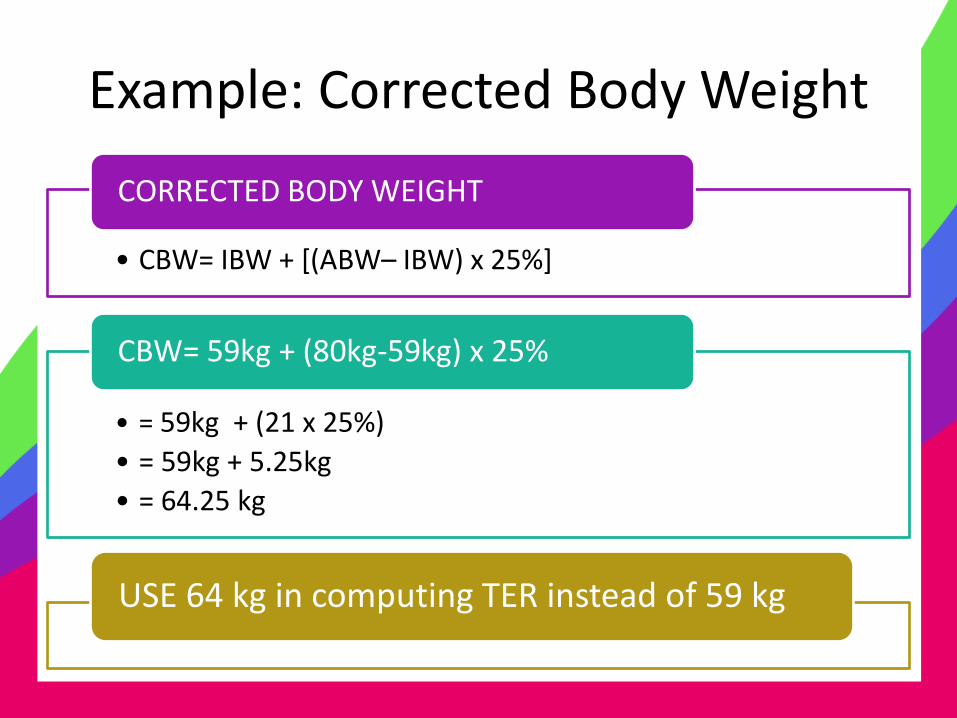
Example: Corrected Body Weight
• CBW= IBW + [(ABW– IBW) x 25%]
CORRECTED BODY WEIGHT
• = 59kg + (21 x 25%)
• = 59kg + 5.25kg
• = 64.25 kg
CBW= 59kg + (80kg-59kg) x 25%
USE 64 kg in computing TER instead of 59 kg
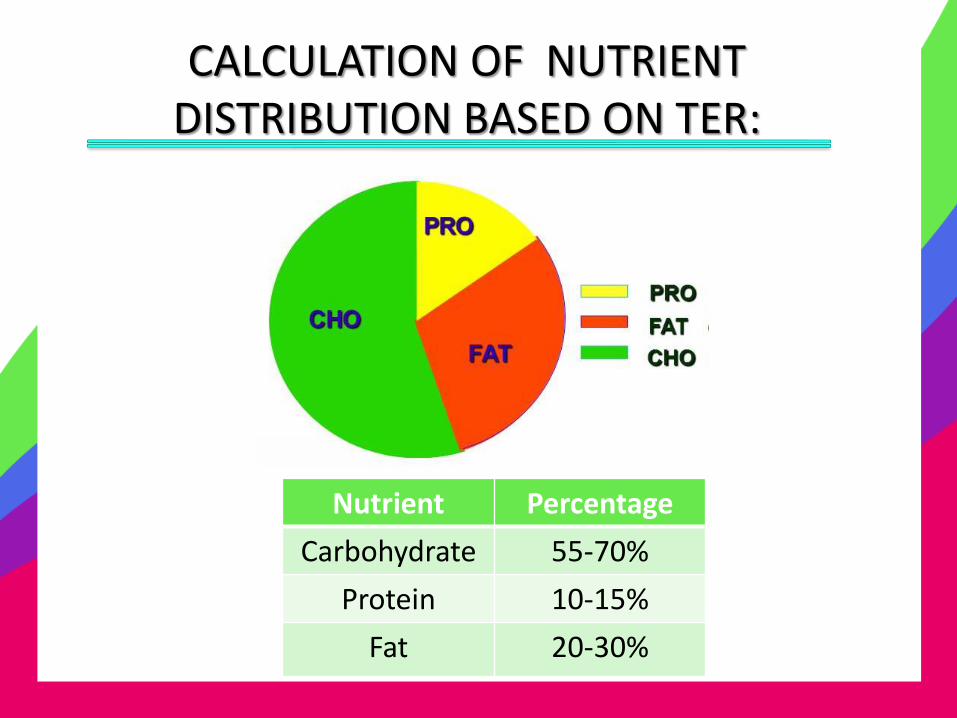
CALCULATION OF NUTRIENT DISTRIBUTION BASED ON TER:
Nutrient Percentage
Carbohydrate 55-70%
Protein 10-15%
Fat 20-30%

Given TER 2400kcal/day
NUTRIENT % COMPUTATION GRAMS equivalent
CHO 60% 2400 kcal/d x .6 = 1440 kcal 1440/4 = 360
Protein 10% 2400 kcal/d x .10 = 240kcal 240/4 = 60
Fat 30% 2400 kcal/d x .30 = 720kcal 720/9 = 80
Diet Rx: TER 2400 kcal, 360g CHO, 60g Protein, 80g Fats
CALCULATION OF NUTRIENT DISTRIBUTION BASED ON TER:
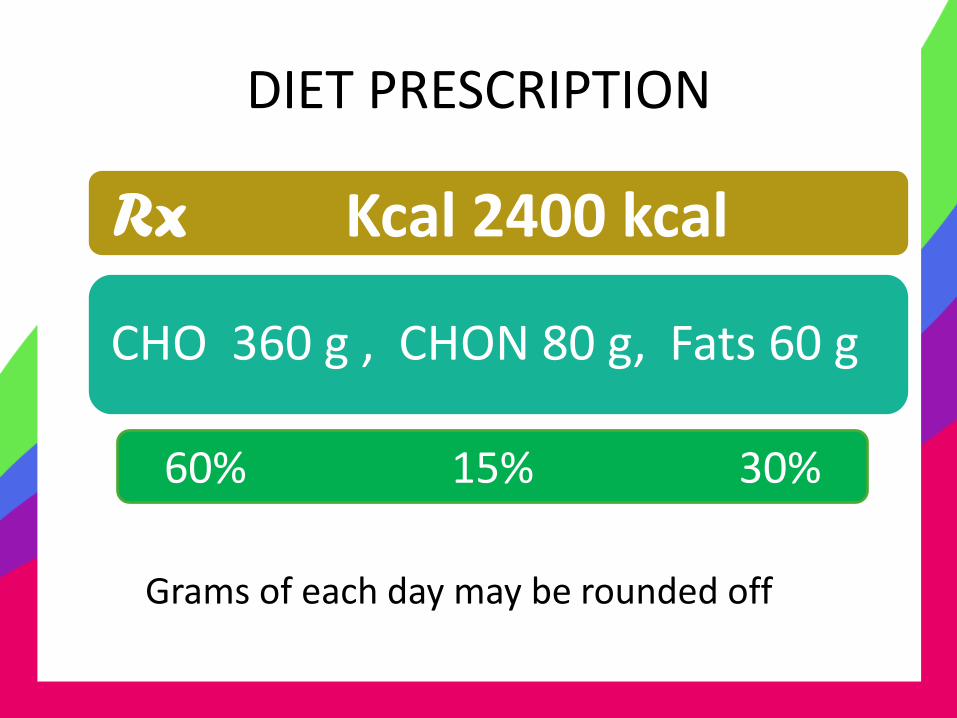
DIET PRESCRIPTION
Rx Kcal 2400 kcal
CHO 360 g , CHON 80 g, Fats 60 g
Grams of each day may be rounded off
60% 15% 30%
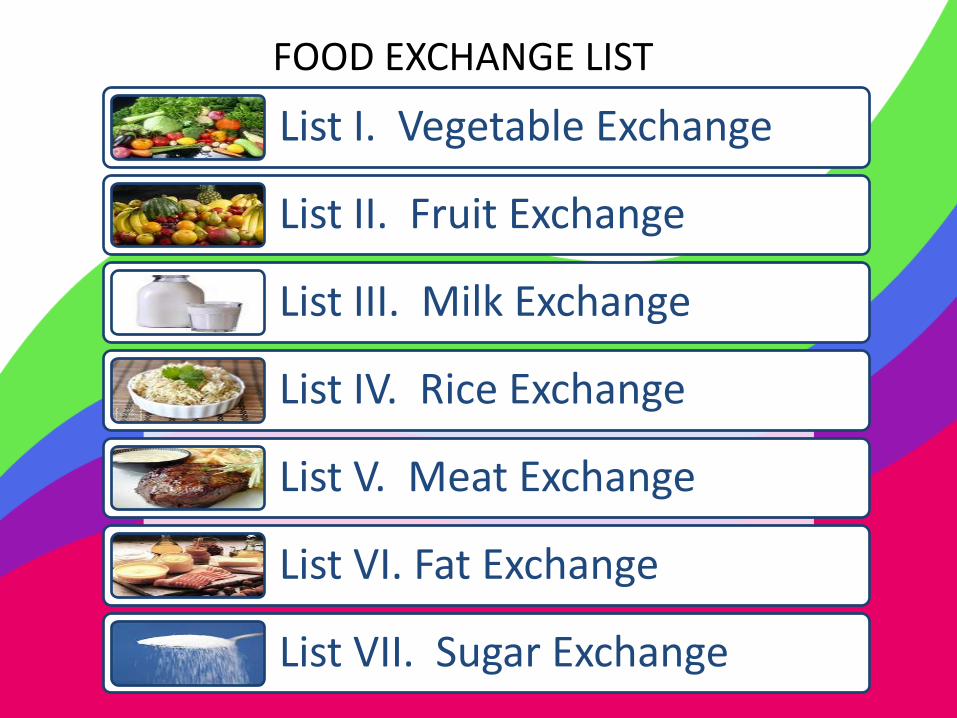
FOOD EXCHANGE LIST
List I. Vegetable Exchange
List II. Fruit Exchange
List III. Milk Exchange
List IV. Rice Exchange
List V. Meat Exchange
List VI. Fat Exchange
List VII. Sugar Exchange
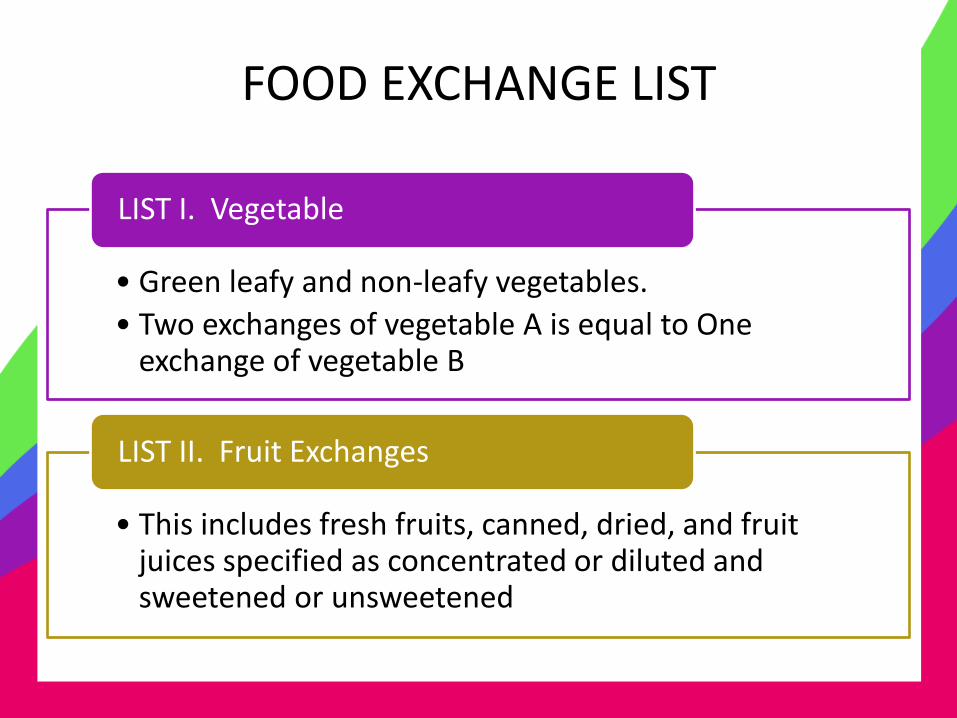
FOOD EXCHANGE LIST
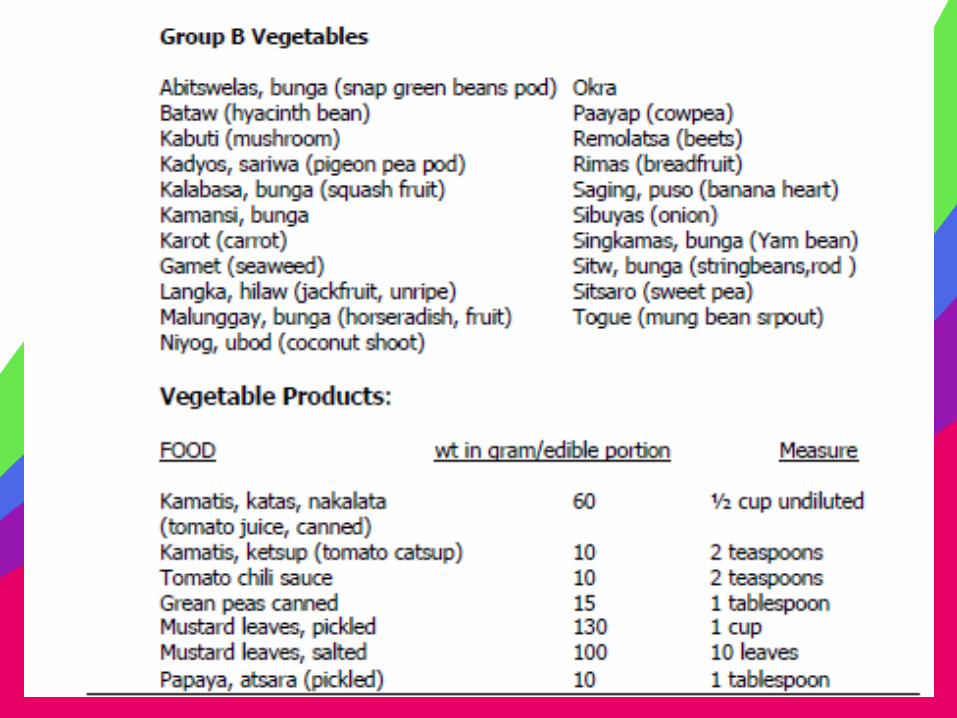
• Green leafy and non-leafy vegetables.
• Two exchanges of vegetable A is equal to One exchange of vegetable B
LIST I. Vegetable
• This includes fresh fruits, canned, dried, and fruit juices specified as concentrated or diluted and sweetened or unsweetened
LIST II. Fruit Exchanges
FOOD EXCHANGE LIST
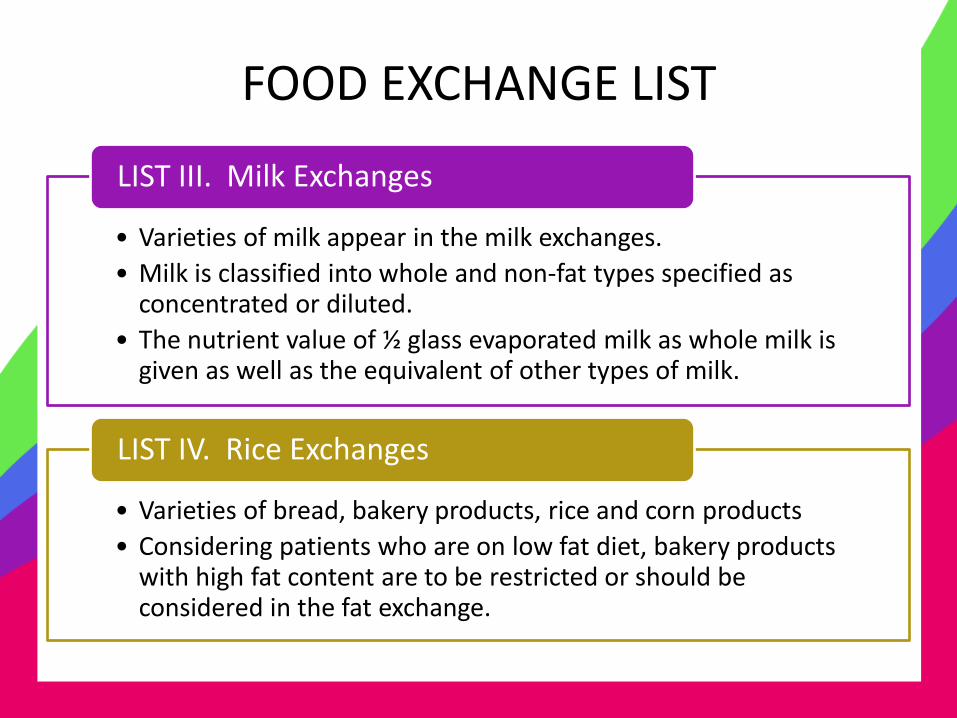
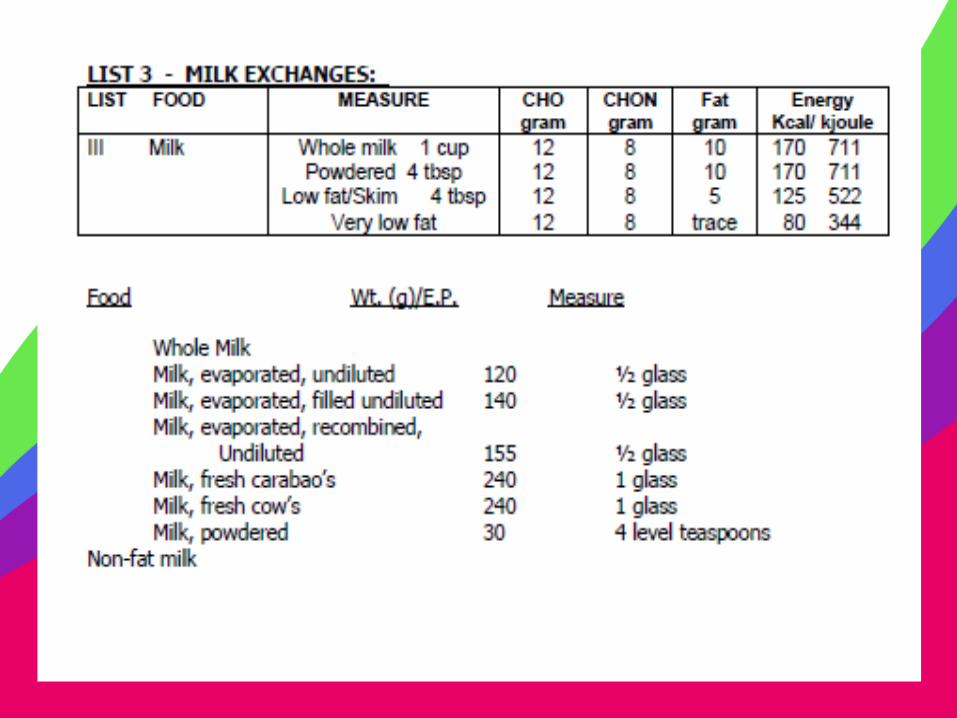
• Varieties of milk appear in the milk exchanges.
• Milk is classified into whole and non-fat types specified as concentrated or diluted.
• The nutrient value of ½ glass evaporated milk as whole milk is given as well as the equivalent of other types of milk.
LIST III. Milk Exchanges
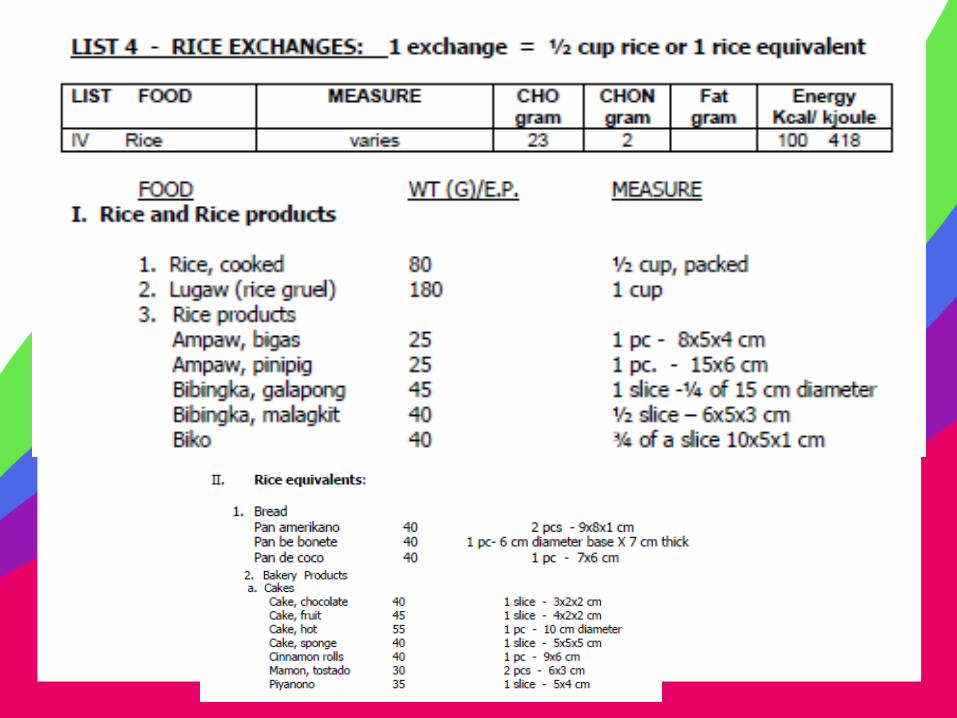
• Varieties of bread, bakery products, rice and corn products
• Considering patients who are on low fat diet, bakery products with high fat content are to be restricted or should be considered in the fat exchange.
LIST IV. Rice Exchanges
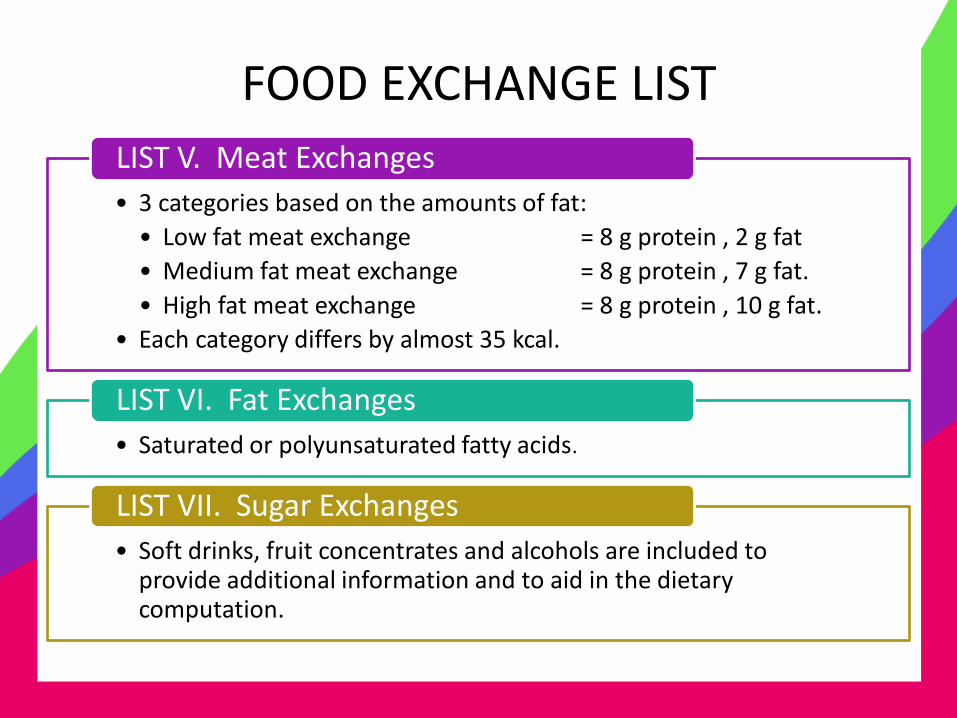
FOOD EXCHANGE LIST
• 3 categories based on the amounts of fat:
• Low fat meat exchange = 8 g protein , 2 g fat
• Medium fat meat exchange = 8 g protein , 7 g fat.
• High fat meat exchange = 8 g protein , 10 g fat.
• Each category differs by almost 35 kcal.
LIST V. Meat Exchanges
• Saturated or polyunsaturated fatty acids.
LIST VI. Fat Exchanges
• Soft drinks, fruit concentrates and alcohols are included to provide additional information and to aid in the dietary computation.
LIST VII. Sugar Exchanges
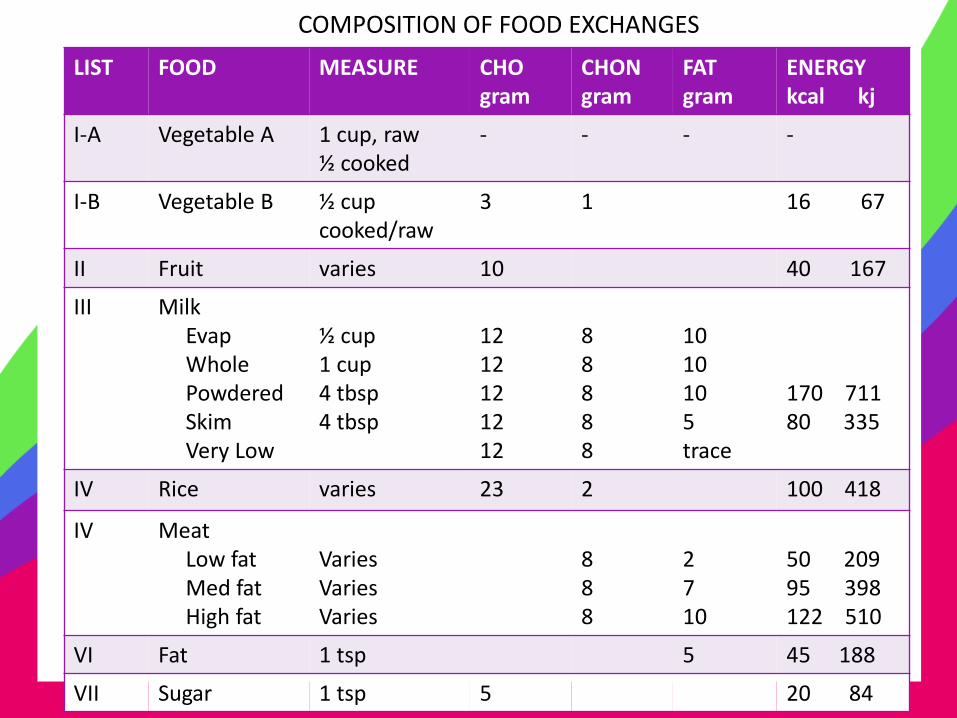
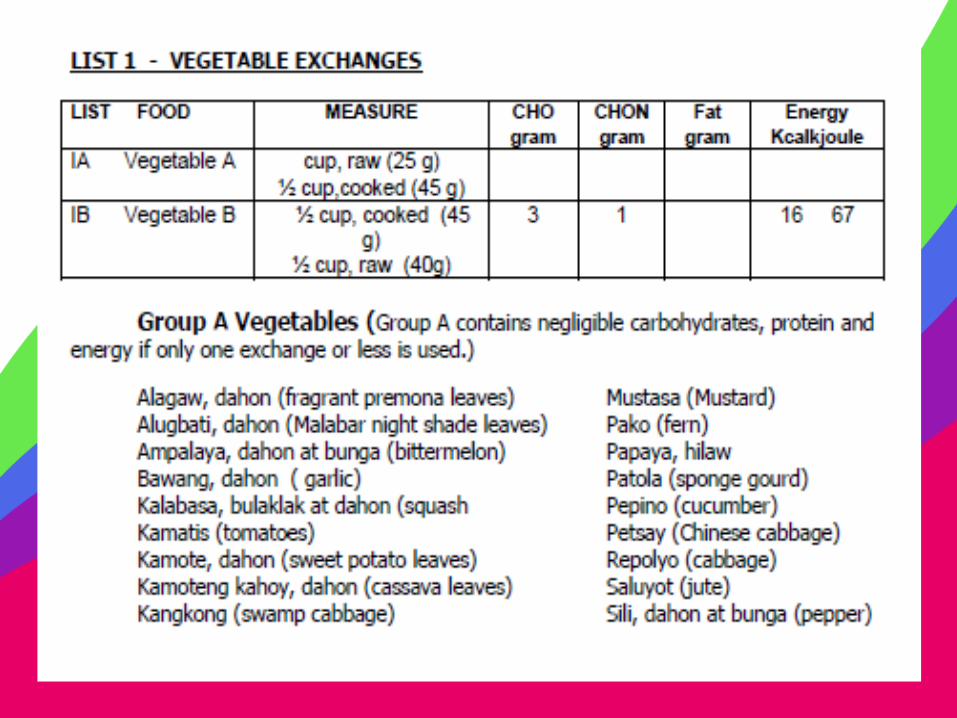
COMPOSITION OF FOOD EXCHANGES
LIST FOOD MEASURE CHO gram
CHON gram
FAT gram
ENERGY kcal kj
I-A Vegetable A 1 cup, raw ½ cooked
- - - -
I-B Vegetable B ½ cup cooked/raw
3 1 16 67
II Fruit varies 10 40 167
III Milk Evap Whole Powdered Skim Very Low
½ cup 1 cup 4 tbsp 4 tbsp
12 12 12 12 12
8 8 8 8 8
10 10 10 5 trace
170 711 80 335
IV Rice varies 23 2 100 418
IV Meat Low fat Med fat High fat
Varies Varies Varies
8 8 8
2 7 10
50 209 95 398 122 510
VI Fat 1 tsp 5 45 188
VII Sugar 1 tsp 5 20 84
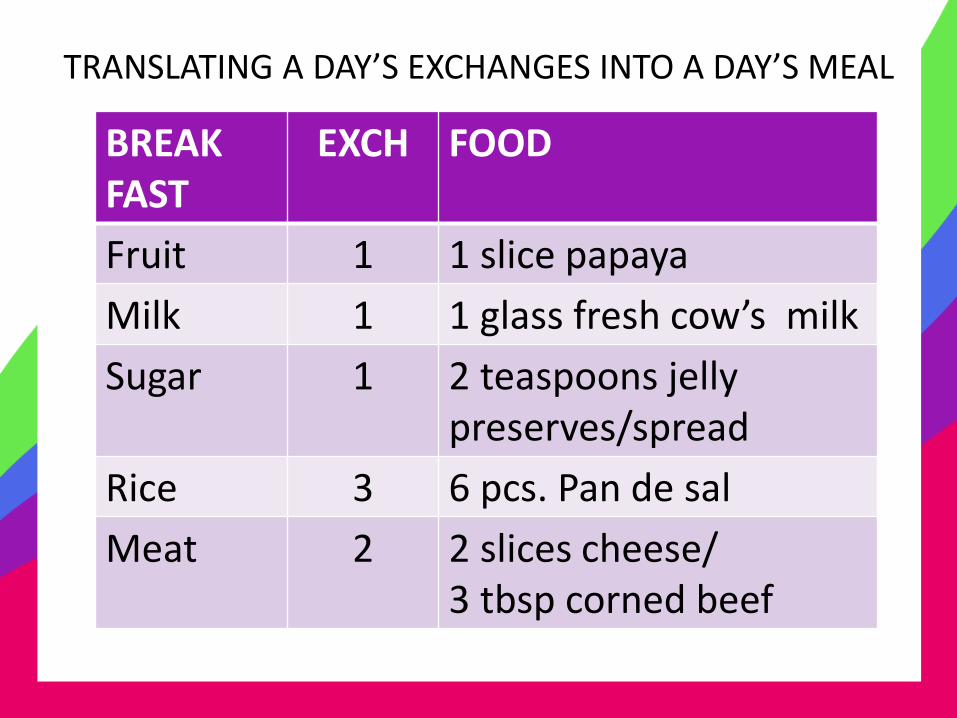
TRANSLATING A DAY’S EXCHANGES INTO A DAY’S MEAL
BREAK FAST
EXCH FOOD
Fruit 1 1 slice papaya
Milk 1 1 glass fresh cow’s milk
Sugar 1 2 teaspoons jelly preserves/spread
Rice 3 6 pcs. Pan de sal
Meat 2 2 slices cheese/ 3 tbsp corned beef
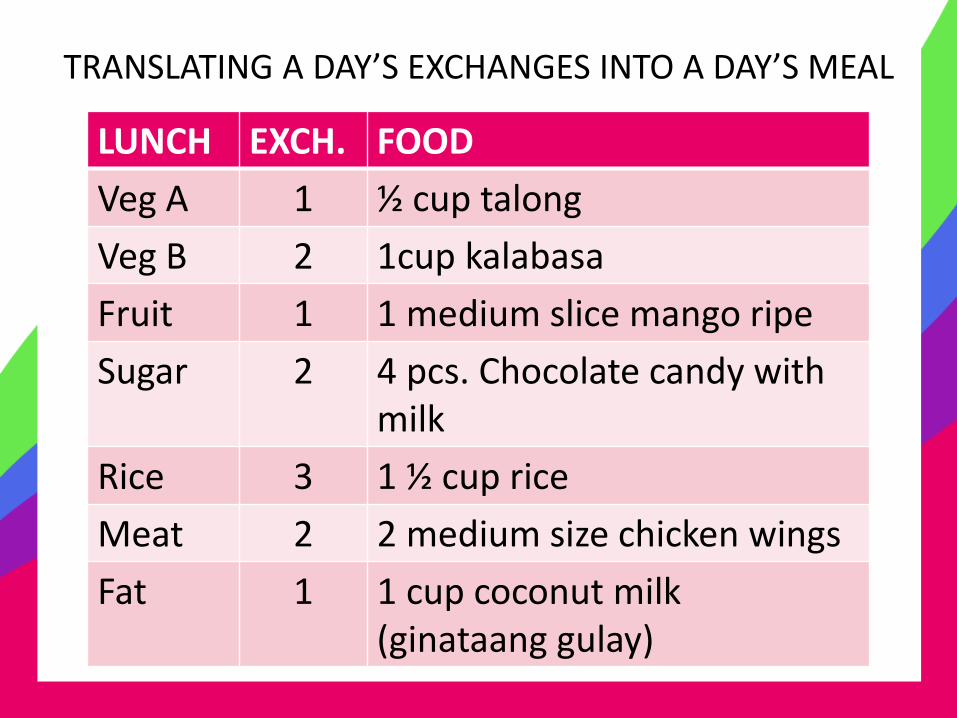
TRANSLATING A DAY’S EXCHANGES INTO A DAY’S MEAL
LUNCH EXCH. FOOD
Veg A 1 ½ cup talong
Veg B 2 1cup kalabasa
Fruit 1 1 medium slice mango ripe
Sugar 2 4 pcs. Chocolate candy with milk
Rice 3 1 ½ cup rice
Meat 2 2 medium size chicken wings
Fat 1 1 cup coconut milk (ginataang gulay)
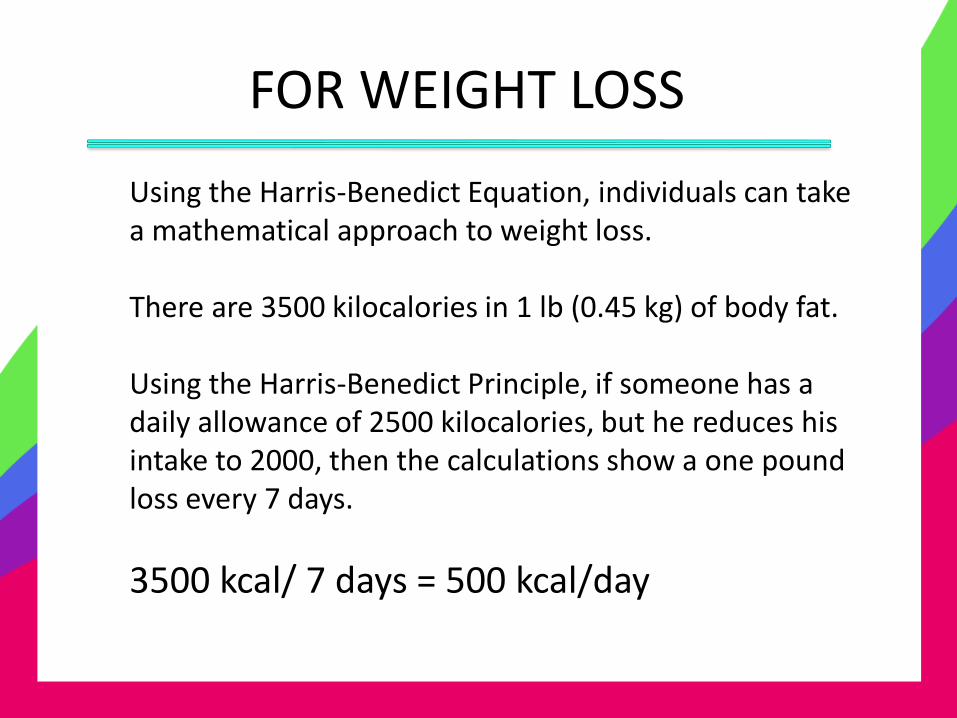
FOR WEIGHT LOSS
Using the Harris-Benedict Equation, individuals can take a mathematical approach to weight loss. There are 3500 kilocalories in 1 lb (0.45 kg) of body fat. Using the Harris-Benedict Principle, if someone has a daily allowance of 2500 kilocalories, but he reduces his intake to 2000, then the calculations show a one pound loss every 7 days.
3500 kcal/ 7 days = 500 kcal/day
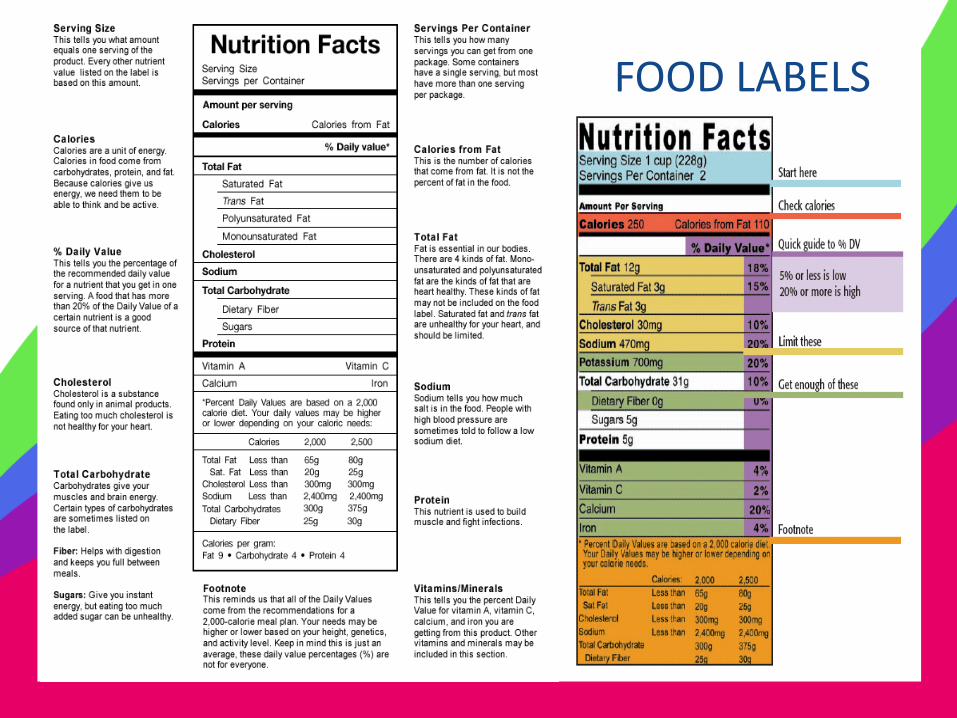
FOOD LABELS
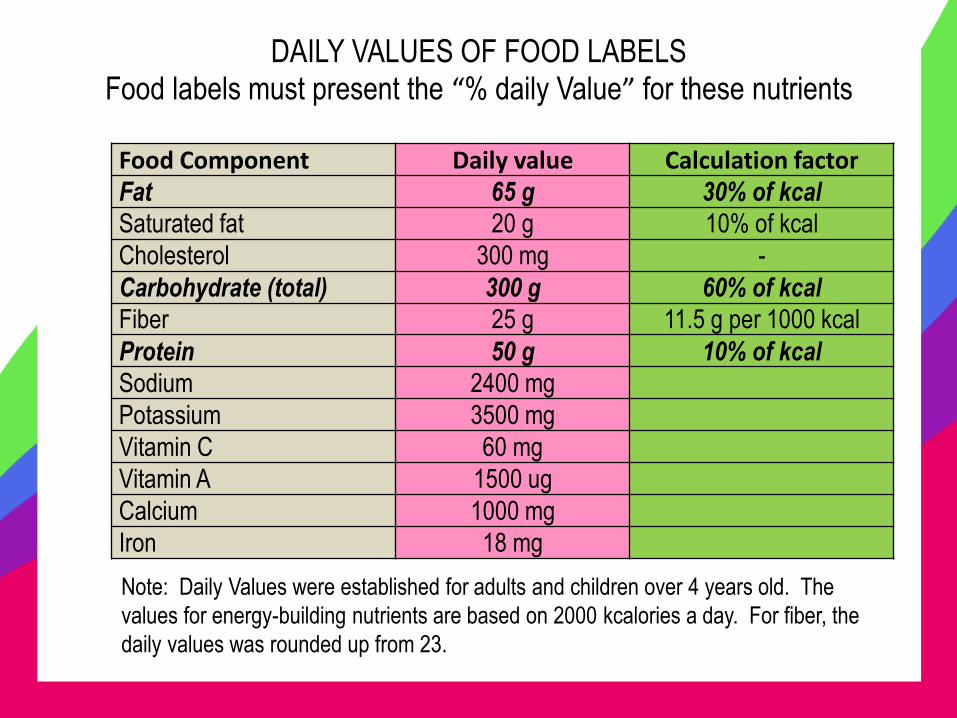
DAILY VALUES OF FOOD LABELS Food labels must present the “% daily Value” for these nutrients
Note: Daily Values were established for adults and children over 4 years old.
The values for energy-building nutrients are based on 2000 kcalories a day.
For fiber, the daily values was rounded up from 23.
Food Component Daily value Calculation factor Fat 65 g 30% of kcal Saturated fat 20 g 10% of kcal Cholesterol 300 mg - Carbohydrate (total) 300 g 60% of kcal Fiber 25 g 11.5 g per 1000 kcal Protein 50 g 10% of kcal Sodium 2400 mg Potassium 3500 mg Vitamin C 60 mg Vitamin A 1500 ug Calcium 1000 mg Iron 18 mg
Note: Daily Values were established for adults and children over 4 years old. The
values for energy-building nutrients are based on 2000 kcalories a day. For fiber, the
daily values was rounded up from 23.
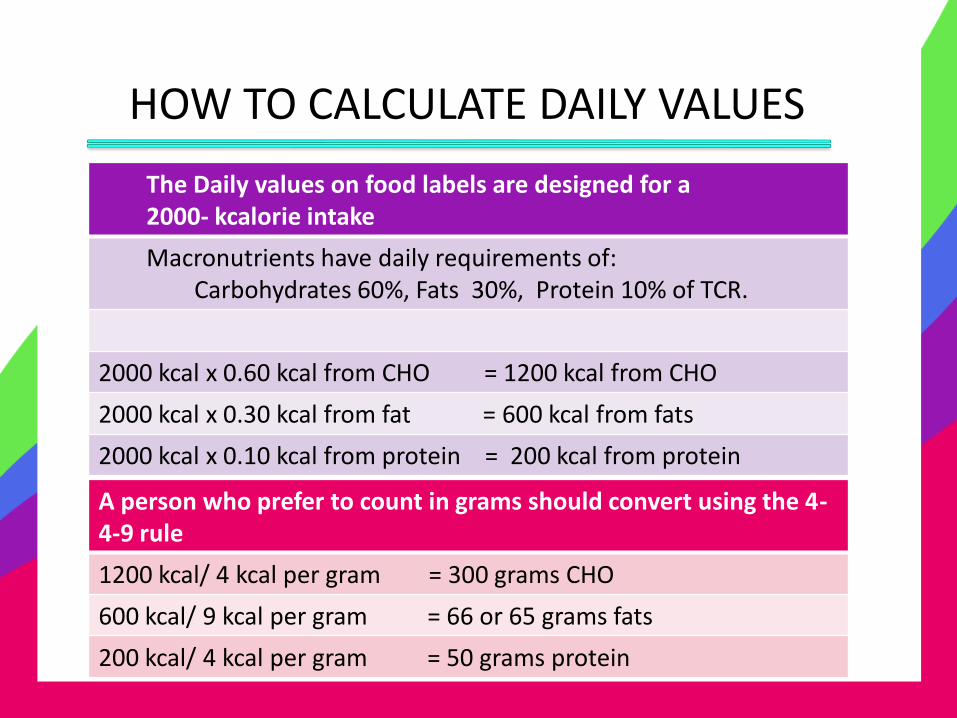
HOW TO CALCULATE DAILY VALUES
The Daily values on food labels are designed for a 2000- kcalorie intake
Macronutrients have daily requirements of: Carbohydrates 60%, Fats 30%, Protein 10% of TCR.
2000 kcal x 0.60 kcal from CHO = 1200 kcal from CHO
2000 kcal x 0.30 kcal from fat = 600 kcal from fats
2000 kcal x 0.10 kcal from protein = 200 kcal from protein
A person who prefer to count in grams should convert using the 4-4-9 rule
1200 kcal/ 4 kcal per gram = 300 grams CHO
600 kcal/ 9 kcal per gram = 66 or 65 grams fats
200 kcal/ 4 kcal per gram = 50 grams protein
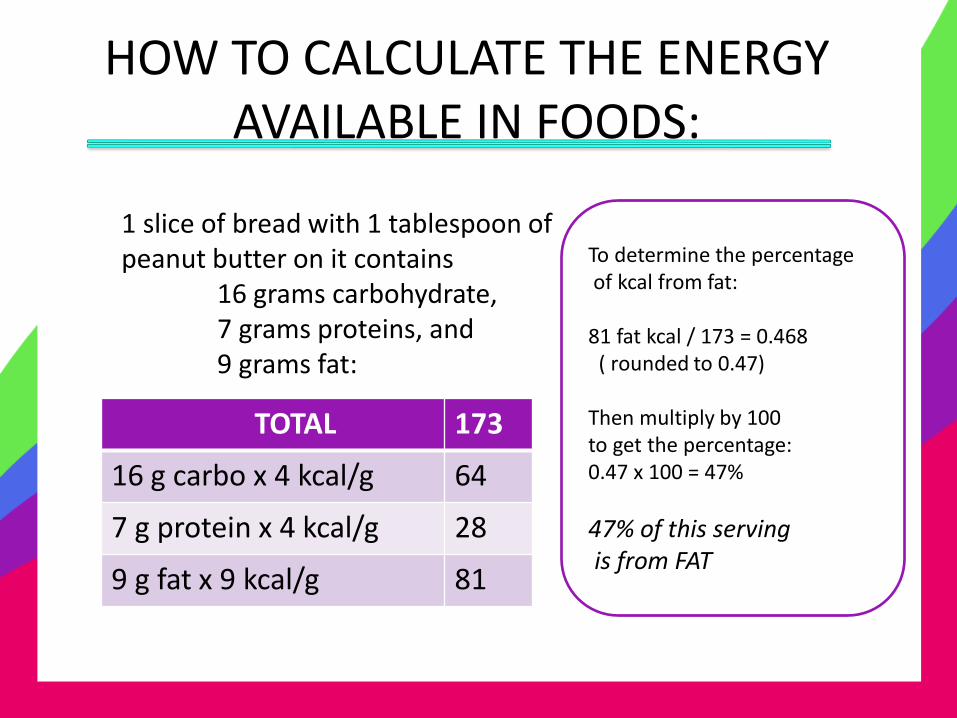
HOW TO CALCULATE THE ENERGY AVAILABLE IN FOODS:
1 slice of bread with 1 tablespoon of peanut butter on it contains 16 grams carbohydrate, 7 grams proteins, and 9 grams fat:
TOTAL 173
16 g carbo x 4 kcal/g 64
7 g protein x 4 kcal/g 28
9 g fat x 9 kcal/g 81
To determine the percentage of kcal from fat: 81 fat kcal / 173 = 0.468 ( rounded to 0.47) Then multiply by 100 to get the percentage: 0.47 x 100 = 47%
47% of this serving is from FAT
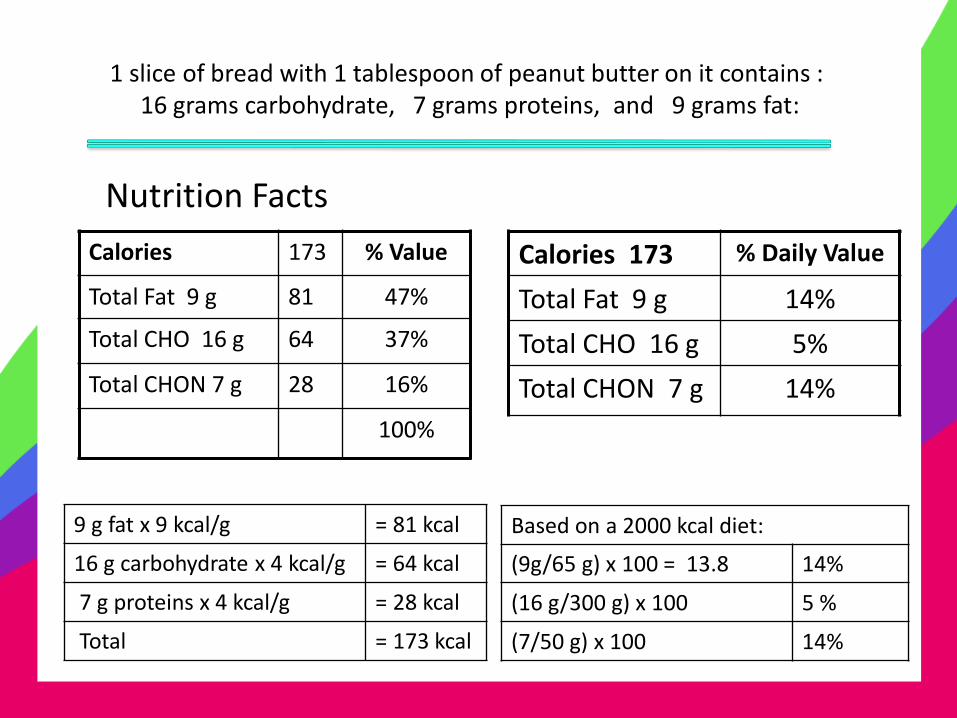
1 slice of bread with 1 tablespoon of peanut butter on it contains : 16 grams carbohydrate, 7 grams proteins, and 9 grams fat:
Calories 173 % Daily Value
Total Fat 9 g 14%
Total CHO 16 g 5%
Total CHON 7 g 14%
Calories 173 % Value
Total Fat 9 g 81 47%
Total CHO 16 g 64 37%
Total CHON 7 g 28 16%
100%
Nutrition Facts
9 g fat x 9 kcal/g = 81 kcal
16 g carbohydrate x 4 kcal/g = 64 kcal
7 g proteins x 4 kcal/g = 28 kcal
Total = 173 kcal
Based on a 2000 kcal diet:
(9g/65 g) x 100 = 13.8 14%
(16 g/300 g) x 100 5 %
(7/50 g) x 100 14%
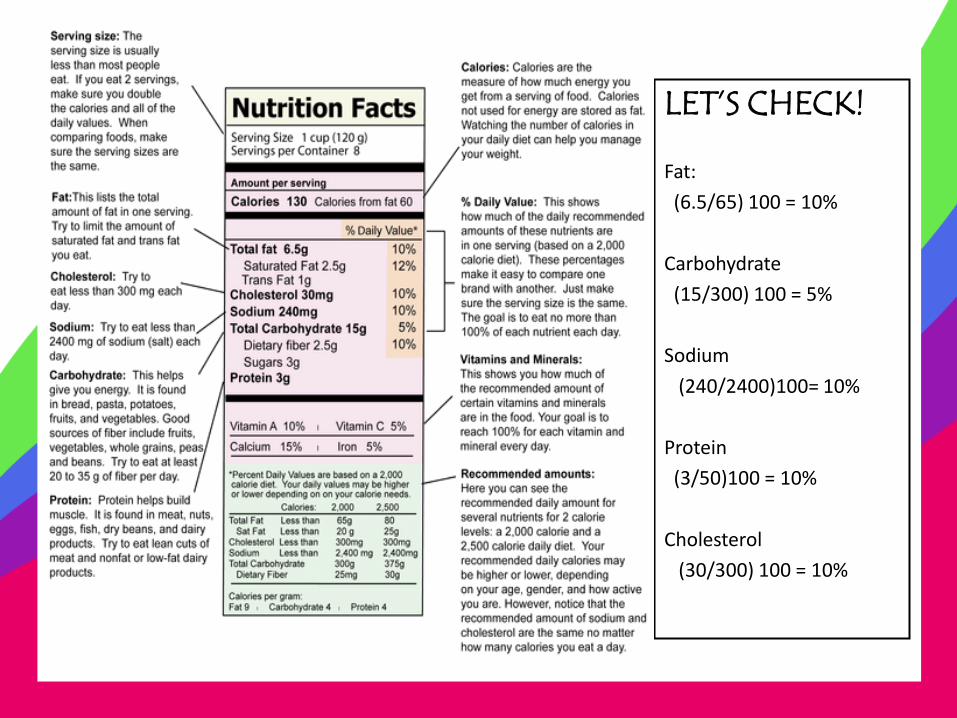
LET’S CHECK!
Fat:
(6.5/65) 100 = 10%
Carbohydrate
(15/300) 100 = 5%
Sodium
(240/2400)100= 10%
Protein
(3/50)100 = 10%
Cholesterol
(30/300) 100 = 10%
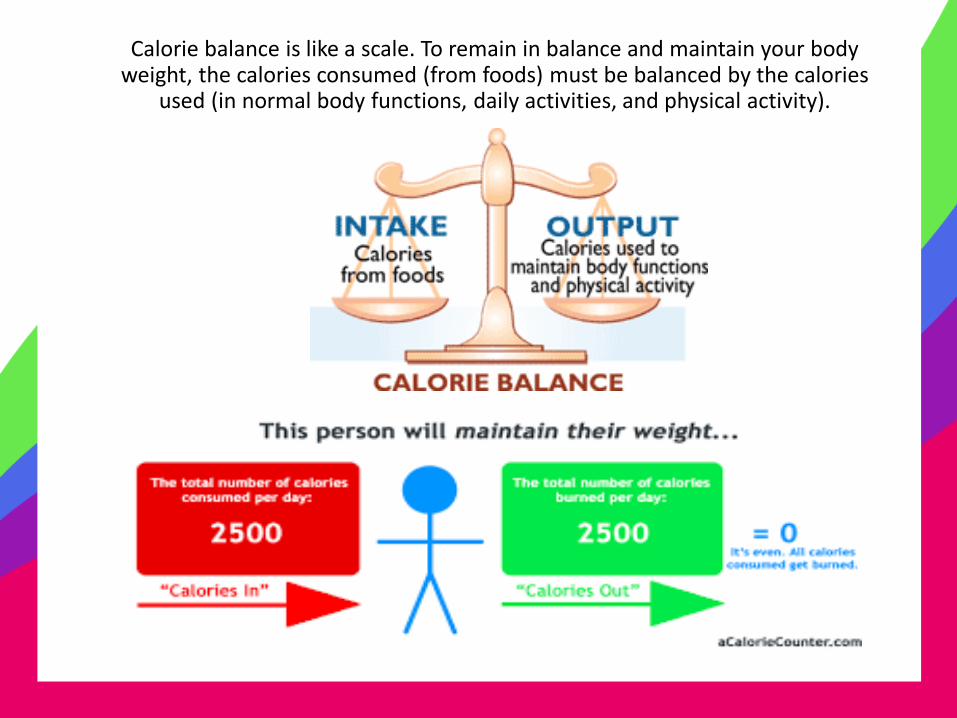
Calorie balance is like a scale. To remain in balance and maintain your body weight, the calories consumed (from foods) must be balanced by the calories
used (in normal body functions, daily activities, and physical activity).

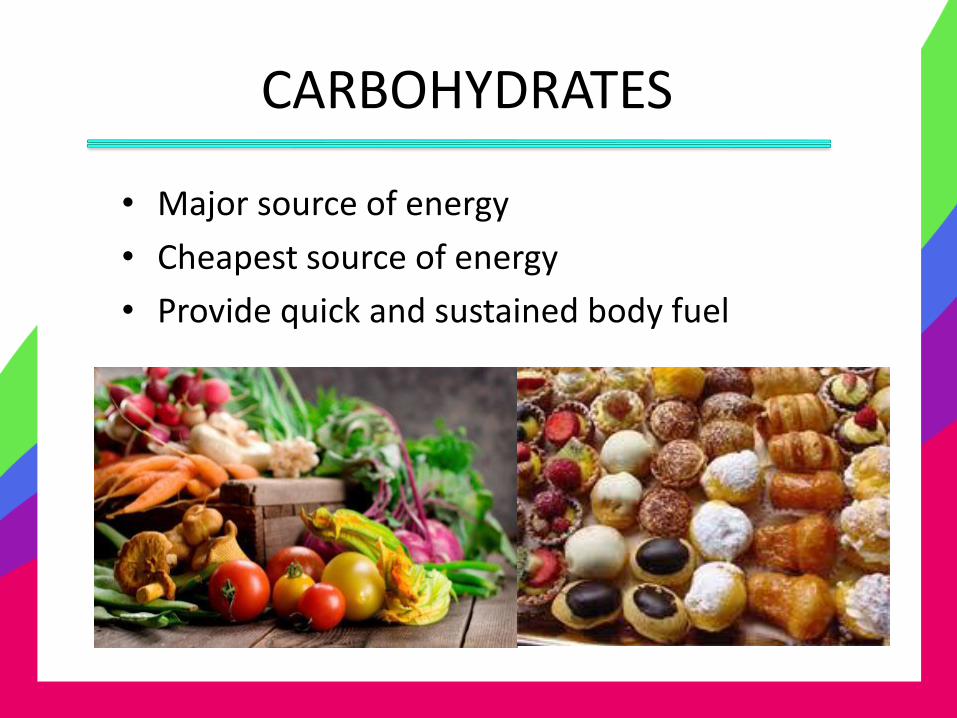
CARBOHYDRATES
• Major source of energy
• Cheapest source of energy
• Provide quick and sustained body fuel

CARBOHYDRATES
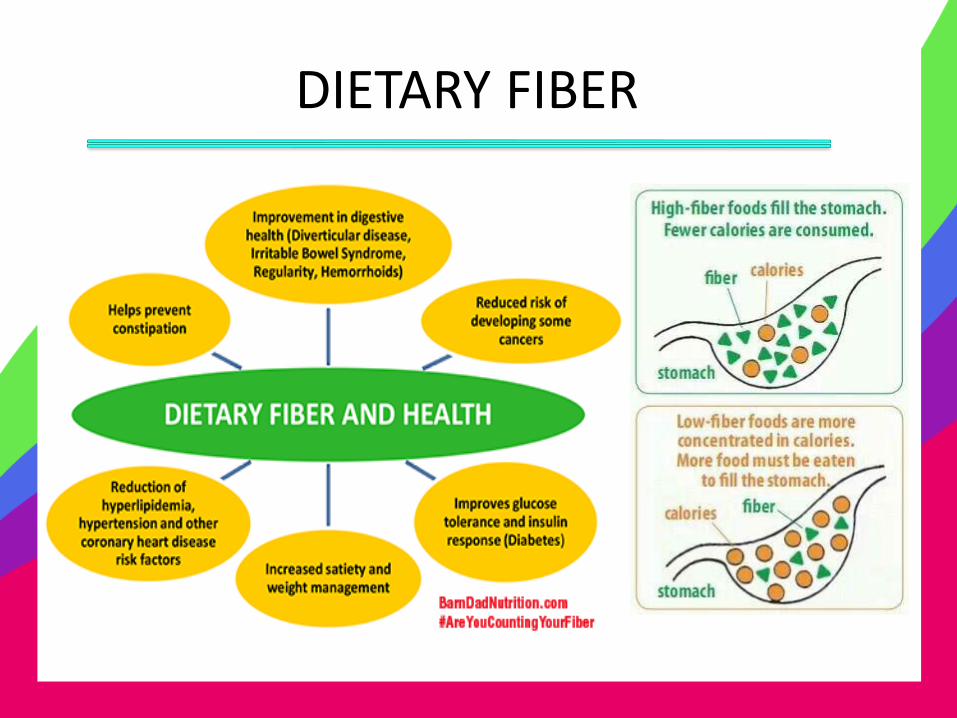
DIETARY FIBER
CARBOHYDRATES Functions:
• Fuel for energy
• Protein sparer
• Allows for normal fat metabolism
• Maintains functional integrity of the CNS
• Facilitates excretion of toxins
• Precursor of nucleic acid, connective tissue matrix, galactoside to nerve tissue
• Aids in normal elimination of waste materials
• Promote growth of coliform bacteria
CARBOHYDRATES Sources:
• Starches
• Root crops
• Fruits
• Sugar and candies
• Vegetables
• Liver glycogen
RENI FOR CHO: 55-70% of TCR
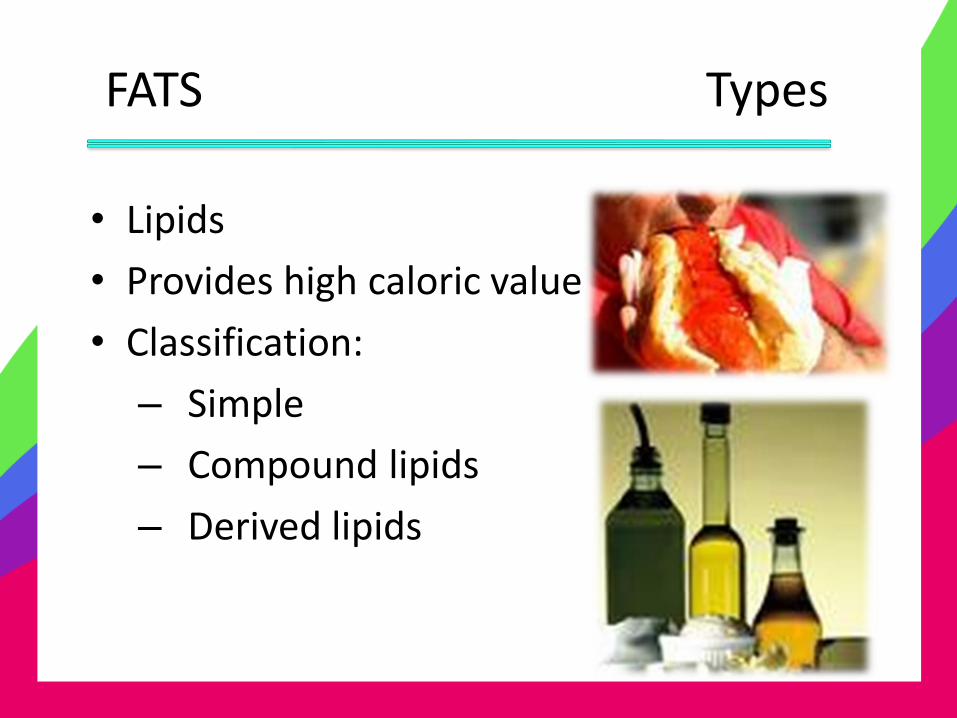
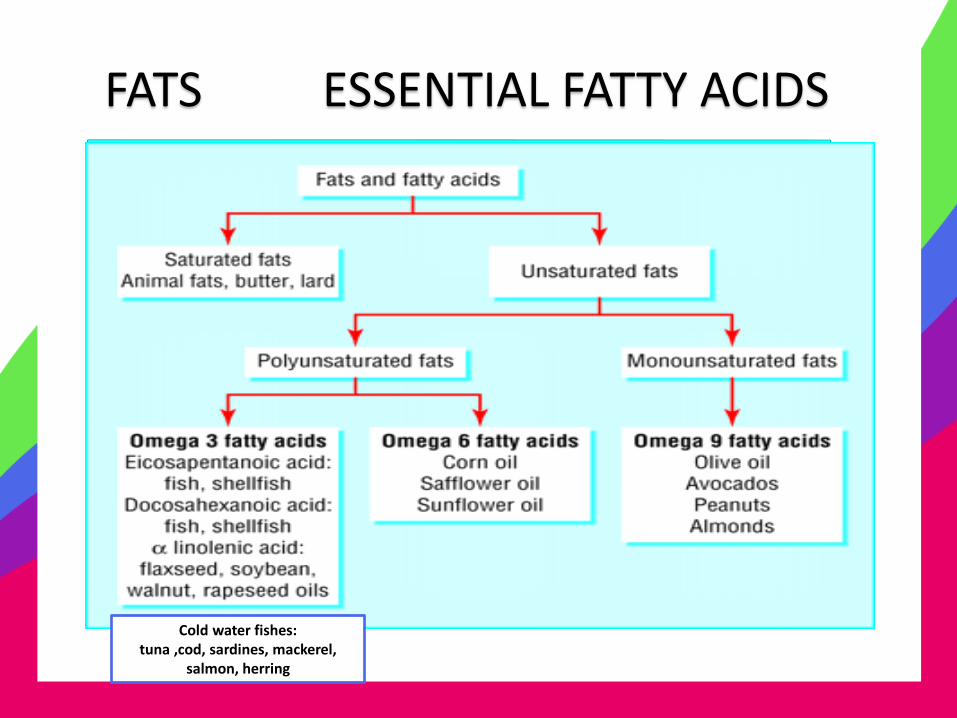
FATS Types
• Lipids
• Provides high caloric value
• Classification:
– Simple
– Compound lipids
– Derived lipids
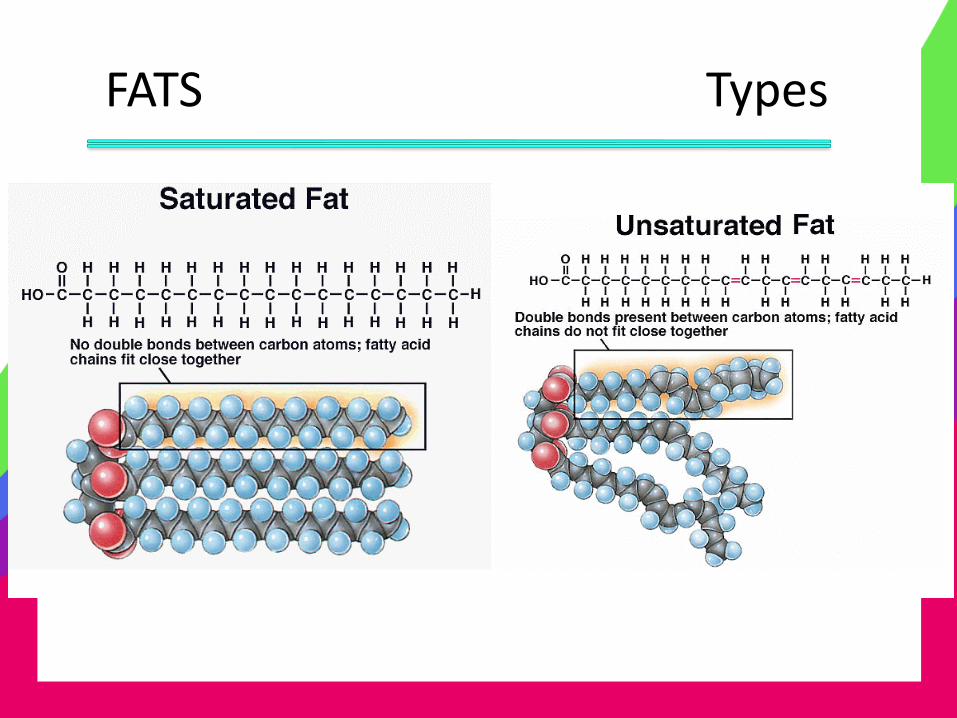
FATS Types
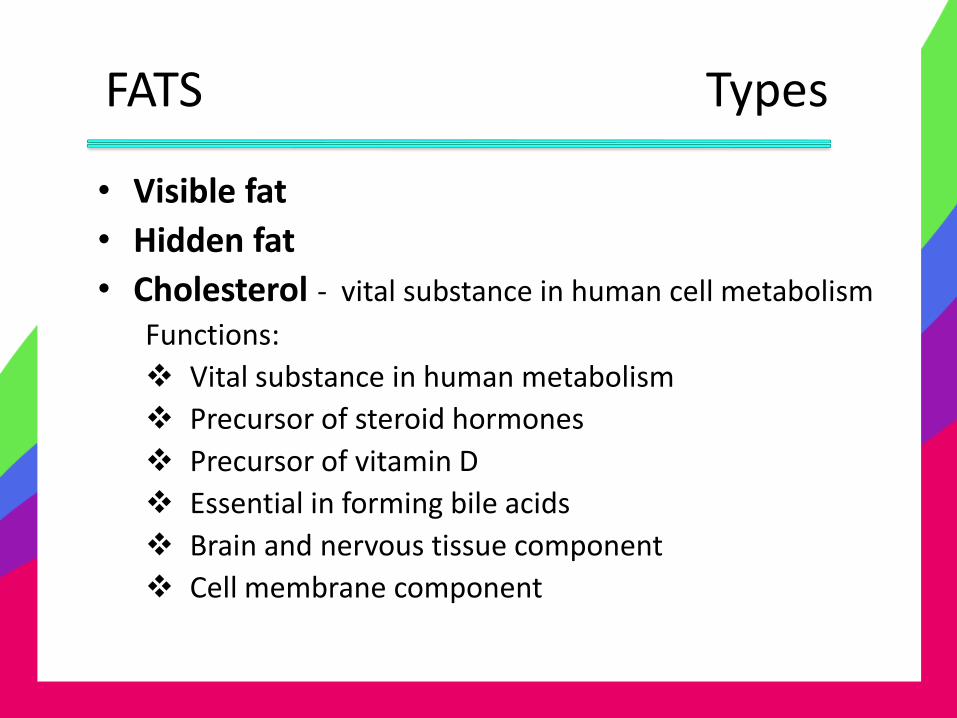
FATS Types
• Visible fat
• Hidden fat
• Cholesterol - vital substance in human cell metabolism
Functions:
Vital substance in human metabolism
Precursor of steroid hormones
Precursor of vitamin D
Essential in forming bile acids
Brain and nervous tissue component
Cell membrane component
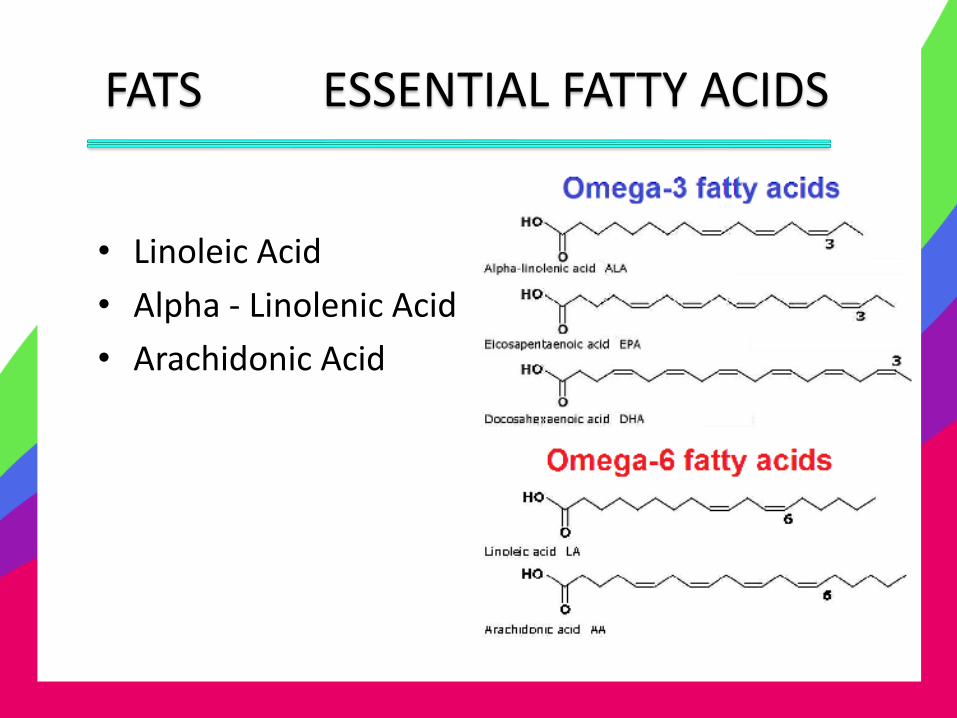
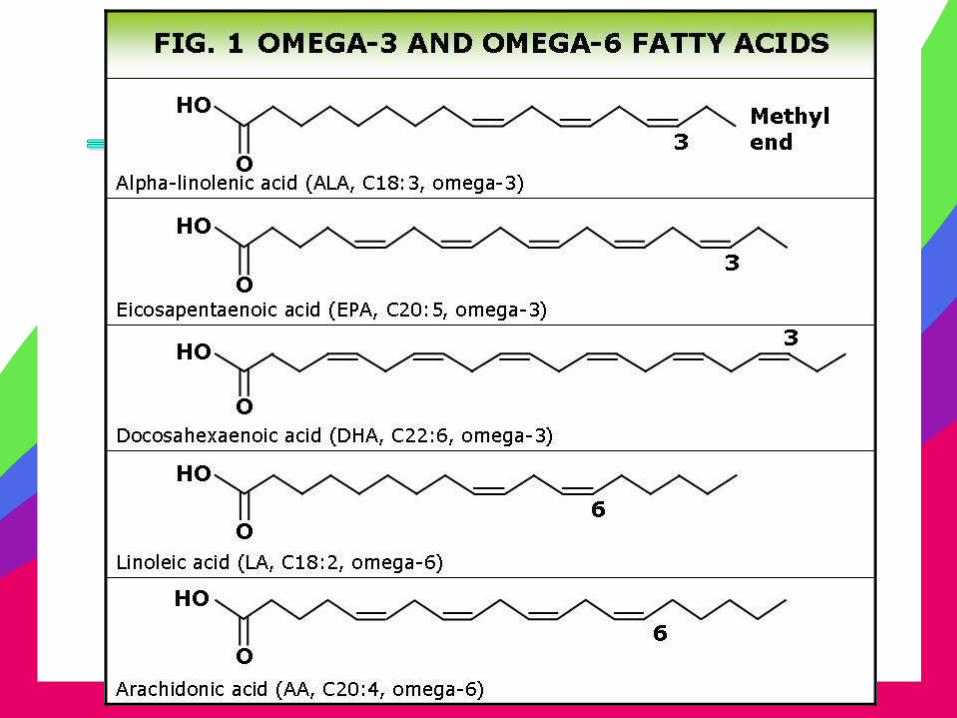
FATS ESSENTIAL FATTY ACIDS
• Linoleic Acid
• Alpha - Linolenic Acid
• Arachidonic Acid
FATS Types
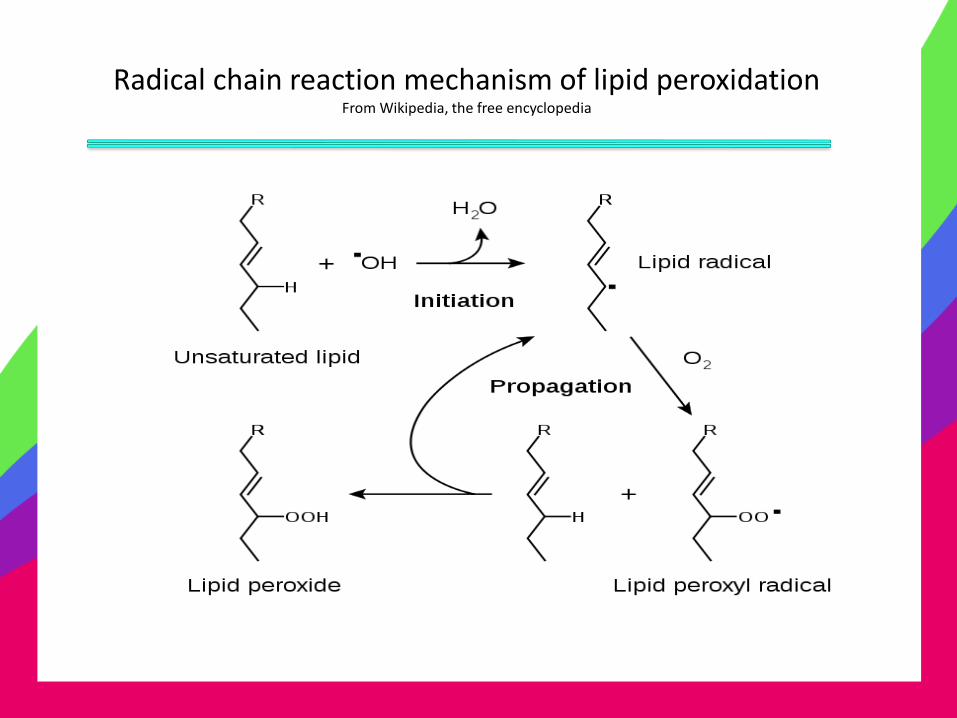
Radical chain reaction mechanism of lipid peroxidation From Wikipedia, the free encyclopedia
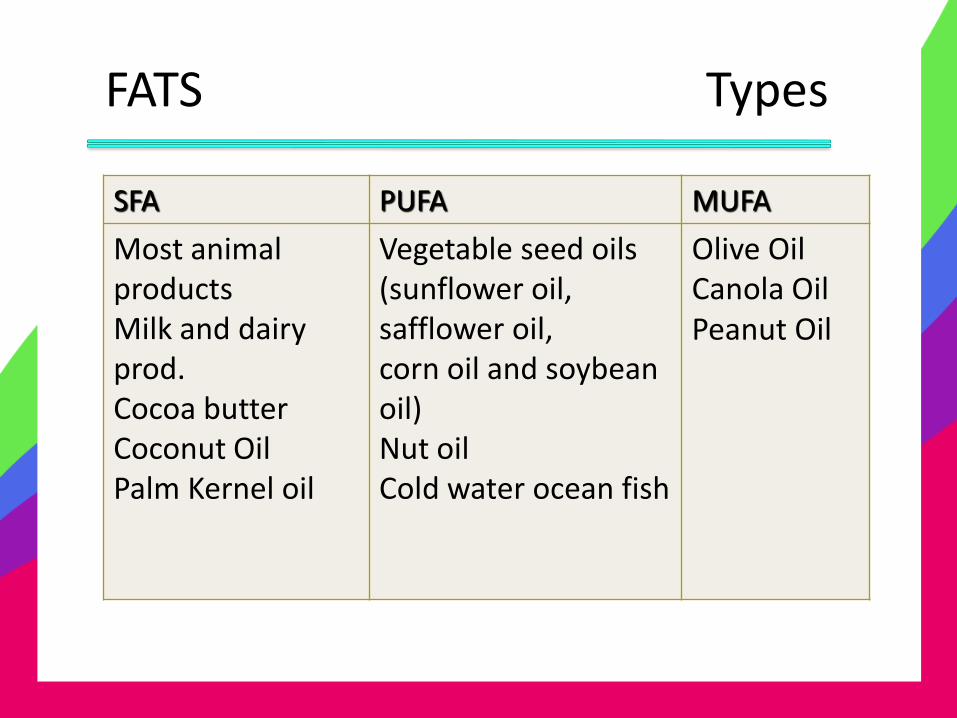
FATS Types
SFA PUFA MUFA
Most animal products Milk and dairy prod. Cocoa butter Coconut Oil Palm Kernel oil
Vegetable seed oils (sunflower oil, safflower oil, corn oil and soybean oil) Nut oil Cold water ocean fish
Olive Oil Canola Oil Peanut Oil
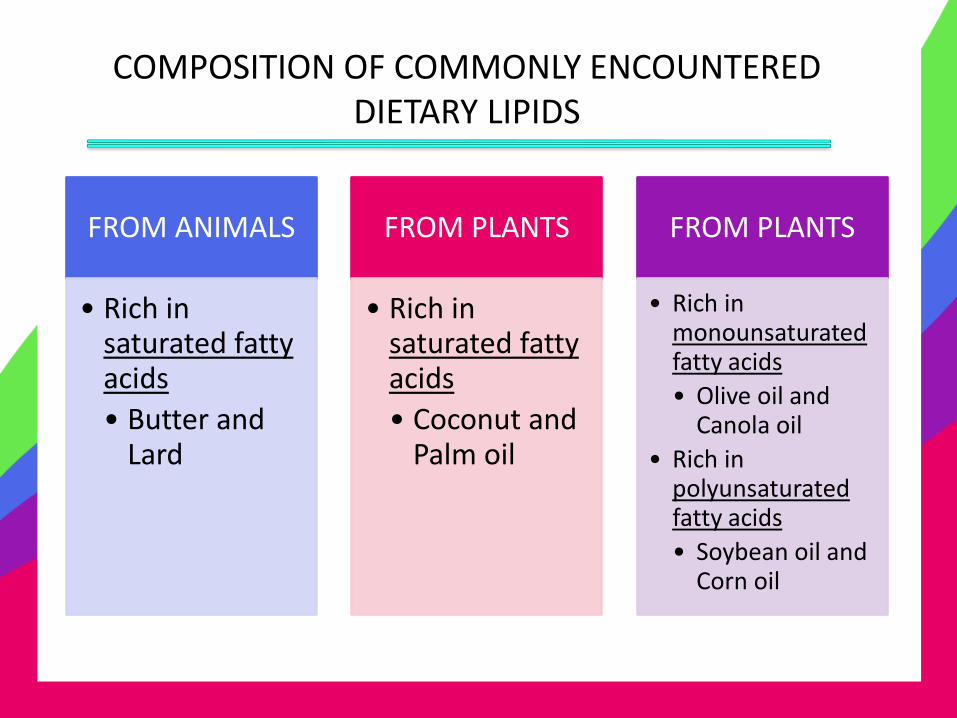
COMPOSITION OF COMMONLY ENCOUNTERED DIETARY LIPIDS
FROM ANIMALS
• Rich in saturated fatty acids
• Butter and Lard
FROM PLANTS
• Rich in saturated fatty acids
• Coconut and Palm oil
FROM PLANTS
• Rich in monounsaturated fatty acids
• Olive oil and Canola oil
• Rich in polyunsaturated fatty acids
• Soybean oil and Corn oil
GROWTH
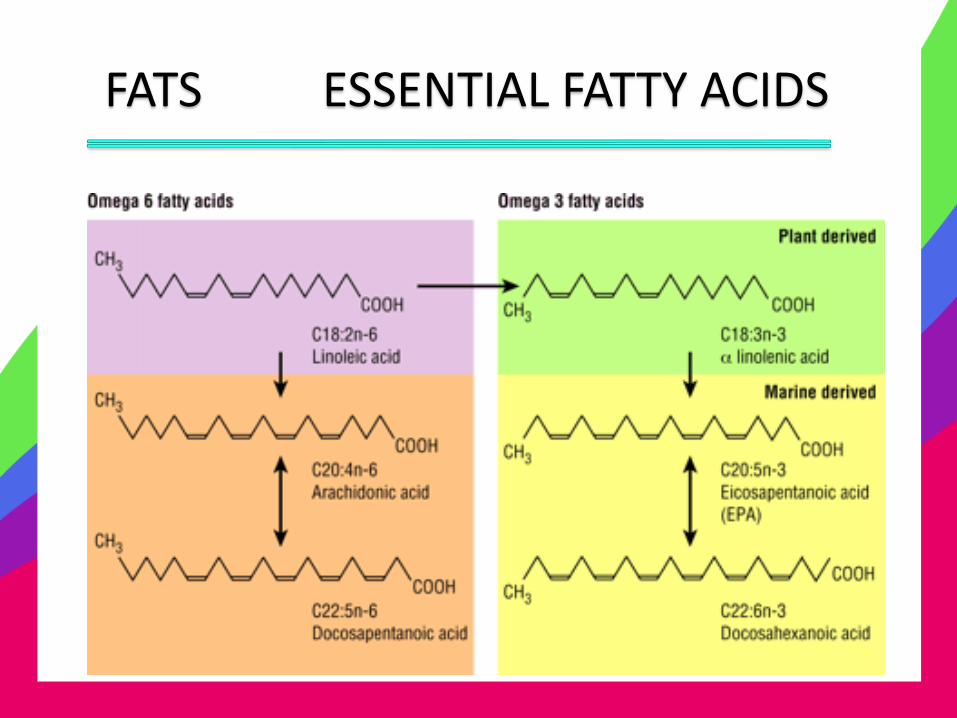
FATS ESSENTIAL FATTY ACIDS
FATS ESSENTIAL FATTY ACIDS
• Insoluble in water
• Cannot be made by the body
• Soluble in solvents with low polarity
• Low melting point
• Liquid at room temperature
• Double bonds are oxidizable (DANGER)
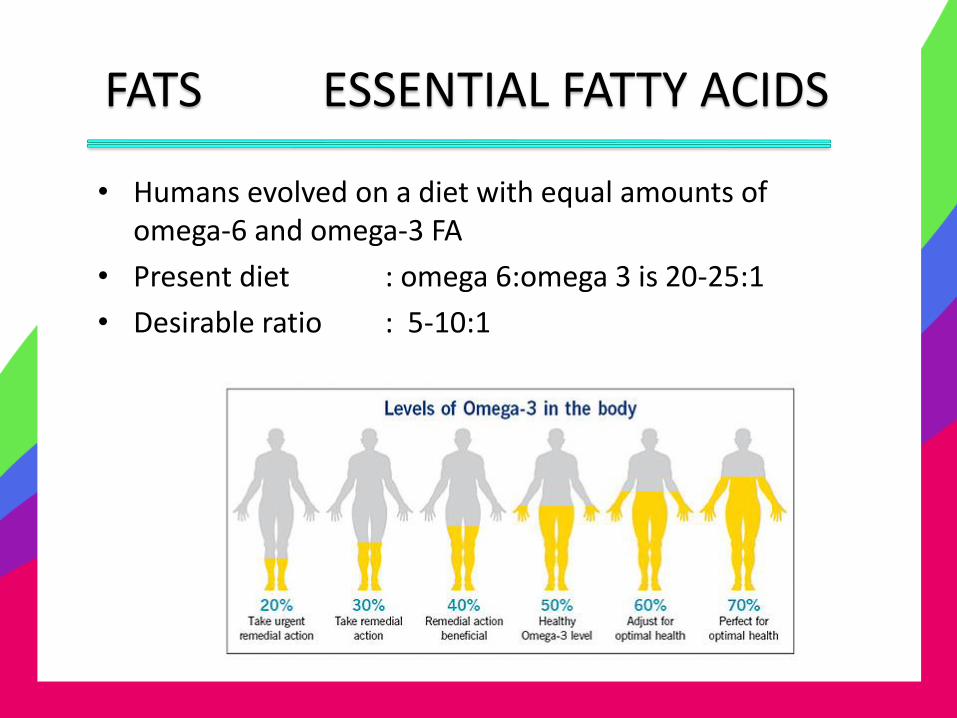
FATS ESSENTIAL FATTY ACIDS
• Humans evolved on a diet with equal amounts of omega-6 and omega-3 FA
• Present diet : omega 6:omega 3 is 20-25:1
• Desirable ratio : 5-10:1
FATS ESSENTIAL FATTY ACIDS
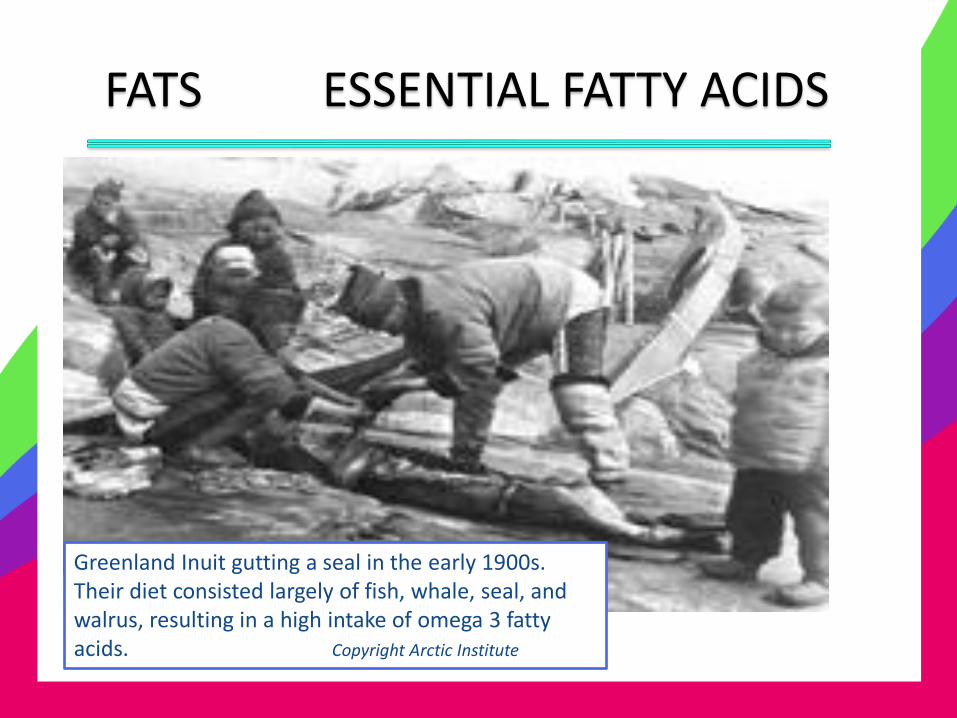
Greenland Inuit gutting a seal in the early 1900s. Their diet consisted largely of fish, whale, seal, and walrus, resulting in a high intake of omega 3 fatty acids. Copyright Arctic Institute
FATS ESSENTIAL FATTY ACIDS
Cold water fishes: tuna ,cod, sardines, mackerel,
salmon, herring
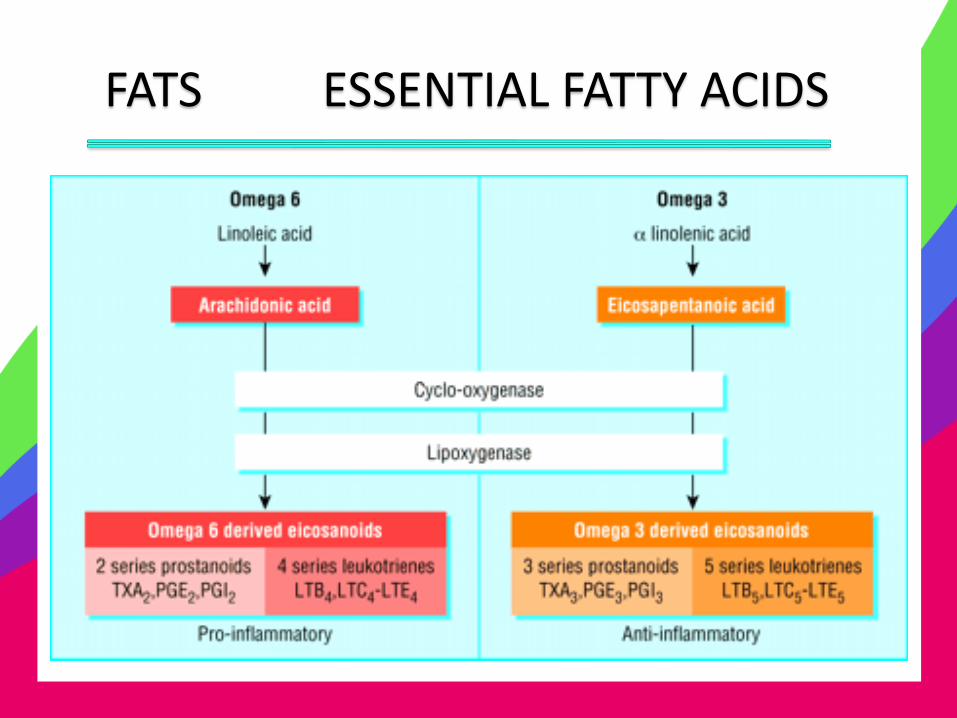
FATS ESSENTIAL FATTY ACIDS
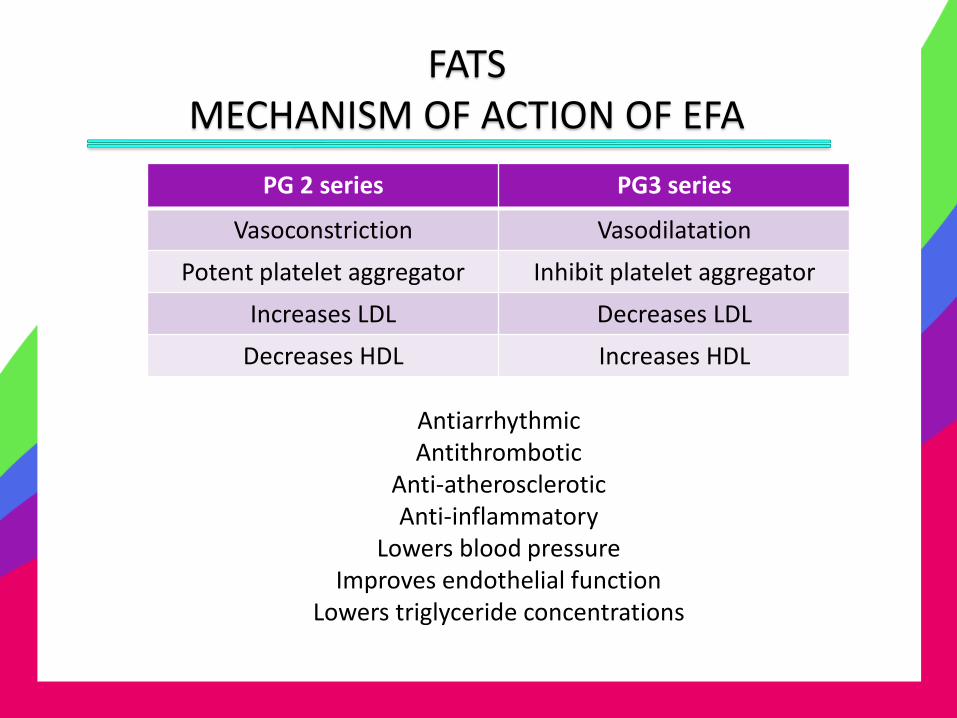
FATS MECHANISM OF ACTION OF EFA
PG 2 series PG3 series
Vasoconstriction Vasodilatation
Potent platelet aggregator Inhibit platelet aggregator
Increases LDL Decreases LDL
Decreases HDL Increases HDL
Antiarrhythmic Antithrombotic
Anti-atherosclerotic Anti-inflammatory
Lowers blood pressure Improves endothelial function
Lowers triglyceride concentrations
FATS Functions
• Source of energy
• Protein sparer
• Serve as shock absorber
• Strengthens biological membrane structure
• Body insulator
• Dietary vehicle
• Supplies taste and flavor to food
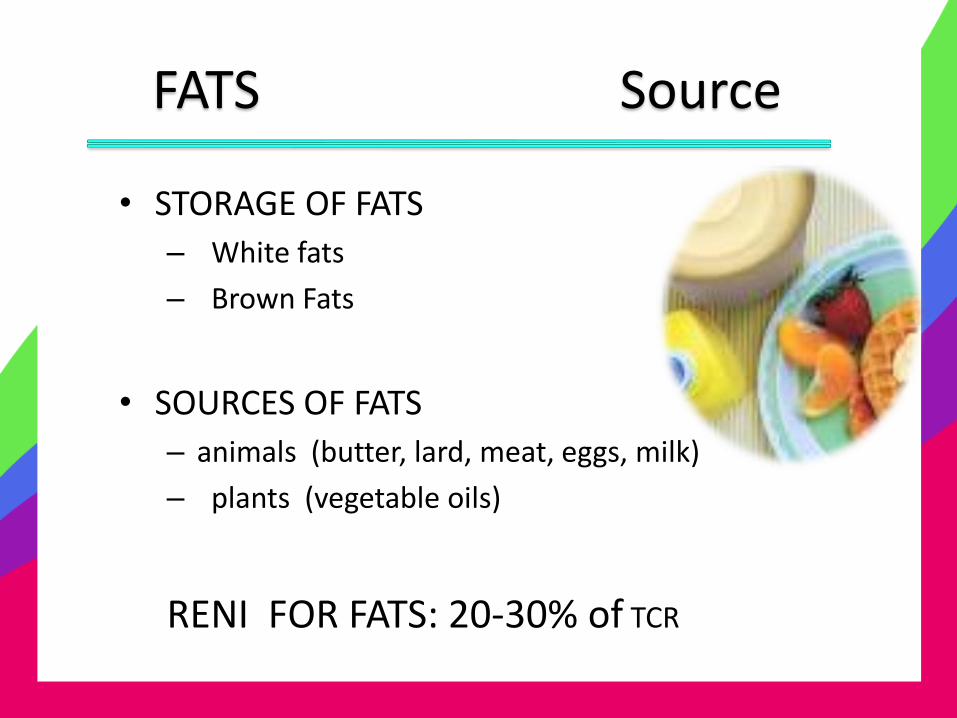
FATS Source
• STORAGE OF FATS
– White fats
– Brown Fats
• SOURCES OF FATS
– animals (butter, lard, meat, eggs, milk)
– plants (vegetable oils)
RENI FOR FATS: 20-30% of TCR
PROTEIN
• First substance recognized as a vital part of living tissue
• Nitrogen-containing compounds which yield amino acids upon hydrolysis
• Classification:
– Indispendible AA
– Dispensible AA
– Conditionally dispensible
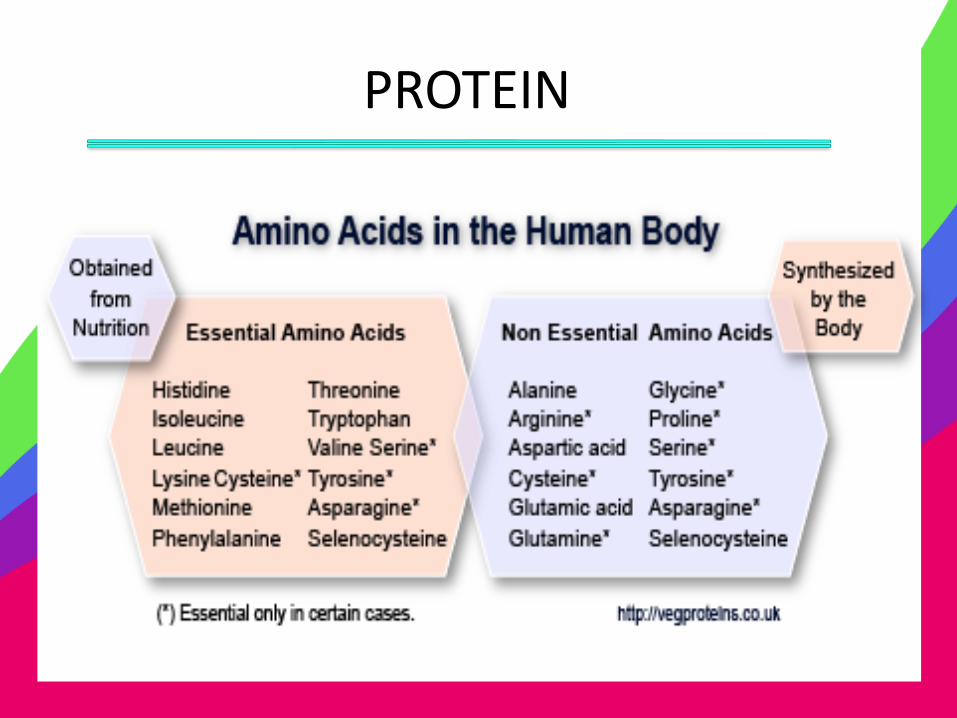
PROTEIN
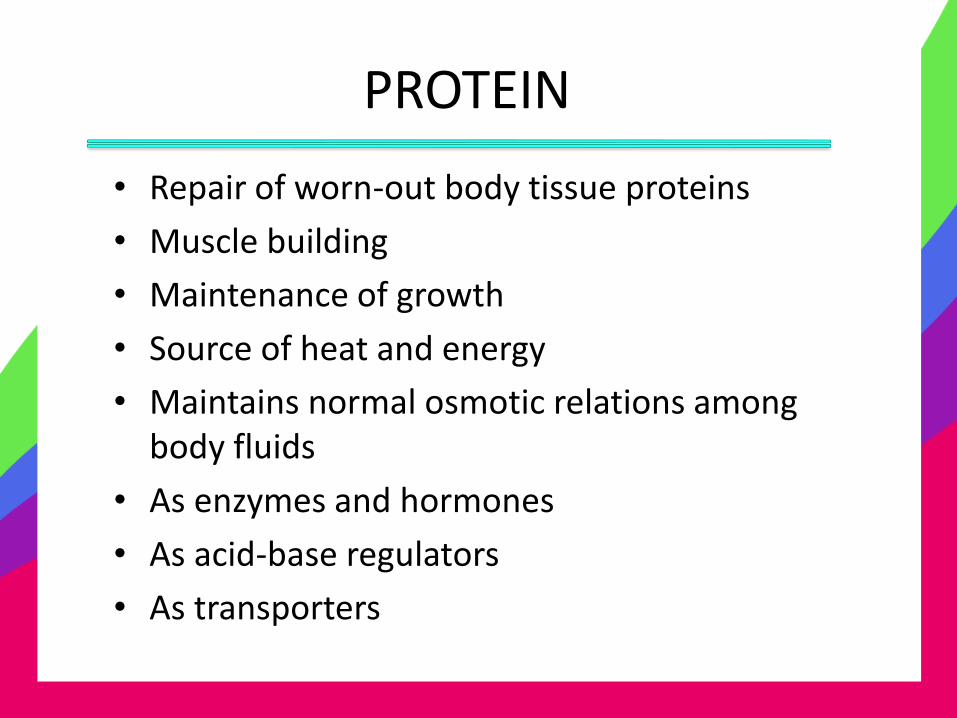
PROTEIN
• Repair of worn-out body tissue proteins
• Muscle building
• Maintenance of growth
• Source of heat and energy
• Maintains normal osmotic relations among body fluids
• As enzymes and hormones
• As acid-base regulators
• As transporters
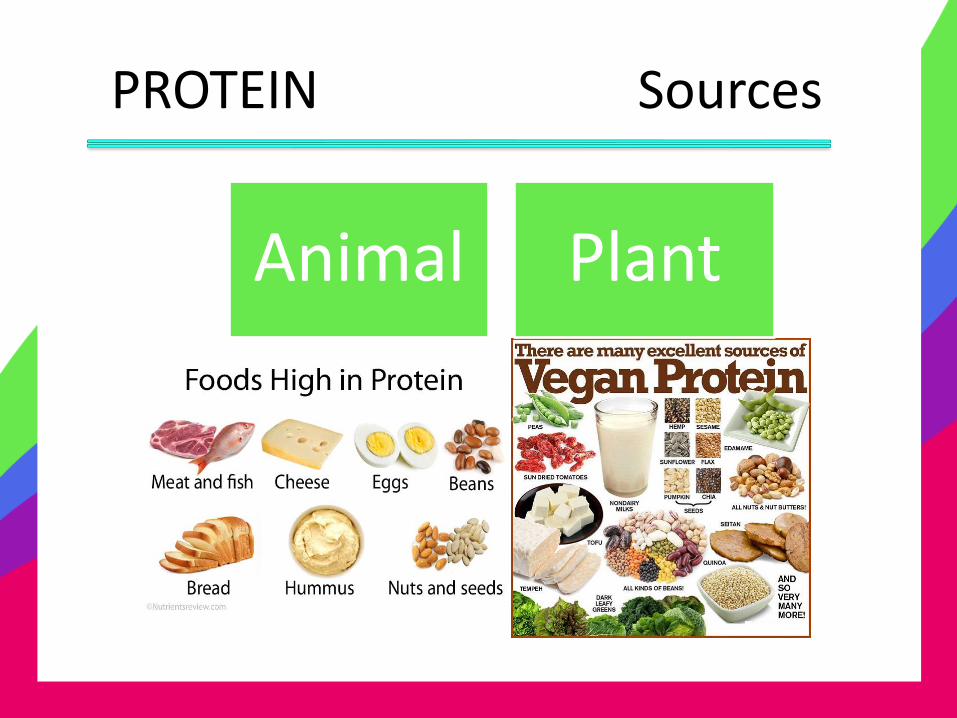
PROTEIN Sources
Animal Plant
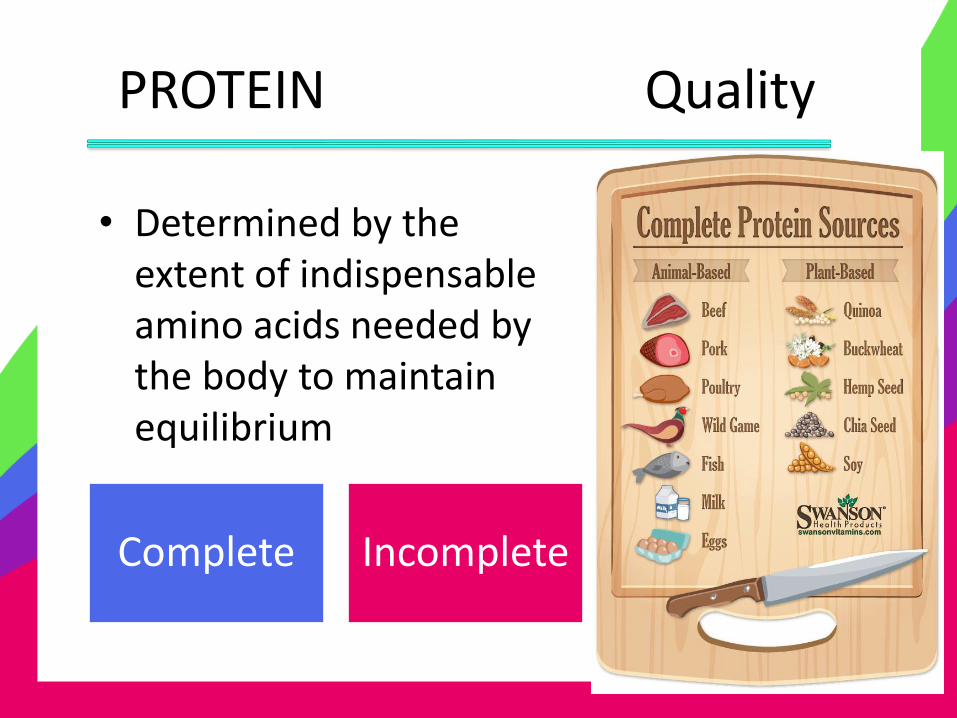
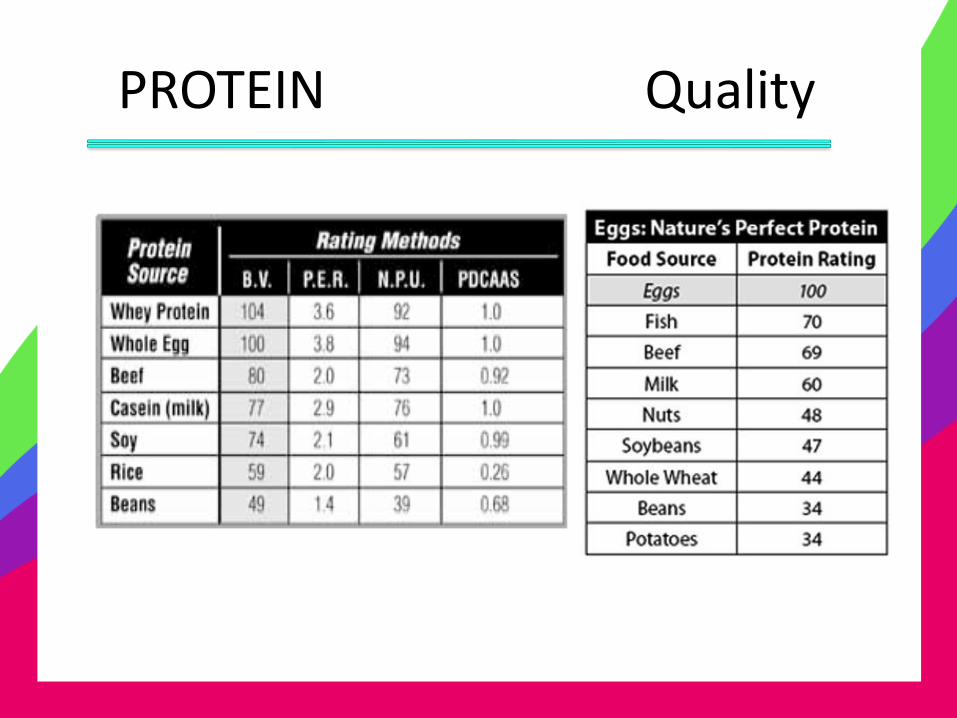
PROTEIN Quality
• Determined by the extent of indispensable amino acids needed by the body to maintain equilibrium
Complete Incomplete
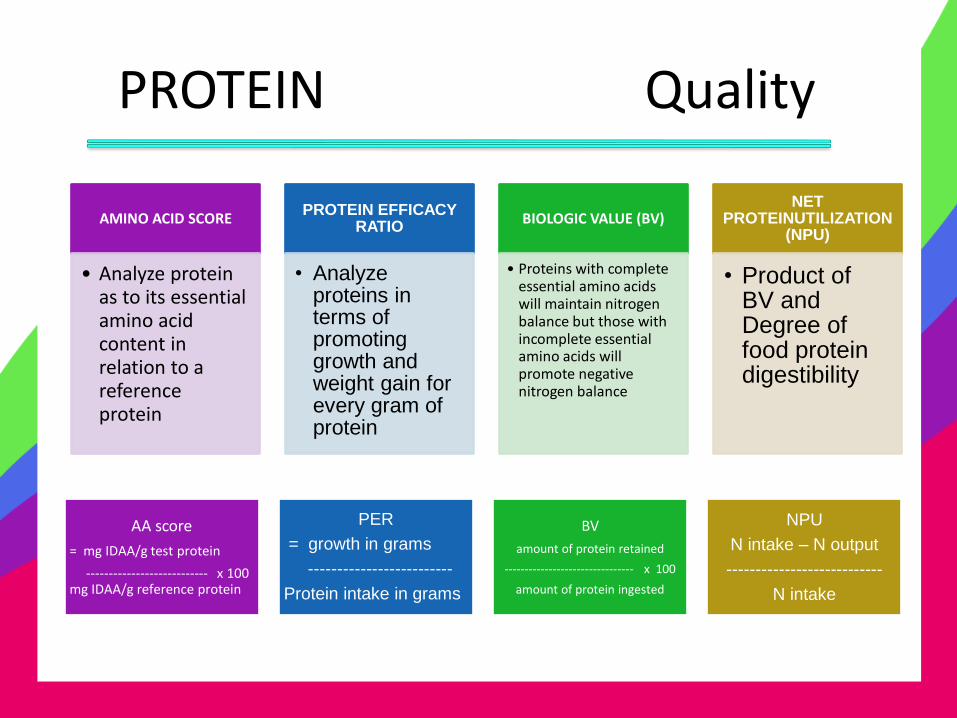
PROTEIN Quality
AMINO ACID SCORE
• Analyze protein as to its essential amino acid content in relation to a reference protein
PROTEIN EFFICACY RATIO
• Analyze proteins in terms of promoting growth and weight gain for every gram of protein
BIOLOGIC VALUE (BV)
• Proteins with complete essential amino acids will maintain nitrogen balance but those with incomplete essential amino acids will promote negative nitrogen balance
NET PROTEINUTILIZATION
(NPU)
• Product of BV and Degree of food protein digestibility
AA score
= mg IDAA/g test protein
--------------------------- x 100 mg IDAA/g reference protein
PER
= growth in grams
-------------------------
Protein intake in grams
BV
amount of protein retained
-------------------------------- x 100
amount of protein ingested
NPU
N intake – N output
---------------------------
N intake
PROTEIN Quality
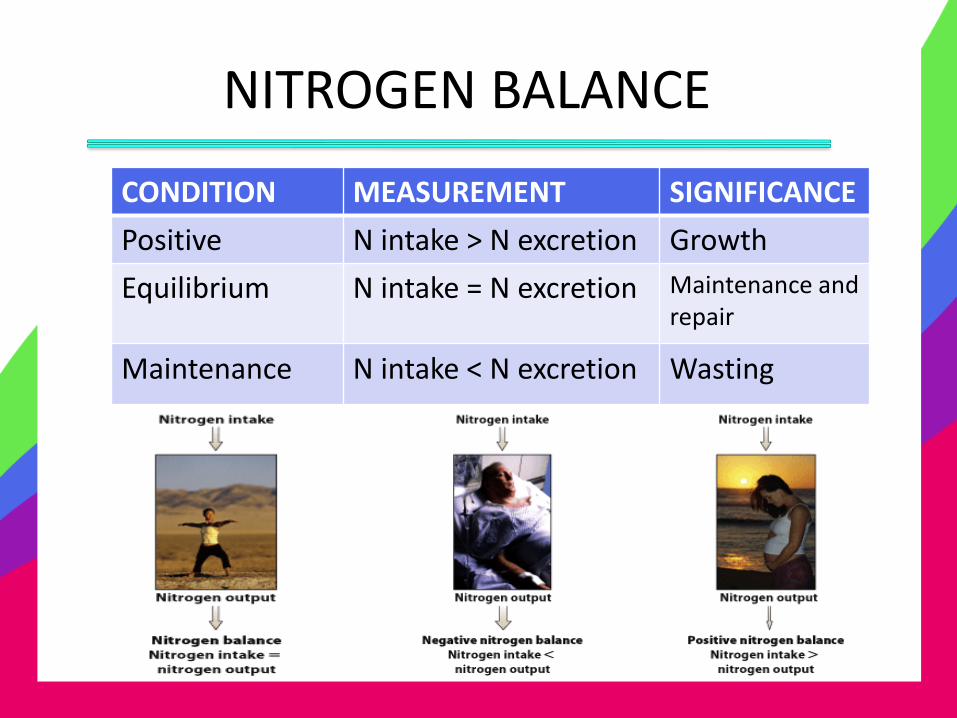
NITROGEN BALANCE
CONDITION MEASUREMENT SIGNIFICANCE
Positive N intake > N excretion Growth
Equilibrium N intake = N excretion Maintenance and repair
Maintenance N intake < N excretion Wasting
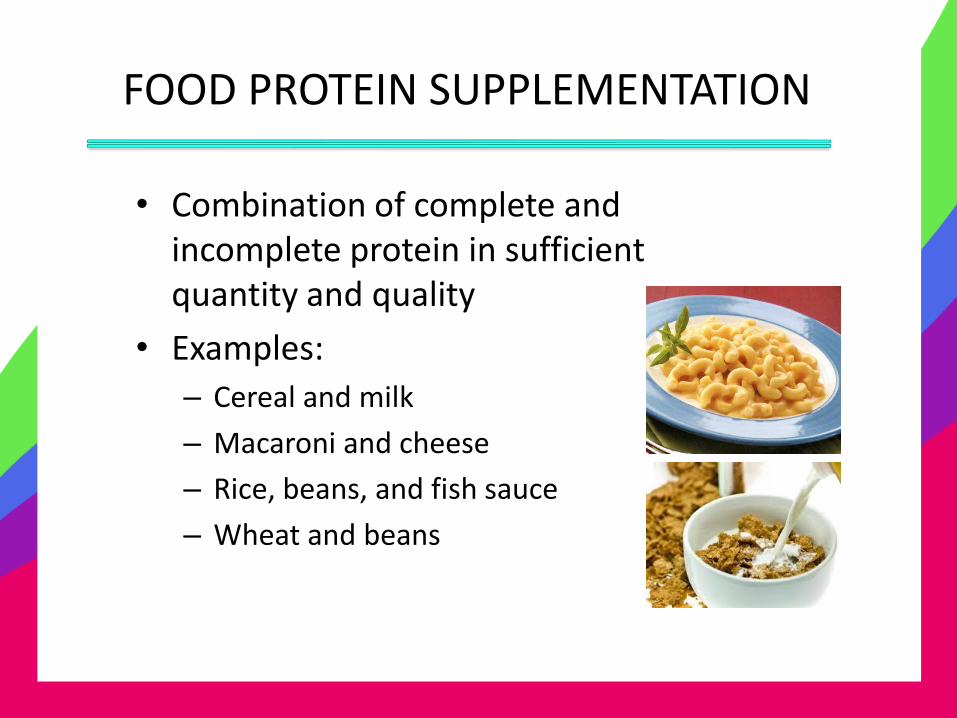
FOOD PROTEIN SUPPLEMENTATION
• Combination of complete and incomplete protein in sufficient quantity and quality
• Examples:
– Cereal and milk
– Macaroni and cheese
– Rice, beans, and fish sauce
– Wheat and beans
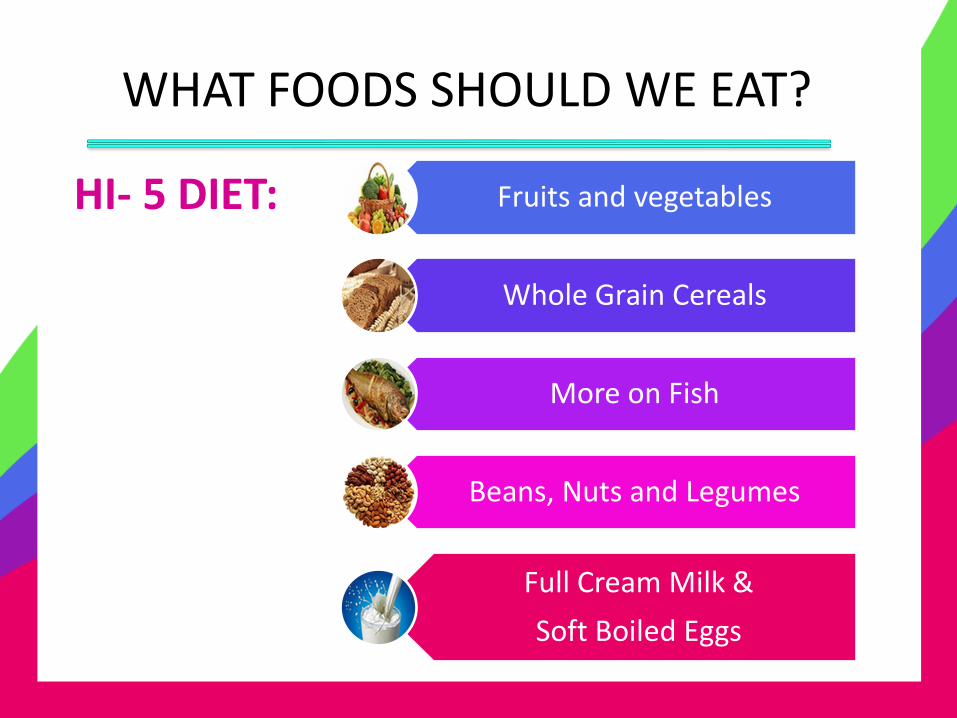
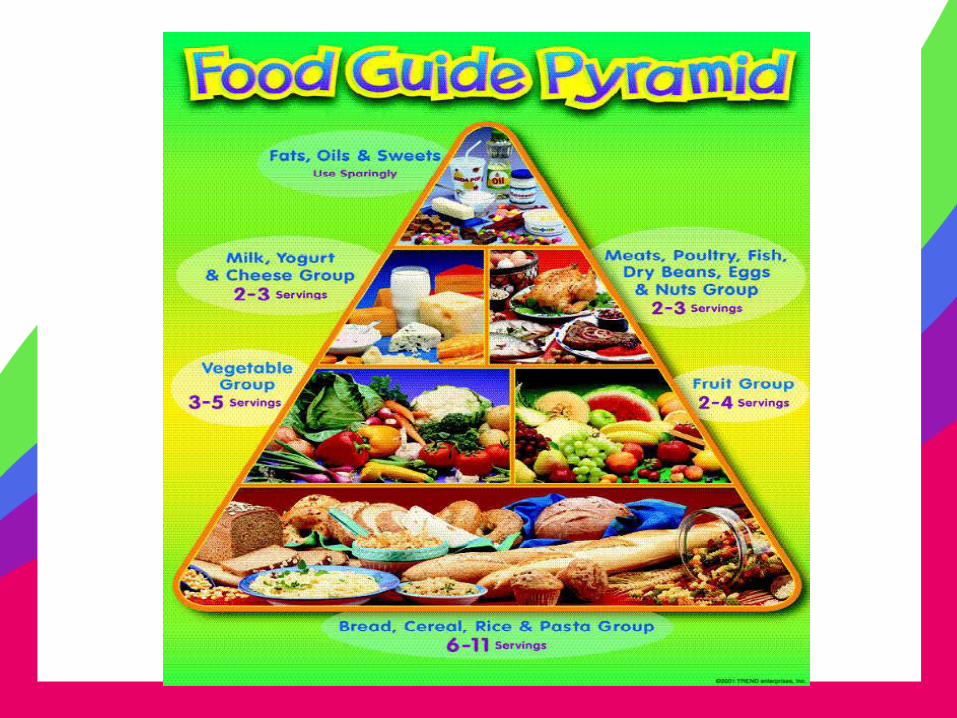
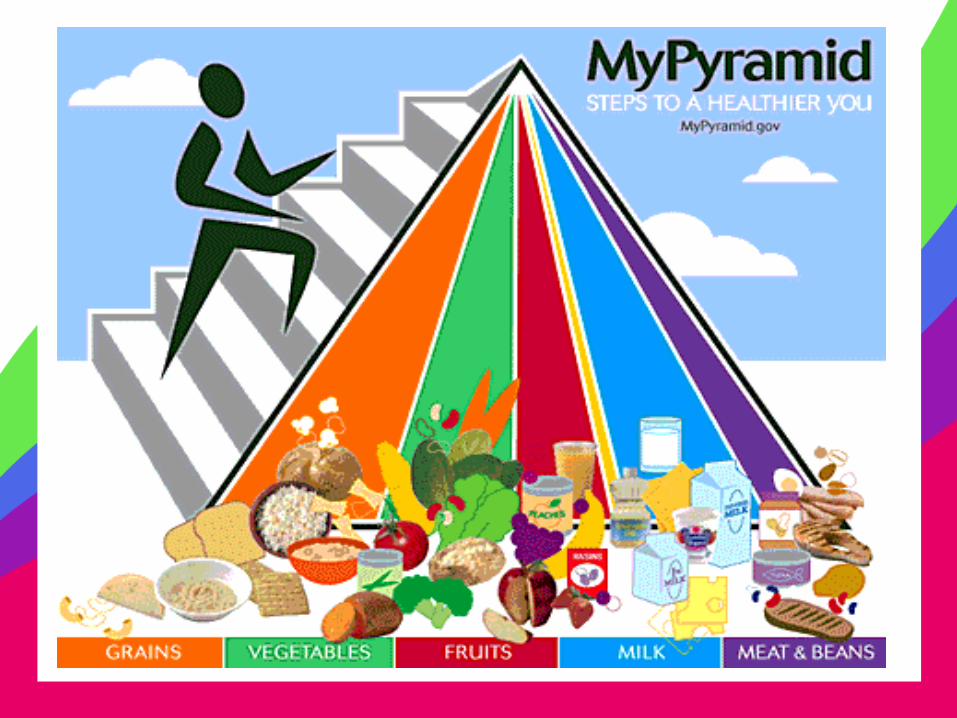
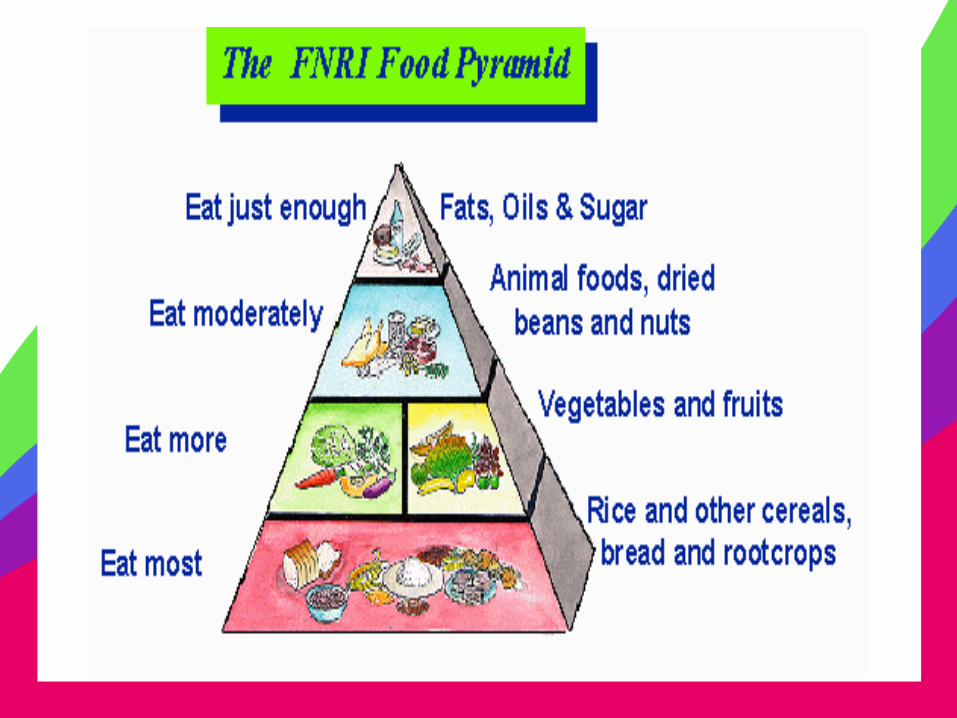
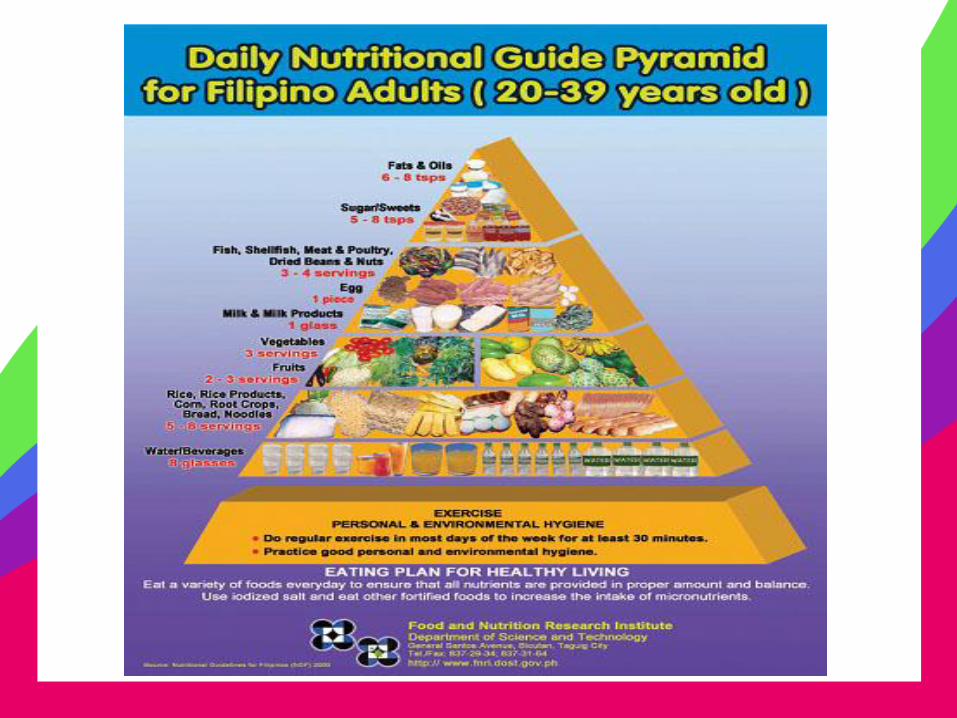
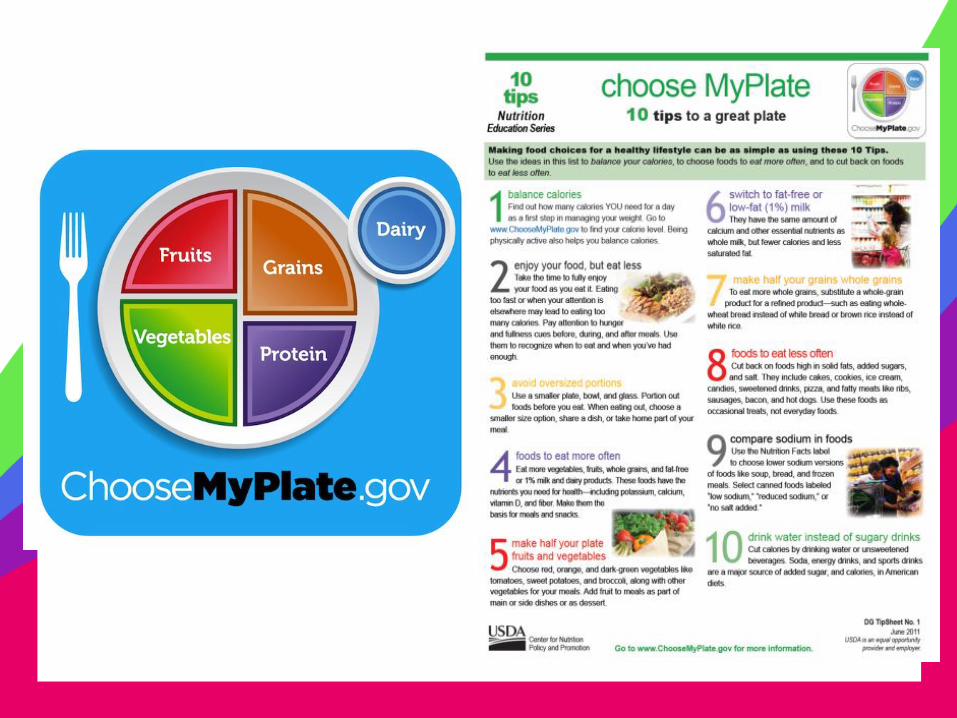
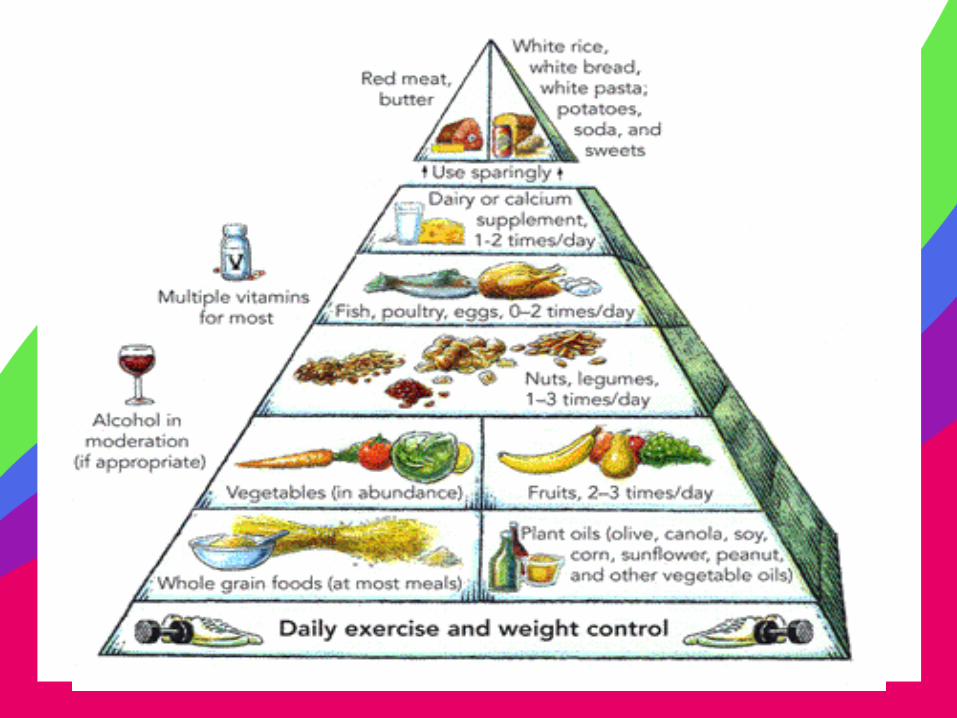
WHAT FOODS SHOULD WE EAT?
HI- 5 DIET: Fruits and vegetables
Whole Grain Cereals
More on Fish
Beans, Nuts and Legumes
Full Cream Milk &
Soft Boiled Eggs
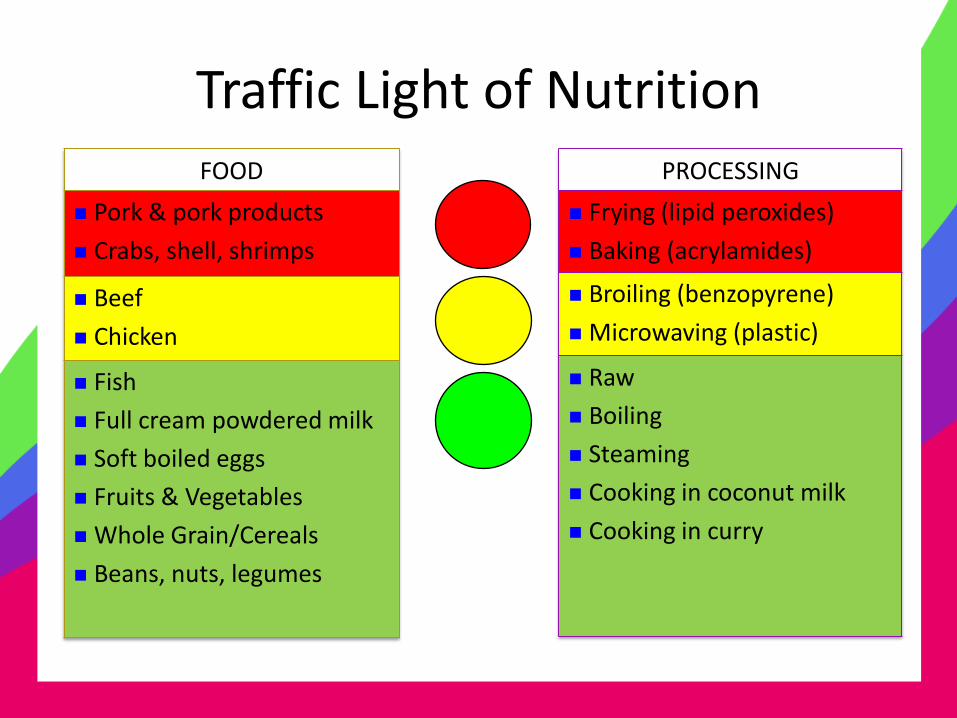
Traffic Light of Nutrition FOOD
Pork & pork products
Crabs, shell, shrimps
Beef
Chicken
Fish
Full cream powdered milk
Soft boiled eggs
Fruits & Vegetables
Whole Grain/Cereals
Beans, nuts, legumes
PROCESSING
Frying (lipid peroxides)
Baking (acrylamides)
Broiling (benzopyrene)
Microwaving (plastic)
Raw
Boiling
Steaming
Cooking in coconut milk
Cooking in curry
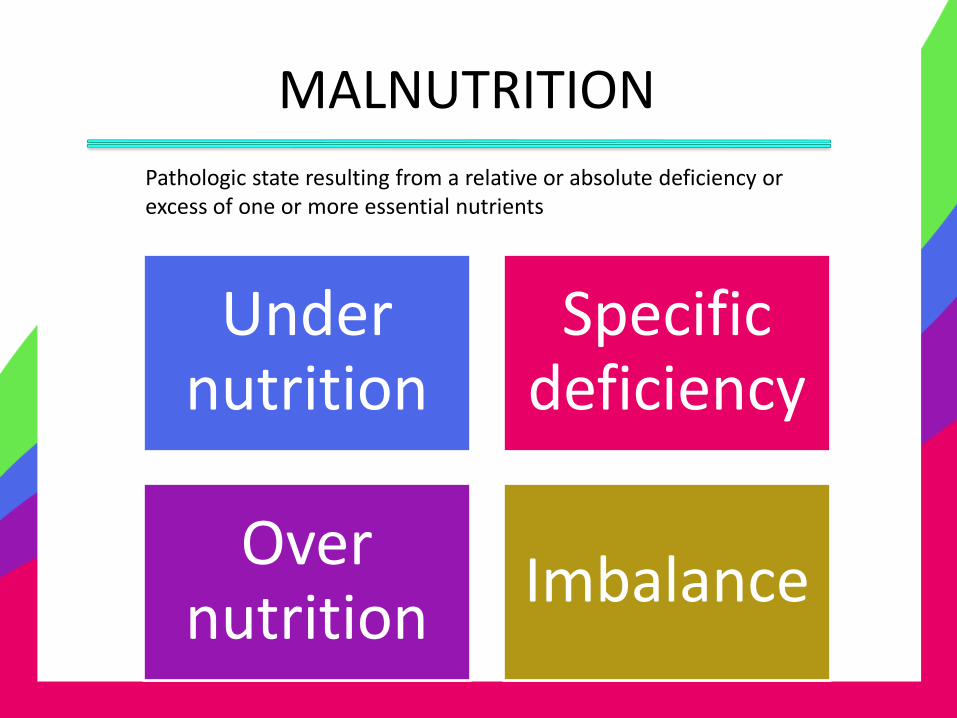
MALNUTRITION
Pathologic state resulting from a relative or absolute deficiency or excess of one or more essential nutrients
Under nutrition
Specific deficiency
Over nutrition
Imbalance
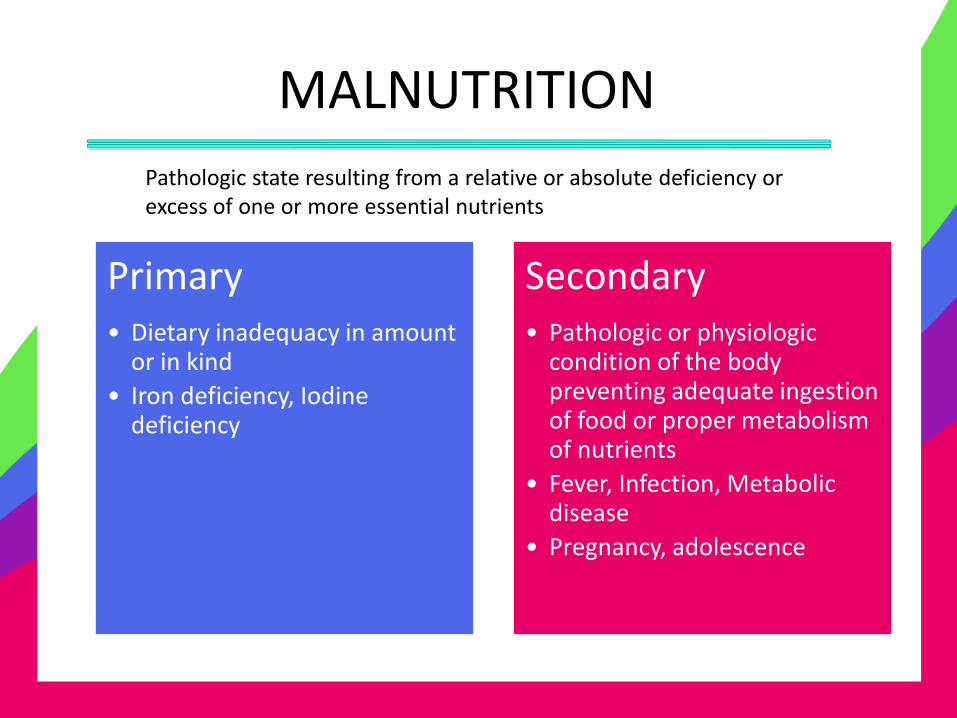
MALNUTRITION
Pathologic state resulting from a relative or absolute deficiency or excess of one or more essential nutrients
Primary • Dietary inadequacy in amount
or in kind
• Iron deficiency, Iodine deficiency
Secondary • Pathologic or physiologic
condition of the body preventing adequate ingestion of food or proper metabolism of nutrients
• Fever, Infection, Metabolic disease
• Pregnancy, adolescence
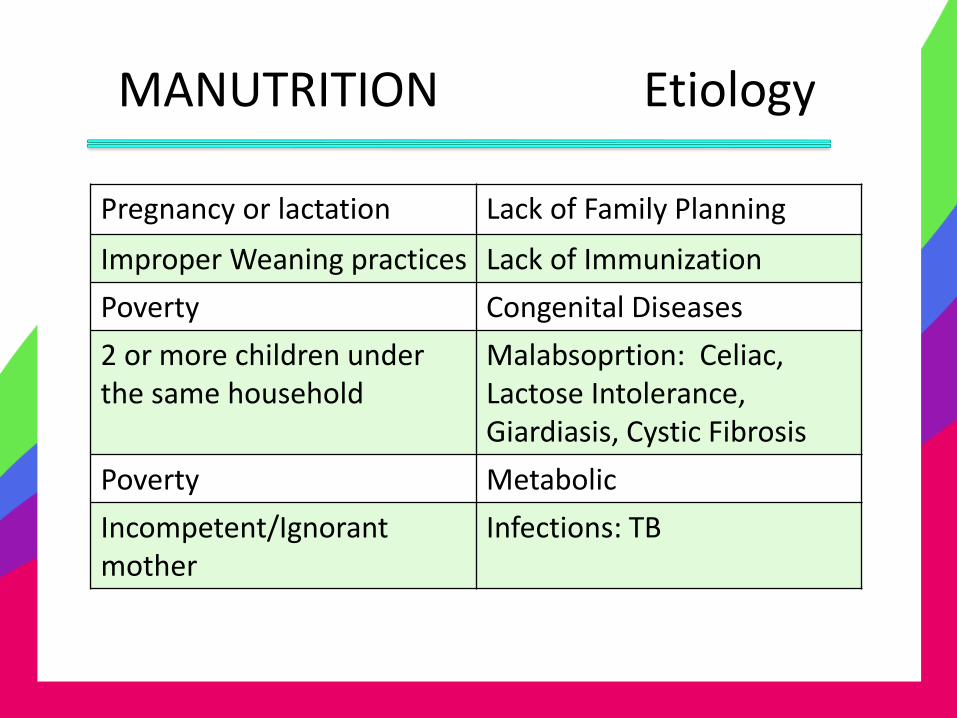
MANUTRITION Etiology
Pregnancy or lactation Lack of Family Planning
Improper Weaning practices Lack of Immunization
Poverty Congenital Diseases
2 or more children under the same household
Malabsoprtion: Celiac, Lactose Intolerance, Giardiasis, Cystic Fibrosis
Poverty Metabolic
Incompetent/Ignorant mother
Infections: TB
PROTEIN ENERGY MANUTRITION
the most common, most disastrous form of malnutrition in the world.
It is characterized not only by an energy deficit due to a reduction in all macronutrients but also by a deficit in many micronutrients.
3 FORMS:
Dry (thin, desiccated)
Wet (edematous, swollen)
Combined form between dry and wet
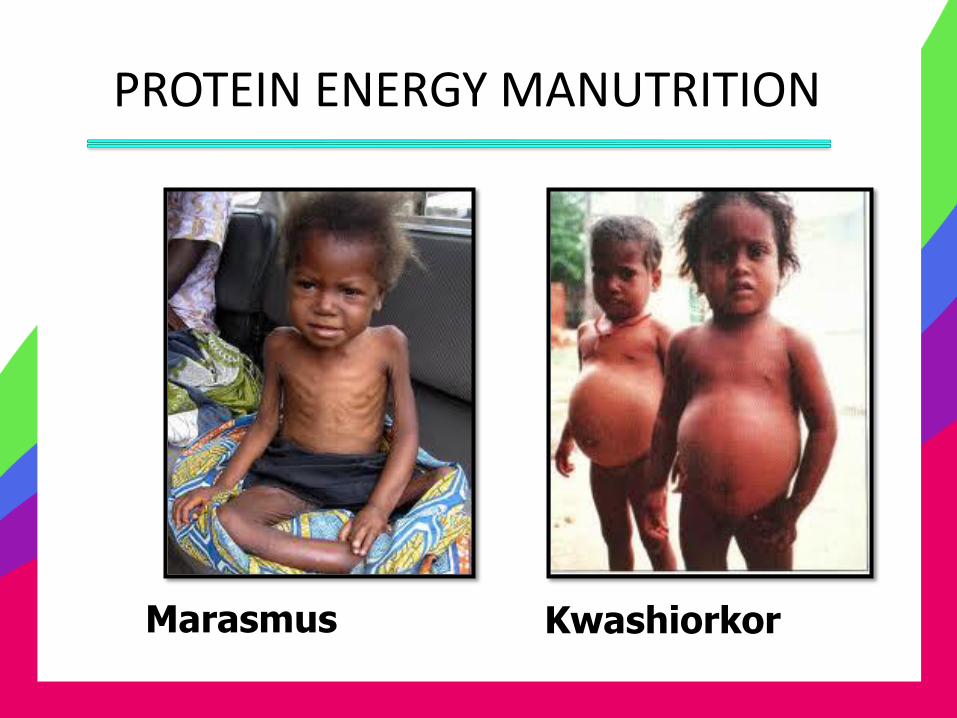
PROTEIN ENERGY MANUTRITION
Marasmus Kwashiorkor
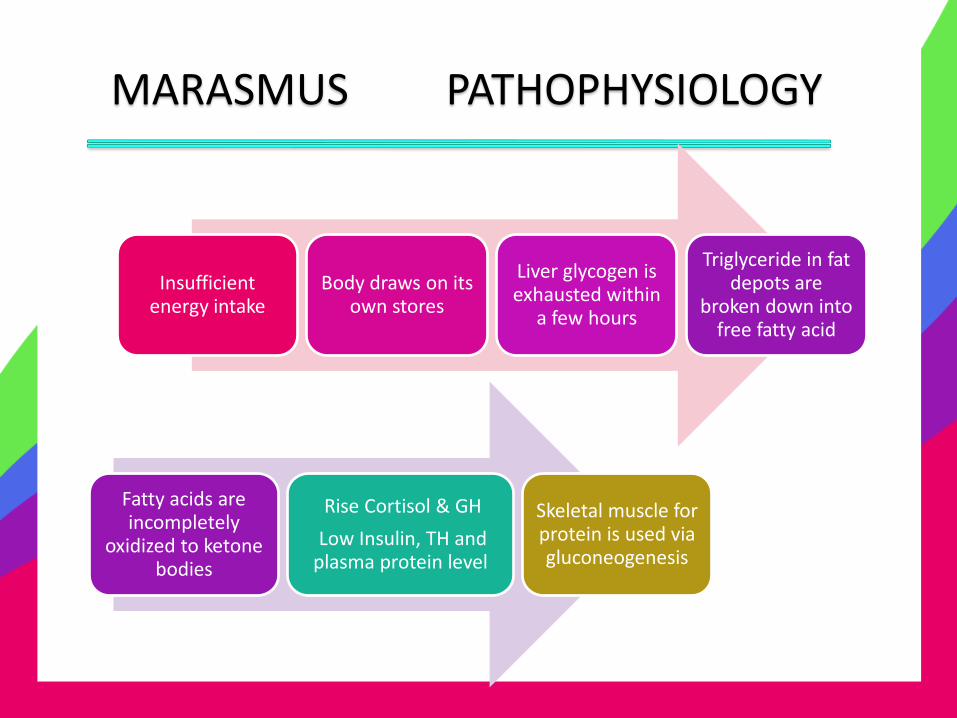
MARASMUS PATHOPHYSIOLOGY
Insufficient energy intake
Body draws on its own stores
Liver glycogen is exhausted within
a few hours
Triglyceride in fat depots are
broken down into free fatty acid
Fatty acids are incompletely
oxidized to ketone bodies
Rise Cortisol & GH
Low Insulin, TH and plasma protein level
Skeletal muscle for protein is used via gluconeogenesis
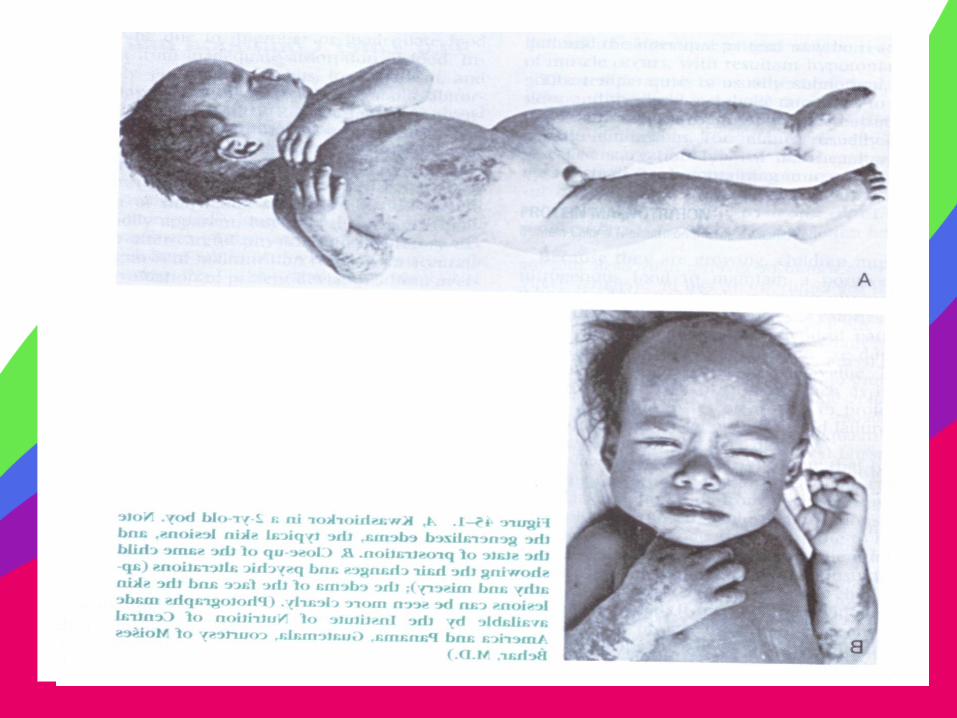
KWASHIORKOR
• Protein Malnutrition
• Nutritional Edema Syndrome
• Etiology:
Insufficient intake of good
quality protein
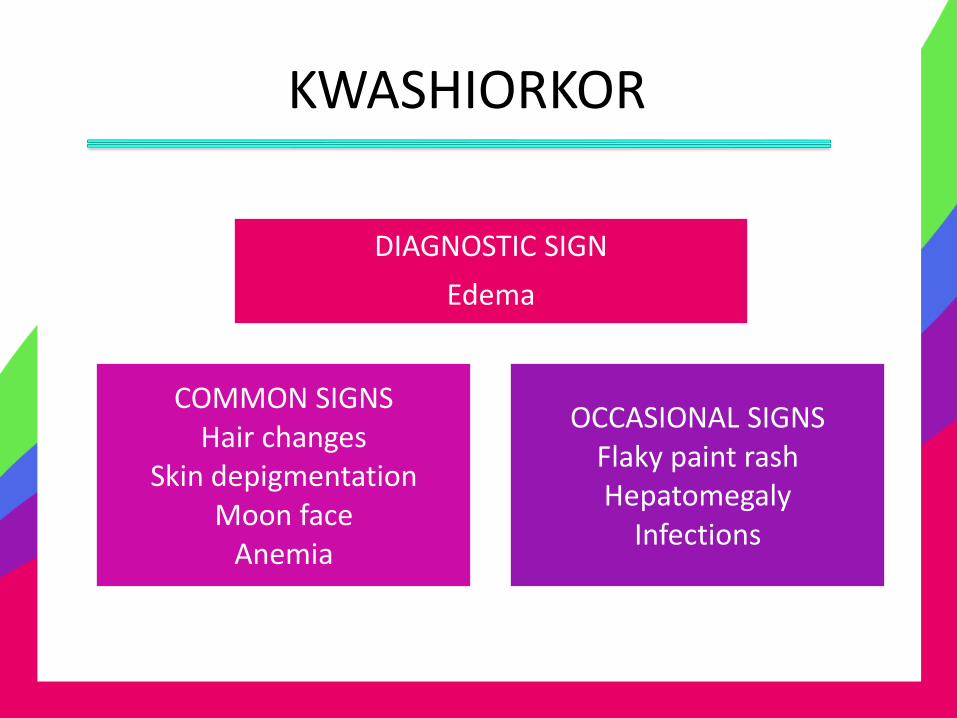
KWASHIORKOR
DIAGNOSTIC SIGN
Edema
COMMON SIGNS Hair changes
Skin depigmentation Moon face
Anemia
OCCASIONAL SIGNS Flaky paint rash Hepatomegaly
Infections
KWASHIORKOR
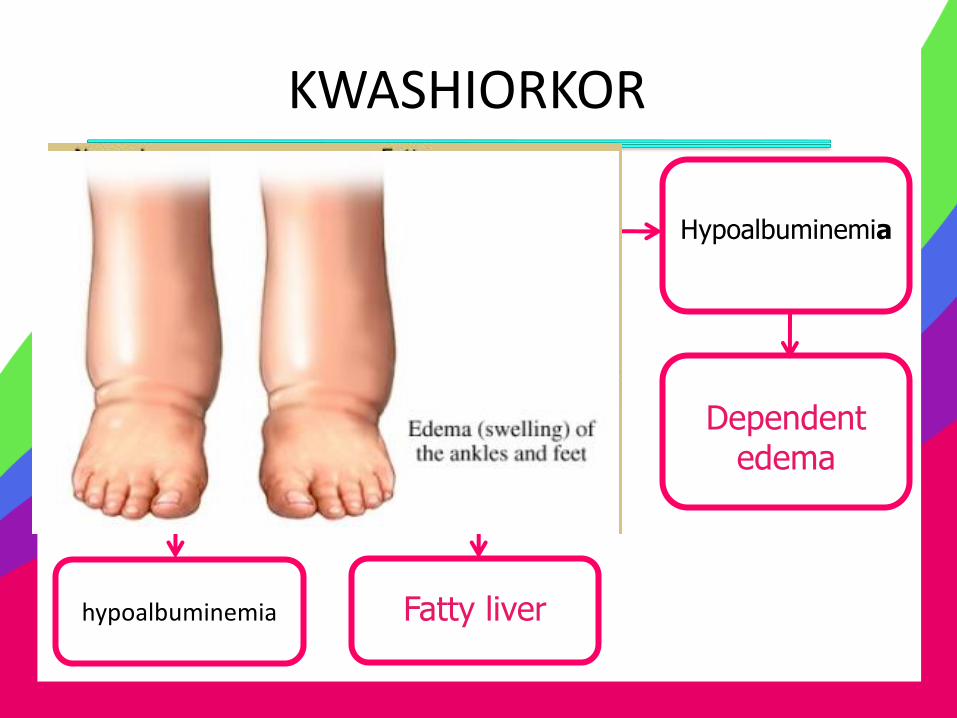
CHO intake CHON intake
Hypoalbuminemia
Decreased visceral protein synthesis
Fat mobilization and amino acid release from
muscle
Impaired beta lipoprotein synthesis
Dependent edema
hypoalbuminemia Fatty liver

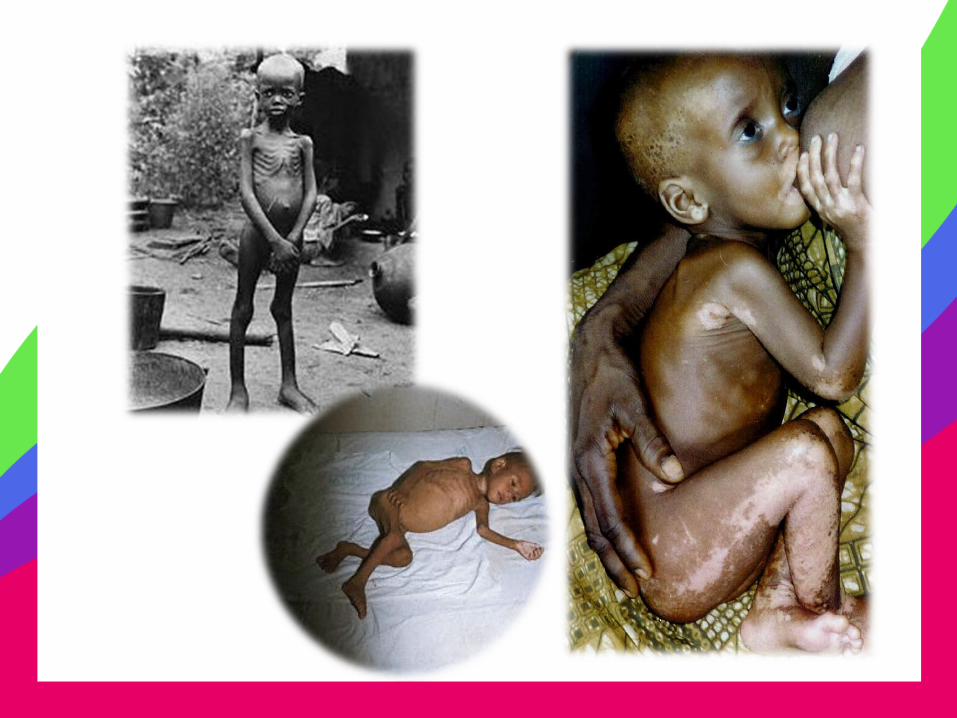

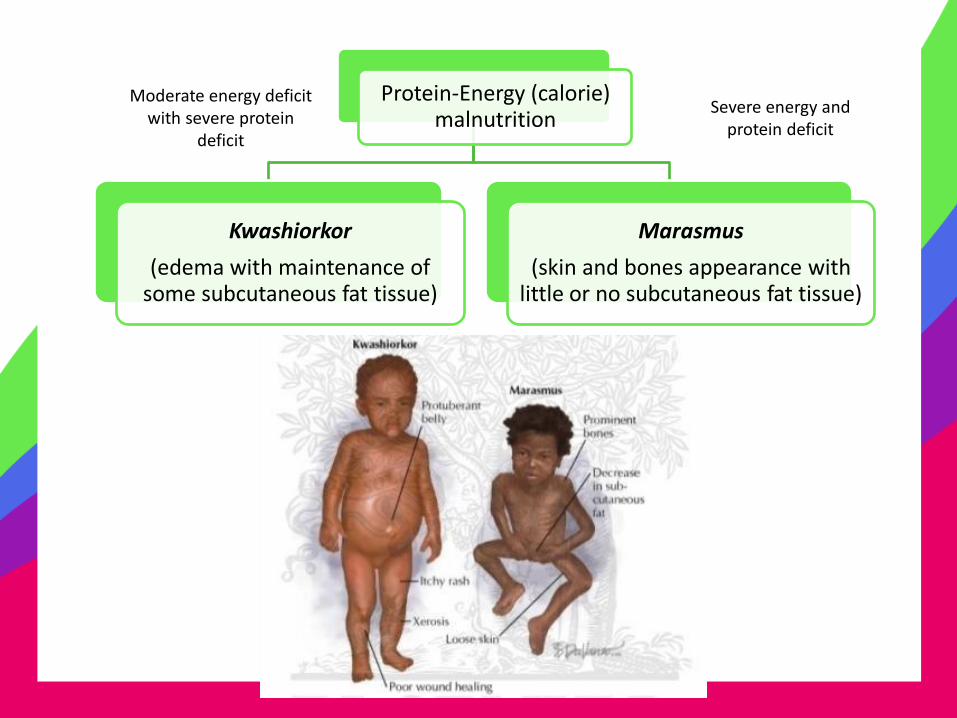
Protein-Energy (calorie) malnutrition
Kwashiorkor
(edema with maintenance of some subcutaneous fat tissue)
Marasmus
(skin and bones appearance with little or no subcutaneous fat tissue)
Moderate energy deficit with severe protein
deficit
Severe energy and protein deficit
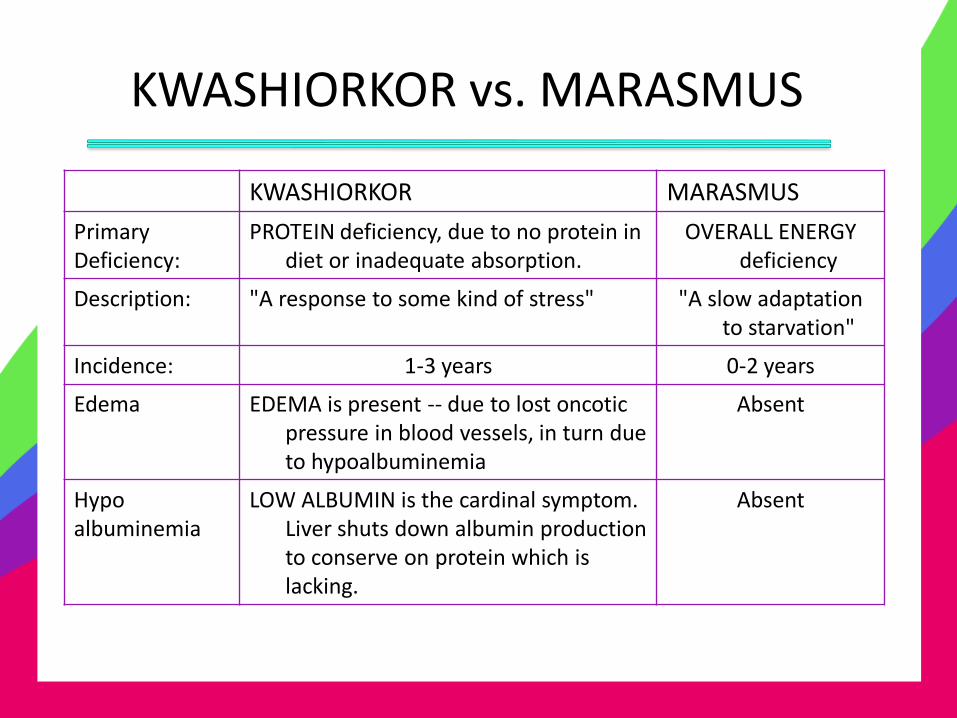
KWASHIORKOR vs. MARASMUS
KWASHIORKOR MARASMUS
Primary Deficiency:
PROTEIN deficiency, due to no protein in diet or inadequate absorption.
OVERALL ENERGY deficiency
Description: "A response to some kind of stress" "A slow adaptation to starvation"
Incidence: 1-3 years 0-2 years
Edema EDEMA is present -- due to lost oncotic pressure in blood vessels, in turn due to hypoalbuminemia
Absent
Hypo albuminemia
LOW ALBUMIN is the cardinal symptom. Liver shuts down albumin production to conserve on protein which is lacking.
Absent
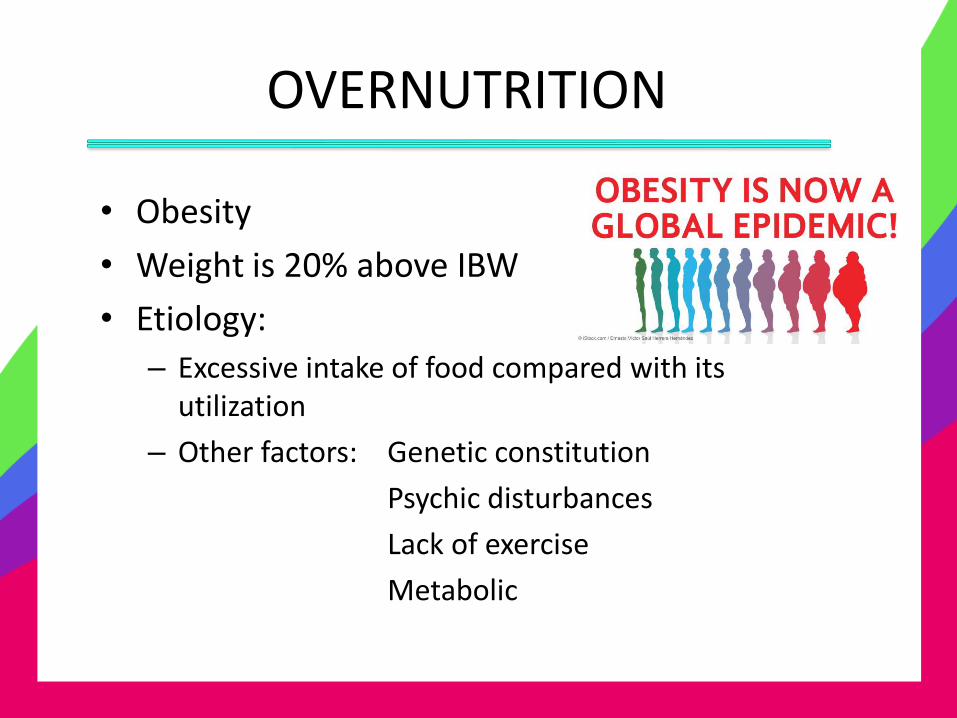
OVERNUTRITION
• Obesity
• Weight is 20% above IBW
• Etiology:
– Excessive intake of food compared with its utilization
– Other factors: Genetic constitution
Psychic disturbances
Lack of exercise
Metabolic
OVERNUTRITION
• Male % body fat >/= 25%
• Female % body fat >/= 30-35%
• BMI = 30 or above
• Scale weight is 20% above Healthy body weight
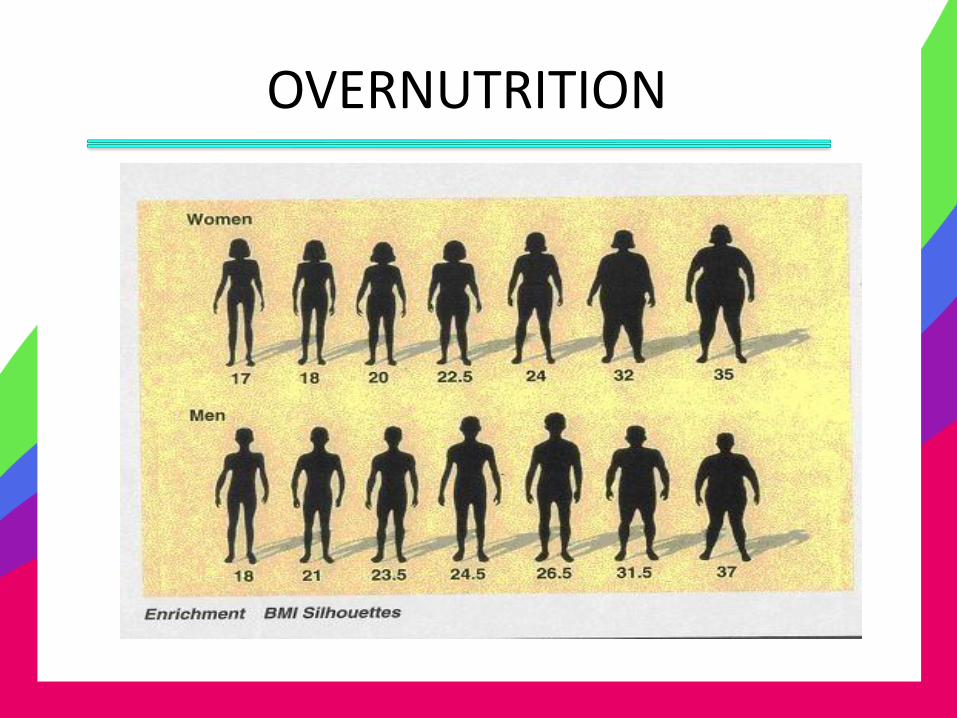
OVERNUTRITION
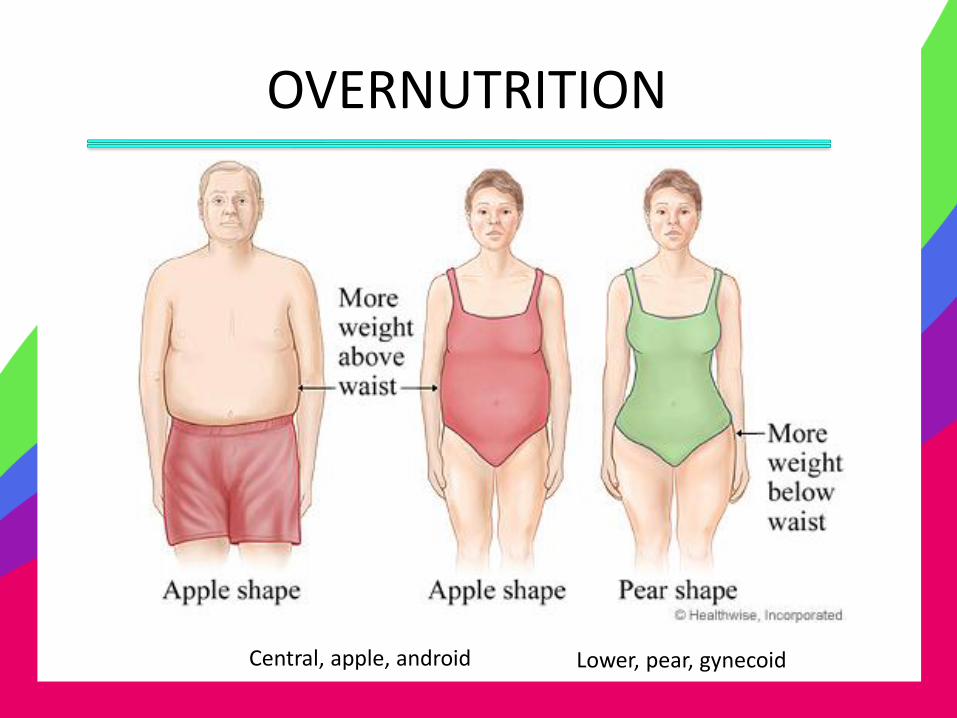
OVERNUTRITION
Central, apple, android Lower, pear, gynecoid

OVERNUTRITION
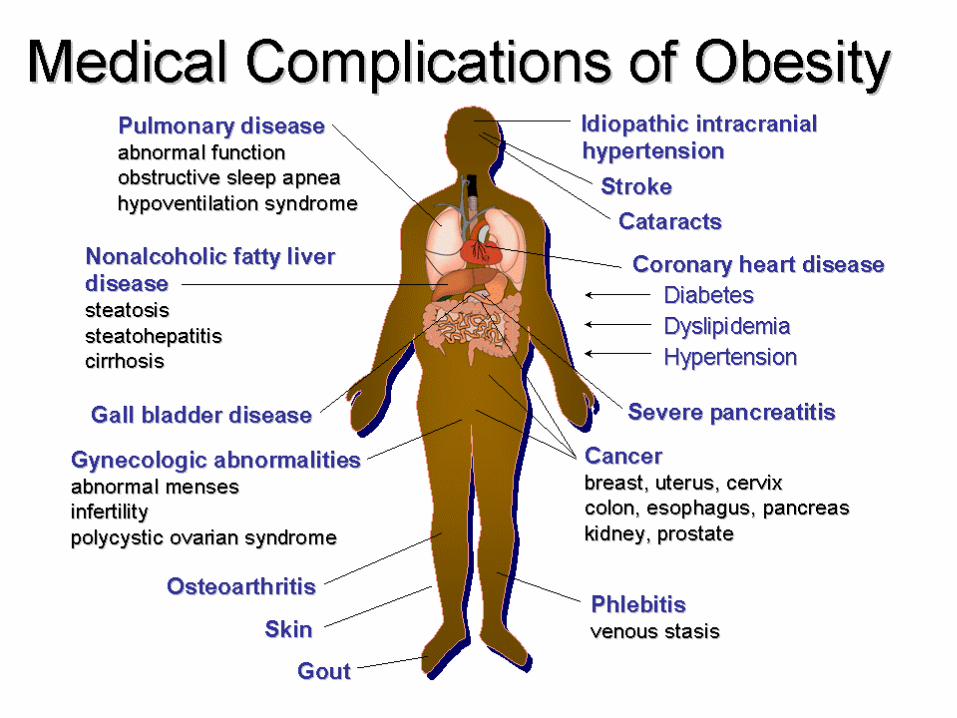
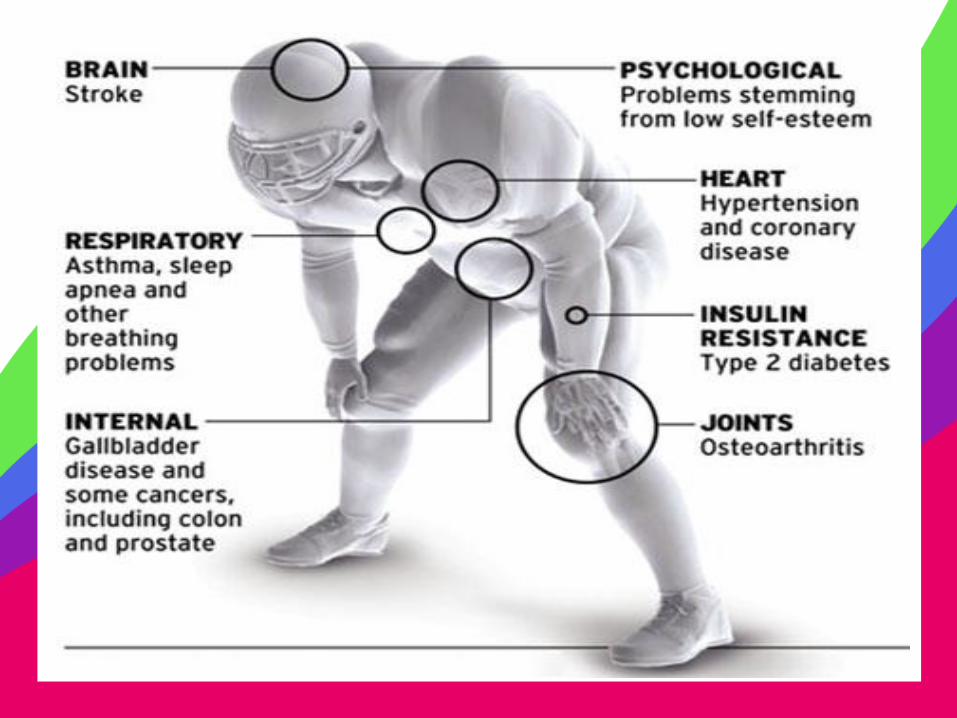
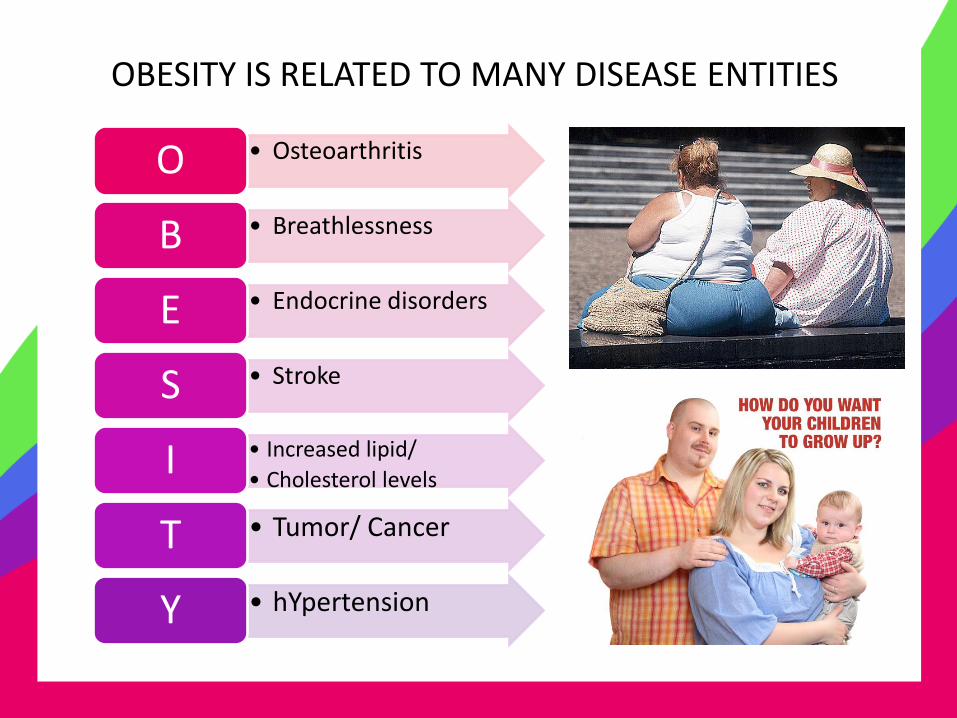
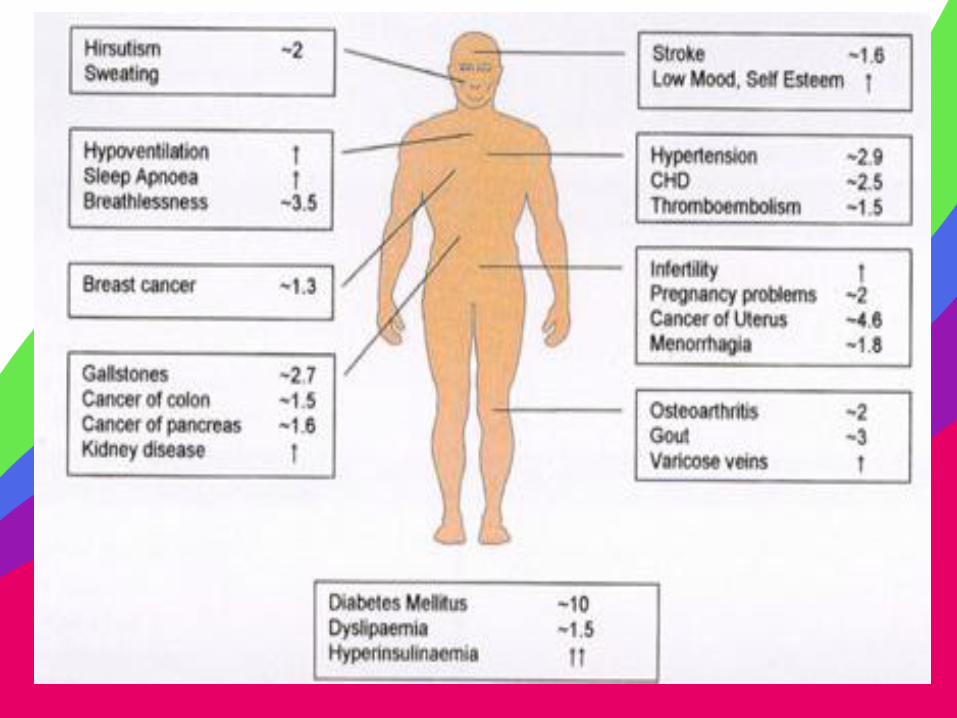
OBESITY IS RELATED TO MANY DISEASE ENTITIES
• Osteoarthritis O
• Breathlessness B
• Endocrine disorders E
• Stroke S
• Increased lipid/
• Cholesterol levels I
• Tumor/ Cancer T
• hYpertension Y
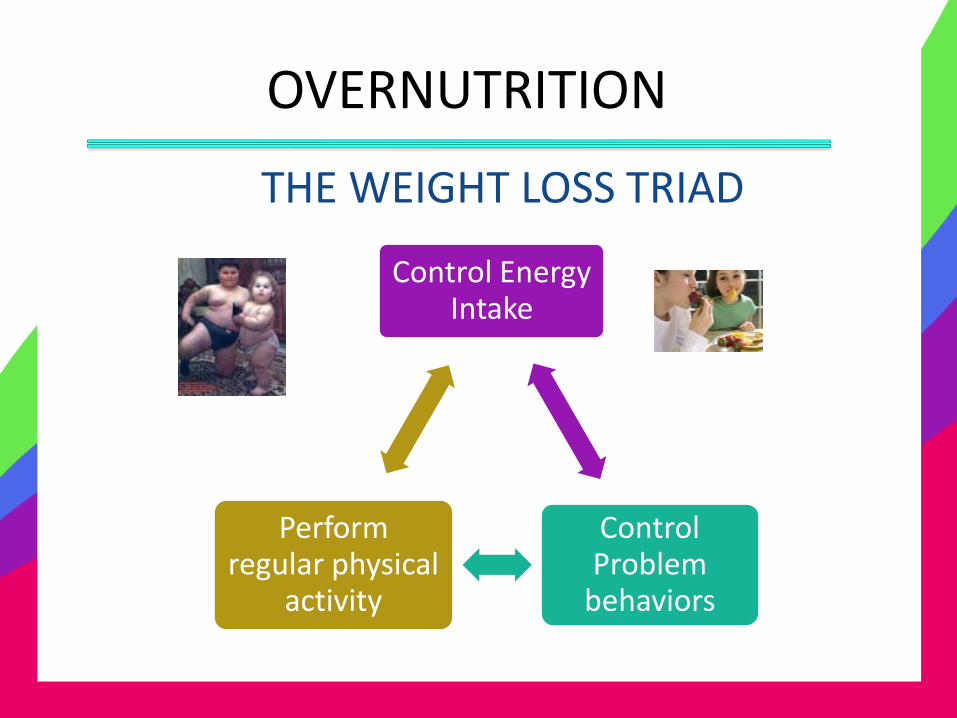
OVERNUTRITION
THE WEIGHT LOSS TRIAD
Control Energy Intake
Control Problem
behaviors
Perform regular physical
activity
BREAST FEEDING
Optimal method of feeding infants
Gold standard Most appropriate form of nutrition
for infants
Better than bottle feeding
Complete food for infants up to 6 months of life
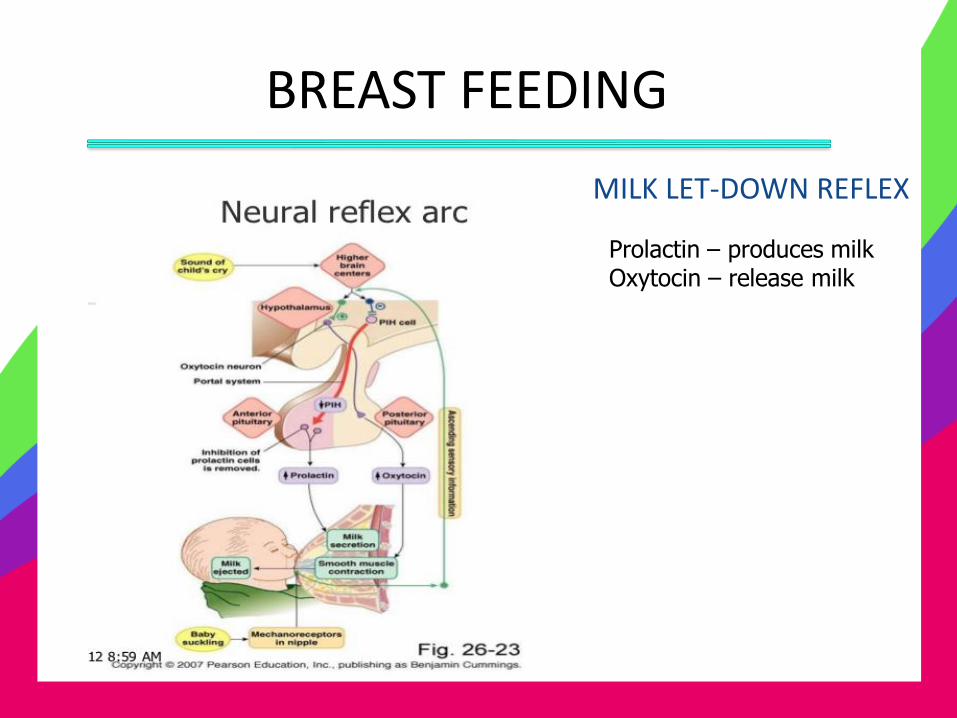
BREAST FEEDING
MILK LET-DOWN REFLEX
Prolactin – produces milk Oxytocin – release milk
BREAST FEEDING
• Factors affecting composition of breast milk:
– Time of day
– Diet of mother
– Mother’s emotional state
– Foremilk or hindmilk
– Drugs
– smoking
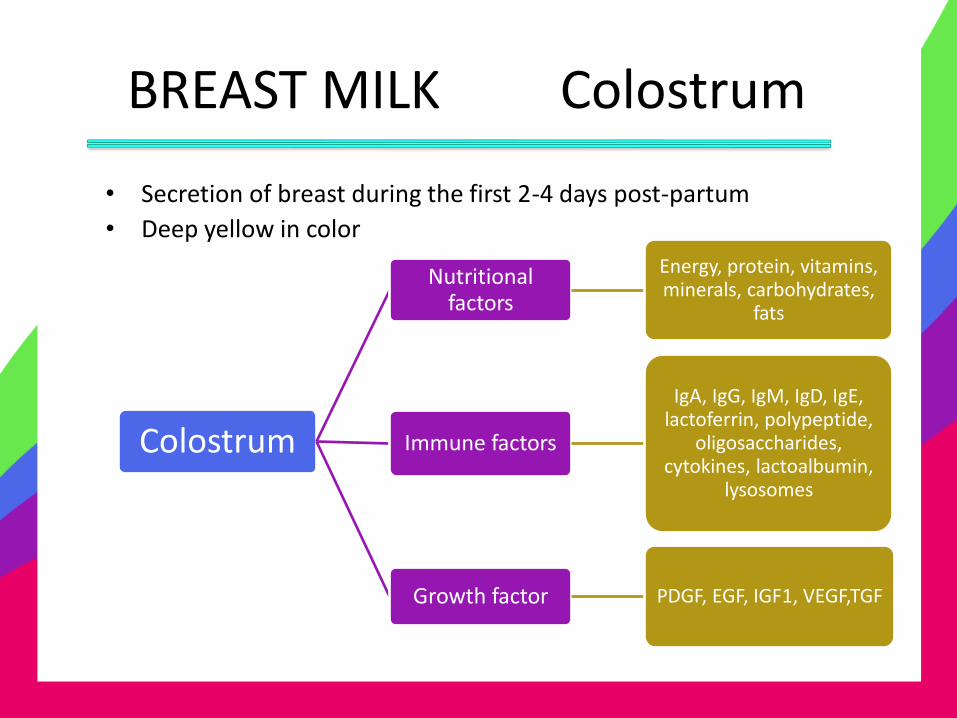
BREAST MILK Colostrum
• Secretion of breast during the first 2-4 days post-partum
• Deep yellow in color
Colostrum
Nutritional factors
Energy, protein, vitamins, minerals, carbohydrates,
fats
Immune factors
IgA, IgG, IgM, IgD, IgE, lactoferrin, polypeptide,
oligosaccharides, cytokines, lactoalbumin,
lysosomes
Growth factor PDGF, EGF, IGF1, VEGF,TGF
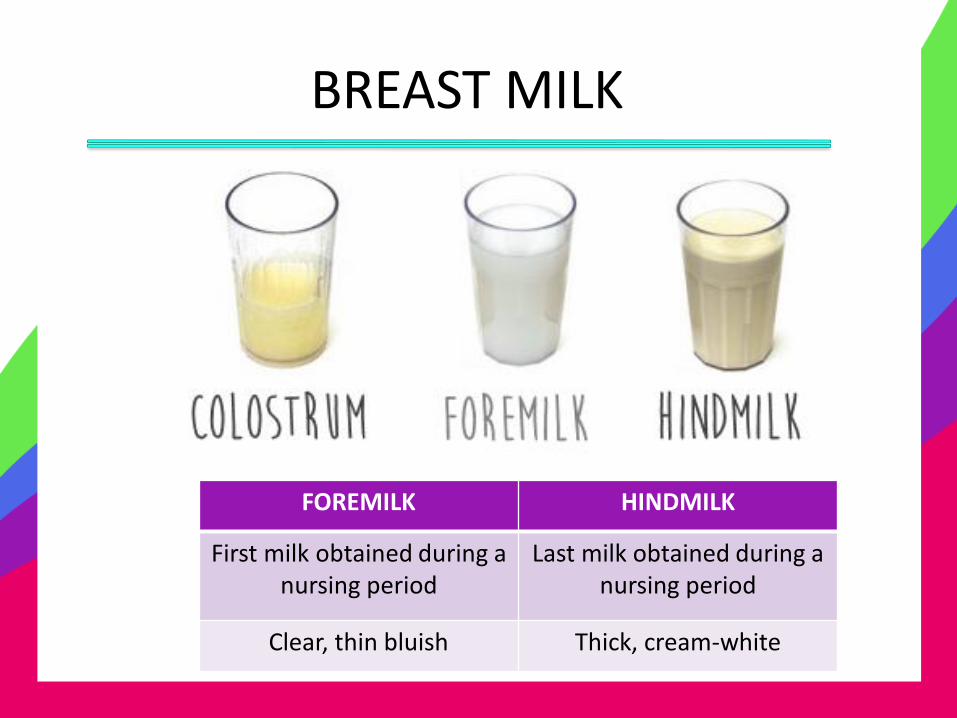
BREAST MILK
FOREMILK HINDMILK
First milk obtained during a nursing period
Last milk obtained during a nursing period
Clear, thin bluish Thick, cream-white
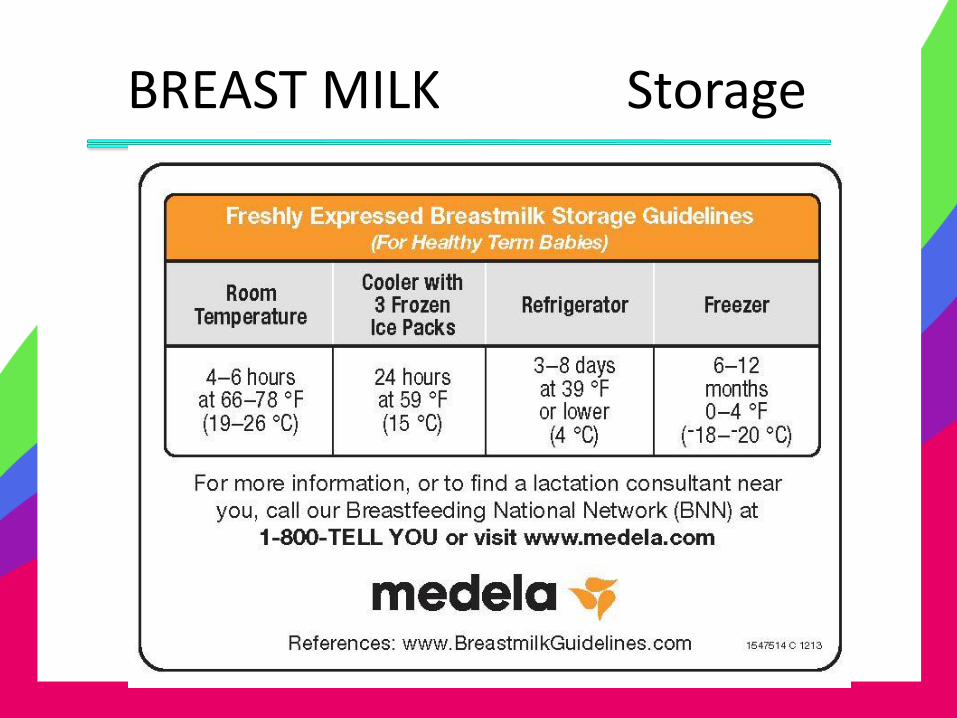
BREAST MILK Storage
BREAST MILK
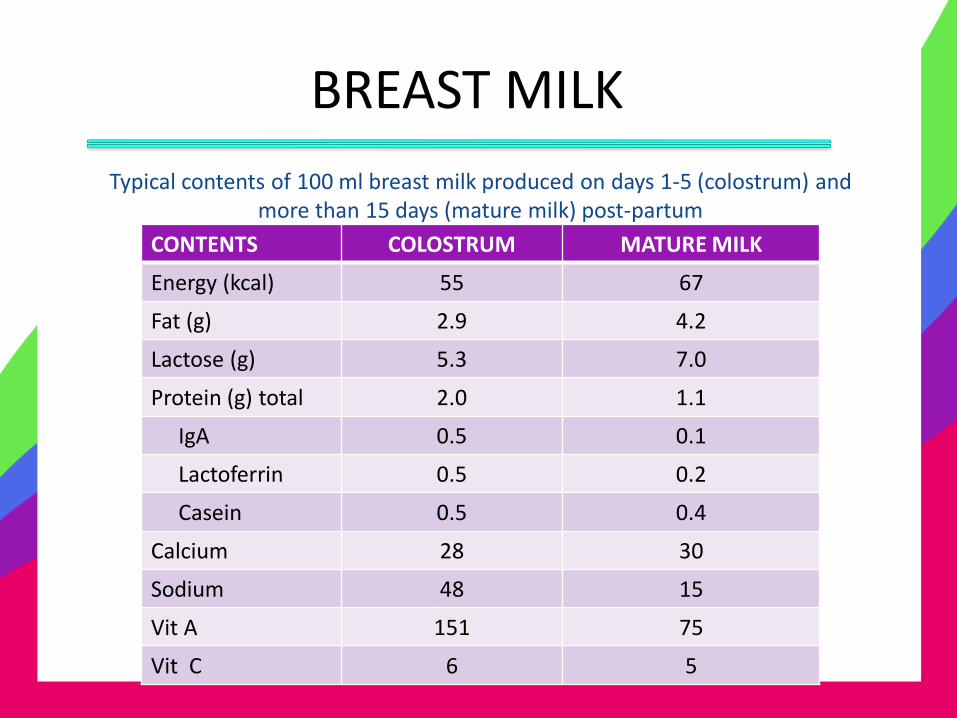
Typical contents of 100 ml breast milk produced on days 1-5 (colostrum) and more than 15 days (mature milk) post-partum
CONTENTS COLOSTRUM MATURE MILK
Energy (kcal) 55 67
Fat (g) 2.9 4.2
Lactose (g) 5.3 7.0
Protein (g) total 2.0 1.1
IgA 0.5 0.1
Lactoferrin 0.5 0.2
Casein 0.5 0.4
Calcium 28 30
Sodium 48 15
Vit A 151 75
Vit C 6 5
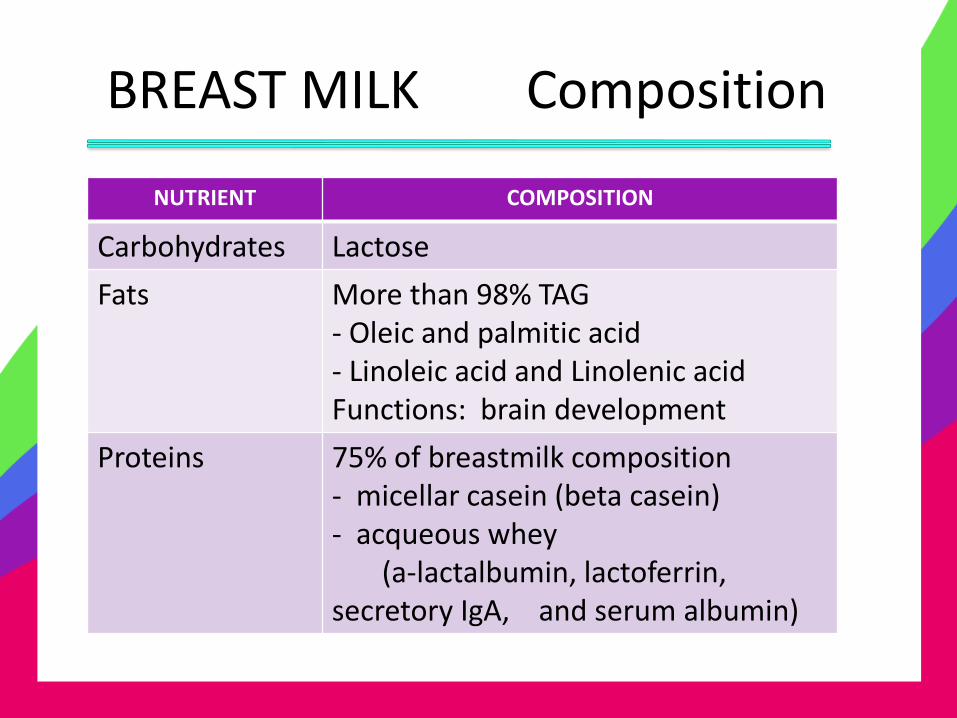
BREAST MILK Composition
NUTRIENT COMPOSITION
Carbohydrates Lactose
Fats More than 98% TAG - Oleic and palmitic acid - Linoleic acid and Linolenic acid Functions: brain development
Proteins 75% of breastmilk composition - micellar casein (beta casein) - acqueous whey (a-lactalbumin, lactoferrin, secretory IgA, and serum albumin)
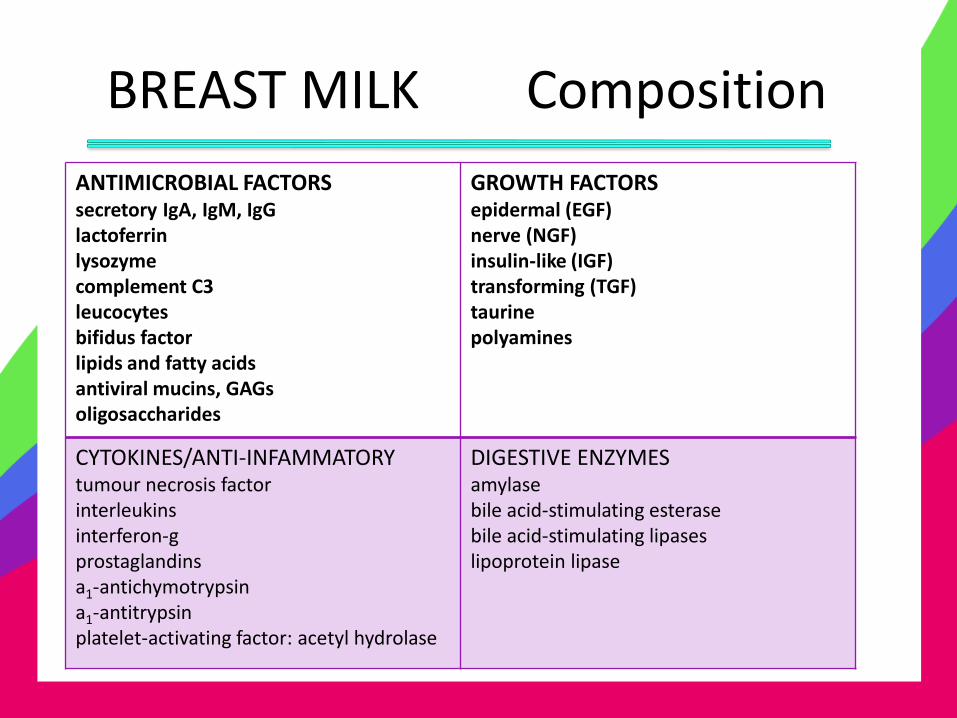
BREAST MILK Composition
ANTIMICROBIAL FACTORS secretory IgA, IgM, IgG lactoferrin lysozyme complement C3 leucocytes bifidus factor lipids and fatty acids antiviral mucins, GAGs oligosaccharides
GROWTH FACTORS epidermal (EGF) nerve (NGF) insulin-like (IGF) transforming (TGF) taurine polyamines
CYTOKINES/ANTI-INFAMMATORY tumour necrosis factor interleukins interferon-g prostaglandins a1-antichymotrypsin a1-antitrypsin platelet-activating factor: acetyl hydrolase
DIGESTIVE ENZYMES amylase bile acid-stimulating esterase bile acid-stimulating lipases lipoprotein lipase
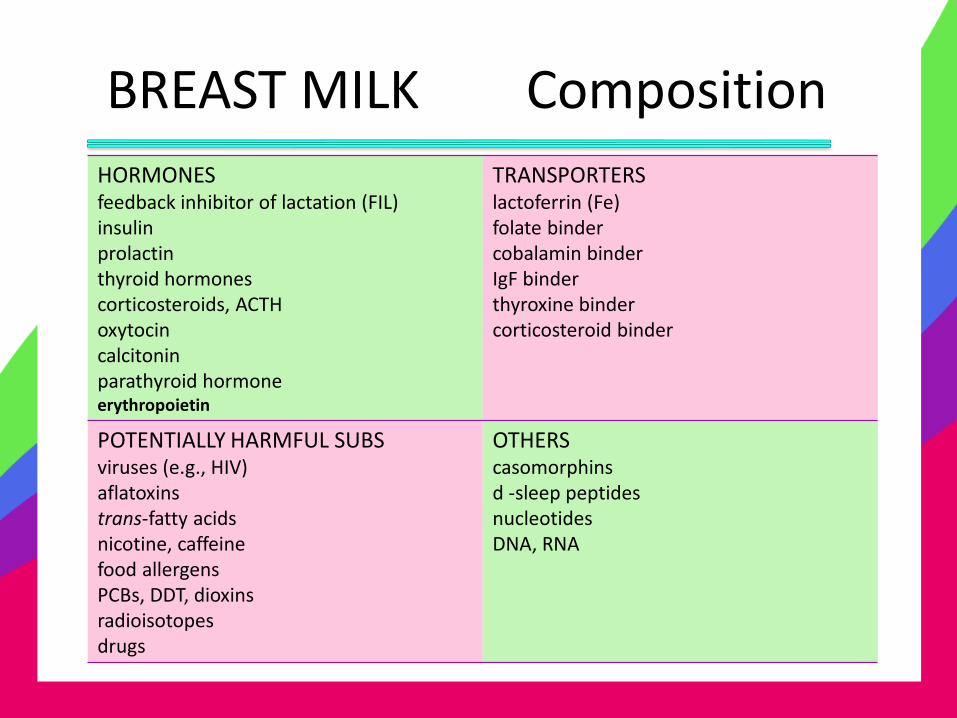
BREAST MILK Composition
HORMONES feedback inhibitor of lactation (FIL) insulin prolactin thyroid hormones corticosteroids, ACTH oxytocin calcitonin parathyroid hormone erythropoietin
TRANSPORTERS lactoferrin (Fe) folate binder cobalamin binder IgF binder thyroxine binder corticosteroid binder
POTENTIALLY HARMFUL SUBS viruses (e.g., HIV) aflatoxins trans-fatty acids nicotine, caffeine food allergens PCBs, DDT, dioxins radioisotopes drugs
OTHERS casomorphins d -sleep peptides nucleotides DNA, RNA
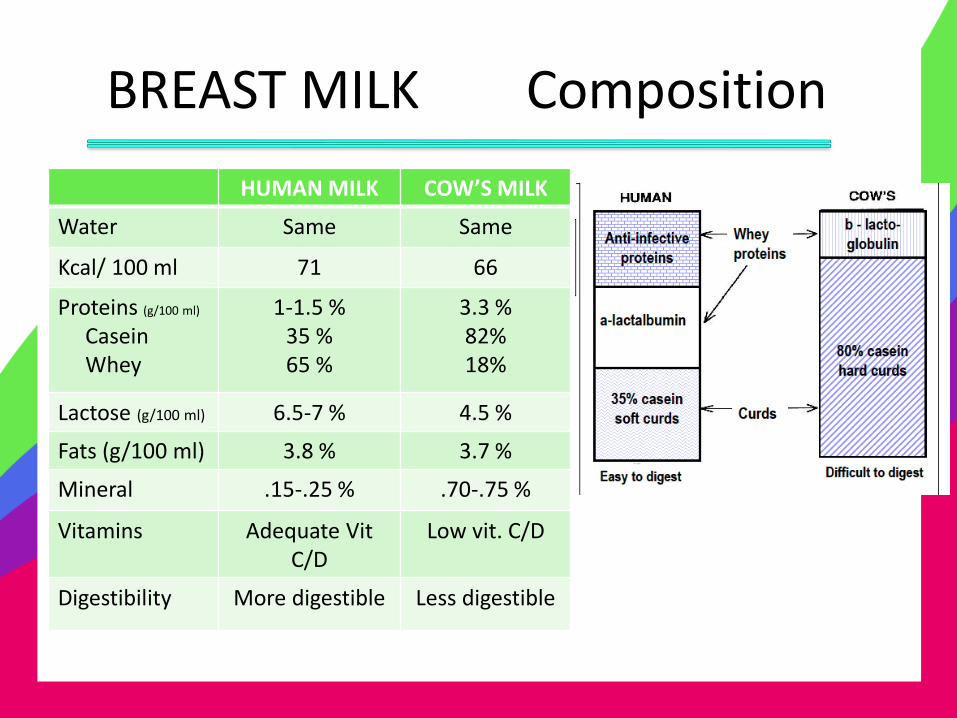
BREAST MILK Composition
HUMAN MILK COW’S MILK
Water Same Same
Kcal/ 100 ml 71 66
Proteins (g/100 ml)
Casein Whey
1-1.5 % 35 % 65 %
3.3 % 82% 18%
Lactose (g/100 ml) 6.5-7 % 4.5 %
Fats (g/100 ml) 3.8 % 3.7 %
Mineral .15-.25 % .70-.75 %
Vitamins Adequate Vit C/D
Low vit. C/D
Digestibility More digestible Less digestible
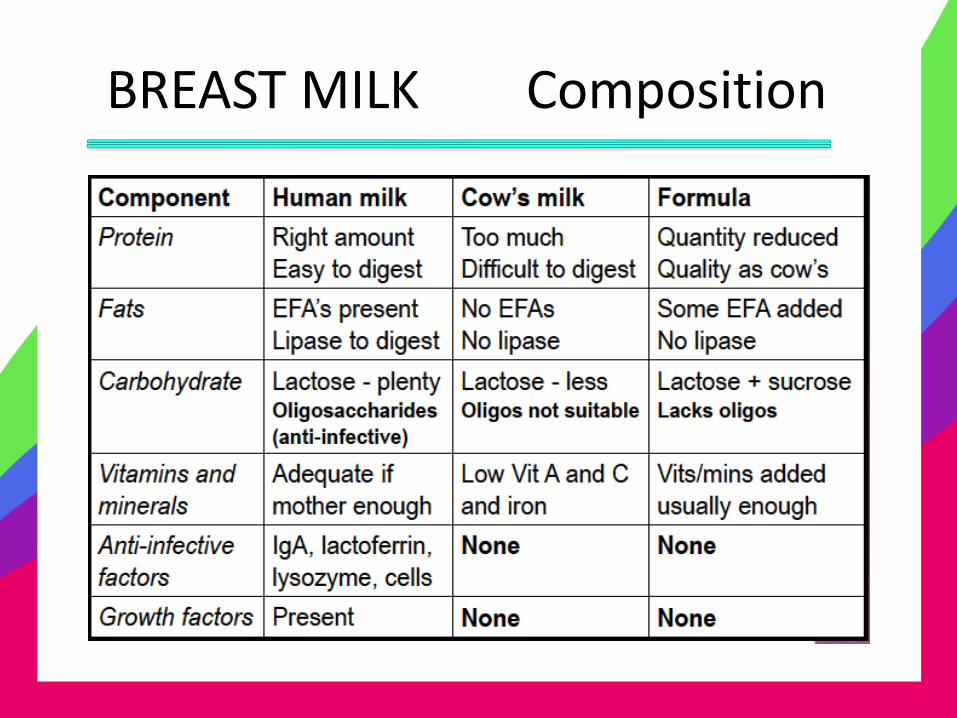
BREAST MILK Composition
BREAST MILK Attributes
INFANT
• Bacteriologically safe
• Always fresh and ready to go
• Contributes to maturation of GIT
• Reduces risk of food allergies
• Establishes habit of eating in moderation
• Contributes to proper development of jaws and teeth
• Decreases ear infections
• Facilitates bonding with mother
BREAST MILK Attributes
• Proper quality and quantity of nutrients
• Anti-infective properties are universally effective
• Prevents hypersensitivity or allergy
• Psychological advantages
• Contraceptive effects
• Safe, convenient, and always available
• Lack of motivation and preparation
• Aesthetic reasons
• Working mothers
• Fear of pain
• Anxiety
• Chronic diseases
• Intake of medications
BREAST MILK Unsuccessful

Thanks you for listening.