1
Introduction Unusual road cracks and several road patches exist on a circle road located in north of Austin. A google map of the area shows the peculiar geometry of the cracks and some of the asphalt patches. The first question comes to mind is that what is causing the cracks and the second is if their existence somewhat related to the road patches. A chat with a neighbor indicated that the cracks have been there as long as she remembers (~20 years), and the patches on the road were due to the “sinkhole repairs.” The last repair, according to the neighbor, was approximately done two years ago. This circle road and its vicinity is located in the geological formation of the Austin Chalk. . Geophysical Surveys-Field Survey Design To determine what is causing the cracks and/or to understand the extent of the sinkhole(s), resistivity, natural potential (NP) and ground penetrating radar (GPR) surveys were performed at the study area. First, as a reconnaissance work, I collected NP data along the either side of the front yards of the houses encircling the road (see blue lines). The station spacing was held 10 feet but where anomalous NP values are observed, the data was collected with a tighter spacing of 5 feet . The total number of the NP data point was 58. I collected the NP data after a reasonable good rain in the vicinity of the site. And all the NP values were tied to a near-by base station, and diurnally corrected. The NP unit is measured in miliVolt (mV). The rule of the thumb in the NP interpretation is that sinkholes create negative whereas caves filled with air form positive NP anomalies. Secondly, I performed GPR surveys along the road crossing the asphalt patches on the road. North-south GPR profiles of G1 and G2 are shown with a yellow colored line. Note that I did run few E-W GPR lines on the road; however, they did not indicate any significant anomalies. For this reason, I will not discuss the results from the E-W profiles. Lengths of the both profiles were 200 feet. The depth of exploration with the GPR survey was about 8 feet. Finally, based on the NP results, I chose two resistivity locations and collected resistivity data along the lines L1 and L2. These profiles are shown with a red colored line. The location of the profile R1 was chosen along NP values that did not show any anomaly whereas the location of the profile R2 showed extremely significant NP values. Although I wanted to collect two more resistivity profiles across some negative NP anomalies but it was not possible logistically due to moving traffic in and out of drive ways. Interpretation of GPR Data Front Yard Geophysics in Northern Austin: Are the Presence of Karstic Features Underestimated in Austin Chalk? Mustafa Saribudak Environmental Geophysics Associates, Austin, Texas For further information Please contact [email protected] for more information on this project and related karstic projects over the Edwards Aquifer. More information can be obtained at www.egatx.com. Interpretation of NP Data All the NP data collected along the front yards of the houses across the study area are plotted on a site map and is shown below. The NP data points are shown with a red/yellow circle and the NP values are shown with white numbers. The NP map indicates zero and/or background values in the south-eastern part of the site. Negative values appear to show further west on either side of the front yards. However, a very significant positive NP anomaly (~115 mV) is observed on the eastern flank of a front yard where the street makes a turn to the north. Site map showing presence of unusual fractures and repair patches (red/yellow stars) on the road. Patches were due to sinkhole repairs. Two GPR profiles (G1 and G2) were processed and interpreted below. First pair of the profiles are chosen between stations zero (0) and 25 feet where both data sets indicate subsiding subsurface soil layers. Locations of these subsidence anomalies are correlative with the locations of the repair patches in the northern part of the site. Site N NP Resistivity Repair patches L1 L2 GPR G1 G2 N Geology map of the Austin area showing the study area in the Austin Chalk. Site map showing the NP (blue ), resistivity (red ) and GPR (yellow ) profiles. Geology The Austin Chalk is an upper Cretaceous geologic formation in the Coast region of the United States. It is named after type section outcrops near Austin, Texas. The Austin Chalk consists of recrystalized, fossiliferous, interbedded chalks and marls. The Austin Chalk crops out in a wide belt almost through the center of the City of Austin, extending from south of Onion Creek all the way past Pflugerville. Interstate Highway 35 is constructed on the high ground that represents the Austin Chalk escarpment. The study area is shown with a red/yellow star on the geological map of Austin. -1 -2 -4 -3 --5 -7 -10 -14 -11 -11 -15 -13 -1 3 -18 -22 -22 -17 -15 -11 -5 -3 -5 1 3 -5 -3 0 0 0 0 -4 -6 -6 -12 -16 -16 -23 -15 -13 -13 -12 -6 -1 3 6 13 39 115 102 44 10 6 7 10 9 6 L2 N L1 Interpretation of Resistivity and NP Data The resistivity imaging and NP data taken along line L1 are shown below. The resistivity profile indicate horizontal layers of resistivity ranging between 20 and 200 Ohm-meter, which correspond to marl and limestone units, respectively. The NP data also show no significant anomalies along the profile. RESISTIVITY DATA ALONG L1 NP DATA ALONG L1 mV Feet W E The resistivity imaging and NP data taken along profile L2 are given below. The resistivity data show a significant subsidence between stations 20 and 50 feet. The resistivity layers range between 7 and 180 Ohm-meter, which may be indicative of clay and weathered limestone. The NP data also indicate a quite significant NP anomaly (positive) over the resistivity anomaly. mV Ft N S S u b s i d e n c e NP Anomaly Resistivity data along L2 NP data along L2 0 2 5 Ft 0 25 Ft N S Ft Ft Subsidence S u b s I d e n c e Void GPR Data on Profile G1 GPR Data on Profile G2 Ft Subsidence Second pair of the GPR profiles are chosen between stations 175 and 200 feet where both data sets indicate subsiding subsurface soil layers. Locations of these subsidence GPR anomalies are correlative with the locations of the repair patches in the southern part of the site. 175 200 Ft N S F t Ft Subsidence Subsidence GPR Data on Profile G1 GPR Data on Profile G2 Conclusions Areas of negative NP (yellow-dashed line), positive NP (white-dashed line) are approximately defined on a site map below. The significant high NP anomaly location and resistivity anomaly indicating subsidence are also shown with a green circle on the eastern part of the circled road. Road repair patches Area with positive NP Area with negative NP Locations of GPR anomalies are shown with blue lines and their subsidence directions with white arrows. In conclusions. presence of all these geophysical anomalies indicate subsidence, sinkholes and caves in the subsurface and their N and their tectonic interactions could be responsible for the peculiar geometry of the surface fractures that is present at the site. Into a cave Horizontal marl and limestone layers of Austin Chalk Source of this NP anomaly is likely due to a cave Area with positive NP values Area with negative NP values Cave location Subsidence direction defined by GPR

Front Yard Geophysics

Embed Size (px)

Citation preview

IntroductionUnusual road cracks and several road patches exist on a circle road located in north of Austin. A google map of the area shows the peculiar geometry of the cracks and some of the asphalt patches. The first question comes to mind is that what is causing the cracks and the second is if their existence somewhat related to the road patches.

A chat with a neighbor indicated that the cracks have been there as long as she remembers (~20 years), and the patches on the road were due to the “sinkhole repairs.” The last repair, according to the neighbor, was approximately done two years ago. This circle road and its vicinity is located in the geological formation of the Austin Chalk.

.

Geophysical Surveys-Field Survey DesignTo determine what is causing the cracks and/or to understand the extent of the sinkhole(s), resistivity, natural potential (NP) and ground penetrating radar (GPR) surveys were performed at the study area.

First, as a reconnaissance work, I collected NP data along the either side of the front yards of the houses encircling the road (see blue lines). The station spacing was held 10 feet but where anomalous NP values are observed, the data was collected with a tighter spacing of 5 feet . The total number of the NP data point was 58. I collected the NP data after a reasonable good rain in the vicinity of the site. And all the NP values were tied to a near-by base station, and diurnally corrected. The NP unit is measured in miliVolt (mV). The rule of the thumb in the NP interpretation is that sinkholes create negative whereas caves filled with air form positive NP anomalies.

Secondly, I performed GPR surveys along the road crossing the asphalt patches on the road. North-south GPR profiles of G1 and G2 are shown with a yellow colored line. Note that I did run few E-W GPR lines on the road; however, they did not indicate any significant anomalies. For this reason, I will not discuss the results from the E-W profiles. Lengths of the both profiles were 200 feet. The depth of exploration with the GPR survey was about 8 feet.

Finally, based on the NP results, I chose two resistivity locations and collected resistivity data along the lines L1 and L2. These profiles are shown with a red colored line. The location of the profile R1 was chosen along NP values that did not show any anomaly whereas the location of the profile R2 showed extremely significant NP values. Although I wanted to collect two more resistivity profiles across some negative NP anomalies but it was not possible logistically due to moving traffic in and out of drive ways.

Interpretation of GPR Data

Front Yard Geophysics in Northern Austin: Are the Presence of Karstic Features Underestimated in Austin Chalk? Mustafa SaribudakEnvironmental Geophysics Associates, Austin, Texas  


For further informationPlease contact [email protected] for more information on this project and related karstic projects over the Edwards Aquifer. More information can be obtained at www.egatx.com.

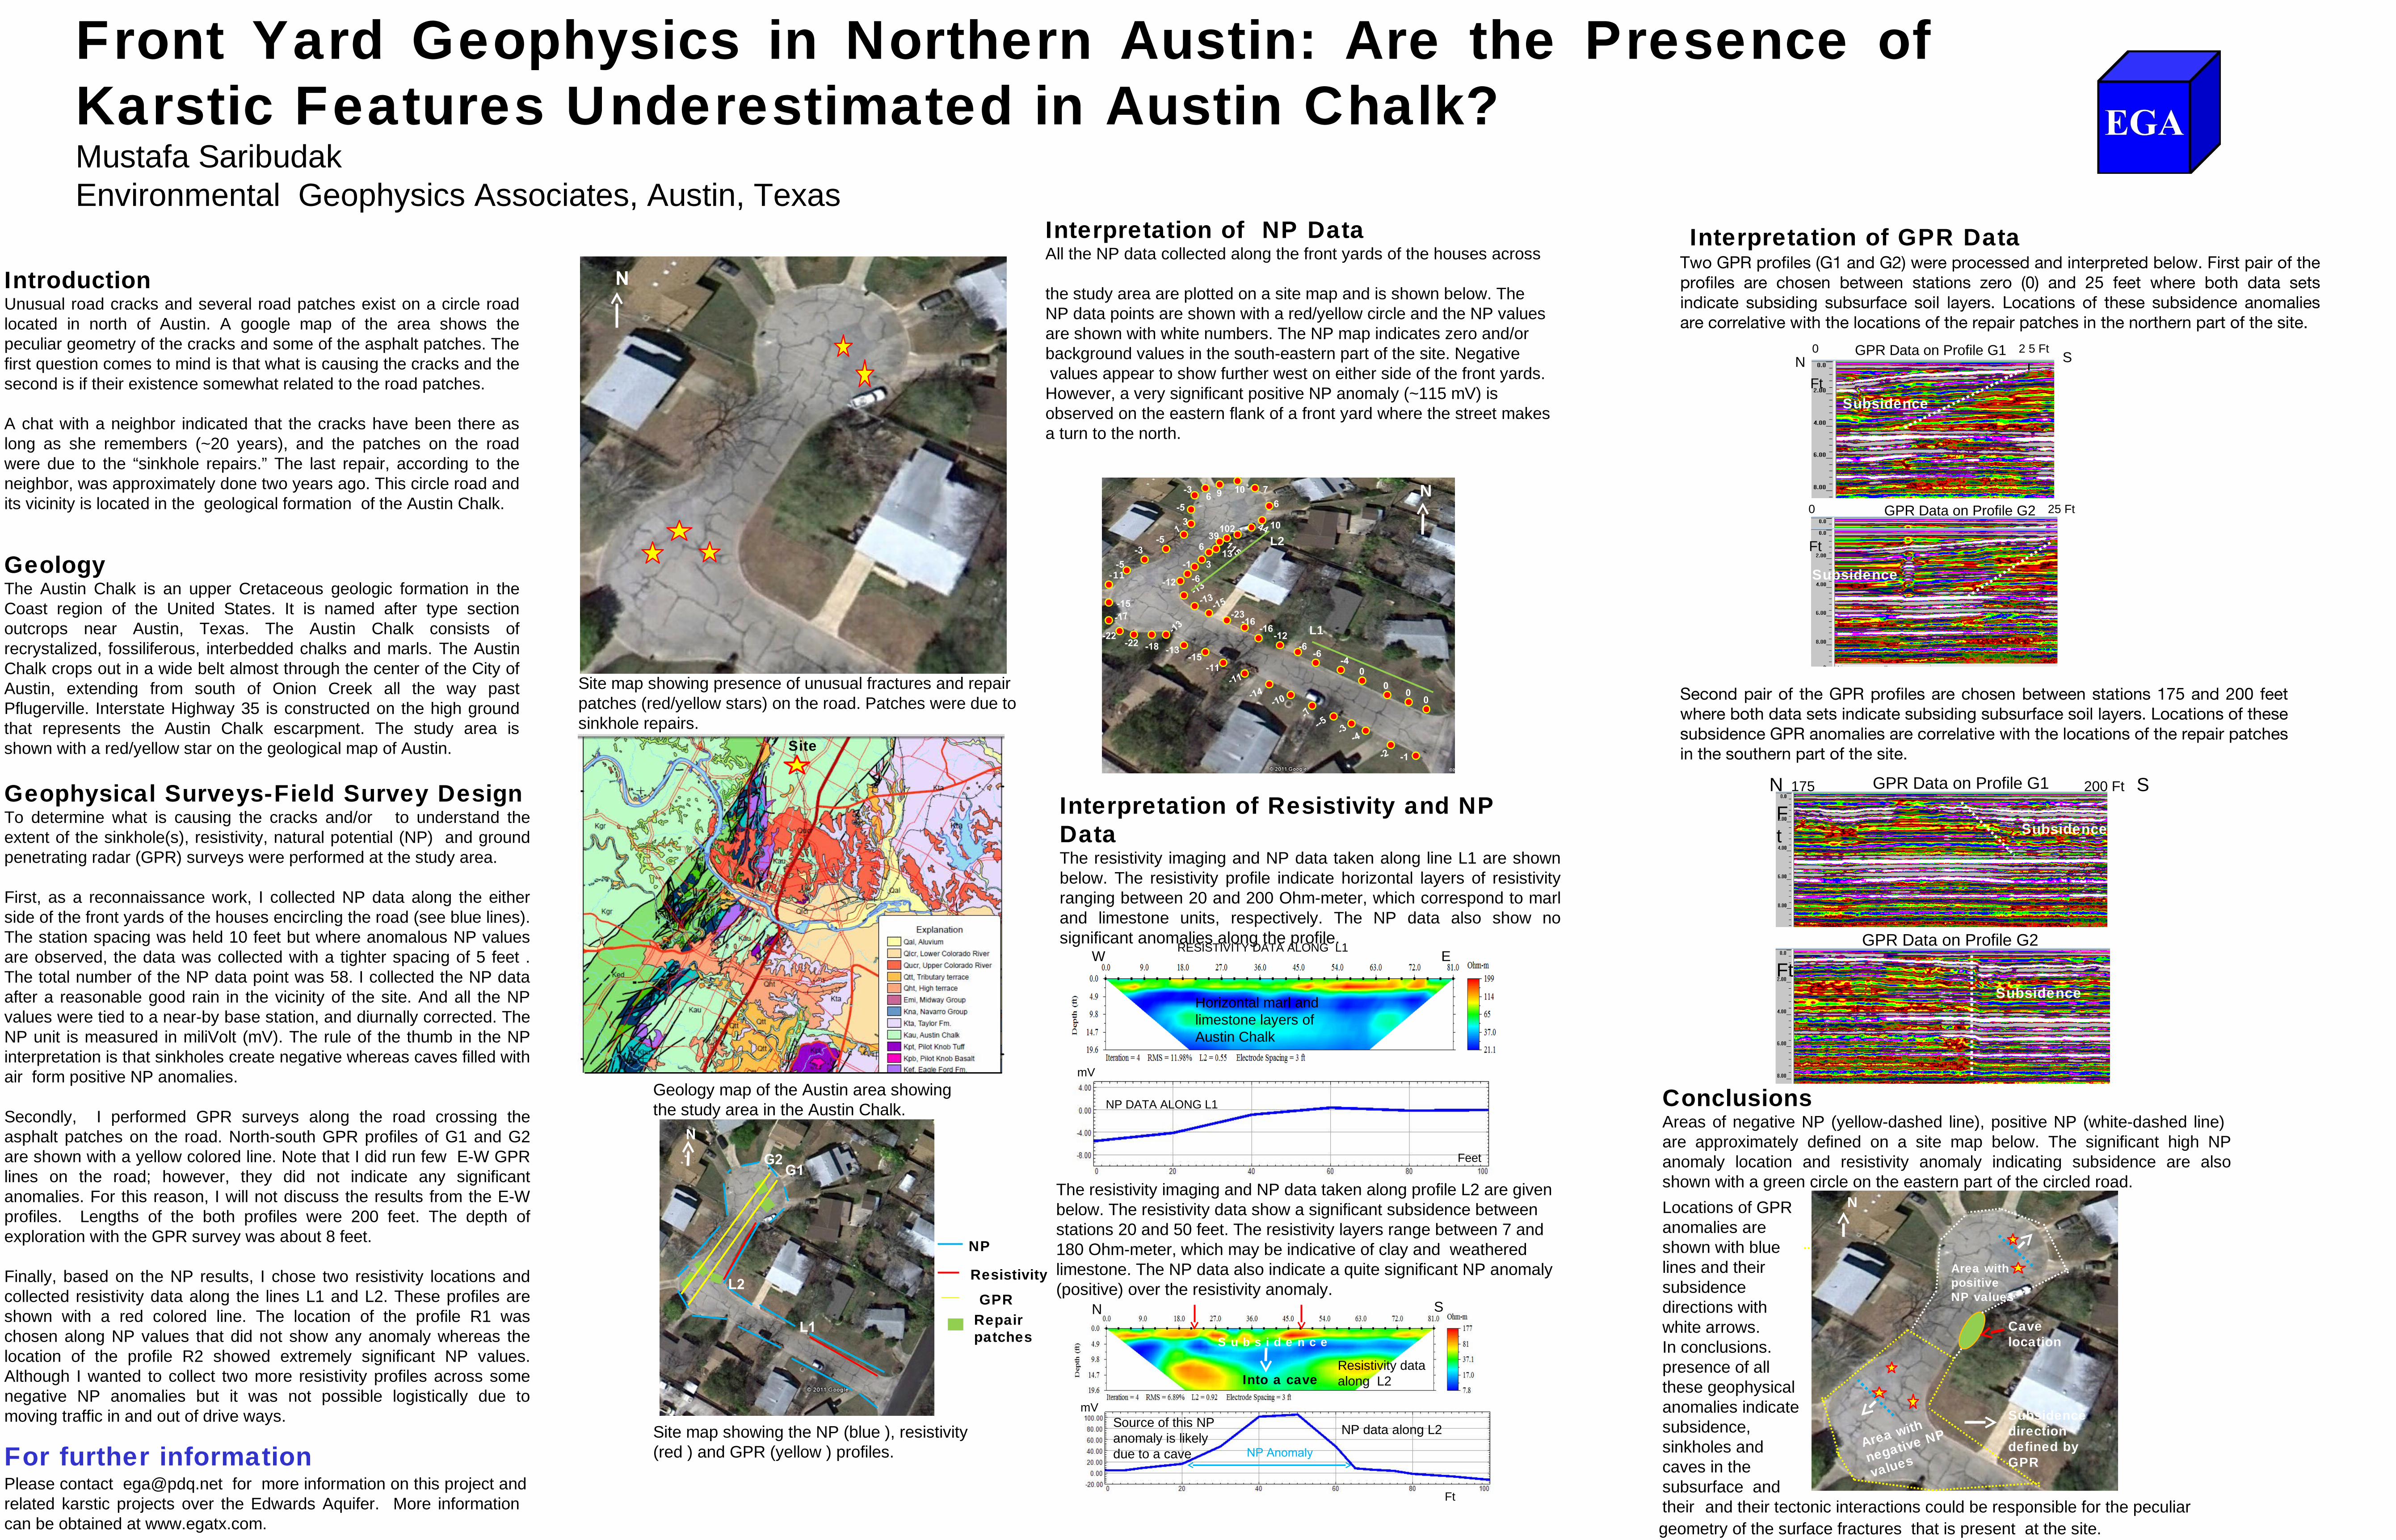
Interpretation of NP DataAll the NP data collected along the front yards of the houses across

the study area are plotted on a site map and is shown below. The NP data points are shown with a red/yellow circle and the NP values are shown with white numbers. The NP map indicates zero and/or background values in the south-eastern part of the site. Negative values appear to show further west on either side of the front yards. However, a very significant positive NP anomaly (~115 mV) is observed on the eastern flank of a front yard where the street makes a turn to the north.

Site map showing presence of unusual fractures and repair patches (red/yellow stars) on the road. Patches were due to sinkhole repairs.

Two GPR profiles (G1 and G2) were processed and interpreted below. First pair of the profiles are chosen between stations zero (0) and 25 feet where both data sets indicate subsiding subsurface soil layers. Locations of these subsidence anomalies are correlative with the locations of the repair patches in the northern part of the site.

Site

N

NP

Resistivity

Repair patches

L1

L2 GPR

G1G2

N

Geology map of the Austin area showing the study area in the Austin Chalk.

Site map showing the NP (blue ), resistivity (red ) and GPR (yellow ) profiles.

GeologyThe Austin Chalk is an upper Cretaceous geologic formation in the Coast region of the United States. It is named after type section outcrops near Austin, Texas. The Austin Chalk consists of recrystalized, fossiliferous, interbedded chalks and marls. The Austin Chalk crops out in a wide belt almost through the center of the City of Austin, extending from south of Onion Creek all the way past Pflugerville. Interstate Highway 35 is constructed on the high ground that represents the Austin Chalk escarpment. The study area is shown with a red/yellow star on the geological map of Austin.

-1-2 -4

-3--5

-7

-10 -14 -1

1-11

-15 -13

-13

-18 -22-22

-17-15

-11 -5

-3-5

1 3

-5

-3

00

0

0 -4

-6-6

-12-16

-16-23

-15-13-13 -12 -6

-1 3

6 13

39115

102 44 10

6

71096

L2

N

L1

Interpretation of Resistivity and NP DataThe resistivity imaging and NP data taken along line L1 are shown below. The resistivity profile indicate horizontal layers of resistivity ranging between 20 and 200 Ohm-meter, which correspond to marl and limestone units, respectively. The NP data also show no significant anomalies along the profile.

RESISTIVITY DATA ALONG L1

NP DATA ALONG L1

mV

Feet

W E

The resistivity imaging and NP data taken along profile L2 are given below. The resistivity data show a significant subsidence between stations 20 and 50 feet. The resistivity layers range between 7 and 180 Ohm-meter, which may be indicative of clay and weathered limestone. The NP data also indicate a quite significant NP anomaly (positive) over the resistivity anomaly.

mV

Ft

N S

S u b s i d e n c e

NP Anomaly

Resistivity data along L2

NP data along L2

0 2 5 Ft

0 25 Ft

N S

Ft

Ft

Subsidence

S u b s I d e n c e Void

GPR Data on Profile G1

GPR Data on Profile G2

Ft Subsidence

Second pair of the GPR profiles are chosen between stations 175 and 200 feet where both data sets indicate subsiding subsurface soil layers. Locations of these subsidence GPR anomalies are correlative with the locations of the repair patches in the southern part of the site.

175 200 FtN S

Ft

Ft

Subsidence

Subsidence

GPR Data on Profile G1

GPR Data on Profile G2

ConclusionsAreas of negative NP (yellow-dashed line), positive NP (white-dashed line) are approximately defined on a site map below. The significant high NP anomaly location and resistivity anomaly indicating subsidence are also shown with a green circle on the eastern part of the circled road.

Road repair patchesArea with positive NP Area with

negative NP

Locations of GPR anomalies are shown with blue lines and their subsidence directions with white arrows. In conclusions.presence of all these geophysical anomalies indicate subsidence, sinkholes and caves in the subsurface and their

N

and their tectonic interactions could be responsible for the peculiar geometry of the surface fractures that is present at the site.

Into a cave

Horizontal marl and limestone layers of Austin Chalk

Source of this NP anomaly is likely due to a cave

Area with positive NP values

Area with

negative NP

values

Cave location

Subsidence direction defined by GPR