Embed Size (px)
Citation preview

Taylor’s University | FNBE April 2014 | Basic Accounting (ACC 30205) | Financial Ratio Analysis
FOUNDATION IN NATURAL BUILT AND ENVIRONMENT
(FNBE)
Basic Accounting [ACC30205/FNBE0145]
Assignment: Financial Ratio Analysis – Cheetah (Domestic)
Group Members: Lee Ren Jet 0319058
Felix Vong Zhi Wei 0318462
Raymond Wah Yun Chen 0319115
Submission Date: Friday, 14/1/2014

Taylor’s University | FNBE April 2014 | Basic Accounting (ACC 30205) | Financial Ratio Analysis
A BRIEF BACKGROUND HISTORY OF CHEETAH
Cheetah was founded in 1977 and it was founded by the Chinese family. In
1972, Cheetah became famous as their products was launched towards the
market. During 1970s, sports apparel industry wasn’t as demanding as now
until Cheetah came in. Soon they decided to concentrate on its branding and
design, they also had expanded its brand portfolio with more brands for
different market, mainly towards casual life-style wear.
Their brand portfolio includes many different gender of casual life-style
wear like Cheetah Junior, Cheetah Ladies, C. Union, CTH Unlimited, C2 United,
CTH Ladies and Baby Cheetah. They also have an international brands like GQ
and Ladybird, which mainly focus towards mens’ business wear and children
wear.
After many years of their hard work and dedication, In 2005 they were
awarded the SUPERBRAND 2005 award. They are the first sportswear apparel
company to be recognized by the Award. Sooner and later, they were
recognized as one of Asia’s Top 200 Companies under US$1 billion in 2007 by a

Taylor’s University | FNBE April 2014 | Basic Accounting (ACC 30205) | Financial Ratio Analysis
famous magazine company called Forbes. They also received the Asia Pacific
Excellence Brand Award for the Excellence BRAND category in 2009 which
allows them to be so famous and trending in sport clothing’s for a couple of
years.
Cheetah was also listed on the2nd board of Bursa Malaysia as they decided
to turn their company into a public corporate company. It was listed under
Cheetah Holdings Berhad and in 2007 their listing has successfully listed to the
Main board of Bursa Malaysia.
Taylor’s University | FNBE April 2014 | Basic Accounting (ACC 30205) | Financial Ratio Analysis
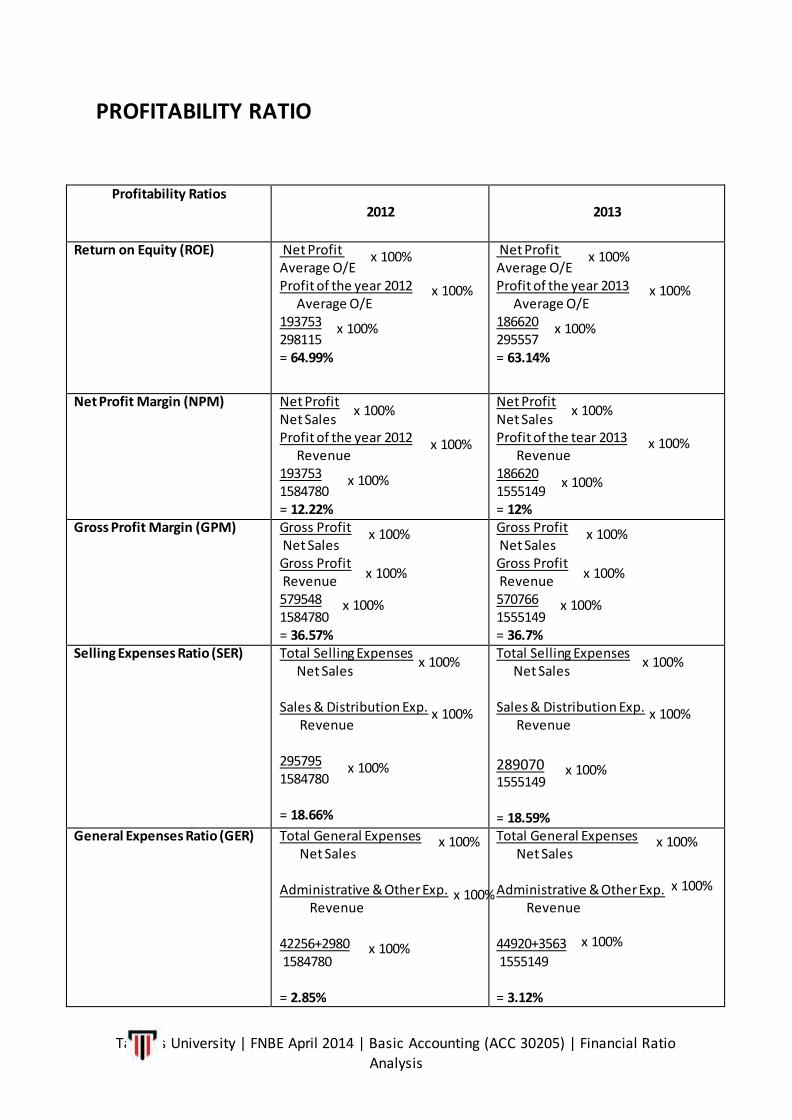
PROFITABILITY RATIO
Profitability Ratios
2012
2013
Return on Equity (ROE) Net Profit Average O/E Profit of the year 2012 Average O/E 193753 298115 = 64.99%
Net Profit Average O/E Profit of the year 2013 Average O/E 186620 295557 = 63.14%
Net Profit Margin (NPM) Net Profit Net Sales Profit of the year 2012 Revenue 193753 1584780 = 12.22%
Net Profit Net Sales Profit of the tear 2013 Revenue 186620 1555149 = 12%
Gross Profit Margin (GPM) Gross Profit Net Sales Gross Profit Revenue 579548 1584780 = 36.57%
Gross Profit Net Sales Gross Profit Revenue 570766 1555149 = 36.7%
Selling Expenses Ratio (SER) Total Selling Expenses Net Sales Sales & Distribution Exp. Revenue 295795 1584780 = 18.66%
Total Selling Expenses Net Sales Sales & Distribution Exp. Revenue
289070 1555149 = 18.59%
General Expenses Ratio (GER) Total General Expenses Net Sales Administrative & Other Exp. Revenue 42256+2980 1584780 = 2.85%
Total General Expenses Net Sales Administrative & Other Exp. Revenue 44920+3563 1555149 = 3.12%
x 100%
x 100%
x 100%
x 100%
x 100%
x 100%
x 100%
x 100%
x 100%
x 100%
x 100%
x 100%
x 100%
x 100%
x 100%
x 100%
x 100%
x 100%
x 100%
x 100%
x 100%
x 100%
x 100%
x 100%
x 100%
x 100%
x 100%
x 100%
x 100%
x 100%

Taylor’s University | FNBE April 2014 | Basic Accounting (ACC 30205) | Financial Ratio Analysis
PROFITABILITY
RATIOS
INTERPRETATION
Return on Equity (ROE)
During the year 2012-2013 period, the business Return of Equity (ROE) has
decreased from 64.99% to 63.14%. This means that Cheetah is getting slightly
less return from the capital than last year.
Net Profit Margin (NPM)
During the year 2012-2013 period, the business Net Profit Margin (NPM) has
decreased from 12.22% to 12%. This means that the business of is getting
worse at controlling its overall expenses.
Financial Expenses Ratio (GER) Total Financial Expenses Net Sales Finance Cost Revenue 4971 1584780 = 0.31%
Total Financial Expenses Net Sales Finance Cost Revenue 5318 1555149 = 0.34%
x 100%
x 100%
x 100%
x 100%
x 100%
x 100%
Taylor’s University | FNBE April 2014 | Basic Accounting (ACC 30205) | Financial Ratio Analysis
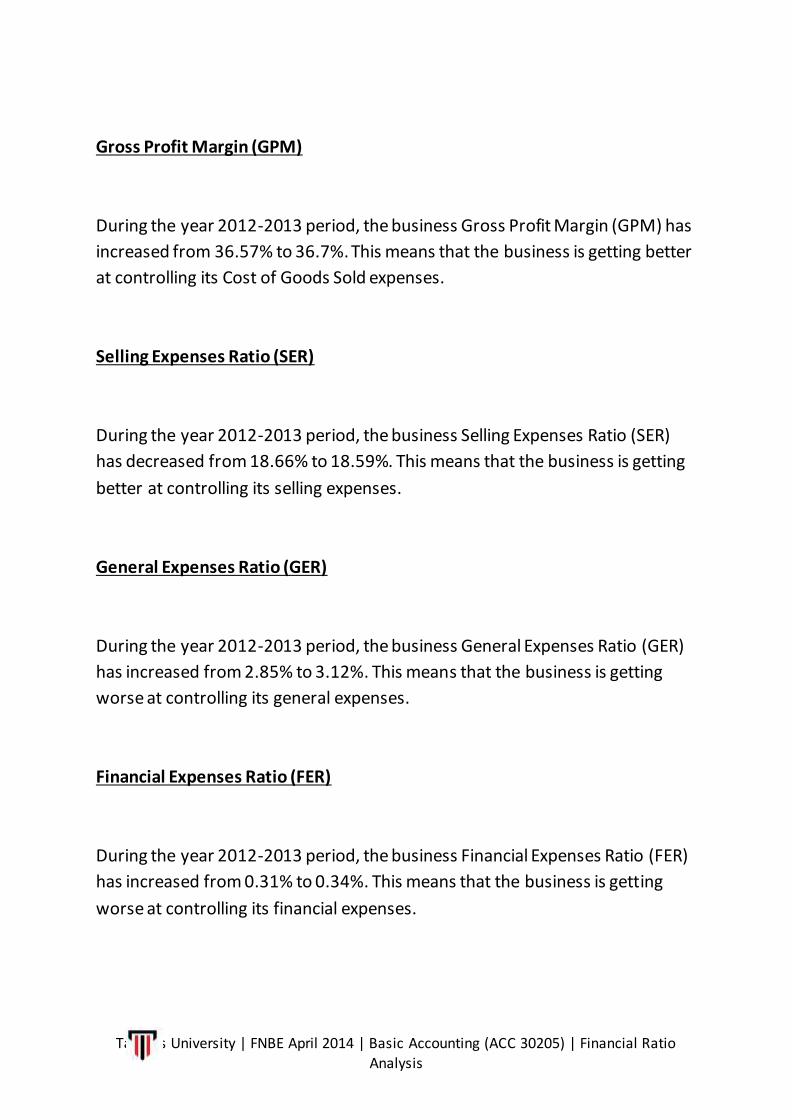
Gross Profit Margin (GPM)
During the year 2012-2013 period, the business Gross Profit Margin (GPM) has
increased from 36.57% to 36.7%. This means that the business is getting better
at controlling its Cost of Goods Sold expenses.
Selling Expenses Ratio (SER)
During the year 2012-2013 period, the business Selling Expenses Ratio (SER)
has decreased from 18.66% to 18.59%. This means that the business is getting
better at controlling its selling expenses.
General Expenses Ratio (GER)
During the year 2012-2013 period, the business General Expenses Ratio (GER)
has increased from 2.85% to 3.12%. This means that the business is getting
worse at controlling its general expenses.
Financial Expenses Ratio (FER)
During the year 2012-2013 period, the business Financial Expenses Ratio (FER)
has increased from 0.31% to 0.34%. This means that the business is getting
worse at controlling its financial expenses.
Taylor’s University | FNBE April 2014 | Basic Accounting (ACC 30205) | Financial Ratio Analysis
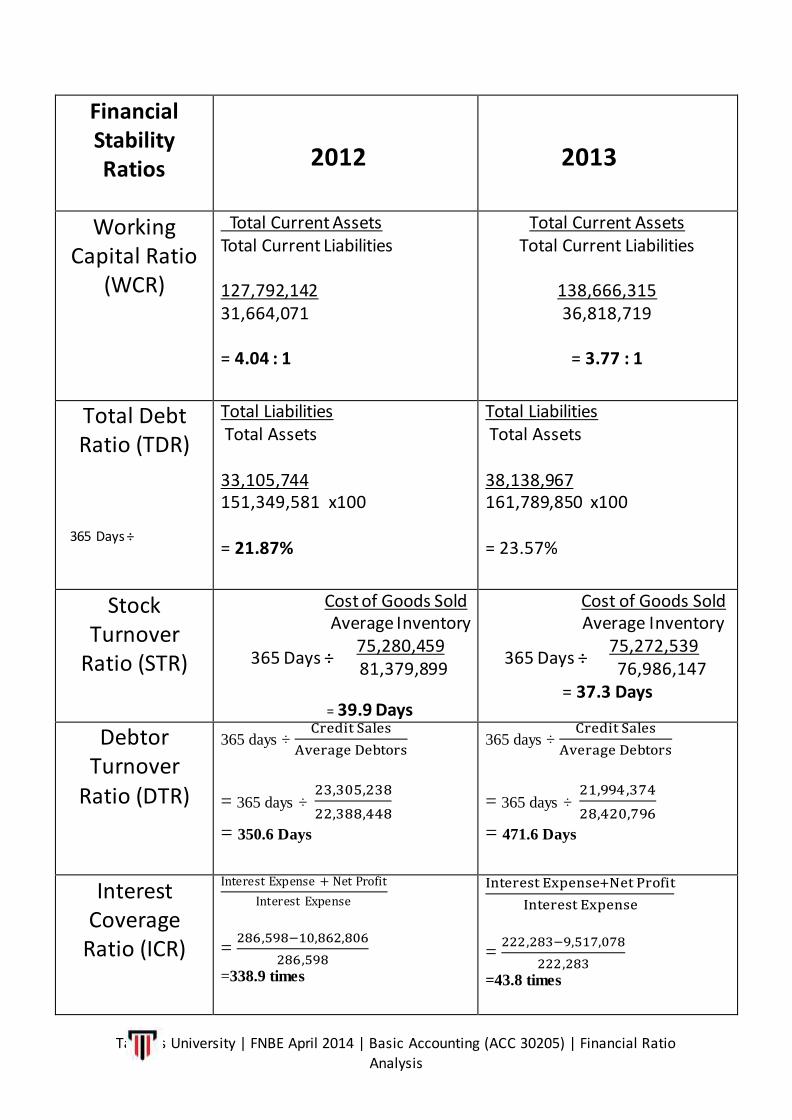
Financial Stability Ratios
2012
2013
Working Capital Ratio
(WCR)
Total Current Assets Total Current Liabilities 127,792,142 31,664,071 = 4.04 : 1
Total Current Assets Total Current Liabilities
138,666,315 36,818,719
= 3.77 : 1
Total Debt Ratio (TDR)
Total Liabilities Total Assets 33,105,744 151,349,581 x100 = 21.87%
Total Liabilities Total Assets 38,138,967 161,789,850 x100 = 23.57%
Stock Turnover
Ratio (STR)
Cost of Goods Sold Average Inventory 75,280,459 81,379,899
= 39.9 Days
Cost of Goods Sold Average Inventory
75,272,539 76,986,147
= 37.3 Days
Debtor Turnover
Ratio (DTR)
365 days ÷ Credit Sales
Average Debtors
= 365 days ÷ 23,305,238
22,388,448
= 350.6 Days
365 days ÷ Credit Sales
Average Debtors
= 365 days ÷ 21,994,374
28,420,796
= 471.6 Days
Interest
Coverage Ratio (ICR)
Interest Expense + Net Profit
Interest Expense
= 286,598−10,862,806
286,598
=338.9 times
Interest Expense+Net Profit
Interest Expense
= 222,283−9,517,078
222,283
=43.8 times
365 Days ÷
365 Days ÷
365 Days ÷

Taylor’s University | FNBE April 2014 | Basic Accounting (ACC 30205) | Financial Ratio Analysis
STABILITY RATIOS
Working Capital Ratio (WCR) During the year 2012-2013 period, the business Working Capital Ratio (WCR)
has decreased from 4.04 : 1 to 3.77 : 1. This means that the business ability to pay its current liabilities is getting worse. In addition, it does not satisfied the
minimum requirement of 2 : 1.
Total Debt Ratio (TDR)
During the year 2012-2013 period, the business Total Debt Ratio (TDR) has increased from 21.87% to 23.57%. This means that the business total debt has
increased. In addition, it is still over the maximum limit 50%.
Stock Turnover Ratio (STR)
During the year 2012-2013 period, the business Stock Turnover Ratio (STR) has decreased from 39.9 days to 37.3 days. This means that the business is getting
faster at selling their goods.
Debtor Turnover Ratio (DTR)
During the year 2012-2013 period, the business Debtor Turnover ratio (DTR) has increased from 350 days to 471.6 days. This means that the business is
getting slower in collecting its debts.
Interest Coverage Ratio (ICR)
During the year 2012-2013 period, the business Interest Coverage Ratio (ICR) has increased from 38.9 times to 43.8 times. This means that the business ability
to pay its interest is getting worse. In addition, it does not satisfied the minimum requirement of 5 times.

Taylor’s University | FNBE April 2014 | Basic Accounting (ACC 30205) | Financial Ratio Analysis
RECENT DEVELOPMENT
In 2009, Cheetah has fully centralized their company. They
company operation consists of designing, warehousing,
marketing and distribution. They also upgraded their
company into a new 100000sq ft building where the
management can oversees every department.
Recently in 2013, Local Apparel Cheetah Holdings’ net profit
has fall 27%. From rm2.82 million to rm2.05 million. They
also scrap the dividend policy by not paying 30% of its net
profit from this financial year, so that they can save their
funds and use it in business opportunities such as
promotional activities and events.
After a year has passed, they had decided to target 15%
revenue growth. They had confirmed that they will be
making a promotion to clear off their stocks so that they
could get back their cash. Besides doing promotion, they will
be upgrading their clothing as well, better materials,
attractive designs and etc.

Taylor’s University | FNBE April 2014 | Basic Accounting (ACC 30205) | Financial Ratio Analysis
PE RATIO
P/E ratio = 𝐂𝐮𝐫𝐫𝐞𝐧𝐭 𝐬𝐡𝐚𝐫𝐞 𝐩𝐫𝐢𝐜𝐞
𝐄𝐚𝐫𝐧𝐢𝐧𝐠𝐬 𝐩𝐞𝐫 𝐬𝐡𝐚𝐫𝐞
= 𝟎.𝟒𝟗
𝟎.𝟎𝟕
= 7
A P/E of 7 means that an investor of The
Cheetah Company will need to wait for 7
years to recoup his investment. In this case,
the P/E ratio of Cheetah is lower than what a
conservative buyer would pay, which is 15. It
is also consider fast too because investor can
reclaim back his original principal in 7 years
time.

Taylor’s University | FNBE April 2014 | Basic Accounting (ACC 30205) | Financial Ratio Analysis
Investment Recommendation
Based on our opinion, we would not recommend that Cheetah
Company is worth the time investing. Even though Cheetah Company
has shown really cheap share price, their profitability and stability
rate is really weak.
Base on the Profitability Ratio on top of this page, their Return on
Equity has decreased as thier business is getting less return from his
capital. Although their Selling Expenses Ratio (SER) and Gross Profit
Margin (GPM) are getting better in their expenses, their General
Expenses Ratio (GER) and Financial Expenses Ratio (FER) are really
bad at controlling the expenses which also affects their overall
expenses(NET PROFIT MARGIN). In conclusion, their company isn’t
profitable at all.
As for their stability ratio, their company is bad in paying its current
liabilities because their Working Capital Ratio (WCR) is decreasing
and they didn’t even reach the requirement of 2:1. Inventory
Turnover Ratio has shown that they are fast in selling their goods but
their debts have increased and their business is also slow in
collecting its debts. In this case, their stability is really weak.

Taylor’s University | FNBE April 2014 | Basic Accounting (ACC 30205) | Financial Ratio Analysis
Last but not least, even though their share price ratio is 7, I wouldn’t
recommend that Cheetah Company is worth investing because their
company’s progress is getting really weak and unprofitable.
REFERENCE
1. Cheetah Holdings Bhd - 7209(CHEETAH). (n.d.). Retrieved January 16,
2015, from http://www.bursawave.com/stock-search/stock/cheetah-
holdings-bhd-2064/
2. Cheetah targets 15% revenue growth | theSundaily. (n.d.). Retrieved
January 16, 2015, from http://www.thesundaily.my/news/1232761
3. CHEETAH HOLDINGS BHD. (n.d.). Retrieved January 16, 2015, from
http://finance.yahoo.com/q?s=7209.KL&ql=0
4. Cheetah. (n.d.). Retrieved January 16, 2015, from http://cheetah-
online.com/index.php?option=com_content&view=frontpage&Itemid=1
5. Stocks | The Star Online. (n.d.). Retrieved January 16, 2015, from
http://www.thestar.com.my/Business/Marketwatch/Stocks/?qcounter=
CHEETAH
6. Cheetah scraps dividend policy | theSundaily. (n.d.). Retrieved January
16, 2015, from http://www.thesundaily.my/news/816734

Taylor’s University | FNBE April 2014 | Basic Accounting (ACC 30205) | Financial Ratio Analysis
APPENDIX

Taylor’s University | FNBE April 2014 | Basic Accounting (ACC 30205) | Financial Ratio Analysis

Taylor’s University | FNBE April 2014 | Basic Accounting (ACC 30205) | Financial Ratio Analysis

Taylor’s University | FNBE April 2014 | Basic Accounting (ACC 30205) | Financial Ratio Analysis

Taylor’s University | FNBE April 2014 | Basic Accounting (ACC 30205) | Financial Ratio Analysis

Taylor’s University | FNBE April 2014 | Basic Accounting (ACC 30205) | Financial Ratio Analysis